4.3 air quality - california public utilities commission · 2010-01-06 · 4. environmental...
TRANSCRIPT

4. Environmental Analysis
Devers-Mirage 115 kV Subtransmission System Split Project 4.3-1 ESA / 207059 (A.08-01-029) Draft Environmental Impact Report January 2010
4.3 Air Quality This section evaluates the potential for the Proposed Project, as well as the alternatives, to impact regional and local air quality and generate significant quantities of greenhouse gas emissions from stationary and mobile sources of air emissions during construction and operational activities. This section is based on a review of existing documentation of air quality conditions in the region, air quality regulations from the U.S. Environmental Protection Agency (USEPA), the California Air Resources Board (CARB), and the South Coast Air Quality Management District (SCAQMD).
4.3.1 Setting Air quality is a function of both the rate and location of pollutant emissions under the influence of meteorological conditions and topographic features that influence pollutant movement and dispersal. Atmospheric conditions such as wind speed, wind direction, atmospheric stability, and air temperature gradients interact with the physical features of the landscape to determine the movement and dispersal of air pollutants, which affects air quality.
Regional Topography, Meteorology, and Climate The potential for high pollutant concentrations to develop at a given location depends upon the quantity of pollutants emitted into the atmosphere in the surrounding area or upwind, and the ability of the atmosphere to disperse the air pollutants. The atmospheric pollution potential, as the term is used in this EIR, is independent of the location of emission sources and is instead a function of factors such as topography and meteorology.
The study area, which includes the Proposed Project and alternatives areas, is located in the Coachella Valley in Riverside County, California. The study area is in the Salton Sea Air Basin (SSAB), which is bounded by the San Jacinto Mountains to the west and by the Little San Bernardino Mountains to the east. The Pacific Subtropical High cell influences the SSAB during the summer by inhibiting cloud formation and encouraging daytime solar heating. The majority of moisture in the SSAB is a result of infrequent warm, moist, and unstable air masses from the south (Riverside County, 2003).
Warm winters, cool summers, small daily and seasonal temperature ranges, and high relative humidity are characteristic of the area nearest to the Pacific Ocean. With increasing distance east of the ocean, the maritime influence decreases. Areas that are well protected from the ocean, such as the study area, experience a more continental climate type with warmer summers, colder winters, greater daily and seasonal temperature ranges, and generally lower relative humidity (WRCC, 2009a).
The study area typically has average maximum and minimum winter (i.e., January) temperatures of 70 and 42 ºF, respectively, while average summer (i.e., July) maximum and minimum temperatures are 108 and 75 ºF, respectively. Precipitation in the study area averages approximately 5.4 inches per year (WRCC, 2009b).

4. Environmental Analysis Air Quality
Devers-Mirage 115 kV Subtransmission System Split Project 4.3-2 ESA / 207059 (A.08-01-029) Draft Environmental Impact Report January 2010
Existing Air Quality SCAQMD operates a regional monitoring network that measures the ambient concentrations of criteria pollutants. Existing levels of air quality in the study area can generally be inferred from ambient air quality measurements conducted by SCAQMD at its closest station. The closest station to the study area is the Palm Springs monitoring station, which is located south of Farrell Substation. The Palm Springs Monitoring Station measures ambient concentrations of ozone, nitrogen dioxide (NO2), carbon monoxide (CO), particulate matter equal to or less than 10 microns in diameter (PM10), and particulate matter less than 2.5 microns in diameter (PM2.5).
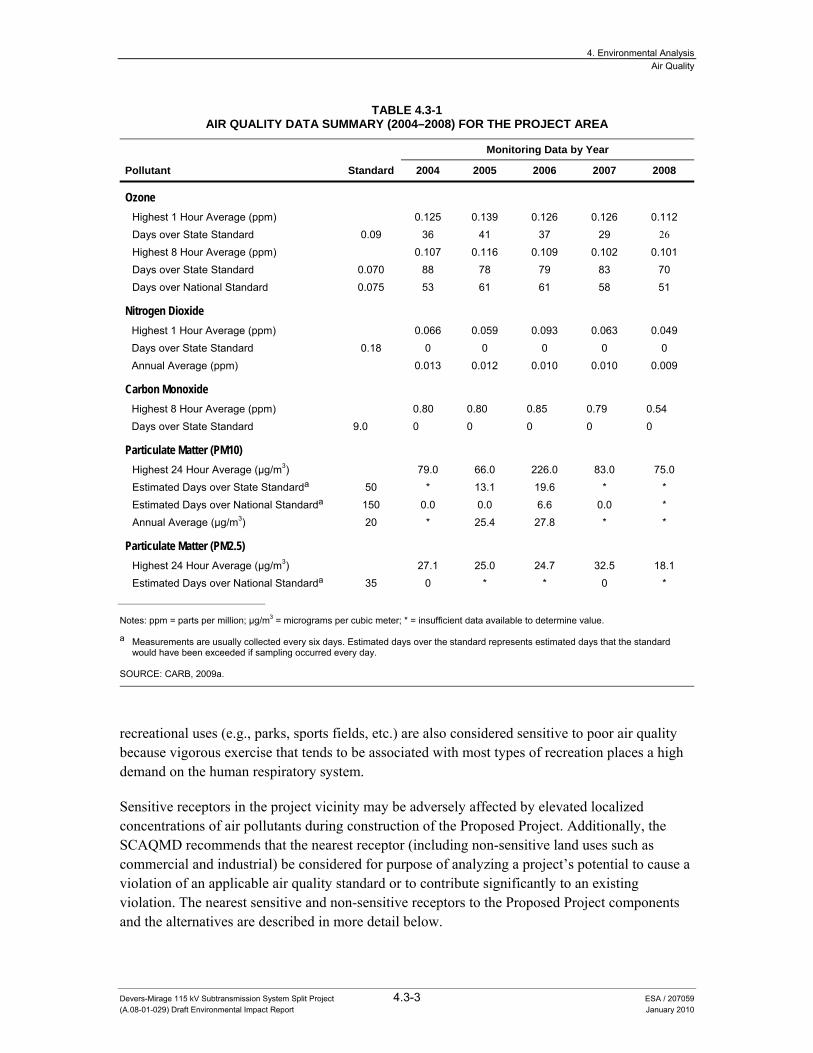
Background ambient concentrations of pollutants are determined by pollutant emissions in a given area as well as wind patterns and meteorological conditions for that area. As a result, background concentrations can vary among different locations within an area. However, areas located close together and exposed to similar wind conditions can be expected to have similar background pollutant concentrations. Table 4.3-1 shows a five-year (2004 – 2008) summary of ozone, NO2, CO, PM10, and PM2.5 monitoring data collected at the Palm Springs station. The data are compared with the California Ambient Air Quality Standards (CAAQS) and National Ambient Air Quality Standards (NAAQS).
As shown in the table, the State 1-hour ozone standard was exceeded between 26 and 41 times per year between 2004 and 2008. The State 8-hour ozone standard was exceeded between 70 and 88 times per year during the same time period while the national 8-hour ozone standard was exceeded between 51 and 61 times per year during the study period.
Between 2004 and 2008, the 24-hour State PM10 standard is estimated to have been exceeded approximately 13 to 20 times per year while the federal 24-hour PM10 standard is estimated to have been exceeded a total of approximately seven times over the five year period, all during 2006. For each of the two years which adequate data is available to determine annual average PM10 concentrations, the State standard of 20 μg/m3 was exceeded.
As indicated in the table, no violations of the applicable NO2, CO, or PM2.5 standards were recorded at the Palm Springs station during the five year study period.
Sensitive Receptors For the purposes of air quality and public health and safety, sensitive receptors are generally defined as land uses with population concentrations that would be particularly susceptible to disturbance from dust and air pollutant concentrations, or other disruptions associated with project construction and/or operation. The reasons for greater than average sensitivity include pre-existing health problems, proximity to emissions sources, and/or duration of exposure to air pollutants. Schools, hospitals, and convalescent homes are considered to be relatively sensitive to poor air quality because children, elderly people, and the infirm are more susceptible to respiratory distress and other air quality-related health problems than the general public. Residential areas are considered sensitive to poor air quality because people usually stay home for extended periods of time, which results in greater exposure to ambient air quality. Most
4. Environmental Analysis Air Quality
Devers-Mirage 115 kV Subtransmission System Split Project 4.3-3 ESA / 207059 (A.08-01-029) Draft Environmental Impact Report January 2010
TABLE 4.3-1 AIR QUALITY DATA SUMMARY (2004–2008) FOR THE PROJECT AREA
Pollutant Standard
Monitoring Data by Year
2004 2005 2006 2007 2008
Ozone Highest 1 Hour Average (ppm) 0.125 0.139 0.126 0.126 0.112 Days over State Standard 0.09 36 41 37 29 26
Highest 8 Hour Average (ppm) 0.107 0.116 0.109 0.102 0.101 Days over State Standard 0.070 88 78 79 83 70 Days over National Standard 0.075 53 61 61 58 51
Nitrogen Dioxide Highest 1 Hour Average (ppm) 0.066 0.059 0.093 0.063 0.049 Days over State Standard 0.18 0 0 0 0 0 Annual Average (ppm) 0.013 0.012 0.010 0.010 0.009
Carbon Monoxide Highest 8 Hour Average (ppm) 0.80 0.80 0.85 0.79 0.54 Days over State Standard 9.0 0 0 0 0 0
Particulate Matter (PM10) Highest 24 Hour Average (µg/m3) 79.0 66.0 226.0 83.0 75.0 Estimated Days over State Standarda 50 * 13.1 19.6 * * Estimated Days over National Standarda 150 0.0 0.0 6.6 0.0 * Annual Average (µg/m3) 20 * 25.4 27.8 * *
Particulate Matter (PM2.5) Highest 24 Hour Average (µg/m3) 27.1 25.0 24.7 32.5 18.1 Estimated Days over National Standarda 35 0 * * 0 *
Notes: ppm = parts per million; µg/m3 = micrograms per cubic meter; * = insufficient data available to determine value. a Measurements are usually collected every six days. Estimated days over the standard represents estimated days that the standard
would have been exceeded if sampling occurred every day. SOURCE: CARB, 2009a.
recreational uses (e.g., parks, sports fields, etc.) are also considered sensitive to poor air quality because vigorous exercise that tends to be associated with most types of recreation places a high demand on the human respiratory system.
Sensitive receptors in the project vicinity may be adversely affected by elevated localized concentrations of air pollutants during construction of the Proposed Project. Additionally, the SCAQMD recommends that the nearest receptor (including non-sensitive land uses such as commercial and industrial) be considered for purpose of analyzing a project’s potential to cause a violation of an applicable air quality standard or to contribute significantly to an existing violation. The nearest sensitive and non-sensitive receptors to the Proposed Project components and the alternatives are described in more detail below.

4. Environmental Analysis Air Quality
Devers-Mirage 115 kV Subtransmission System Split Project 4.3-4 ESA / 207059 (A.08-01-029) Draft Environmental Impact Report January 2010
Farrell – Garnet Study Area
Proposed Project Components The nearest sensitive receptors to the proposed Farrell-Garnet 115 kV alignment include a number of residences along Norloti Street to the west of North Gene Autry Trail, approximately 150 feet from the SCE right-of-way (ROW). The nearest non-sensitive receptor is approximately 80 feet west of the construction area at the northern end of the proposed Farrell-Garnet 115 kV alignment, next to Garnet Substation.
The nearest receptors to the proposed Varner/Date Palm reconfiguration are residences located over 5,000 feet southwest of the site, to the south of I-10. The nearest receptors to the Edom communication site include a number of residences located along Moon Ranch Road, over 4,800 feet from the site.
Substation upgrades in the Farrell-Garnet study area are proposed for Devers Substation, Garnet Substation, Farrell Substation, Thornhill Substation, and Eisenhower Substation. Table 4.3-2 identifies the nearest sensitive and non-sensitive receptors to each substation as well as the distance between the substation and receptor.
TABLE 4.3-2 RECEPTORS NEAR SUBSTATIONS IN THE FARRELL-GARNET STUDY AREA
Substation Distance to Nearest Receptor Receptor Description
Devers Sensitive 800 feet
Non-Sensitive 560 feet
Sensitive residence located along Diablo Road, south of 16th Avenue
Non-Sensitive buildings located at 16th Avenue and Diablo Road
Garnet Sensitive 4,800 feet
Non-Sensitive 80 feet
Sensitive residences located north of the substation along Indian Avenue
Non-Sensitive building to the west of the substation
Farrell Sensitive 160 feet
Non-Sensitive 80 feet
Sensitive residences to the west of the substation along Gene Autry Trail
Non-Sensitive building to the east of the substation
Thornhilla Sensitive 30 feet
Sensitive residences located directly adjacent to the substation property line
Eisenhower Sensitive 900 feet
Non-Sensitive 160 feet
Sensitive residences located west of the substation along East Mesquite Avenue Non-Sensitive
building located at the corner of East mesquite Avenue and South Gene Autry Trail.
a The nearest sensitive receptor also represents the nearest non-sensitive receptor.

4. Environmental Analysis Air Quality
Devers-Mirage 115 kV Subtransmission System Split Project 4.3-5 ESA / 207059 (A.08-01-029) Draft Environmental Impact Report January 2010
Alternative 2 The Alternative 2 alignment would begin at the Farrell Substation and run west along East Vista Chino for approximately 1.3 miles where it would turn and head north along North Sunrise Way. The alternative would continue north until reaching the existing SCE subtransmission line just south of Interstate 10. From here the alignment would continue in the existing SCE 115 kV ROW until reaching the Garnet Substation. The first 2.6 miles of the Alternative 2 alignment would pass directly adjacent to residential land uses along East Vista Chino and North Sunrise Way with the remainder crossing primarily open space and undeveloped land. In addition to residential uses, this alternative would pass within 200 feet of the Montessori Elementary School of Palm Springs and the Desert Son-Shine Preschool and Kindergarten, both of which are located near the corner of East Vista Chino and North Sunrise Way. Other schools within half a mile of the alternative include Raymond Cree Middle School, First School of the Desert Preschool-Childcare, and Coyote Run Head Start Preschool.
Alternative 3 Alterative 3 would begin at the Farrell Substation and run west along East Vista Chino for approximately 1.3 miles where it would turn and head north along North Sunrise Way for approximately one mile until reaching San Rafael Drive. At San Rafael Drive the alternative would turn west and continue for approximately one mile until reaching North Indian Canyon Drive where it would head north until reaching Garnet Substation. The first 3.8 miles of Alternative 3 would pass directly adjacent to residential land uses located along East Vista Chino, North Sunrise Way, San Rafael Drive, and North Indian Canyon Drive while the remainder of the alternative would cross primarily through open space and undeveloped land. Schools within half a mile of the alternative include Raymond Cree Middle School, First School of the Desert Preschool-Childcare, Vista Del Monte Elementary School, and Desert Highlands Head Start. Alternative 3 would also pass within 200 feet of the Montessori Elementary School of Palm Springs and the Desert Son-Shine Preschool and Kindergarten.
Alternative 6 Alternative 6 would begin at the Farrell Substation and head east along East Vista Chino for about 2.7 miles to Date Palm Drive. At Date Palm Drive the alternative would head north and follow the existing Devers-Eisenhower 115 kV subtransmission line to Varner Road. At Varner Road the line would tap into the existing Garnet-Santa Rosa 115 kV subtransmission line. Approximately two miles of the Alternative 6 alignment would cross directly adjacent to residents located along East Vista Chino while the remainder of the alignment would be located primarily in undeveloped land or open space. In addition to residential uses, the alignment would be located within half a mile of Rio Vista Elementary School.
Alternative 7 Alternative 7 would begin at the Farrell Substation and head east along East Vista Chino for about 1.7 miles to Landau Boulevard. The alternative alignment would continue south on Landau Boulevard for approximately 2.5 miles to 33rd Avenue where it would head east to Date Palm Drive then north on Date Palm Drive for approximately 2.5 miles to East Vista Chino. At East

4. Environmental Analysis Air Quality
Devers-Mirage 115 kV Subtransmission System Split Project 4.3-6 ESA / 207059 (A.08-01-029) Draft Environmental Impact Report January 2010
Vista Chino the line would follow the existing Devers-Eisenhower 115 kV subtransmission ROW to Varner Road. At Varner Road the line would loop into the existing Garnet-Santa Rosa 115 kV subtransmission line. Approximately seven miles of Alternative 7 would cross directly adjacent to residents along East Vista Chino, Landau Boulevard, 33rd Avenue, and Date Palm Drive. In addition to residents, the line would be located directly adjacent to Landau Elementary School and Mount San Jacinto High School. The alternative would also be located within half a mile of Rio Vista Elementary School and Sunny Sands Elementary School.
Mirage – Santa Rosa Study Area
Proposed Project Components The nearest residential property lines to the proposed Devers–Coachella 220 kV Loop-In are located approximately 160 feet west of the corridor along Vista de Oro. However, the nearest residential structure is located approximately 250 feet west of the corridor. The nearest non-sensitive receptor is located approximately 80 feet west of SCE ROW along Vista de Oro north of La Cita.
There are a number of residences directly west of the proposed Mirage-Santa Rosa subtransmission line alignment along Bell Road between Calle Desierto and Calle Tosca. These residences are located approximately 100 feet from the SCE ROW.
Existing lines in the Mirage – Santa Rosa study area would be reconfigured at the intersection of Portola Avenue and Gerald Ford Drive and at the intersection of Dinah Shore and Bob Hope Drive. The nearest receptors to the intersection of Portola Avenue and Gerald Ford Drive include a number of residences located along Portola Avenue approximately 300 feet south of Gerald Ford Drive. The nearest receptor to the intersection of Dinah Shore Drive and Bob Hope Drive include a number of residences located within 50 feet southwest of the intersection.
Substation upgrades in the Mirage-Santa Rosa study area are proposed for the Mirage Substation, Tamarisk Substation, Santa Rosa Substation, Concho Substation, and Indian Wells Substation. The nearest sensitive receptors to each of these substations are identified in Table 4.3-3.
Alternative 5 The Alternative 5 alignment is approximately two miles, 1.2 miles of which passes directly adjacent to existing residential land uses along Ramon Road, Monterey Avenue, and Varner Road.
Regulatory Context Air quality within the air SSAB is addressed through the efforts of various federal, State, and regional government agencies. These agencies work jointly, as well as individually, to improve air quality through legislation, regulations, planning, policy-making, education, and a variety of programs. The air pollutants of concern and agencies primarily responsible for improving the air quality within the SSAB and the pertinent regulations are discussed below.

4. Environmental Analysis Air Quality
Devers-Mirage 115 kV Subtransmission System Split Project 4.3-7 ESA / 207059 (A.08-01-029) Draft Environmental Impact Report January 2010
TABLE 4.3-3 RECEPTORS NEAR SUBSTATIONS IN THE MIRAGE-SANTA ROSA STUDY AREA
Substation Distance to Nearest Receptor Receptor Description
Mirage Sensitive 320 feet
Non-Sensitive 160 feet
Sensitive residential structures located west of the substation
Non-sensitive residential property lines and other structures to the west of the substation
Tamariska Sensitive 30 feet
Sensitive residences located directly adjacent to the substation property line
Santa Rosaa Sensitive 130 feet)
Sensitive residences located south of the substation along Don Quixote Drive
Concho Sensitive 190 feet
Non-Sensitive 60 feet
Sensitive residences north of the substation along Country Club Drive
Non-sensitive golf course club house located to the west of the substation
Indian Wellsa Sensitive 110 feet
Sensitive residences directly west of the substation along Orange Blossom Lane and Wildflower Lane
a The nearest sensitive receptor also represents the nearest receptor.
Criteria Air Pollutants Regulation of air pollution is achieved through both national and State ambient air quality standards and emission limits for individual sources of air pollutants. As required by the federal Clean Air Act, the USEPA has identified criteria pollutants and has established NAAQS to protect public health and welfare. NAAQS have been established for ozone, NO2, CO, sulfur dioxide (SO2), particulate matter (i.e., PM10, PM2.5), and lead. These pollutants are called “criteria” air pollutants because standards have been established for each of them to meet specific public health and welfare criteria.
To protect human health and the environment, the USEPA has set “primary” and “secondary” maximum ambient thresholds for all six criteria pollutants. Primary thresholds were set to protect human health, particularly sensitive receptors such as children, the elderly, and individuals suffering from chronic lung conditions such as asthma and emphysema. Secondary standards were set to protect the natural environment and prevent further deterioration of animals, crops, vegetation, and buildings.
The NAAQS are defined as the maximum acceptable concentration that may be reached, but not exceeded more than once per year. California has adopted more stringent ambient air quality standards (i.e., CAAQS) for most of the criteria air pollutants. Table 4.3-4 presents both sets of ambient air quality standards (i.e., national and State) and provides a brief discussion of the

4. Environmental Analysis Air Quality
Devers-Mirage 115kV Subtransmission System Split Project 4.3-8 ESA / 207059 (A.08-01-029) Draft Environmental Impact Report January 2010
TABLE 4.3-4 STATE AND NATIONAL CRITERIA AIR POLLUTANT STANDARDS, EFFECTS, AND SOURCES
Pollutant Averaging
Time State
Standard National Standard Pollutant Health and Atmospheric Effects Major Pollutant Sources
Ozone (O3) 1 Hour 8 Hour
0.090 ppm 0.070 ppm
– 0.075 ppm
High concentrations can directly affect lungs, causing irritation. Long-term exposure may cause damage to lung tissue.
Formed when ROG and NOx react in the presence of sunlight. Major sources include on-road motor vehicles, solvent evaporation, and commercial / industrial mobile equipment.
Carbon Monoxide (CO) 1 Hour 8 Hour
20 ppm 9.0 ppm
35 ppm 9 ppm
Classified as a chemical asphyxiant, CO interferes with the transfer of fresh oxygen to the blood and deprives sensitive tissues of oxygen.
Internal combustion engines, primarily gasoline-powered motor vehicles.
Nitrogen Dioxide (NO2) 1 Hour Annual
0.18 ppm 0.030 ppm
– 0.053 ppm
Irritating to eyes and respiratory tract. Colors atmosphere reddish-brown.
Motor vehicles, petroleum-refining operations, industrial sources, aircraft, ships, and railroads.
Sulfur Dioxide (SO2) 1 Hour 3 Hour
24 Hour Annual
0.25 ppm –
0.04 ppm –
– 0.5 ppm
0.14 ppm 0.03 ppm
Irritates upper respiratory tract; injurious to lung tissue. Can yellow the leaves of plants, destructive to marble, iron, and steel. Limits visibility and reduces sunlight.
Fuel combustion, chemical plants, sulfur recovery plants, and metal processing.
Respirable Particulate Matter (PM10)
24 Hour Annual
50 µg/m3 20 µg/m3
150 µg/m3
May irritate eyes and respiratory tract, decreases in lung capacity, cancer and increased mortality. Produces haze and limits visibility.
Dust and fume-producing industrial and agricultural operations, combustion, atmospheric photochemical reactions, and natural activities (e.g., wind-raised dust and ocean sprays).
Fine Particulate Matter (PM2.5)
24 Hour Annual
– 12 µg/m3
35 µg/m3 15.0 µg/m3
Increases respiratory disease, lung damage, cancer, and premature death. Reduces visibility and results in surface soiling.
Fuel combustion in motor vehicles, equipment, and industrial sources; residential and agricultural burning; Also, formed from photochemical reactions of other pollutants, including NOx, sulfur dioxide, and organics.
Lead (Pb) Monthly Quarterly
1.5 µg/m3 –
– 1.5 µg/m3
Disturbs gastrointestinal system, and causes anemia, kidney disease, and neuromuscular and neurological dysfunction.
Present source: lead smelters, battery manufacturing & recycling facilities. Past source: combustion of leaded gasoline.
ppm = parts per million µg/m3 = micrograms per cubic meter SOURCE: CARB 2008a and SCAQMD, 1993

4. Environmental Analysis Air Quality
Devers-Mirage 115kV Subtransmission System Split Project 4.3-9 ESA / 207059 (A.08-01-029) Draft Environmental Impact Report January 2010
related health effects and principal sources for each pollutant. California has also established State ambient air quality standards for sulfates, hydrogen sulfide, and vinyl chloride; however, air emissions of these pollutants are not expected under the Proposed Project or alternatives and thus, there is no further mention of these pollutants in this EIR. The SSAB is classified as non-attainment for both State and federal ozone and PM10 standards. For all other criteria pollutants, the SSAB is classified as either unclassified or as attainment with respect to State and federal standards.
Ozone Ozone is a respiratory irritant and an oxidant that increases susceptibility to respiratory infections and that can cause substantial damage to vegetation and other materials. Ozone is not emitted directly into the atmosphere, but is a secondary air pollutant produced in the atmosphere through a complex series of photochemical reactions involving reactive organic gases (ROG) and nitrogen oxides (NOx). ROG and NOx are known as precursor compounds for ozone. Significant ozone production generally requires ozone precursors to be present in a stable atmosphere with strong sunlight for at least three hours.
Ozone is a regional air pollutant because it is not emitted directly by sources, but is formed downwind of sources of ROG and NOx under the influence of wind and sunlight. Ozone concentrations tend to be higher in the late spring, summer, and fall, when the long sunny days combine with regional subsidence inversions to create conditions conducive to the formation and accumulation of secondary photochemical compounds, like ozone.
Carbon Monoxide CO is a non-reactive pollutant that is a product of incomplete combustion and is mostly associated with motor vehicle traffic. High CO concentrations develop primarily during winter when periods of light winds combine with the formation of ground level temperature inversions (typically from the evening through early morning). These conditions result in reduced dispersion of vehicle emissions. Motor vehicles also exhibit increased CO emission rates at low air temperatures. When inhaled at high concentrations, carbon monoxide combines with hemoglobin in the blood and reduces the oxygen-carrying capacity of the blood. This results in reduced oxygen reaching the brain, heart, and other body tissues. This condition is especially critical for people with cardiovascular diseases, chronic lung disease, or anemia.
Particulate Matter PM10 and PM2.5 represent fractions of particulate matter that can be inhaled into air passages and the lungs and can cause adverse health effects. Particulate matter in the atmosphere results from many kinds of dust- and fume-producing industrial and agricultural operations, fuel combustion, and atmospheric photochemical reactions. Some sources of particulate matter, such as demolition and construction activities, are more local in nature, while others, such as vehicular traffic, have a more regional effect. Very small particles of certain substances (e.g., sulfates and nitrates) can cause lung damage directly, or can contain adsorbed gases (e.g., chlorides or ammonium) that may be injurious to health. Particulates can also damage materials and reduce visibility.
4. Environmental Analysis Air Quality
Devers-Mirage 115kV Subtransmission System Split Project 4.3-10 ESA / 207059 (A.08-01-029) Draft Environmental Impact Report January 2010
Other Criteria Pollutants SO2 is a combustion product of sulfur or sulfur-containing fuels such as coal. SO2 is also a precursor to the formation of atmospheric sulfate and particulate matter (PM10 and PM2.5) and contributes to potential atmospheric sulfuric acid formation that could precipitate downwind as acid rain. Lead has a range of adverse neurotoxin health effects, and was formerly released into the atmosphere primarily via leaded gasoline. The phase-out of leaded gasoline in California resulted in decreasing levels of atmospheric lead.
Greenhouse Gas Emissions and Climate Change Some gases in the atmosphere affect the Earth’s heat balance by absorbing infrared radiation. These gases can prevent the escape of heat in much the same way as glass in a greenhouse. This is often referred to as the “greenhouse effect,” and it is responsible for maintaining a habitable climate. On Earth the gases believed to be most responsible for the greenhouse effect are water vapor, carbon dioxide (CO2), methane (CH4), nitrous oxide (N2O), and, hydrofluorocarbons, perfluorocarbons, and sulfur hexafluoride (SF6). Enhancement of the greenhouse effect can occur when concentrations of these gases exceed the natural concentrations in the atmosphere. Of these gases, CO2 and methane are emitted in the greatest quantities from human activities. Emissions of CO2 are largely by-products of fossil fuel combustion, whereas methane primarily results from off-gassing associated with agricultural practices and landfills. SF6 is a greenhouse gas (GHG) commonly used in the utility industry as an insulating gas in transformers and other electronic equipment. SF6, while comprising a small fraction of the total GHGs emitted annually world-wide, is a much more potent GHG with 23,900 times the global warming potential as CO2.1 To account for the warming potential of greenhouse gases, GHG emissions are often quantified and reported as CO2 equivalents (CO2e). Large emission sources are reported in million metric tons of CO2e (MMTCO2e).
There is widespread international scientific agreement that human-caused increases in GHGs has and will continue to contribute to global warming, although there is much uncertainty concerning the magnitude and rate of the warming. Some of the potential resulting effects in California of global warming may include loss in snow pack, sea level rise, more extreme heat days per year, more high ozone days, more large forest fires, and more drought years (CARB, 2006). Globally, climate change has the potential to impact numerous environmental resources through potential, though uncertain, impacts related to future air temperatures and precipitation patterns. The projected effects of global warming on weather and climate are likely to vary regionally, but are expected to include the following direct effects (IPCC, 2001):
• Higher maximum temperatures and more hot days over nearly all land areas; • Higher minimum temperatures, fewer cold days and frost days over nearly all land areas; • Reduced diurnal (i.e., daily) temperature range over most land areas; • Increase of heat index over land areas; and • More intense precipitation events. 1 Global warming potential is the potential of a gas or aerosol to trap heat in the atmosphere. CO2 is assigned a global
warming potential of 1.

4. Environmental Analysis Air Quality
Devers-Mirage 115kV Subtransmission System Split Project 4.3-11 ESA / 207059 (A.08-01-029) Draft Environmental Impact Report January 2010
Also, there are many secondary effects that are projected to result from global warming, including global rise in sea level, impacts to agriculture, changes in disease vectors, and changes in habitat and biodiversity. While the possible outcomes and the feedback mechanisms involved are not fully understood, and much research remains to be done, the potential for substantial environmental, social, and economic consequences over the long term may be great.
CARB estimated that in 2006, California produced 484 million gross metric tons of CO2e GHG emissions (CARB, 2009b). CARB found that transportation is the source of 38 percent of the State’s GHG emissions; followed by electricity generation at 22 percent, and industrial sources at 21 percent.
The California Climate Action Registry (CCAR) is a private non-profit organization that serves as a voluntary GHG registry to protect and promote early actions to reduce GHG emissions by organizations. SCE is a member in the CCAR, and provides voluntary reports of GHG emissions. For 2007, SCE reported the following levels of GHG emissions from all of its activities (CCAR, 2009):
• Mobile Combustion Emissions: 0.051 MMTCO2e; • Stationary Combustion Emissions: 6.868 MMTCO2e; • Fugitive Emissions: 0.269 MMTCO2e; and • Indirect Emissions (purchased electricity): 1.986 MMTCO2e
Regulatory Setting
Federal The USEPA is responsible for implementing the programs established under the federal Clean Air Act, such as establishing and reviewing the NAAQS and judging the adequacy of State Implementation Plans (SIPs), but has delegated the authority to implement many of the federal programs to the states while retaining an oversight role to ensure that the programs continue to be implemented.
State CARB is responsible for establishing and reviewing the State standards, compiling the California SIP and securing approval of that plan from USEPA, conducting research and planning, and identifying toxic air contaminants. CARB also regulates mobile sources of emissions in California, such as construction equipment, trucks, and automobiles, and oversees the activities of California’s air districts, which are organized at the county or regional level. County or regional air districts are primarily responsible for regulating stationary sources at industrial and commercial facilities within their geographic areas and for preparing the air quality plans that are required under the federal Clean Air Act and California Clean Air Act.

4. Environmental Analysis Air Quality
Devers-Mirage 115kV Subtransmission System Split Project 4.3-12 ESA / 207059 (A.08-01-029) Draft Environmental Impact Report January 2010
Executive Order S-3-05 In 2005, in recognition of California’s vulnerability to the effects of climate change, Governor Schwarzenegger established Executive Order S-3-05, which set forth a series of target dates by which statewide emissions of GHGs would be progressively reduced, as follows:
• By 2010, reduce GHG emissions to 2000 levels; • By 2020, reduce GHG emissions to 1990 levels; and • By 2050, reduce GHG emissions to 80 percent below 1990 levels.
Assembly Bill 32 – California Global Warming Solutions Act California Assembly Bill 32 (AB 32), the Global Warming Solutions Act of 2006, was enacted as legislation in 2006 and requires CARB to establish a statewide GHG emission cap for 2020 based on 1990 emission levels. AB 32 required CARB to adopt regulations by January 1, 2008, that identified and required selected sectors or categories of emitters of GHGs to report and verify their statewide GHG emissions, and CARB is authorized to enforce compliance with the program. Under AB 32, CARB was also required to adopt, by January 1, 2008, a statewide GHG emissions limit equivalent to the statewide GHG emissions levels in 1990, which must be achieved by 2020. By January 1, 2011, CARB is required to adopt rules and regulations (which shall become operative January 1, 2012), to achieve the maximum technologically feasible and cost-effective GHG emission reductions. AB 32 permits the use of market-based compliance mechanisms to achieve those reductions. AB 32 also requires CARB to monitor compliance with and enforce any rule, regulation, order, emission limitation, emissions reduction measure, or market-based compliance mechanism that it adopts.
In June 2007, CARB directed staff to pursue 37 early actions for reducing GHG emissions under AB 32. The broad spectrum of strategies to be developed – including a Low Carbon Fuel Standard, regulations for refrigerants with high global warming potentials, guidance and protocols for local governments to facilitate GHG reductions, and green ports – reflects that the serious threat of climate change requires action as soon as possible (CARB, 2007a).
In addition to approving the 37 GHG reduction strategies, CARB directed staff to further evaluate early action recommendations made at the June 2007 meeting, and to report back to CARB within six months. The general sentiment of CARB suggested a desire to try to pursue greater GHG emissions reductions in California in the near-term. Following the June 2007 CARB hearing, CARB staff evaluated all 48 recommendations submitted by stakeholders and several internally-generated staff ideas and published the Expanded List of Early Action Measures To Reduce Greenhouse Gas Emissions In California Recommended For Board Consideration in October 2007 (CARB, 2007b).
Climate Change Scoping Plan In December of 2008, CARB released a Scoping Plan outlining the State’s strategy to achieve the 2020 GHG emissions limit (CARB, 2008c). This Scoping Plan, developed by CARB in coordination with the Climate Action Team (CAT), proposes a comprehensive set of actions designed to reduce overall GHG emissions in California, improve the environment, reduce

4. Environmental Analysis Air Quality
Devers-Mirage 115kV Subtransmission System Split Project 4.3-13 ESA / 207059 (A.08-01-029) Draft Environmental Impact Report January 2010
dependence on oil, diversify our energy sources, save energy, create new jobs, and enhance public health. It was adopted by the Board at its meeting in December 2008. The measures in the Scoping Plan approved by the Board will be developed over the next two years and be in place by 2012.
The Scoping Plan expands the list of nine Early Action Measures into a list of 39 Recommended Actions contained in Appendices C and E of the Plan. These measures are presented in Table 4.3-5 below.
The following recommended actions are directly applicable to the Proposed Project:
(T-7) Heavy-Duty Vehicle GHG Emission Reduction (Aerodynamic Efficiency)—Discrete Early Action. This measure would require existing trucks/trailers to be retrofitted with the best available technology and/or CARB approved technology. This measure has been identified as a Discrete Early Action, which means it must be enforceable starting in 2010. Technologies that reduce GHG emissions and improve the fuel efficiency of trucks may include devices that reduce aerodynamic drag and rolling resistance. The requirements would apply to California and out-of-State registered trucks that travel to California. The cost of these retrofits would be recovered over the life of the vehicle through reduced fuel use. This measure would require in-use trucks and trailers to comply through a phase-in schedule starting in 2010 and achieve 100 percent compliance by 2014. Additionally, new 2011 and later tractors and trailers that are sold in or serviced in California would need to be certified for aerodynamic efficiency requirements. The 2020 estimated GHG reductions could be up to 6.4 MMTCO2e nationwide, of which about 0.93 MMTCO2e or about 15 percent would occur within California (CARB, 2008c).
(H-6) High GWP Reductions from Stationary Sources – SF6 Leak Reduction and Recycling in Electrical Applications. “This measure will reduce emissions of SF6 within the electric utility sector and at particle accelerators by requiring the use of best achievable control technology for the detection and repair of leaks, and the recycling of SF6. This measure would establish a regulation mandating a performance standard. Utilities and other affected entities would comply by using leak detection and repair (LDAR) abatement equipment to reduce system leakage. The proposed performance standard would mandate and enhance current voluntary federal SF6 recycling standards. Voluntary industry practices have established an 80 percent SF6 recovery rate, based on perceived economic efficiencies of recovery equipment. The proposed standard would increase recovery and recycling to 100 percent of the SF6 contained in electrical and particle accelerator equipment without substantially increasing the industries’ costs (CARB, 2008c).
In addition, the Plan identifies challenges to meeting future demand, including Building Transmission for Renewables and Modernizing Electricity Infrastructure. The Plan states:
“Population growth in hot areas and the need to reach remote renewable generation regions both require adding electricity transmission capability. Without new transmission lines, a 33 percent target for the Renewable Portfolio Standard (RPS) is unlikely to be met. Equally important to building transmission is modernizing the transmission and electricity distribution system. Advanced control, communications, and metering technologies, as well as improvements in control of both conventional and renewable generation, can create a more reliable, resilient grid.” (CARB, 2008c)

4. Environmental Analysis Air Quality
Devers-Mirage 115kV Subtransmission System Split Project 4.3-14 ESA / 207059 (A.08-01-029) Draft Environmental Impact Report January 2010
TABLE 4.3-5 RECOMMENDED ACTIONS OF CLIMATE CHANGE SCOPING PLAN
ID # Sector Strategy Name
T-1 Transportation Pavley I and II – Light-Duty Vehicle GHG Standards T-2 Transportation Low Carbon Fuel Standard (Discrete Earl Action) T-3 Transportation Regional Transportation-Related GHG Targets T-4 Transportation Vehicle Efficiency Measures T-5 Transportation Ship Electrification at Ports (Discrete Early Action) T-6 Transportation Goods-movement Efficiency Measures T-7 Transportation Heavy Duty Vehicle Greenhouse Has Emission Reduction
Measure – Aerodynamic Efficiency (Discrete Early Action) T-8 Transportation Medium and Heavy-Duty Vehicle Hybridization T-9 Transportation High Speed Rail E-1 Electricity and Natural Gas Increased Utility Energy efficiency programs ; More stringent
Building and Appliance Standards E-2 Electricity and Natural Gas Increase Combined Heat and Power Use by 30,000 GWh E-3 Electricity and Natural Gas Renewables Portfolio Standard E-4 Electricity and Natural Gas Million Solar Roofs CR-1 Electricity and Natural Gas Energy Efficiency CR-2 Electricity and Natural Gas Solar Water Heating GB-1 Green Buildings Green Buildings W-1 Water Water Use Efficiency W-2 Water Water Recycling W-3 Water Water System Energy Efficiency W-4 Water Reuse Urban Runoff W-5 Water Increase Renewable Energy Production W-6 Water Public Goods Charge (Water) I-1 Industry Energy Efficiency and Co-benefits Audits for Large Industrial
Sources I-2 Industry Oil and Gas Extraction GHG Emission Reduction I-3 Industry GHG Leak Reduction from Oil and Gas Transmission I-4 Industry Refinery Flare Recovery Process Improvements I-5 Industry Removal of Methane Exemption from Existing Refinery
Regulations RW-1 Recycling and Waste Management Landfill Methane Control (Discrete Early Action) RW-2 Recycling and Waste Management Additional Reductions in Landfill Methane – Capture
Improvements RW-3 Recycling and Waste Management High Recycling/Zero Waste F-1 Forestry Sustainable Forest Target H-1 High Global Warming Potential Gases Motor Vehicle Air Conditioning Systems (Discrete Early Action) H-2 High Global Warming Potential Gases SF6 Limits in Non-Utility and Non-Semiconductor Applications
(Discrete Early Action) H-3 High Global Warming Potential Gases Reduction in Perflourocarbons in Semiconductor Manufacturing
(Discrete Early Action) H-4 High Global Warming Potential Gases Limit High GWP Use in Consumer Products (Discrete Early
Action, Adopted June 2008) H-5 High Global Warming Potential Gases High GWP Reductions from Mobile Sources H-6 High Global Warming Potential Gases High GWP Reductions from Stationary Sources H-7 High Global Warming Potential Gases Mitigation Fee on High GWP Gases A-1 Agriculture Methane Capture at Large Dairies
SOURCE: CARB, 2008c.

4. Environmental Analysis Air Quality
Devers-Mirage 115kV Subtransmission System Split Project 4.3-15 ESA / 207059 (A.08-01-029) Draft Environmental Impact Report January 2010
CARB Preliminary Draft Staff Proposal, October 2008 In its Staff Proposal, CARB is taking the first step toward developing recommended statewide interim thresholds of significance for GHGs that may be adopted by local agencies for their own use. The proposal does not attempt to address every type of project that may be subject to CEQA, but instead focuses on common project types that, collectively, are responsible for substantial GHG emissions – specifically, industrial, residential, and commercial projects. CARB is developing these thresholds in these sectors to advance climate objectives, streamline project review, and encourage consistency and uniformity in the CEQA analysis of GHG emissions throughout the State.
CARB’s staff has developed a preliminary interim threshold concept for industrial projects (CARB, 2008b). CARB staff’s objective in this proposal is to develop a threshold of significance that will result in the vast majority (~90 percent statewide) of the GHG emissions from new industrial projects that are subject to CEQA’s requirement to impose feasible mitigation. CARB believes this can be accomplished with a threshold that allows small projects to be considered less than significant. CARB staff used existing data for the industrial sector to derive a proposed hybrid threshold. The threshold is 7,000 metric tons of CO2e per year for operational emissions (excluding transportation), and performance standards for construction and transportation emissions. These performance standards have not yet been developed.
South Coast Air Quality Management District (SCAQMD) The study area is within the jurisdiction of the SCAQMD. The SCAQMD regulates air pollutant emissions for all sources throughout western Riverside County other than motor vehicles. The SCAQMD enforces regulations and administers permits governing stationary sources. The following rules and regulations will apply to the Proposed Project:
Regulation IV – Prohibitions, Rule 402 – Nuisance. This rule prohibits the discharge of air contaminants or other material in quantities that cause injury, detriment, nuisance, or annoyance to any considerable number of persons or to the public.
Regulation IV – Prohibitions, Rule 403 – Fugitive Dust. This rule limits the emissions of fugitive dust or particulate matter from a variety of activities and sources such as construction sites, bulk material hauling, unpaved parking lots, and disturbed soil in open areas and vacant lots. It includes a visible emissions property line standard, requirement to implement Best Available Control Measures (BACM), upwind/downwind PM10 concentrations standards, prevention of track-out on to paved public roads, and special control requirements for large operations.
Regulation IV – Prohibitions, Rule 403.1 – Supplemental Fugitive Dust Control Requirements for Coachella Valley Sources. This rule builds on regulations set forth in Rule 403 by setting additional performance standards for certain activities in the Coachella Valley during high wind conditions.
As required by the federal Clean Air Act and the California Clean Air Act, air basins or portions thereof have been classified as either “attainment” or “nonattainment” for each criteria air pollutant, based on whether or not the standards have been achieved. Jurisdictions of nonattainment areas are also required to prepare an air quality management plan (AQMP) that includes strategies for

4. Environmental Analysis Air Quality
Devers-Mirage 115kV Subtransmission System Split Project 4.3-16 ESA / 207059 (A.08-01-029) Draft Environmental Impact Report January 2010
achieving attainment. The SCAQMD’s most recent AQMP was adopted on June 1, 2007. The purpose of the 2007 AQMP is to set forth a comprehensive program that will lead the region into compliance with federal 8-hour ozone and PM2.5 air quality standards. The 2007 AQMP also specifically addresses transport issues relative to the Coachella Valley Planning Area.
Riverside County Policies from the Riverside County General Plan that are applicable to the Proposed Project and alternatives include the following (Riverside County, 2003):
Policy AQ 2.2: Require site plan designs to protect people and land uses sensitive to air pollution through the use of barriers and/or distance from emissions sources when possible.
Policy AQ 4.1: Encourage the use of building materials/methods which reduce emissions.
Policy AQ 4.7: To the greatest extent possible, require every project to mitigate its anticipated emissions which exceed allowable emissions as established by the SCAQMD, MDAQMD, SOCAB, the Environmental Protection Agency, and the California Air Resources Board.
Policy AQ 4.9: Require compliance with SCAQMD Rules 403 and 403.1, and support appropriate future measures to reduce fugitive dust emanating from construction sites.
Policy AQ 17.1: Reduce particulate matter from agriculture, construction, demolition, debris hauling, street cleaning, utility maintenance, railroad rights-of-way, and off-road vehicles to the extent possible.
City of Palm Springs Portions of the Proposed Project and alternatives would be located within the City of Palm Springs. Chapter 8.50 of the Palm Springs Municipal Code, Fugitive Dust Control, establishes minimum requirements for construction and demolition activities and other specified sources in order to reduce man-made fugitive dust and corresponding PM10 emissions. This ordinance is based on performance standards and test methods included in the Coachella Valley Dust Control Handbook (City of Palm Springs, 2008).
The City of Palm Springs General Plan also includes policies addressing air quality issues. The following policies are applicable to the Proposed Project and alternatives (City of Palm Springs, 2007):
Policy AQ2.3: Reduce transport of blowsand2 adjacent to paved roadways and residential areas through the use of chemically stabilizing soil surfaces or snow fence windbreaks. Chemical stabilizing measures should only be used in areas where they will not impact endangered habitats or species.
Policy AQ2.5: Prohibit the use of off-road vehicles in blowsand areas.
2 The City of Palm Springs General Plan refers to fugitive dust as “blowsand.”
4. Environmental Analysis Air Quality
Devers-Mirage 115kV Subtransmission System Split Project 4.3-17 ESA / 207059 (A.08-01-029) Draft Environmental Impact Report January 2010
Policy AQ2.6: Prohibit the transport of earth/soil through the City when wind gusts exceed 25 miles per hour per the City’s PM10 Ordinance.
Policy AQ2.7: Require planting of vegetative ground covers as soon as possible on construction sites.
Policy AQ2.9: Phase mass grading in a way that minimizes, to the greatest extent possible, the exposure of large expanses of graded areas to wind that causes blowing sand.
City of Cathedral City The Cathedral City Municipal Code addresses fugitive dust emissions in Chapter 8.54, Fugitive Dust Control. This ordinance is based on performance standards and test methods included in the Coachella Valley Dust Control Handbook (City of Cathedral City, 2008). The City also addresses air quality planning issues in the Air Quality Element of its General Plan. The following General Plan policies and programs are applicable to the Proposed Project and alternatives (City of Cathedral City, 2002):
Policy 2: The City shall fully implement dust control ordinances, and coordinate and cooperate with local, regional and federal efforts to monitor, manage and reduce the levels of major pollutants effecting the City and region, with particular emphasis on PM10 emissions.
Program 4.B: Projects that may generate significant levels of air pollution shall be required to conduct detailed impact analyses and incorporate mitigation measures into their designs using the most advanced technological methods feasible. All proposed mitigation measures shall be reviewed and approved by the City prior to issuance of grading or demolition permits.
Policy 6: All grading, earthwork, and construction activities shall be in accordance with applicable fugitive dust control ordinances and regulations, including those established by the City, CVAG, SCAQMD, and other appropriate agencies.
City of Rancho Mirage Chapter 7.01 of the City of Rancho Mirage’s Municipal Code, Control of PM10, Fugitive Dust and Other Emissions, establishes minimum requirements for construction and demolition activities and other specified sources in order to reduce man-made fugitive dust and associated PM10 emissions (City of Rancho Mirage, 2008). The City of Rancho Mirage also addresses air quality planning issues in the Air Quality Element of its General Plan. The following policies and programs are applicable to the Proposed Project and alternatives (City of Rancho Mirage, 2005):
Program 1.C: Coordinate with developers to encourage the phasing and staging of development to assure the lowest construction related pollutant emission levels practical. Impose mitigation measures, including the use of water trucks and temporary irrigation systems as well as other measures that will effectively limit fugitive dust emissions resulting from construction or other site disturbance.
Program 5.B: Require projects with the potential to generate significant levels of air pollutants to incorporate air pollution mitigation in their design and operation, and to utilize the most advanced technological methods feasible.

4. Environmental Analysis Air Quality
Devers-Mirage 115kV Subtransmission System Split Project 4.3-18 ESA / 207059 (A.08-01-029) Draft Environmental Impact Report January 2010
City of Palm Desert The City of Palm Desert addresses impacts to local fugitive dust and PM10 emissions through its Fugitive Dust Control Ordinance. This ordinance outlines performance standards and test methods included in the Coachella Valley Dust Control Handbook (City of Palm Desert, 2009). Air quality issues are also addressed in the Air Quality Element of the City’s General Plan through the following policies and programs (City of Palm Desert, 2004):
Program 2.A: The City shall conduct an initial study and, as appropriate, require detailed air quality analyses for all applications which have the potential to adversely affect air quality.
Program 2.B: Projects with the potential to generate significant levels of air pollution, such as manufacturing facilities and site development operations, shall be required by the City to incorporate air pollution mitigation into their project design and operations, and to utilize the most advanced technological methods feasible. Mitigation measures and dust control plans shall be approved by the City prior to the issuance of grading, construction, demolition or other permits.
Program 3.C: Continue to implement and enforce the Fugitive Dust Control Ordinance to reduce PM10 emissions to the greatest extent practical.
City of Indian Wells Chapter 8.20 of the Indian Wells Municipal Code, Fugitive Dust Control, establishes minimum requirements for construction and demolition activities and other specified sources in order to reduce man-made fugitive dust and corresponding PM10 emissions (City of Indian Wells, 2008). The City of Indian Wells General Plan addresses air quality in its Conservation and Open Space Element, but does not contain any programs or policies that are applicable to the Proposed Project and alternatives (City of Indian Wells, 1996).
4.3.2 Significance Criteria The significance of potential impacts to air quality was determined based on CEQA Guidelines (CCR Sections 15000-15387, Appendix G) and other relevant considerations. The guidelines identify certain thresholds to assist in determining whether an impact reaches a level that produces adverse effects. Using these thresholds and other relevant considerations, implementation of the project would be considered to have significant air quality impacts if it were to:
a) Conflict with or obstruct implementation of the applicable air quality plan;
b) Violate any air quality standard or contribute substantially to an existing or projected air quality violation;
c) Result in a cumulatively considerable net increase of any criteria pollutant for which the project region is non-attainment under an applicable federal or State ambient air quality standard (including releasing emissions which exceed quantitative thresholds for ozone precursors);
d) Expose sensitive receptors to substantial pollutant concentrations; or

4. Environmental Analysis Air Quality
Devers-Mirage 115kV Subtransmission System Split Project 4.3-19 ESA / 207059 (A.08-01-029) Draft Environmental Impact Report January 2010
e) Create objectionable odors affecting a substantial number of people.
In addition, the Governor’s Office of Planning and Research (OPR) has suggested that a project may be considered to have a significant impact in regards to GHG emissions if it were to:
f) Generate GHG emissions, either directly or indirectly, that may have a significant impact on the environment, based on any applicable threshold of significance; or
g) Conflict with any applicable plan, policy, or regulation of an agency adopted for the purpose of reducing emissions of GHGs.
CEQA allows for the significance criteria established by the applicable AQMP or air pollution control district to be used to assess the impact of a project on air quality. The SCAQMD has established air pollution emissions criteria for determining the significance of an impact during project construction and operation (see Table 4.3-6). In addition, as discussed above, SCAQMD has developed an interim threshold of 10,000 metric tons for evaluating GHG emissions from stationary and industrial sector projects.
To assist agencies in determining whether a project may generate significant adverse localized air quality impacts, the SCAQMD has developed mass rate look-up tables by source receptor areas (SRAs). These tables are intended to be used as screening tables to determine if construction or operation of a project may result in a violation of an applicable air quality standard. The SCAQMD updated the mass rate look-up tables in July 2008 to reflect the new State nitrogen dioxide standard of 0.18 ppm. Since the SSAB is designated as non-attainment for PM10, mass rate thresholds were determined based on a significance threshold of 10.4 micrograms per cubic meter as designated by the SCAQMD.
Mass rate thresholds for one acre sites in the Coachella Valley (SRA #30) are shown in Table 4.3-7. These thresholds are expressed in pounds per day and are intended for on-site emissions only.
As an interim method for determining significance under CEQA until statewide significance thresholds are established, SCAQMD has developed a tiered GHG significance threshold. SCAQMD recommends that when analyzing significance of GHG emissions, project emissions should include direct, indirect, and to the extent information is available, life cycle emissions during construction and operation. Construction emissions should be amortized over the life of the project, defined as 30 years, and added to operational emissions, and compared to the applicable GHG significance threshold tier. The following bullet points describe the basic structure of staff’s tiered GHG significance threshold for stationary source and industrial projects (SCAQMD, 2008e).
• Tier 1 – consists of evaluating whether or not the project qualifies for any applicable exemption under CEQA. For example, SB 97 specifically exempts a limited number of projects until it expires in 2010. If the project qualifies for an exemption, no further action is required. If the project does not qualify for an exemption, then it would move to the next tier.

4. Environmental Analysis Air Quality
Devers-Mirage 115kV Subtransmission System Split Project 4.3-20 ESA / 207059 (A.08-01-029) Draft Environmental Impact Report January 2010
TABLE 4.3-6 SCAQMD AIR QUALITY SIGNIFICANCE THRESHOLDS
Mass Daily Thresholds
Pollutant Construction Operation
NOx 100 lbs/day 55 lbs/day VOCa 75 lbs/day 55 lbs/day PM10 150 lbs/day 150 lbs/day PM2.5 55 lbs/day 55 lbs/day SOx 150 lbs/day 150 lbs/day CO 550 lbs/day 550 lbs/day
Lead 3 lbs/day 3 lbs/day
Toxic Air Contaminants (TACs) and Odor Thresholds
TACs (including carcinogens and non-carcinogens)
Maximum Incremental Cancer Risk ≥ 10 in 1 million Hazard Index ≥ 1.0 (project increment)
Hazard Index ≥ 3.0 (facility-wide)
Odor Project creates an odor nuisance pursuant to SCAQMD Rule 402
Ambient Air Quality for Criteria Pollutantsb
Nitrogen Dioxide
1-hour average
SCAQMD is in attainment; project is significant if it causes or contributes to an exceedance of the following attainment standards:
0.18 ppm (State)
PM10 24-hour average
10.4 μg/m3 (recommended for construction)c 2.5 μg/m3 (operation)
PM2.5 24-hour average
10.4 μg/m3 (recommended for construction)c 2.5 μg/m3 (operation)
CO
1-hour average 8-hour average
SCAQMD is in attainment; project is significant if it causes or contributes to an exceedance of the following attainment standards:
20 ppm (State) 9.0 ppm (State/federal)
lbs/day = pounds per day μg/m3 = micrograms per cubic meter ppm = parts per million ≥ = greater than or equal to a For purposes of this analysis, VOC is equivalent to ROG. b Ambient air quality thresholds for criteria pollutants based on SCAQMD Rule 1303, Table A-2 unless otherwise stated. c Ambient air quality threshold based SCAQMD Rule 403. SOURCE: SCAQMD, 1993; SCAQMD, 2009.
TABLE 4.3-7 SCAQMD LOCALIZED SIGNIFICANCE THRESHOLDS
Distance to Receptor (meters)
NOx (lb/day)
CO (lb/day)
PM10 (lb/day)
PM2.5 (lb/day)
25 118 878 4 3 50 148 1,387 13 5
100 211 2,565 35 10 250 334 6,021 80 24 500 651 24,417 214 105
lbs/day = pounds per day SOURCE: SCAQMD, 2008d.

4. Environmental Analysis Air Quality
Devers-Mirage 115kV Subtransmission System Split Project 4.3-21 ESA / 207059 (A.08-01-029) Draft Environmental Impact Report January 2010
• Tier 2 – consists of determining whether or not the project is consistent with a GHG reduction plan that may be part of a local general plan, for example. The concept embodied in this tier is equivalent to the existing concept of consistency in CEQA Guidelines Sections 15064(h)(3), 15125(d), or 15152(a). The GHG reduction plan must, at a minimum, comply with AB 32 GHG reduction goals, include emissions estimates agreed upon by either CARB or the AQMD, have been analyzed under CEQA, and have a certified Final CEQA document. Further, the GHG reduction plan must include a GHG emissions inventory tracking mechanism, process to monitor progress in achieving GHG emission reduction targets, and a commitment to remedy the excess emissions if GHG reduction goals are not met (enforcement).
If the proposed project is consistent with the qualifying local GHG reduction plan, it is not significant for GHG emissions. If the project is not consistent with a local GHG reduction plan, there is no approved plan, or the GHG reduction plan does not include all of the components described above, the project would move to Tier 3.
• Tier 3 – establishes a screening significance threshold level to determine significance using a 90 percent emission capture rate approach as described above.
The 90 percent capture rate GHG significance screening level in Tier 3 for stationary sources was derived using the following methodology. Using SCAQMD’s Annual Emission Reporting (AER) Program staff compiled reported annual natural gas consumption for 1,297 permitted facilities for 2006 through 2007 and rank-ordered the facilities to estimate the 90th percentile of the cumulative natural gas usage for all permitted facilities. Approximately 10 percent of facilities evaluated comprise more than 90 percent of the total natural gas consumption, which corresponds to 10,000 metric tons of CO2e emissions per year (the majority of combustion emissions is comprised of CO2). This value represents a boiler with a rating of approximately 27 million British thermal units per hour (mmBtu/hour) of heat input, operating at an 80 percent capacity factor. It should be noted that this analysis did not include other possible GHG pollutants such as CH4 and N2O, a life-cycle analysis, mobile sources, or indirect electricity consumption. Therefore, when implemented, staff’s recommended interim proposal is expected to capture more than 90 percent of GHG emissions from stationary source projects.
If the project exceeds the GHG screening significance threshold level and GHG emissions cannot be mitigated to less than the screening level, the project would move to Tier 4.
• Tier 4 – consists of a decision tree approach that allows the lead agency to choose one of three compliance options based on performance standards. (For the purposes of Board consideration, Tier 4 is not recommended for approval at this time.)
The purpose of Tier 4 is to provide a means of determining significance relative to GHG emissions for very large projects that include design features and or other measures to mitigate GHG emissions to the maximum extent feasible, but residual GHG emissions still exceed the interim Tier 3 screening levels. In this situation, since no additional project-related GHG emission reductions are feasible, staff is considering whether it is reasonable to consider that residual emissions are not significant. The intent of the Tier 4 compliance options is to encourage large projects to implement the maximum feasible GHG reduction measures instead of shifting to multiple smaller projects that may forego some design efficiencies that can more easily be incorporated into large projects than small projects.
4. Environmental Analysis Air Quality
Devers-Mirage 115kV Subtransmission System Split Project 4.3-22 ESA / 207059 (A.08-01-029) Draft Environmental Impact Report January 2010
CARB’s interim GHG significance threshold proposal incorporates a similar, but modified approach for determining GHG significance along with other suggested approaches that may have merit to consider and incorporate into AQMD staff’s recommended interim proposal. There are also policy and legal questions that need to be further resolved before adopting such an approach.
• Tier 5 – under this tier, the project proponent would implement offsite mitigation (GHG reduction projects) to reduce GHG emission impacts to less than the proposed screening level. Any offsite mitigation measures that include purchase of offsets would require the project proponent provide offsets for the life of the project, which is defined as 30 years. If the project proponent is unable to implement offsite GHG reduction mitigation measures to reduce GHG emission impacts to less than the screening level, then GHG emissions from the project would be considered significant. Since it is currently uncertain how offsite mitigation measures, including purchased offsets, interact with future AB 32 Scoping Plan measures, the AQMD would allow substitution of mitigation measures that include an enforceable commitment to provide mitigation prior to the occurrence of emissions. The intent of this provision is to prevent mitigating the same emissions twice.
4.3.3 Applicant Proposed Measures SCE has proposed the following applicant proposed measures (APMs) to minimize emissions from the Proposed Project. The impact analysis assumes that the APMs would be implemented to reduce air quality impacts as discussed below.
APM AQ-1. Control Exhaust Emissions. Use ultra-low sulfur diesel fuel (e.g., fewer than 15 parts per million).
APM AQ-2. Control Exhaust Emissions. Use of clean-burning on- and off-road diesel engines. Where feasible, heavy duty diesel-powered construction equipment manufactured after 1996 (with federally mandated “clean” diesel engines) will be utilized.
APM AQ-3. Control Exhaust Emissions. Construction workers will carpool when possible.
APM AQ-4. Control Exhaust Emissions. Restrict vehicle idling time to less than 10 minutes whenever possible.
APM AQ-5. Control Exhaust Emissions. Properly maintain mechanical equipment.
APM AQ-6. Minimize Diesel Particulate Matter. Use particle traps and other appropriate controls to reduce diesel particulate matter (DPM) where possible. Utilize equipment such as specialized catalytic converters (oxidation catalysts) to control approximately 20 percent of DPM, 40 percent of CO, and 50 percent of hydrocarbon emissions.
APM AQ-7. Fugitive Dust Control Measures. Implement feasible fugitive dust control measures as provided in SCAQMD Rule 403.
APM AQ-8. Construction Operations. As feasible, restrict construction operations during the morning hours and during high wind events, when NOx emissions are more likely to contribute to O3 formation.

4. Environmental Analysis Air Quality
Devers-Mirage 115kV Subtransmission System Split Project 4.3-23 ESA / 207059 (A.08-01-029) Draft Environmental Impact Report January 2010
APM AQ-9. Construction Scheduling. Efficiently schedule staff and daily construction activities to minimize the use of unnecessary/duplicate equipment when possible.
APM AQ-10. Emissions Reduction. To reduce simultaneous project-related NOx, PM10, and PM2.5, emissions from on- and off-road heavy construction equipment, given the constraints of the construction schedule, SCE shall phase project construction, to the extent feasible, so that off-site disposal of excavated material from Proposed Project area grading and excavation does not occur simultaneously with transmission and subtransmission line and substation construction or upgrade activity (including, but not limited to, access road grading, excavation for tower and pole bases, crane pads, tower and pole delivery, or tower and pole erection). During transmission and subtransmission line construction, SCE shall phase the project construction schedule, to the extent feasible, so that grading and excavation for site access, tower and pole bases, or crane pads do not occur simultaneously with tower or pole delivery or erection.
4.3.4 Air Quality Impacts and Mitigation Measures
Approach to Analysis
This section presents an analysis of the potential air quality impacts associated with the construction and operation of the Proposed Project. Criteria pollutant emissions from construction equipment exhaust and generation of particulate matter (fugitive dust) are the primary concerns in evaluating short-term air quality impacts. Long-term impacts associated with criteria pollutants, however, would be negligible since emission-related activities associated with Proposed Project operations and maintenance would be limited to periodic maintenance and inspection trips similar to what is occurring now along the existing subtransmission and transmission line ROWs.
Construction of the Proposed Project would require a variety of construction and earth moving equipment. Exhaust pollutants would be emitted during construction activities from motor-driven construction equipment, construction vehicles, and workers’ vehicles, and fugitive dust would be generated by ground disturbing activities as well as from heavy truck travel on paved and unpaved roads. The “worst-case” scenario for daily emissions during project construction is estimated to generate the following criteria pollutant emissions:
• ROG: 49.2 pounds per day; • CO: 218.9 pounds per day; • NOx: 451.1 pounds per day; • SOx: 1.7 pounds per day; • PM10: 298.6 pounds per day; and • PM2.5: 76.2 pounds per day. Projected construction emissions are presented in Table 4.3-8, broken down by construction components. Emissions from construction components that would be expected to occur simultaneously were combined to determine the “worst-case” scenario for daily emissions. As shown in Table 4.3-9, the worst-case day emissions for all criteria pollutants except SOx would occur in the third quarter of 2010 when construction of the proposed upgrades at Mirage Substation, Devers Substation, and Eisenhower Substation, and the proposed Mirage-Santa Rosa

4. Environmental Analysis Air Quality
Devers-Mirage 115kV Subtransmission System Split Project 4.3-24 ESA / 207059 (A.08-01-029) Draft Environmental Impact Report January 2010
115 kV subtransmission line would overlap. Worst-case emissions of SOx would occur during the second quarter of 2011 when upgrades at the Mirage Substation, Garnet Substation, and Tamarisk Substation, and construction of the proposed Devers-Coachella Valley 220 kV Loop-In would overlap.
Off-road and on-road mobile source emission factors obtained from the SCAQMD (SCAQMD, 2008a and 2008b) were used to estimate exhaust emissions. The SCAQMD emission factors for off-road vehicles were determined using CARB’s OFFROAD Model. Emission factors for on-road trucks and worker vehicles were derived using CARB’s EMFAC2007 Model to estimate the pounds of pollution emitted per mile of travel. Helicopter emission factors for the T53-L-11D helicopter that would be used during construction of the proposed Devers-Coachella Valley 220 kV Loop-In were obtained from USEPA’s Procedures for Emissions Inventory Preparation, Volume IV, Mobile Sources (USEPA, 1992).
The USEPA document AP-42 was used to calculate fugitive dust emissions from construction activities. Fugitive dust emissions were evaluated for the following activities: general site preparation and grading; travel on paved roads; travel on unpaved roads; and foundation digging. For general site preparation and earth-moving activities, AP-42 identifies a general emission rate of 80 pounds of total suspended particulate per acre per day. According to the SCAQMD, approximately 48.9 percent of total suspended fugitive particulate matter generated during general construction and demolition is made up of particulate matter less than or equal to 10 microns in diameter (PM10) and 20.8 percent of this PM10 is less than 2.5 microns in diameter (PM2.5) (SCAQMD, 2006). Based on these percentages it was assumed that the emission rate for fugitive dust during general site preparation would be approximately 39 pounds per acre per day of PM10 and eight pounds per acre per day of PM2.5.
Based on SCAQMD’s recommended mitigation measures and control efficiencies, it was assumed that 60 percent of fugitive dust from general site preparation would be controlled by watering disturbed areas. For travel on unpaved roads it was assumed that 55 percent of fugitive dust could be controlled by watering roads at least twice per day. By sweeping paved roads it was assumed that 16 percent of fugitive dust from travel on local roads and 26 percent of fugitive dust from travel on collector and arterial roads would be controlled (SCAQMD, 2008c).
Construction components evaluated include the following: construction of the Devers-Coachella Valley 220 kV Loop-In; construction of the 115 kV subtranmission lines, including the associated reconfigurations; modifications to existing substations; and telecommunications equipment upgrades. Fugitive dust and combustion emissions from each of these components are described in more detail below. Maximum daily emissions from construction components that would overlap were combined to determine the maximum daily regional emissions from construction of the Proposed Project.
Proposed 115 kV Subtransmission Lines and Reconfigurations Construction of the proposed 115 kV subtransmission lines, including the three proposed pole reconfigurations, would also generate fugitive dust and combustion emissions during grading of

4. Environmental Analysis Air Quality
Devers-Mirage 115kV Subtransmission System Split Project 4.3-25 ESA / 207059 (A.08-01-029) Draft Environmental Impact Report January 2010
access roads, travel on unpaved and paved roads, foundation digging for pole installation, and other site preparation activities.
Fugitive dust emissions from construction of the proposed 115 kV subtransmission lines were determined using the same methods that were used to determine the fugitive dust emissions that would be associated with the 220 kV loop-in. Combustion emissions were also calculated based on the proposed equipment lists for each activity, as described in Chapter 2: Project Description. Maximum daily emissions from construction of the 115 kV subtransmission lines and associated reconfigurations are shown in Table 4.3-8 below.
Devers-Coachella Valley 220 kV Loop-In Construction of the proposed Devers-Coachella Valley 220 kV Loop-In would involve installation of eight new lattice steel towers (LSTs), one new tubular steel pole (TSP), and approximately 9,780 feet of single-circuit 220 kV transmission line. Additionally, seven existing LSTs, one existing TSP, and approximately 4,590 feet of existing 220 kV transmission line would be removed as part of the loop-in. These activities would result in fugitive dust emissions generated during ground disturbing activities and combustion emissions from off-road construction equipment as well as from worker and delivery vehicles.
Fugitive dust emissions were calculated for foundation digging for the proposed towers and poles as well as for travel on unpaved and paved roads. The AP-42 emission factor for fugitive emissions from drilling holes at surface coal mines was used to determine fugitive emissions from foundation digging. It was assumed that approximately ten holes would be drilled per day for the purpose of calculating fugitive dust emissions. Fugitive emissions from travel on paved and unpaved roads were calculated based on the longest distance traveled in a given day along the proposed transmission line alignments. The percentage of roads assumed to be unpaved or paved were determined based on existing road characteristics in the project vicinity.
Combustion emissions were calculated based on the equipment listed in Chapter 2, Project Description. Equipment used for construction of the proposed 220 kV loop-in is broken into different groups depending on the construction activity such as installation of foundations, tower assembly, and conductor pulling. The combustion emissions for each activity were calculated individually to determine the maximum daily combustion emissions that would result during construction of the proposed 220 kV loop-in. Maximum daily emissions for construction of the 220 kV loop-in are shown in Table 4.3-8 below.
Proposed Substation Upgrades As discussed previously, the fugitive dust emission rates of 39 pounds per acre per day of PM10
and 8 pounds per acre per day of PM2.5 were used to estimate fugitive dust emissions from site grading at the substations. It was assumed that site grading at each of the applicable substations would take place over one day.
4. Environmental Analysis Air Quality
Devers-Mirage 115kV Subtransmission System Split Project 4.3-26 ESA / 207059 (A.08-01-029) Draft Environmental Impact Report January 2010
Combustion emissions from substation upgrades were estimated based on the equipment list provided in Chapter 2. Table 4.3-8 includes a summary of emissions that is estimated to be generated during modifications of each individual substation.
Telecommunications Equipment Upgrade Emissions from telecommunications upgrades would occur primarily from combustion equipment used for installation of equipment. Fugitive emissions would result from vehicles traveling on paved and unpaved roads to access each individual pole. Table 4.3-8 includes a summary of emissions estimated to be generated during telecommunications equipment upgrades.
a) Conflict with or obstruct implementation of the applicable air quality plan. The SCAQMD’s most recent AQMP was adopted in June of 2007. The purpose of the 2007 AQMP is to set forth a comprehensive program that will lead the region into compliance with federal 8-hour ozone and PM2.5 air quality standards. The 2007 AQMP also specifically addresses transport issues relative to the Coachella Valley Planning Area. To achieve compliance with applicable standards, the 2007 AQMP outlines stationary and mobile source control measures and also relies on State and federal standards to help achieve compliance with applicable standards.
Construction of the Proposed Project would be conducted in compliance with applicable federal, State, and local requirements. Operation of the Proposed Project would involve minimal emissions from vehicle trips made to inspect and maintain the project. Furthermore, the Proposed Project would not induce or cause population growth, and therefore would not affect population growth assumptions that were considered when developing the 2007 AQMP. Therefore, the Proposed Project would not obstruct the implementation of the currently approved AQMP (No Impact).
b) Violate any air quality standard or contribute substantially to an existing or projected air quality violation.
Impact 4.3-1: Construction activities would generate emissions of criteria pollutants, including suspended and inhalable particulate matter and equipment exhaust emissions. Significant unmitigable (Class I)
Estimated maximum daily emissions associated with construction of each component of the Proposed Project are presented in Table 4.3-8. On-site exhaust emissions include exhaust from heavy duty construction equipment that would be used to construct each component of the Proposed Project. Fugitive dust emissions would occur as a result of ground disturbance and vehicle travel that would happen in the vicinity of the various Proposed Project locations. Employee vehicle emissions are those that would be generated by workers that would commute to and from the various Proposed Project sites. Refer to Appendix A for the calculation sheets that were used to estimate the Proposed Project construction emissions.

4. Environmental Analysis Air Quality
Devers-Mirage 115kV Subtransmission System Split Project 4.3-27 ESA / 207059 (A.08-01-029) Draft Environmental Impact Report January 2010
TABLE 4.3-8 MAXIMUM DAILY CONSTRUCTION EMISSIONS BY PROJECT COMPONENT
Component
Emissions (lbs/day)
CO NOx ROG SOx PM10 PM2.5
Transmission Line Loop-In Fugitive Dust 0.00 0.00 0.00 0.00 137.85 27.53 On-site vehicle Exhaust 69.14 143.32 13.40 1.54 7.04 6.48 Employee Vehicles 6.33 0.66 0.65 0.01 0.05 0.03 Total 75.47 143.98 14.05 1.55 144.94 34.03
Subtransmission Linea Fugitive Dust 0.00 0.00 0.00 0.00 236.14 48.20 On-site vehicle Exhaust 78.53 230.94 20.06 0.24 9.84 9.05 Employee Vehicles 24.79 2.59 2.54 0.03 0.20 0.12 Total 103.32 233.53 22.60 0.27 246.18 57.37
Devers Substation Construction Fugitive Dust 0.00 0.00 0.00 0.00 12.85 2.73 On-site vehicle Exhaust 21.48 44.77 5.21 0.05 2.26 2.08 Employee Vehicles 3.16 0.33 0.32 0.00 0.03 0.02 Total 24.64 45.10 5.53 0.05 15.14 4.83
Mirage Substation Construction Fugitive Dust 0.00 0.00 0.00 0.00 15.52 3.23 On-site vehicle Exhaust 51.96 119.97 13.43 0.12 6.05 5.57 Employee Vehicles 12.13 1.27 1.24 0.01 0.10 0.06 Total 64.09 121.24 14.67 0.13 21.67 8.85
Concho Substation Construction Fugitive Dust 0.00 0.00 0.00 0.00 0.00 0.00 On-site vehicle Exhaust 2.13 4.10 0.39 0.00 0.18 0.17 Employee Vehicles 1.05 0.11 0.11 0.00 0.01 0.01 Total 3.18 4.21 0.50 0.00 0.19 0.18
Indian Wells Substation Construction Fugitive Dust 0.00 0.00 0.00 0.00 0.00 0.00 On-site vehicle Exhaust 2.13 4.10 0.39 0.00 0.18 0.17 Employee Vehicles 1.05 0.11 0.11 0.00 0.01 0.01 Total 3.18 4.21 0.50 0.00 0.19 0.18
Santa Rosa Substation Construction Fugitive Dust 0.00 0.00 0.00 0.00 0.00 0.00 On-site vehicle Exhaust 2.13 4.10 0.39 0.00 0.18 0.17 Employee Vehicles 1.05 0.11 0.11 0.00 0.01 0.01 Total 3.18 4.21 0.50 0.00 0.19 0.18
Eisenhower Substation Construction Fugitive Dust 0.00 0.00 0.00 0.00 12.90 2.74 On-site vehicle Exhaust 23.66 51.30 6.05 0.05 2.64 2.43 Employee Vehicles 3.16 0.33 0.32 0.00 0.03 0.02 Total 26.82 51.63 6.37 0.05 15.57 5.19
Farrell Substation Construction Fugitive Dust 0.00 0.00 0.00 0.00 13.32 2.82 On-site vehicle Exhaust 23.66 51.30 6.05 0.05 2.64 2.43 Employee Vehicles 3.16 0.33 0.32 0.00 0.03 0.02 Total 26.82 51.63 6.37 0.05 15.99 5.27

4. Environmental Analysis Air Quality
Devers-Mirage 115kV Subtransmission System Split Project 4.3-28 ESA / 207059 (A.08-01-029) Draft Environmental Impact Report January 2010
TABLE 4.3-8 (Continued) MAXIMUM DAILY CONSTRUCTION EMISSIONS BY PROJECT COMPONENT
Component
Emissions (lbs/day)
CO NOx ROG SOx PM10 PM2.5
Garnet Substation Construction Fugitive Dust 0.00 0.00 0.00 0.00 4.19 0.90 On-site vehicle Exhaust 2.13 4.10 0.39 0.00 0.18 0.17 Employee Vehicles 1.05 0.11 0.11 0.00 0.01 0.01 Total 3.18 4.21 0.50 0.00 4.38 1.08
Thornhill Substation Construction Fugitive Dust 0.00 0.00 0.00 0.00 4.19 0.90 On-site vehicle Exhaust 2.13 4.10 0.39 0.00 0.18 0.17 Employee Vehicles 1.05 0.11 0.11 0.00 0.01 0.01 Total 3.18 4.21 0.50 0.00 4.38 1.08
Tamarisk Substation Construction Fugitive Dust 0.00 0.00 0.00 0.00 0.06 0.01 On-site vehicle Exhaust 17.88 34.10 4.24 0.04 1.79 1.65 Employee Vehicles 2.11 0.22 0.22 0.00 0.02 0.01 Total 19.99 34.32 4.46 0.04 1.87 1.67
Telecommunications Line Fugitive Dust 0.00 0.00 0.00 0.00 51.61 10.80 On-site vehicle Exhaust 20.37 62.28 5.65 0.06 2.98 2.74 Employee Vehicles 2.11 0.22 0.22 0.00 0.02 0.01 Total 22.48 62.50 5.87 0.06 54.61 13.55
lbs/day = pounds per day a- The emissions value is the daily maximum that would occur during construction of any of the subtransmission line sections. SOURCES: SCE, 2008 and ESA, 2009.
As discussed previously, emissions from overlapping construction components were added to determine the maximum daily emissions that would occur during construction of the Proposed Project. Table 4.3-9 shows the maximum daily construction emissions based on construction phasing and overlap as provided by SCE.
As shown in Table 4.3-9, maximum daily emissions of CO, ROG, and SOx are all below the SCAQMD regional significance thresholds, thus represent a less than significant impact in regards to regional air quality. However, maximum daily emissions of NOx, PM10, and PM2.5 would exceed the SCAQMD regional significance thresholds. Therefore, construction of the Proposed Project would result in a potentially significant temporary impact to regional air quality.
To reduce fugitive dust emissions, SCE has committed to implementing APM AQ-7, which requires SCAQMD Rule 403 fugitive dust control measures to be implemented during construction (see Section 4.3.3, above). However, APM AQ-7 is superseded by Mitigation Measure 4.3-1a (see below), which includes specific control measures identified in the Coachella Valley Fugitive Dust Control Handbook. Regarding exhaust emissions, SCE has committed to implementing APM AQ-1 through APM AQ-6 as well as APM AQ-8 through APM AQ-10 to

4. Environmental Analysis Air Quality
Devers-Mirage 115kV Subtransmission System Split Project 4.3-29 ESA / 207059 (A.08-01-029) Draft Environmental Impact Report January 2010
TABLE 4.3-9 MAXIMUM DAILY COMBINED CONSTRUCTION EMISSIONS
Quarter Construction Phases Occurring Simultaneouslya
Combined Maximum Daily Emissions (lbs/day)b,c
CO NOx ROG SOx PM10 PM2.5
2nd Quarter, 2010 Subtransmission Line (Mirage-Santa Rosa) 103.3 233.5 22.6 0.3 246.2 57.4
3rd Quarter, 2010 Mirage Substation, Devers Substation, Eisenhower Substation 115.6 217.6 26.6 0.2 52.4 18.9
3rd Quarter, 2010 Mirage Substation, Devers Substation, Eisenhower Substation, Subtransmission Line (Mirage-Santa Rosa-Tamarisk)
218.9 451.1 49.2 0.5 298.6 76.2
3rd Quarter, 2010 Mirage Substation, Concho Substation, Eisenhower Substation, Subtransmission Line (Mirage-Santa Rosa-Tamarisk)
197.4 410.2 44.1 0.5 283.6 71.6
4th Quarter, 2010 Mirage Substation, Concho Substation, Farrell Substation, Subtransmission Line (Mirage-Santa Rosa-Tamarisk)
197.4 410.2 44.1 0.5 284.0 71.7
1st Quarter, 2011
Mirage Substation, Indian Wells Substation, Farrell Substation, Subtransmission Line (Mirage-Devers-Capwind-Tamarisk)
197.4 410.2 44.1 0.5 284.0 71.7
1st Quarter, 2011
Mirage Substation, Indian Wells Substation, Thornhill Substation, Subtransmission Line (Mirage-Devers-Capwind-Tamarisk)
173.8 362.8 38.3 0.4 272.4 67.5
1st Quarter, 2011
Mirage Substation, Indian Wells Substation, Thornhill Substation, Subtransmission Line (Mirage-Devers-Capwind-Tamarisk)
173.8 362.8 38.3 0.4 272.4 67.5
1st Quarter, 2011
Mirage Substation, Santa Rosa Substation, Thornhill Substation, Subtransmission Line (Mirage-Devers-Capwind-Tamarisk)
173.8 362.8 38.3 0.4 272.4 67.5
1st Quarter, 2011 Mirage Substation, Santa Rosa Substation, Thornhill Substation, Subtransmission Line (Mirage-Concho)
173.8 362.8 38.3 0.4 272.4 67.5
2nd Quarter, 2011 Mirage Substation, Santa Rosa Substation, Tamarisk Substation, Subtransmission Line (Mirage-Concho)
190.6 392.9 42.2 0.4 269.9 68.1
2nd Quarter, 2011 Mirage Substation, Garnet Substation, Tamarisk Substation, Subtransmission Line (Mirage-Concho)
190.6 392.9 42.2 0.4 274.1 69.0
2nd Quarter, 2011 Mirage Substation, Garnet Substation, Tamarisk Substation, Transmission Line (Devers-Mirage #2)
162.8 303.4 33.7 1.7 172.9 45.6
2nd Quarter, 2011 Transmission Line (Devers-Mirage #2, Coachella Valley-Mirage) 75.5 144.0 14.0 1.5 144.9 34.0
Maximum Combined Daily Emissions 218.9 451.1 49.2 1.7 298.6 76.2 lbs/day = pounds per day a Based on schedule provided by SCE. b Values above the applicable regional significance thresholds are shown in BOLD. c PM10 and PM2.5 emissions rates are based on the assumption that Mitigation Measure 4.3-1a would be implemented. SOURCE: SCE, 2008.

4. Environmental Analysis Air Quality
Devers-Mirage 115kV Subtransmission System Split Project 4.3-30 ESA / 207059 (A.08-01-029) Draft Environmental Impact Report January 2010
help reduce emissions from on and off-road vehicles (see Section 4.3.3, above). In addition to these APMs, it is recommended that SCE submit an emission reduction plan to the CPUC for review and approval (see Mitigation Measure 4.3-1b, below).
Mitigation Measure 4.3-1a: Fugitive Dust Control Plan. SCE or its construction contractor shall prepare a fugitive dust control plan prior to conducting active construction activities. The plan shall include, at a minimum, the following fugitive dust control measures, which are based on Best Available Control Measures as outlined in the Coachella Valley Fugitive Dust Control Handbook.
• Backfilling. Stabilize backfill material when not actively handling, during handling and at completion of activities. This may be achieved by mixing backfill soil with water prior to moving, dedicating a water truck or high capacity hose to backfilling equipment, emptying loader buckets slowly so that no dust plumes are generated and/or by the minimizing drop height from the loader bucket.
• Clearing and grubbing. Maintain stability of soil through pre-watering of site prior to, during, and immediately after clearing and grubbing. This may be achieved by maintaining live perennial vegetation and desert pavement where possible and by applying water in sufficient quantities to prevent generation of dust plumes.
• Cut and fill. Pre-water soils prior to and following cut and fill activities. This may be achieved by pre-watering with sprinklers or water trucks or by using water trucks/pulls to water soil to depth of cut prior to subsequent cuts.
• Demolition. Stabilize wind erodible surfaces, surface soil where support equipment and vehicles operate, and loose soil and demolition debris.
• Disturbed soil. Stabilize disturbed soil throughout the construction site and between structures. This may be achieved by limiting vehicular traffic and disturbances on soil where possible or by applying water or a stabilizing agent to prevent generation of visible dust plumes.
• Earth-moving activities. Pre-apply water to depth of proposed cuts or as necessary to maintain soils in a damp condition. Stabilize soils once earth-moving activities are complete. This may be achieved by installing upwind fencing to prevent material movement, or applying water or a stabilizing agent to prevent generation of visible dust plumes.
• Importing/exporting of bulk materials. Stabilize material while loading to prevent fugitive dust emissions, maintain at least six inches of freeboard on haul vehicles, limit vehicular speeds to 15 miles per hour while traveling onsite, stabilize material while transporting and/or unloading to prevent fugitive dust emissions, and comply with Vehicle Code Section 23114. This may be achieved by using tarps or other suitable enclosures on haul trucks, checking belly dump seals regularly and removing any trapped rocks to prevent spillage, complying with track-out prevention requirements and by providing water while loading and unloading to prevent visible dust plumes.
• Landscaping. Stabilize soils, materials, and slopes by applying water to materials, maintaining materials in a crusted condition, maintaining an effective cover over
4. Environmental Analysis Air Quality
Devers-Mirage 115kV Subtransmission System Split Project 4.3-31 ESA / 207059 (A.08-01-029) Draft Environmental Impact Report January 2010
materials, stabilizing sloping surfaces using soil binders, or by hydroseeding areas prior to the rainy season.
• Staging areas. Stabilize staging areas during use and at project completion.
• Stockpiles/bulk material handling. Stabilize stockpiled materials or install and maintain wind barriers to less than 50 percent porosity on three sides of the pile, such that the barrier is equal to or greater than the pile height. Stockpiles within 100 yards of occupied buildings must not be greater than eight feet in height and stockpiles that are greater than eight feet in height and not covered must have a road bladed top to allow water truck access or must have an operational water irrigation system that is capable of complete stockpile coverage.
• Traffic areas for construction activities. Stabilize all off-road traffic and parking areas and ensure that onsite vehicular traffic does not exceed 15 miles per hour. Stabilize all haul routes and direct construction traffic over established haul routes. This may be achieved by applying gravel or paving haul routes and by using barriers to ensure that construction traffic only uses established routes.
• Trenching. Stabilize surface soils where trencher or excavator and support equipment will operate and stabilize soils at completion of trenching activities. Pre-water soils prior to trenching and wash mud and soils from equipment at the conclusion of trenching activities to prevent crusting and drying of soil on equipment.
• Unpaved roads/parking lots. Stabilize soils to meet the applicable standards and limit vehicular travel to established paved roads (haul routes) and unpaved parking lots.
• Weather monitoring/work practices. Monitor current weather conditions and weather predictions from the SCAQMD’s toll free wind forecast system and/or the National Weather Service. Cease all construction activities if fugitive dust emissions exceed 20 percent opacity or if the 100 foot visible plume restrictions cannot be met.
Mitigation Measure 4.3-1b: Exhaust Emissions Control Plan. To ensure and monitor implementation of APMs AQ-1 through AQ-6 and AQ-8 through AQ-10, SCE shall develop an Exhaust Emissions Control Plan outlining how compliance with each of these measures shall be achieved. This plan shall be submitted to the CPUC for review and shall be distributed to all employees and construction contractors prior to commencement of construction activities. The CPUC construction monitor shall monitor compliance with the Plan periodically throughout the duration of construction activities.
Significance after Mitigation: While Mitigation Measures 4.3-1a (Fugitive Dust Control Plan) and 4.3-1b (Exhaust Emissions Control Plan) would reduce emissions of NOx and PM during construction, they would not reduce emissions to a level that would be considered less than significant. Therefore, impacts from construction of the Proposed Project would cause a temporary significant and unmitigable impact to regional air quality.

4. Environmental Analysis Air Quality
Devers-Mirage 115kV Subtransmission System Split Project 4.3-32 ESA / 207059 (A.08-01-029) Draft Environmental Impact Report January 2010
Impact 4.3-2: Operational activities would generate emissions of criteria pollutants. Less than significant (Class III)
Operation of the Proposed Project would not result in new stationary sources of criteria pollutants nor would it increase criteria pollutant emissions from existing stationary sources. Mobile source emission-related activities associated with Proposed Project operations would be limited to periodic maintenance and inspection trips similar to what is occurring now at the existing line ROWs and substations. Therefore, increases in criteria pollutant emissions from operations of the Proposed Project would be negligible and impacts would be less than significant.
Mitigation: None required.
c) Result in a cumulatively considerable net increase of any criteria pollutant for which the project region is non-attainment under an applicable federal or State ambient air quality standard.
Impact 4.3-3: Construction activities would generate emissions of criteria pollutants that would be considered cumulatively considerable. Significant unmitigable (Class I)
Riverside County is designated as non-attainment for ozone and PM10. Long term operations of the Proposed Project would result in negligible emissions, which would not be cumulatively considerable. Construction activities associated with the Proposed Project, as described in this section, could have a temporary impact on regional and localized air quality through short-term increases in criteria pollutant exhaust emissions (e.g., NOx, ROG, CO, SO2, PM10 and PM2.5) and fugitive dust, which could be cumulatively significant when combined with other projects described in Section 3.6, Cumulative Projects. Mitigation Measures 4.3-1a (Fugitive Dust Control Plan) and 4.3-1b (Exhaust Emissions Control Plan) would reduce emissions of criteria pollutants during construction activities, but impacts would remain significant and unmitigable. Therefore, cumulative impacts on regional and localized air quality from overlapping activities during construction the Proposed Project and other projects would also be significant and unmitigable.
Mitigation Measures: Implement Mitigation Measures 4.3-1a (Fugitive Dust Control Plan) and 4.3-1b (Exhaust Emissions Control Plan).
Significance after Mitigation: Implementation of Mitigation Measures 4.3-1a and 4.3-1b would reduce emissions of criteria pollutants to the maximum extent feasible; however, not all potential impacts from construction emissions would be mitigated. Therefore, when considered with other projects, construction of the Proposed Project would result in a cumulatively considerable net increase in criteria pollutants. Impacts would be significant and unmitigable.

4. Environmental Analysis Air Quality
Devers-Mirage 115kV Subtransmission System Split Project 4.3-33 ESA / 207059 (A.08-01-029) Draft Environmental Impact Report January 2010
d) Expose sensitive receptors to substantial pollutant concentrations.
Impact 4.3-4: Construction activities would generate emissions of criteria pollutants, exposing local sensitive receptors to pollutant concentrations. Significant unmitigable (Class I)
Localized impacts to air quality were evaluated for each component of the Proposed Project based on the maximum daily emissions generated on site and the distance from the site to the nearest receptor. Emissions from worker commute vehicles were not included in this analysis because they are generated on a regional rather than local level. Furthermore, only fugitive dust emissions that would be generated on the project sites were included in this analysis. Therefore, emissions from travel on paved and unpaved roads were not included in the analysis of localized emissions.
Maximum daily onsite emissions and distances to the nearest receptor for each component of the Proposed Project are shown in Table 4.3-10. These emission rates were compared to the localized significance thresholds that are shown in Table 4.3-7. For receptor distances that fall between two categories, the more conservative threshold was used. The most conservative thresholds were used for receptor distances that were less than the lower threshold distance of 25 meters.
TABLE 4.3-10 CONSTRUCTION IMPACTS ON LOCALIZED AIR QUALITY
Phase Distance to
Receptor (m)
Maximum Daily Onsite Emissionsa
CO NOx PM10 PM2.5
220 kV Loop-In 25 69.1 143.3 14.8 6.9 Farrell – Garnet Subtransmission Line 25 78.5 230.9 17.6 9.4 Mirage – Santa Rosa Subtransmission Line 31 78.5 230.9 17.6 9.4 Devers Substation 250 21.5 44.8 2.6 2.2 Mirage Substation 50 52.0 119.6 21.6 8.8 Concho Substation 20 2.1 4.1 0.2 0.2 Indian Wells Substation 35 2.1 4.1 0.2 0.2 Santa Rosa 40 2.1 4.1 0.2 0.2 Eisenhower Substation 50 23.7 51.3 3.0 2.5 Farrell Substation 24 23.7 51.3 3.5 2.6 Garnet Substation 25 2.1 4.1 0.2 0.2 Thornhill Substation 10 2.1 4.1 0.2 0.2 Tamarisk Substation 10 17.9 34.1 2.7 0.2 Telecommunications 30 20.4 62.3 3.0 2.7
NOTES: lbs/day = pounds per day. Emissions are those that would be generated on site only. Values above the regional significance
threshold are shown in BOLD. a PM10 and PM2.5 emissions rates are based on the assumption that Mitigation Measure 4.3-1a would be implemented. SOURCE: SCE, 2008.

4. Environmental Analysis Air Quality
Devers-Mirage 115kV Subtransmission System Split Project 4.3-34 ESA / 207059 (A.08-01-029) Draft Environmental Impact Report January 2010
As shown in Table 4.3-10, construction of the 220 kV loop-in and the subtransmission lines would exceed the applicable localized significance thresholds for NOx, PM10, and PM2.5. Additionally, PM10 and PM2.5 emissions during construction of the Mirage Substation would exceed the applicable localized significance thresholds. Therefore, the construction of these components would generate emissions of criteria pollutants that could potentially expose sensitive receptors to substantial pollutant concentrations.
Mitigation Measures: Implement Mitigation Measures 4.3-1a (Fugitive Dust Control Plan) and 4.3-1b (Exhaust Emissions Control Plan).
Significance after Mitigation: Implementation of Mitigation Measures 4.3-1a and 4.3-1b would reduce emissions of criteria pollutants to the maximum extent feasible; however, emission levels at several locations would continue to be considered significant. Therefore, maximum daily emissions during construction of the Proposed Project would cause significant unmitigable impacts to localized air quality.
e) Create objectionable odors affecting a substantial number of people.
Impact 4.3-5: Construction of the Proposed Project would create objectionable odors. Less than significant (Class III)
Operation of the Proposed Project would not create odorous emissions. However, project construction would require the use of diesel-fueled equipment that would result in exhaust emissions that could be perceived as having an objectionable odor. Since the construction activities would be temporary and spatially dispersed, and generally take place in rural areas, these activities would not affect a substantial number of people. Therefore, impacts from odors generated by construction and operation of the Proposed Project would be less than significant.
Mitigation: None required.
f, g) Generate GHG emissions, either directly or indirectly, that may have a significant impact on the environment, based on any applicable threshold of significance and/or conflict with any applicable plan, policy, or regulation of an agency adopted for the purpose of reducing emissions of GHGs.
Impact 4.3-6: The Proposed Project would generate short-term and long-term emissions of GHGs that could exceed applicable thresholds of significance or conflict with applicable GHG reduction plans. Less than significant with mitigation (Class II)
As with other individual small projects (e.g., projects that are not cement plants, oil refineries, energy generating facilities/providers, co-generation facilities, or hydrogen plants or other stationary combustion sources that emit more than 25,000 metric tons of CO2e per year), the emissions increases that would result under the Proposed Project would not be expected to

4. Environmental Analysis Air Quality
Devers-Mirage 115kV Subtransmission System Split Project 4.3-35 ESA / 207059 (A.08-01-029) Draft Environmental Impact Report January 2010
individually have a significant impact on global climate change (CAPCOA, 2008) and the primary concerns would be whether implementation of the Proposed Project would interfere with an applicable GHG reduction plan or exceed an applicable threshold of significance.
Based on a review of recent publications and actions from CARB and the Governor’s Office of Planning and Research (OPR) technical advisory regarding analysis of GHGs in CEQA documents (CARB 2007a and 2007b; OPR, 2008; and OPR, 2009) three considerations were used to evaluate whether the Proposed Project’s emissions would interfere with an applicable GHG reduction plan or exceed an applicable threshold of significance. Each is discussed in the analysis below. The considerations include:
1. The potential for the project to conflict with the 39 Recommended Actions identified by CARB in its Climate Change Scoping Plan, which includes nine Early Action Measures;
2. The relative size of the project’s GHG emissions in comparison to CARB’s proposed operational significance threshold of 7,000 metric tons per year; and
3. The project’s potential to conflict with GHG reduction goals set forth in AB32.
The Proposed Project would generate GHG emissions from a variety of sources. Mobile sources such as trucks, tractors, and passenger vehicles would emit CO2, CH4 and N2O, and circuit breakers may leak SF6.
Table 4.3-5 presents the 39 Recommended Actions identified to date by CARB in its Climate Change Scoping Plan. Of the 39 measures identified, those that would be considered to be applicable to the Proposed Project would primarily be those actions related to transportation and SF6 leakage. Consistency of the Proposed Project with these measures is evaluated by each source-type measure below:
(T-7) Heavy-Duty Vehicle GHG Emission Reduction (Aerodynamic Efficiency) - Discrete Early Action. By the year 2014, 100 percent of California trucks and trailers, such as the ones that would be used to haul equipment and materials to construction sites associated with the Proposed Project, would be required to be retrofitted with the best available aerodynamic efficiency technology and/or CARB approved aerodynamic efficiency technology to reduce GHG emissions and improve fuel efficiency. The 100 percent compliance target date would occur after construction of the Proposed Project would be completed. Therefore, there would be no potential for the Proposed Project to conflict with this recommended action.
(H-6) High GWP Reductions from Stationary Sources – SF6 Leak Reduction and Recycling in Electrical Application. SCE is a member of the SF6 Reduction Partnership for Electric Power Systems. This partnership is a collaborative effort that was formed between the USEPA and the electric power industry to help identify and reduce fugitive emissions of SF6. Utilities that have joined the partnership have agreed to: estimate current annual SF6 emissions and annually inventory emissions of SF6 using an emissions inventory protocol; establish a strategy for replacing older, leakier pieces of equipment; implement SF6 recycling; ensure that only knowledgeable personnel handle SF6; and submit annual progress reports to the USEPA. In 2006, the USEPA recognized SCE for its accomplishments in reducing SF6 emissions. Since SCE joined the SF6 Reduction

4. Environmental Analysis Air Quality
Devers-Mirage 115kV Subtransmission System Split Project 4.3-36 ESA / 207059 (A.08-01-029) Draft Environmental Impact Report January 2010
Partnership for Electrical Power Systems in 2001, the company has reduced its SF6 emissions by 41 percent. Consequently, SCE operations would be considered consistent with the goals of Action H-6.
In addition to assessing the Proposed Project’s potential to conflict with the Recommended Actions, the Proposed Project is also compared to CARB’s proposed draft operational threshold of 7,000 metric tons per year. Construction of the Proposed Project would result in emissions of GHGs from onsite construction equipment exhaust as well as from off-site worker and delivery truck trip exhaust. The most common GHGs associated with fuel combustion include CO2, N2O, and CH4. Over the entire construction phase of the Proposed Project, approximately 2,494 metric tons of CO2e would be emitted (most of the emissions would be CO2 with less than one ton CO2e associated with CH4 and N2O). This represents a temporary increase in SCE’s baseline GHG emissions inventory.
A number of applicant proposed measures would help reduce GHG emissions during construction of the Proposed Project. Such measures include encouraging construction workers to carpool (APM AQ-3) and restricting vehicle idling time to less than 10 minutes when possible (APM AQ-4). Additionally, APM AQ-9 would help reduce GHG emissions by minimizing the amount of duplicate/unnecessary equipment through efficient construction scheduling (see Section 4.3.3 for complete text of the APMs). Implementation of Mitigation Measure 4.3-1b would ensure implementation of these measures during construction activities. While these measures would help reduce emissions, the GHG emissions from construction activities would still result in a net increase in SCE’s GHG inventory.
Operation of the Proposed Project may cause a small increase in GHG emissions from vehicle travel during inspection and maintenance of the new subtransmission and transmission lines. These emissions would be minimal and would likely be offset by the increased efficiency in electricity transport that would result from construction of the Proposed Project.
In addition to vehicle emissions, SF6 could unintentionally leak from transformers, circuit breakers, and other equipment within the substations during operations of the Proposed Project. The new sources of SF6 included as part of the Proposed Project are the 19 new circuit breakers, each of which would contain approximately 50 to 150 pounds of SF6. The USEPA estimates that among leaking circuit breakers, those manufactured prior to 1999 leak, on average, 2.5 percent of the nameplate capacity, while leaking circuit breakers manufactured in 1999 and later emit less than one percent of nameplate capacity (USEPA, 2006).
In order to determine the net change in SF6 emissions as a result of the Proposed Project, this analysis makes the following assumptions:
• both old and new circuit breakers would leak, and would leak at the rates estimated by the USEPA; and
• without the Proposed Project, the old circuit breakers would be replaced in five years.
4. Environmental Analysis Air Quality
Devers-Mirage 115kV Subtransmission System Split Project 4.3-37 ESA / 207059 (A.08-01-029) Draft Environmental Impact Report January 2010
Given these assumptions, the anticipated emission rate from each new circuit breaker during operation would be approximately 1.5 pounds per year, and combined emissions from all new circuit breakers would be 28.5 pounds per year. Six of the 19 new circuit breakers would replace existing circuit breakers. Assuming that the six circuit breakers being replaced leak approximately 2.5 percent of their SF6 content per year, removing these circuit breakers would reduce SF6 emissions by approximately 22.5 pounds per year resulting in a net increase of 6.0 pounds of SF6 per year. However, this net increase only represents each of the first five years, after which it assumed that old circuit breakers would be replaced regardless of the Proposed Project. From five years after construction of the project is complete through the life of the project, there would be a 28.5 pound per year increase in SF6 emissions. Given that SF6 has a global warming potential of 23,900, the first five years of operation of the Proposed Project would result in an increase of approximately 65 metric tons of CO2e per year. From years six through the life of the project, total increase in operational CO2e emissions would be approximately 309 metric tons of CO2e per year.
To date, CARB has not given explicit instructions regarding thresholds for construction emissions. However, as discussed previously, the SCAQMD adopted a methodology for determining whether or not GHG emissions from a project would be significant, which includes more guidance related to construction emissions (SCAQMD, 2008e). Under this methodology, construction emissions are amortized over the life of a project (estimated to be 30 years), added to the operational emissions, and compared to the interim GHG significance threshold. In the absence of clear guidance from CARB regarding significance thresholds for construction emissions, the CPUC has determined that the SCAQMD’s method is the best available method to determine GHG significance associated with the Proposed Project. Thus, the amortized annual emissions (i.e., 1/30 of the total construction emissions plus net operational emissions) would be as follows:
Years 1 through 5: 65 Operational emissions (metric tons CO2e) 83 Amortized construction emissions (metric tons CO2e) 148 metric tons CO2e
Years 6 through 30: 309 Operational emissions (metric tons CO2e) 83 Amortized construction emissions (metric tons CO2e) 392 metric tons CO2e
While the annualized GHG emissions associated with the Proposed Project would be substantially less than CARB’s preliminary draft threshold amount of 7,000 metric tons CO2e, significance for this project is also based on whether the Proposed Project would be consistent with the State’s GHG reduction goal under AB 32, which would require a minimum reduction of 30 percent of GHG emissions by 2020 compared to business as usual conditions. Since annualized GHG emissions would increase by 148 metric tons of CO2e per year during years 1 through 5 and by 392 metric tons of CO2e during years 6 through 30, emission rates would not be less than business as usual. In order for the Proposed Project to be consistent with the State’s GHG reduction goal, the following mitigation measure is required.

4. Environmental Analysis Air Quality
Devers-Mirage 115kV Subtransmission System Split Project 4.3-38 ESA / 207059 (A.08-01-029) Draft Environmental Impact Report January 2010
Mitigation Measure 4.3-6: Within 60 days of completion of project construction, SCE shall enter into a binding agreement to purchase carbon offset credits from the California Climate Action Registry (CCAR), or any source that is approved by the CPUC and that is consistent with the policies and guidelines of the California Global Warming Solution Act of 2006 (AB 32), to offset a minimum of 30 percent of the net annualized increase of greenhouse gas emissions from the Proposed Project. The offsets identified in the binding agreement shall be implemented no later than six calendar months from completion of construction. The estimated amount of offsets required is 105.3 metric tons CO2e per year (i.e., 30 percent of 148 metric tons CO2e for years 1 through 5 and 30 percent of 392 metric tons of CO2e for years 6 through 30). However, the exact amount of greenhouse gas emissions to be offset may vary depending on whether any of the construction plans are modified. Within 60 days of completion of the Proposed Project, SCE shall submit a report for the CPUC’s review and approval, which shall identify all construction- and operations-related emissions and the offset amounts that will be purchased from approved programs to result in a minimum 30 percent net reduction in annualized GHG emissions.
Significance after Mitigation: Less than Significant.
4.3.5 Cumulative Impacts Construction of the Proposed Project would have a temporary impact on regional air quality from emissions of PM10, PM2.5, and NOx, which would be cumulatively considerable when combined with construction of other projects proposed in the project vicinity. The SCAQMD regional thresholds were set to limit air pollution and to help the district reach attainment status for PM10, PM2.5, and ozone. By exceeding the regional PM10, PM2.5, and NOx thresholds, emissions generated by the Proposed Project combined with emissions from construction of other projects may contribute to air quality violations in the SSAB and may inhibit the SSAB’s ability to achieve attainment status. Although the SSAB is in attainment for nitrogen dioxide, NOx emissions are still a concern as NOx is a precursor to ozone generation. Applicant proposed measures and Mitigation Measures 4.3-1a and 4.3 1-b would help reduce construction emissions; however, impacts would remain significant and would therefore result in a significant short-term unmitigable cumulative impact to regional air quality (Class I).
In addition to regional impacts, construction of the Proposed Project would cause significant unmitigable impacts to localized air quality during construction activities. Proposed construction components that would have a significant impact on nearby receptors include the following: the Farrell-Garnet 115 kV line, the Mirage-Santa Rosa 115 kV line, and the 220 kV loop-in, and the upgrades to Mirage Substation. Construction projects located in close proximity to these components would exacerbate the localized impact if construction activities overlap, and would thus cause a significant impact when considered on a cumulative level.
Construction projects that may overlap with construction of the proposed Farrell-Garnet 115 kV line and are within close proximity of potential construction areas include the Casa Verona Subdivision project and the Palm Springs Classic/Escena project. The Casa Verona Subdivision project would be located approximately 0.3 mile from the proposed Farrell-Garnet 115 kV line

4. Environmental Analysis Air Quality
Devers-Mirage 115kV Subtransmission System Split Project 4.3-39 ESA / 207059 (A.08-01-029) Draft Environmental Impact Report January 2010
alignment and would include the subdivision of a 6.1 acre parcel into 25 residential lots. This project is currently approved but construction has not commenced. The Palm Springs Classic/Escena project is located approximately 0.1 mile from the Farrell Substation and includes the construction of an 18-hole golf course, a 450 unit hotel, and 1,450 residential units. This project is currently under construction and therefore may overlap with construction of the proposed Farrell-Garnett 115 kV line if construction activities associated with this cumulative project continue into the second quarter of 2010. If construction activities from any of these projects overlap with construction of the proposed Farrell-Garnet 115 kV line, there would be an increased chance of exposing nearby receptors to harmful pollutant concentrations, thus resulting in a cumulatively considerable impact to localized air quality.
The Ponderosa Homes II project, which includes the construction of 237 single family residences, is located within half a mile from the proposed Mirage-Santa Rosa 115 kV line alignment as well as the proposed 115 kV reconfiguration at Gerald Ford Drive and Portola Avenue. This project is currently under construction and could overlap with construction of the Mirage-Santa Rosa 115 kV line, thus resulting in a cumulatively considerable impact on localized air quality.
There is a proposed subdivision that would be located within half a mile from the proposed 220 kV loop-in alignment just north of Ramon Road between Desert Moon Drive and Vista Del Sol. This subdivision would result in the development of 144 residential and commercial lots. If approved, the construction of these units could overlap with construction of the proposed 220 kV loop-in and could result in a cumulatively considerable impact to nearby receptors located between the two project sites.
As demonstrated above, there are a number of proposed and approved construction projects located near the components of the Proposed Project that are expected to cause significant and unmitigable impacts to localized air quality. Therefore, any overlap between construction of the Proposed Project and nearby projects would increase the chances of exposing a receptor to harmful pollutant concentrations. Therefore, the Proposed Project would be cumulatively considerable and cumulative impacts to localized air quality would be significant and unmitigable (Class I).
As discussed under Impact 4.3-6 above, significance of GHG emissions are determined based on whether they would have a cumulatively considerable impact on global climate change. The Proposed Project would generate considerably less than 7,000 metric tons CO2e per year, and, with mitigation, would not conflict with the State’s GHG reduction goals. The Proposed Project’s contribution to global climate change would not be cumulatively considerable and cumulative impacts would be mitigated to a less than significant level (Class II).

4. Environmental Analysis Air Quality
Devers-Mirage 115kV Subtransmission System Split Project 4.3-40 ESA / 207059 (A.08-01-029) Draft Environmental Impact Report January 2010
4.3.6 Alternatives
No Project Alternative For the purposes of this analysis, the No Project Alternative includes the following two assumptions: 1) the project would not be implemented and the existing conditions in the study area would not be changed; and 2) new subtransmission and transmission lines and/or additional power generation would be constructed in or near the study area to supply power to the Electrical Needs Area. Given the highly speculative nature of the No Project Alternative assumptions, this analysis is qualitative.
Construction activities associated with implementation of the No Project Alternative could result in the generation of criteria pollutant emissions. Since the amount of infrastructure that would be constructed under the No Project Alternative is unknown, criteria pollutant emissions could be higher or lower than those associated with the Proposed Project. To be conservative, this analysis assumes that emissions associated with construction of the No Project Alternative would be the same as or greater than those associated with the Proposed Project; therefore, impacts from criteria pollutant emissions associated with construction of the No Project Alternative would be significant and unmitigable even after implementation of Mitigation Measures 4.3-1a and 4.3-1b (Class I).
As with the Proposed Project, operation of the No Project Alternative would result in small increments of criteria pollutant emissions. It can be assumed that these impacts would be similar in magnitude to those associated with the Proposed Project; therefore, impacts would be less than significant (Class III).
GHG emissions generated by construction of the No Project Alternative would be similar to criteria pollutant emissions in that they may be higher or lower than those associated with the Proposed Project depending on the infrastructure required. However, since operational GHG emissions would likely be similar in magnitude to those associated with the Proposed Project and due to the fact that GHG construction emissions are amortized over 30 years, it can be assumed that GHG emissions would not be substantially higher than those associated with the Proposed Project. Therefore, it can be assumed that construction and operational emissions associated with the No Project Alternative would not exceed the interim CARB threshold of 7,000 metric tons per year. Implementation of Mitigation Measure 4.3-6 would ensure that the No Project Alternative’s GHG emissions under the new transmission scenario would be reduced by 30 percent from business as usual and therefore impacts would be less than significant with mitigation (Class II).
Alternative 2 Alternative 2 would include the construction of approximately six miles of new underground and overhead single-circuit 115 kV subtransmission line between the Farrell and Garnet substations. The installation of approximately three miles of underground transmission facilities would require trench excavation for installation of the new 115 kV conduit duct banks, trench refill,

4. Environmental Analysis Air Quality
Devers-Mirage 115kV Subtransmission System Split Project 4.3-41 ESA / 207059 (A.08-01-029) Draft Environmental Impact Report January 2010
compaction, and street resurfacing. Such activities would result in more fugitive dust emissions than construction of the Proposed Project. Furthermore, trenching activities associated with the underground portion of Alternative 2 would require the use of a backhoe and compaction equipment as well as haul trucks to export excess trench soil. Road closures during open trenching would impede traffic flow on major streets which would result in additional emissions due to increased vehicle idling. Since impacts from criteria pollutant emissions during construction of Alternative 2 would be higher than those expected from the Proposed Project, it can be assumed that impacts would be significant and unmitigable even after implementation of Mitigation Measures 4.3-1a and 4.3-1b (Class I).
Operation of Alternative 2 could potentially result in higher fugitive dust emissions than the Proposed Project due to increased travel on dirt access roads. Additionally, inspection of the underground segment would require blocking vehicle traffic in the area, thus increasing vehicle emissions during maintenance and inspection activities. Overall, impacts from operation of Alternative 2 would be greater than impacts from operation of the Proposed Project. Nevertheless, emissions of criteria pollutants during operation of Alternative 2 would be relatively minor and intermittent and impacts would be less than significant (Class III).
Odors created during construction and operation of Alternative 2 would be similar to those from the Proposed Project. Although this alignment would pass by a greater number of sensitive receptors, the emissions would be spatially dispersed and impacts would be less than significant with regards to odors (Class III).
The slightly longer length of Alternative 2 (0.2 mile longer than the proposed Farrell-Garnet 115 kV line) and the additional equipment required for construction of the underground portion of the 115 kV line would result in slightly higher emissions of GHGs from construction and operation compared to the Proposed Project. The circuit breakers under this alternative would be the same as for the Proposed Project, thus GHG emissions from SF6 leaks would be the same as those identified for the Proposed Project. Although GHG emissions from construction and operation of Alternative 2 could be slightly higher than those anticipated for the Proposed Project, it can be assumed that this increase would not lead to a significant unmitigable GHG emissions impact. Implementation of Mitigation Measure 4.3-6 would reduce GHG impacts to less than significant (Class II).
Alternative 3 Alternative 3 would include the construction of approximately 6.5 miles of new underground and overhead single-circuit 115 kV subtransmission line between the Farrell and Garnet substations. The installation of approximately 3.6 miles of underground subtransmission facilities would require trenching activities that would result in more fugitive dust emissions than construction of the Proposed Project. Furthermore, additional equipment required to construct the underground segment of Alternative 3 would substantially increase criteria pollutant emissions from construction activities. Road closures during trenching could impede traffic flow, thus increasing

4. Environmental Analysis Air Quality
Devers-Mirage 115kV Subtransmission System Split Project 4.3-42 ESA / 207059 (A.08-01-029) Draft Environmental Impact Report January 2010
non-project related emissions due to increased vehicle idling. Since impacts from criteria pollutant emissions during construction of Alternative 3 would be higher than those expected from the Proposed Project, it can be assumed that impacts would be significant and unmitigable even after implementation of Mitigation Measures 4.3-1a and 4.3-1b (Class I).
Inspection of the underground segment would require blocking vehicle traffic in the area, thus increasing vehicle emissions during maintenance and inspection activities. Overall, impacts from operation of Alternative 3 would be greater than impacts from operations of the Proposed Project. Nevertheless, emissions of criteria pollutants during operation of Alternative 3 would be minor and intermittent and impacts would be less than significant (Class III).
Odors created during construction and operation of Alternative 3 would be similar to those from the Proposed Project. Although this alignment would pass by a greater number of sensitive receptors, the emissions would be spatially dispersed and impacts would be less than significant with regards to odors (Class III).
The additional length of Alternative 3 and the additional equipment required for construction of the underground portion of the subtransmission line would result in slightly higher emissions of GHGs from construction and operation compared to the Proposed Project. The circuit breakers under this alternative would be the same as for the Proposed Project, thus GHG emissions from SF6 leaks would be the same as those identified for the Proposed Project. Although GHG emissions from construction and operation of Alternative 3 would be slightly higher than that that would be anticipated for the Proposed Project, it can be assumed that the increase would not lead to a significant unmitigable GHG emissions impact. Implementation of Mitigation Measure 4.3-6 would reduce GHG impacts to less than significant (Class II).
Alternative 5 Alternative 5 would include the construction of approximately 3.1 miles of mostly new underground single-circuit 115 kV subtransmission line between Mirage Substation and the existing Santa Rosa-Tamarisk 115 kV line. The trench excavation for installation of the underground portion of the line would result in more fugitive dust emissions compared to construction of the Proposed Project and would require additional equipment that would substantially increase criteria pollutant emissions from construction activities. Furthermore, traffic delays due to road closure during trenching would increase criteria pollutant emissions due to non-project related increased vehicle idling. Overall, Alternative 5 would have higher emissions of criteria pollutants during construction activities compared to the Proposed Project and impacts would be significant and unmitigable even after implementation of Mitigation Measures 4.3-1a and 4.3-1b (Class I).
Operation of Alternative 5 would require the inspection of underground cable and connecting components once every three years. Inspections would impede vehicle traffic on Ramon Road, Monterey Avenue, and Varner Road and would therefore result in higher vehicle emissions from

4. Environmental Analysis Air Quality
Devers-Mirage 115kV Subtransmission System Split Project 4.3-43 ESA / 207059 (A.08-01-029) Draft Environmental Impact Report January 2010
increased idling. The Proposed Project would require annual inspection, but since the Proposed Project would be constructed in existing SCE ROW, there would not be a net increase in criteria pollutant emissions unless a pole needed to be replaced. Therefore, emissions from operation of Alternative 5 would be greater than those generated during operation of the Proposed Project; however, impacts would still be less than significant (Class III).
Odors created during construction and operation of Alternative 5 would be similar to those from the Proposed Project. Although this alignment would pass by a greater number of sensitive receptors, the emissions would be spatially dispersed and impacts would be less than significant with regards to odors (Class III).
The additional equipment required for construction of the underground portion of the subtransmission line could result in higher emissions of GHGs from construction compared to the Proposed Project. Furthermore, traffic delays during inspection of the underground portion of the line would have the potential to increase emissions during maintenance and inspection activities associated with the alternative. The circuit breakers under this alternative would be the same as for the Proposed Project, thus GHG emissions from SF6 leaks would be the same as those identified for the Proposed Project. Although GHG emissions from construction of Alternative 5 would be slightly higher than those that would occur under the Proposed Project, it can be assumed that the increase would not lead to a significant unmitigable GHG emissions impact. Implementation of Mitigation Measure 4.3-6 would reduce GHG impacts to less than significant (Class II).
Alternative 6 Alternative 6 would include the construction of approximately 4.2 miles of new underground and overhead single-circuit 115 kV subtransmission line between Farrell Substation and the existing Garnet-Santa Rosa 115 kV ROW, which is approximately 1.6 miles less than the line that would constructed under the Proposed Project. While the overall length of Alternative 6 would be shorter than the Proposed Project it would include installation of approximately one mile of underground subtransmission facilities, which would require more intensive construction activities compared to overhead line construction activities. Installation of underground facilities would require trenching activities that would result in more fugitive dust emissions compared to construction of the same length of overhead line facilities. Furthermore, additional equipment required to construct the underground segment of Alternative 6 may increase criteria pollutant emissions from construction activities. Road closure during trenching activities would impede traffic flow on major streets and would result in greater emissions due to increased vehicle idling. However, given the moderately shorter length of Alternative 6 compared to the Proposed Project, overall emissions that would be associated with Alternative 6 would be approximately the same as those that would occur under the Proposed Project. Impacts would be significant and unmitigable after implementation of Mitigation Measures 4.3-1a and 4.3-1b (Class I).
4. Environmental Analysis Air Quality
Devers-Mirage 115kV Subtransmission System Split Project 4.3-44 ESA / 207059 (A.08-01-029) Draft Environmental Impact Report January 2010
Operation of Alternative 6 may result in lower fugitive dust emissions from inspection and maintenance activities compared to the Proposed Project because the alternative is shorter length and it would be located in existing franchise locations near paved streets and in existing utility corridors, as opposed to the Proposed Project, which would include approximately 0.6 mile of new dirt access roads. However, inspection of the underground segment would require blocking vehicle traffic in the area, thus increasing vehicle emissions during maintenance and inspection activities. Overall, impacts from operation of Alternative 6 would be comparable to impacts from operation of the Proposed Project. Therefore, emissions of criteria pollutants during operation of Alternative 6 would be less than significant (Class III).
Odors created during construction and operation of Alternative 6 would be similar to those that would occur under the Proposed Project. Although the Alternative 6 alignment would pass by a greater number of sensitive receptors, the emissions would be spatially dispersed and impacts would be less than significant with regards to odors (Class III).
As discussed above under the criteria pollutant discussion, emissions of GHGs from construction of Alternative 6 would be similar to those that would occur under the Proposed Project. The circuit breakers under this alternative would be the same as for the Proposed Project, thus GHG emissions from SF6 leaks would be the same as those identified for the Proposed Project. GHG emissions from construction of Alternative 6 would be approximately the same as those that would occur under the Proposed Project. Implementation of Mitigation Measure 4.3-6 would reduce GHG impacts to less than significant (Class II).
Alternative 7 Alternative 7 would include the construction of approximately 9.1 miles of a new overhead single-circuit 115 kV subtransmission line between Farrell Substation and the existing Garnet-Santa Rosa 115 kV ROW. This alternative would be greater in length than the Proposed Project and would therefore take longer to construct assuming the same level of daily construction activities. Since impacts from criteria pollutant emissions generated during construction of Alternative 7 would be higher than those expected from the Proposed Project, it can be assumed that impacts would be significant and unmitigable even after implementation of Mitigation Measures 4.3-1a and 4.3-1b (Class I).
Operation of Alternative 7 may result in lower fugitive dust emissions from inspection and maintenance activities than the Proposed Project because the alternative is located in existing franchise locations near paved streets and in existing utility corridors, compared to the Proposed Project which would include 0.6 mile of new dirt access roads. Therefore, it can be assumed that emissions of criteria pollutants during operation of Alternative 7 would be less than significant (Class III).
Odors created during construction and operation of Alternative 7 would be similar to those from the Proposed Project. Although this alignment would pass by a greater number of sensitive

4. Environmental Analysis Air Quality
Devers-Mirage 115kV Subtransmission System Split Project 4.3-45 ESA / 207059 (A.08-01-029) Draft Environmental Impact Report January 2010
receptors, the emissions would be spatially dispersed and impacts would be less than significant with regards to odors (Class III).
The additional length of Alternative 7 would result in higher emissions of GHGs compared to construction of the Proposed Project. The circuit breakers under this alternative would be the same as for the Proposed Project, thus GHG emissions from SF6 leaks would be the same as those identified for the Proposed Project. Although GHG emissions from construction of Alternative 7 could be slightly higher than those anticipated for the Proposed Project, it can be assumed that this increase would not lead to a significant unmitigable impact to air quality. Implementation of Mitigation Measure 4.3-6 would reduce GHG impacts to less than significant (Class II).
References – Air Quality California Air Pollution Control Officers Association (CAPCOA), 2008. CEQA and Climate
Change: Evaluating and Addressing Greenhouse Gas Emissions from Projects Subject to the California Environmental Quality Act.
California Air Resources Board (CARB), 2006. Climate Change website (http://www.arb.ca.gov/cc/120106workshop/intropres12106.pdf) accessed June 11, 2008.
CARB, September 2007a. Draft List of Early Action Measures To Reduce Greenhouse Gas Emissions In California Recommended For Board Consideration.
CARB, October 2007b. Expanded List of Early Action Measures To Reduce Greenhouse Gas Emissions In California Recommended For Board Consideration.
CARB, 2008a. Ambient Air Quality Standards, website (http://www.arb.ca.gov/research/aaqs/aaqs2.pdf) accessed October 21, 2009, last updated November 17, 2008.
CARB, 2008b. Preliminary Draft Staff Proposal. Recommended Approaches for Setting Interim Significance Thresholds for Greenhouse Gases under the California Environmental Quality Act. Released October 24, 2008.
CARB, 2008c. Climate Change Scoping Plan: a framework for change. California Air Resources Board (CARB). Released December, 2008. Retrieved from http://www.arb.ca.gov/cc/scopingplan/document/adopted_scoping_plan.pdf.
CARB, 2009a. Aerometric Data Analysis and Management, website (http://www.arb.ca.gov/adam/welcome.html) accessed October 21, 2009.
CARB, 2009b. California Greenhouse Gas Inventory for 2000-2006 – Summary by IPCC Category, (http://www.arb.ca.gov/cc/inventory/data/tables/ghg_inventory_ipcc_00-06_sum_2009-03-13.pdf), accessed June 26, 2009, last updated Friday March 13, 2009.
California Climate Action Registry (CCAR), 2009. Annual Emissions Report – Southern California Edison, October 22, 2009.

4. Environmental Analysis Air Quality
Devers-Mirage 115kV Subtransmission System Split Project 4.3-46 ESA / 207059 (A.08-01-029) Draft Environmental Impact Report January 2010
City of Cathedral City, 2002. City of Cathedral City General Plan, Chapter 4 – Environmental Resources, Air Quality Element, adopted July 31, 2002.
City of Cathedral City, 2008. Cathedral City Municipal Code, Chapter 11.96, Noise Control. Accessed online (http://www.qcode.us/codes/cathedralcity/) June 12, 2008.
City of Indian Wells, 1996. Indian Wells General Plan, Chapter IIIA – Resource Management, Conservation and Open Space, Adopted February 1, 1996.
City of Indian Wells, 2008. Indian Wells Municipal Code, Chapter 8.20, Fugitive Dust Control. Accessed online (http://qcode.us/codes/indianwells/) June 18, 2008.
City of Palm Desert, 2004. City of Palm Desert General Plan, Environmental Resources Chapter, Air Quality Element, adopted March 15, 2004.
City of Palm Desert. 2008. Palm Desert Municipal Code, Chapter 24.12, Fugitive Dust (PM10) Control, Accessed online (http://www.qcode.us/codes/palmdesert/) June 12, 2008.
City of Palm Springs, 2007. Palm Springs General Plan. Chapter 7 – Air Quality Element, adopted October 2007.
City of Palm Springs. 2008. Palm Springs Municipal Code, Chapter 8.50, Fugitive Dust Control. Accessed online (http://www.qcode.us/codes/palmsprings/) June 11, 2008.
City of Rancho Mirage, 2005. Rancho Mirage General Plan, Chapter 6 – Air Quality Element, adopted November 2005.
City of Rancho Mirage, 2008. Rancho Mirage Municipal Code, Chapter 7.01, Control of PM10, Fugitive Dust and Other Emissions. Accessed online (http://www.amlegal.com/nxt/gateway.dll/California/ranchomirage/ ranchomiragemunicipalcode?f=templates$fn=default.htm$3.0$vid=amlegal:ranchomirage_ca) June 12, 2008.
Governor’s Office of Planning and Research (OPR), 2008. CEQA AND CLIMATE CHANGE: Addressing Climate Change Through California Environmental Quality Act (CEQA) Review. Sacramento, CA: OPR. Retrieved October 23, 2008, from http://opr.ca.gov/index.php?a=ceqa/index.html.
OPR, 2009. CEQA Guidelines Sections Proposed to be Added or Amended, submitted to Natural Resources Agency on April 13, 2009, accessed online (http://www.opr.ca.gov/ceqa/pdfs/PA_CEQA_Guidelines.pdf), November 13, 2009.
Intergovernmental Panel on Climate Change (IPCC), 2001. Climate Change 2001: Working Group I: The Scientific Basis, Section F.5, Table 4; http://www.grida.no/climate/ipcc%5Ftar/wg1/032.htm#f5, accessed June 11, 2008.
Riverside County, 2003. Riverside County General Plan – Chapter 9: Air Quality Element, adopted October 7, 2003.
South Coast Air Quality Management District (SCAQMD), 1993. CEQA Air Quality Handbook, April 1993.

4. Environmental Analysis Air Quality
Devers-Mirage 115kV Subtransmission System Split Project 4.3-47 ESA / 207059 (A.08-01-029) Draft Environmental Impact Report January 2010
SCAQMD, 2006. Final Methodology to Calculate PM2.5 and PM2.5 Significance Thresholds, Appendix A – Updated CEIDARS Table with PM2.5 Fractions, October 2006.
SCAQMD, 2008a. Off-road Mobile Source Emission Factors, Accessed online (http://www.aqmd.gov/CEQA/handbook/offroad/offroad.html) June 19, 2008, by ESA for review of SCE calculations.
SCAQMD, 2008b. EMFAC 2007 (v2.3) Emission Factors (On-Road), Accessed online (http://www.aqmd.gov/CEQA/handbook/onroad/onroad.html) June 19, 2008, by ESA for review of SCE calculations.
SCAQMD, 2008c. Mitigation Measures and Control Efficiencies, Fugitive Dust, Accessed online (http://www.aqmd.gov/CEQA/handbook/mitigation/fugitive/MM_fugitive.html) June 20, 2008.
SCAQMD, 2008d. Localized Significance Threshold Methodology, Appendix C – Mass Rate LST Look-up Table, revised July 2008.
SCAQMD, 2008e. Interim CEQA GHG Significance Threshold for Stationary Sources, Rules and Plans, accessed online (http://www.aqmd.gov/hb/2008/December/081231a.htm), last updated November 26, 2008.
SCAQMD, 2009. SCAQMD Air Quality Significance Thresholds, website (http://www.aqmd.gov/CEQA/handbook/signthres.pdf) accessed October 23, 2009, last revised March 2009.
Southern California Edison (SCE), 2008. Proponents Environmental Assessment: Devers-Mirage 115 kV Subtransmission System Split Project, Appendix F1: Air Quality Calculations, January 2008.
USEPA (United States Environmental Protection Agency), 1992. Procedures for Emission Inventory Preparation, Volume IV, Mobile Sources, Accessed online (http://www.epa.gov/oms/invntory/r92009.pdf) June 19, 2008.
USEPA, 2006. SF6 Leak Rates from High Voltage Circuit Breakers – U.S. EPA Investigates Potential Greenhouse Gas Emissions Source. IEEE Power Engineering Society General Meeting, Montreal, Quebec, Canada, June 2006. Obtained online (http://www.epa.gov/electricpower-sf6/documents/leakrates_circuitbreakers.pdf).
WRCC (Western Regional Climate Center), 2009a. Climate of California Narrative, website (http://www.wrcc.dri.edu/narratives/CALIFORNIA) accessed on October 21, 2009.
WRCC, 2009b. Period of Record Monthly Climate Summaries for Palm Springs, California, website (http://www.wrcc.dri.edu/summary/Climsmsca.html) accessed on October 21, 2009.