4232/02 s15-4232-02 geography - revision world
TRANSCRIPT
42
32
02
00
01
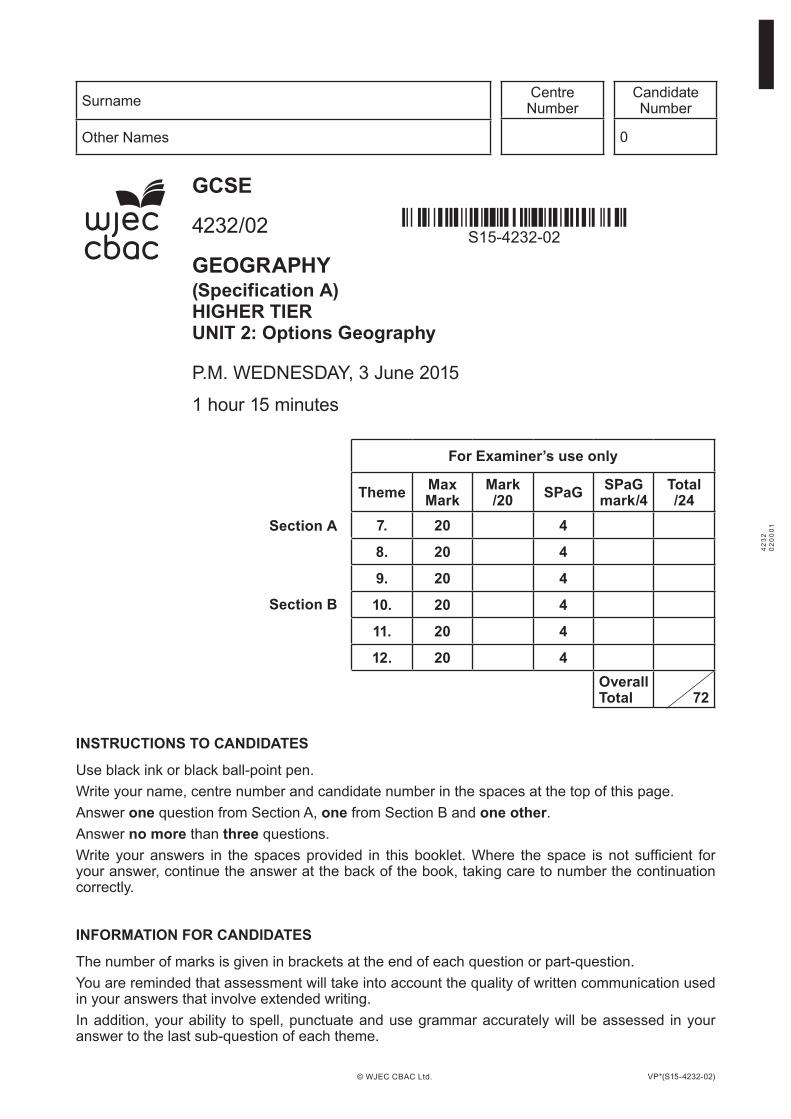
INSTRUCTIONS TO CANDIDATES
Use black ink or black ball-point pen.Write your name, centre number and candidate number in the spaces at the top of this page.Answer one question from Section A, one from Section B and one other.Answer no more than three questions.Write your answers in the spaces provided in this booklet. Where the space is not sufficient for your answer, continue the answer at the back of the book, taking care to number the continuation correctly.
INFORMATION FOR CANDIDATES
The number of marks is given in brackets at the end of each question or part-question.You are reminded that assessment will take into account the quality of written communication used in your answers that involve extended writing.In addition, your ability to spell, punctuate and use grammar accurately will be assessed in your answer to the last sub-question of each theme.
VP*(S15-4232-02)
Surname
Other Names
CandidateNumber
0
CentreNumber
© WJEC CBAC Ltd.
GCSE
4232/02
GEOGRAPHY(Specification A)HIGHER TIERUNIT 2: Options Geography
P.M. WEDNESDAY, 3 June 2015
1 hour 15 minutes
S15-4232-02
For Examiner’s use only
Theme MaxMark
Mark/20 SPaG SPaG
mark/4Total/24
7. 20 4
8. 20 4
9. 20 4
10. 20 4
11. 20 4
12. 20 4Overall Total 72
Section A
Section B

2
(4232-02)
ExamineronlySECTION A - PHYSICAl OPTIONS
Answer at least one question from this section, but no more than two.
Theme 7 – Our Changing Coastline
1. (a) Study the OS map of part of the Dorset coastline in southern England.
A full key appears on page 32.
© WJEC CBAC Ltd.
0 1km
N
01
80
79 79
81
82
83
80
81
82
83
02 03 04 05 06
01 02 03 04 05 06
(i) Describe the relief in grid square 0381. [2]

(4232-02) Turn over.
42
32
02
00
03
3Examiner
only
© WJEC CBAC Ltd.
(ii) Using evidence from the OS map, and your own knowledge, annotate the sketch below to explain why headlands and bays form along this coastline. [4]

4
(4232-02)
Examineronly
© WJEC CBAC Ltd.
Explain the changes in global sea level shown by the graph. [6]
(b) Study the information below that shows recent changes in global sea level.
1880 1900 19401920
Year1960 1980 2000
30
35Se
a le
vel c
hang
e (c
m) 25
20
15
10
0
– 5
5

(4232-02) Turn over.
42
32
02
00
05
5
© WJEC CBAC Ltd.
Examineronly
(c) Describe how soft engineering can be used to manage the coastline. Explain the advantages and disadvantages of soft engineering in an area (or areas) of
coastline you have studied. [8 + 4]
Marks for spelling, punctuation and the accurate use of grammar are allocated to this question.
End of Theme 7 question
8 4

6
(4232-02)
Examineronly
© WJEC CBAC Ltd.
Theme 8 – Weather and Climate
2. (a) Study the map below. It shows the maximum temperatures experienced in the UK in July 2006.
Key
0 100 km
N
26 and aboveMaximum temperature (°C)
24 – 25.922 – 23.920 – 21.918 – 19.916 – 17.9
(i) Describe the pattern shown on the map. [2]

(4232-02) Turn over.
42
32
02
00
07
7Examiner
only
© WJEC CBAC Ltd.
(ii) Using information from the map and your own knowledge, annotate the map below to explain the pattern of July temperatures. [4]

8
(4232-02)
Examineronly
© WJEC CBAC Ltd.
(b) Explain why low pressure systems (depressions) bring variations in the weather as they move across the UK.
You must add information to the diagram to support your answer. [6]
warm front
Western UK Eastern UKmovement of depression
cold front

(4232-02) Turn over.
42
32
02
00
09
9Examiner
only
© WJEC CBAC Ltd.
(c) Describe how weather hazards can affect the environment and economy of a country (or countries) you have studied. [8 + 4]
Marks for spelling, punctuation and the accurate use of grammar are allocated to this question.
End of Theme 8 question
8 4

10
(4232-02)
Examineronly
© WJEC CBAC Ltd.
Theme 9 – living Things
3. (a) Study the graph which shows the relationship between population growth and the number of species that have become extinct between 1800 and 2010.
1800
60 000 8 000
7 000
6 000
5 000
4 000
3 000
2 000
1 000
0
50 000
40 000
30 000
20 000
10 000
01830 1860 1890 1920
Year
Hum
an p
opul
atio
n (m
illio
ns)
Num
ber o
f ext
inct
spe
cies
1950 1980 2010
(i) Describe the relationship shown in the graph. [2]

11
© WJEC CBAC Ltd. (4232-02) Turn over.
42
32
02
00
11
Examineronly
(ii) Study the photograph below which shows an area that has been mined in a tropical rainforest. Annotate the photograph to describe how people can have a negative impact on the environment within this ecosystem. [4]

12
(4232-02)
Examineronly
© WJEC CBAC Ltd.
(b) Explain why a named ecosystem needs to be managed more sustainably in the future. [6]

(4232-02) Turn over.
42
32
02
00
13
13Examiner
only (c) Explain why the global distribution of large scale ecosystems (biomes) is influenced by climate.
You must refer to more than one large scale ecosystem (biome) in your answer. [8 + 4]
Marks for spelling, punctuation and the accurate use of grammar are allocated to this question.
End of Theme 9 question
© WJEC CBAC Ltd.
8 4

(4232-02)
14Examiner
only
© WJEC CBAC Ltd.
SECTION B – HUMAN OPTIONS
Answer at least one question from this section, but no more than two.
Theme 10 – Tourism
4. (a) Study the graph below which shows the number of cruise ship passengers carried worldwide between 1990 and 2015.
The number of cruise ship passengers worldwide
1990 1995 2000
Year
2005 2010 2015
20
25
Num
ber o
f pas
seng
ers
(mill
ions
)
15
10
5
0
(i) Describe the trend shown on the graph. [2]

15
(4232-02)
Examineronly
© WJEC CBAC Ltd.
(ii) Study the photographs below which show cruise ships at ports in a Caribbean island. Annotate the photographs to suggest some impacts of cruise holidays in this region. [4]
42
32
02
00
15
Turn over.

16
(4232-02)
Examineronly
© WJEC CBAC Ltd.
(b) Describe how tourism has changed in recent years. Use one or more named locations to support your answer. [6]

(4232-02) Turn over.
17Examiner
only
© WJEC CBAC Ltd.
8 4
(c) What are the impacts of the development of tourism on people in two regions at different levels of economic development?
Use named regions to support your answer. Label the regions correctly on the map. [8 + 4]
Marks for spelling, punctuation and the accurate use of grammar are allocated to this question.

18
(4232-02)
Examineronly
End of Theme 10 question
© WJEC CBAC Ltd.

BlANK PAGE
(4232-02) Turn over.
19
© WJEC CBAC Ltd.

Theme 11 – Retail and Urban Change
5. (a) Study the graphs below. They show where retailing occurs in a city and the changes that have taken place.
Percentage of shopping in different parts of the city
20
(4232-02)
Examineronly
© WJEC CBAC Ltd.
49.4%
28.1%
17.4%
5.1%
2000
City centre Internet Local shops Retail park
2014
39.8%
32.3%
15.7%
12.2%
(i) Describe the main changes shown by the graphs. [2]

(4232-02) Turn over.
21Examiner
only
© WJEC CBAC Ltd.
(ii) Amazon is a large internet retailer. Look at the map which shows the location of the Amazon Distribution Centre on the outskirts of Milton Keynes in England.
A full key appears on page 32.
Annotate the map to suggest why this site was chosen by Amazon for a Distribution Centre. [4]
0 1km
N
93 94 95 96 97 98 99
93 94 95 96 97 98 99
36
35
38
37
40
39
AmazonDistribution
Centre

22
(4232-02)
Examineronly
© WJEC CBAC Ltd.
(b) Study the map and photograph below. They show part of Liverpool city centre which has been regenerated in recent years.
River Mersey
WATERFRONT
Albert Dock
Arena &conventioncentre
Cavern Quarter
TateGallery
Museumof Liverpool
Maritimemuseum
LIVERPOOL ONE
P
P
P
PP
P
Rail StationKEY
World Heritage SiteParkingHotel
liverpool City Centre
liverpool One Shopping Centre

(4232-02) Turn over.
23
© WJEC CBAC Ltd.
Examineronly
Use this information and your own knowledge of a European city to describe how regenerating a city centre can bring advantages to people. [6]

24
(4232-02)
Examineronly
© WJEC CBAC Ltd.
(c) Describe how increasing consumer choice in Europe can have impacts on people in developing countries. [8 + 4]
Marks for spelling, punctuation and the accurate use of grammar are allocated to this question.
End of Theme 11 question
8 4

(4232-02) Turn over.
25Examiner
only
© WJEC CBAC Ltd.
Theme 12 – Economic Change and Wales
6. (a) Study the graph below.
2007 2008 2009
Year
2010 2011 2012 2013
240 000
250 000
Num
ber o
f vis
itors
230 000
220 000
210 000
200 000
Number of visitors to the Royal Welsh Show
(i) Describe the changes shown by the graph. [2]

26
(4232-02)
Examineronly
© WJEC CBAC Ltd.
(ii) The OS map shows the location of the Royal Welsh Showground in Llanelwedd.
A full key appears on page 32.
Annotate the map to identify two advantages of this location as the permanent site for the Show. [4]
0 1km
N
0050
51
52
53
50
51
52
53
01 02 03 04 05 06
00 01 02 03 04 05 06

(4232-02) Turn over.
27Examiner
only
© WJEC CBAC Ltd.
(b) Read the information below about investment in renewable energy in Wales.
Royal Welsh Show: Welsh investing millions in renewablesMonday 23 July 2012
Farmers in Wales are investing millions of pounds in income-generating renewable energy schemes.
It is predicted that renewable energy will play an increasingly crucial role in the future of Welsh farming as a secondary income.
Describe the physical factors that are encouraging people in Wales to invest in renewable energy schemes. [6]

28
(4232-02)
Examineronly
© WJEC CBAC Ltd.
(c) Describe ways in which farming has changed in Wales. Explain the social impact of such changes. [8 + 4]
Marks for spelling, punctuation and the accurate use of grammar are allocated to this question.
End of Theme 12 question
END OF PAPER
8 4

(4232-02) Turn over.
29Examiner
onlyFor continuation only.
© WJEC CBAC Ltd.

30
(4232-02)
Examineronly
© WJEC CBAC Ltd.

(4232-02) Turn over.
31
© WJEC CBAC Ltd.
BlANK PAGE

32
(4232-02)© WJEC CBAC Ltd.