4.1.1 change in real gross domestic product · 2014. source: sloos, haver analytics net percentage...
TRANSCRIPT

-4
-2
0
2
4
-4
-2
0
2
4
2006 2007 2008 2009 2010 2011 2012 2013 2014
Source: BEA, Haver Analytics
As Of: 2014 Q4 Percent 4.1.1 Change in Real Gross Domestic Product
Note: Annual changes are Q4/Q4.
Percent

-4
-2
0
2
4
-4
-2
0
2
4
2006 2007 2008 2009 2010 2011 2012 2013 2014
Source: BEA, Haver Analytics
As Of: 2014 Q4 Percent 4.1.2 Change in Real Personal Consumption Expenditures
Note: Annual changes are Q4/Q4.
Percent

0.0
0.1
0.2
0.3
0.4
0.5
0.0
0.5
1.0
1.5
2.0
2002 2004 2006 2008 2010 2012 2014
Source: Census Bureau, Haver Analytics
As Of: Mar-2015 Millions of Units 4.1.3 Private Housing Starts
Note: Seasonally adjusted at an annualized rate. Multifamily housing starts are calculated on a 3-month moving average. Gray bar signifies NBER recession.
Millions of Units
Single-family (left axis)
Multifamily (right axis)
0
2
4
6
8
10
12
0
2
4
6
8
10
12
2005 2006 2007 2008 2009 2010 2011 2012 2013 2014 2015
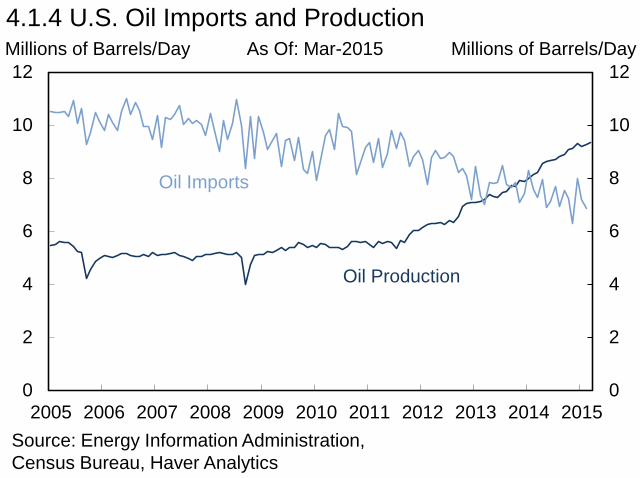
4.1.4 U.S. Oil Imports and Production Millions of Barrels/Day Millions of Barrels/Day
Source: Energy Information Administration, Census Bureau, Haver Analytics
As Of: Mar-2015
Oil Imports
Oil Production

-1000
-800
-600
-400
-200
0
200
400
600
-1000
-800
-600
-400
-200
0
200
400
600
2006 2007 2008 2009 2010 2011 2012 2013 2014 2015
Source: BLS, Haver Analytics
As Of: Apr-2015 Thousands of Jobs 4.1.5 Net Change in Nonfarm Payroll Employment
Note: Gray bar signifies NBER recession.
Thousands of Jobs
Monthly Change
3-Month Moving Average
3
6
9
12
3
6
9
12
1982 1987 1992 1997 2002 2007 2012
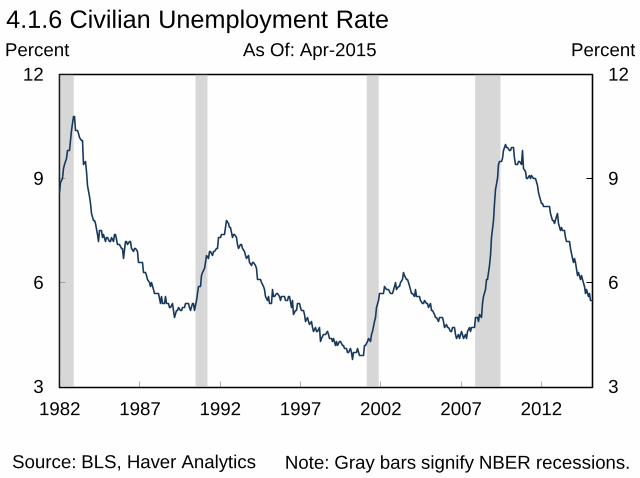
Source: BLS, Haver Analytics
As Of: Apr-2015 Percent 4.1.6 Civilian Unemployment Rate
Note: Gray bars signify NBER recessions.
Percent
62
63
64
65
66
67
68
62
63
64
65
66
67
68
1982 1987 1992 1997 2002 2007 2012
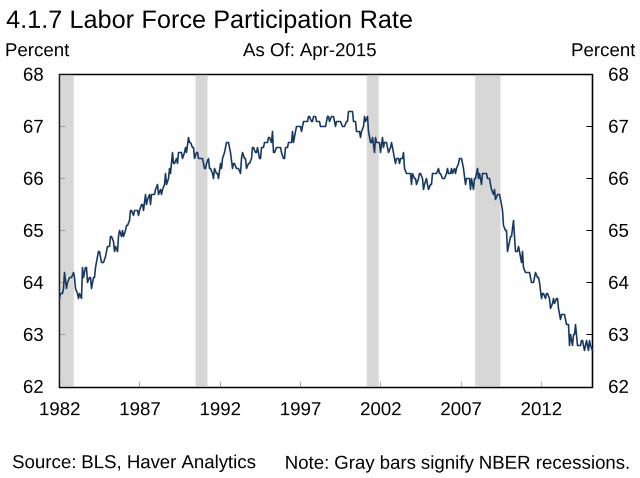
Source: BLS, Haver Analytics
As Of: Apr-2015 Percent 4.1.7 Labor Force Participation Rate
Note: Gray bars signify NBER recessions.
Percent
0
10
20
30
40
50
0
10
20
30
40
50
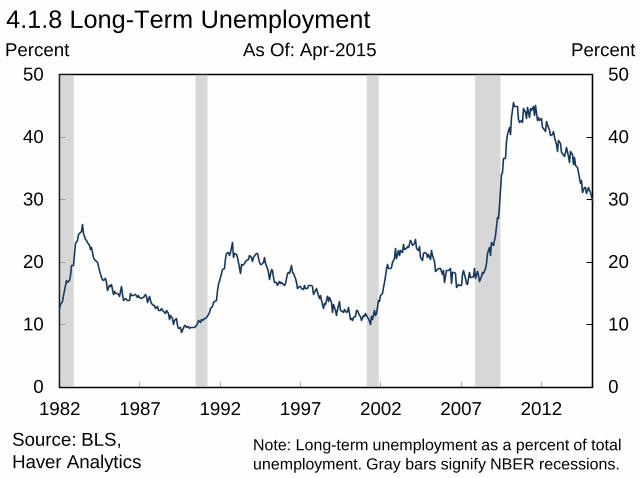
1982 1987 1992 1997 2002 2007 2012Source: BLS, Haver Analytics
As Of: Apr-2015 Percent 4.1.8 Long-Term Unemployment
Note: Long-term unemployment as a percent of total unemployment. Gray bars signify NBER recessions.
Percent

0
50
100
150
200
0
50
100
150
200
1992 1996 2000 2004 2008 2012
Source: BEA, Financial Accounts of the United States, Haver Analytics
As Of: 2014 Q4 Percent of Nominal GDP 4.2.1 Private Nonfinancial Debt
Percent of Nominal GDP
Consumer and Other Household Debt
Nonfinancial Noncorporate Debt Nonfinancial Corporate Debt
Mortgages
Note: Other Household Debt includes debts of both households and nonprofits.

16
18
20
22
24
26
28
16
18
20
22
24
26
28
1980 1985 1990 1995 2000 2005 2010Source: Financial Accounts of the United States, Haver Analytics
As Of: 2014 Q4 Percent 4.2.2 Debt to Assets for Nonfinancial Corporations
Note: Gray bars signify NBER recessions.
Percent

-100
-50
0
50
100
-100
-50
0
50
100
2000 2002 2004 2006 2008 2010 2012 2014Source: SLOOS, Haver Analytics
As Of: Feb-2015 Net Percentage 4.2.3 Bank Business Lending Standards and Demand
Note: Data includes firms with annual sales of $50 million or more over the last 3 months. Net percentage balance of responses. Gray bars signify NBER recessions.
Net Percentage
Reporting Stronger Demand from Large and
Medium-Sized Firms
Reporting Tighter Standards for Large and
Medium-Sized Firms
0
1
2
3
4
0
1
2
3
4
2000 2002 2004 2006 2008 2010 2012 2014
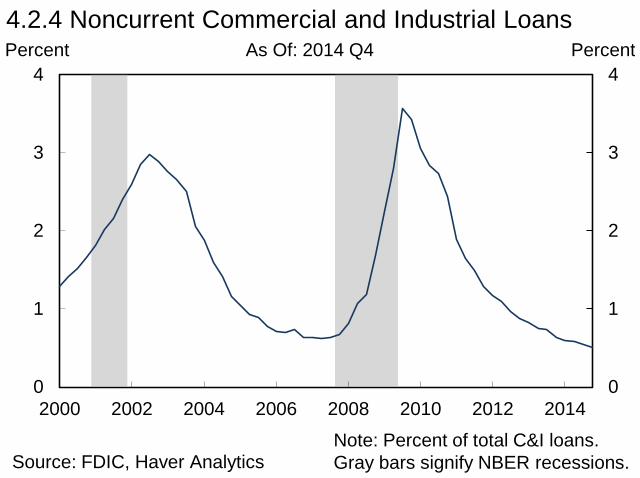
Source: FDIC, Haver Analytics
As Of: 2014 Q4 Percent 4.2.4 Noncurrent Commercial and Industrial Loans
Note: Percent of total C&I loans. Gray bars signify NBER recessions.
Percent
0
2
4
6
8
10
0
2
4
6
8
10
1981 1986 1991 1996 2001 2006 2011
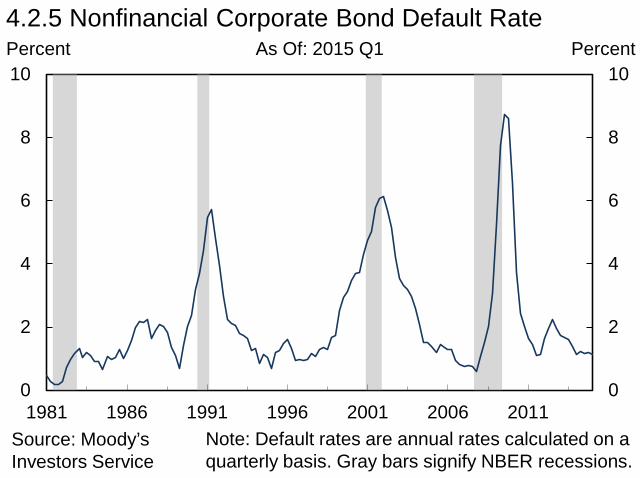
4.2.5 Nonfinancial Corporate Bond Default Rate Percent Percent
Source: Moody’s Investors Service
Note: Default rates are annual rates calculated on a quarterly basis. Gray bars signify NBER recessions.
As Of: 2015 Q1

0
20
40
60
80
100
0
20
40
60
80
100
1990 1994 1998 2002 2006 2010 2014Source: Financial Accounts of the United States, Haver Analytics
As Of: 2014 Q4 Percent of Total Assets 4.2.6 Nonfinancial Noncorporate Assets
Percent of Total Assets
Other Assets
Cash and Securities
Nonresidential Real Estate
Accounts Receivable
Residential Real Estate
-400
-200
0
200
400
600
-400
-200
0
200
400
600
2000 2002 2004 2006 2008 2010 2012 2014Source: Financial Accounts of the United States, Haver Analytics
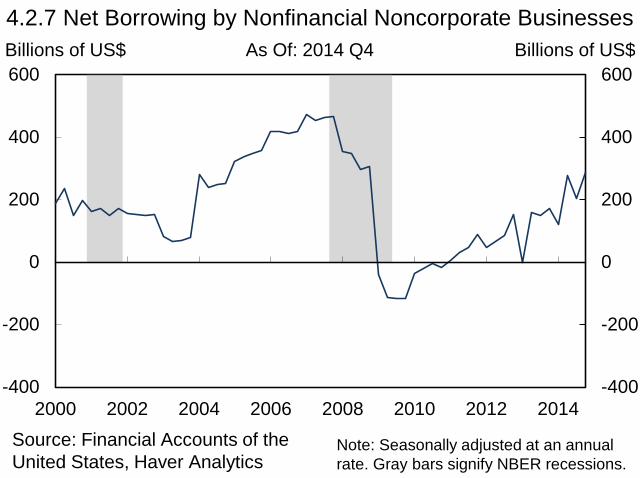
As Of: 2014 Q4 Billions of US$ 4.2.7 Net Borrowing by Nonfinancial Noncorporate Businesses
Note: Seasonally adjusted at an annual rate. Gray bars signify NBER recessions.
Billions of US$

-100
-50
0
50
100
-100
-50
0
50
100
2000 2002 2004 2006 2008 2010 2012 2014Source: SLOOS, Haver Analytics
As Of: Feb-2015 Net Percentage 4.2.8 Bank Business Lending Standards and Demand
Note: Data includes firms with annual sales of less than $50 million over the last 3 months. Net percentage balance of responses. Gray bars signify NBER recessions.
Net Percentage
Reporting Stronger Demand from Small
Firms
Reporting Tighter Standards for Small
Firms
0
4
8
12
16
0
4
8
12
16
2000 2002 2004 2006 2008 2010 2012 2014
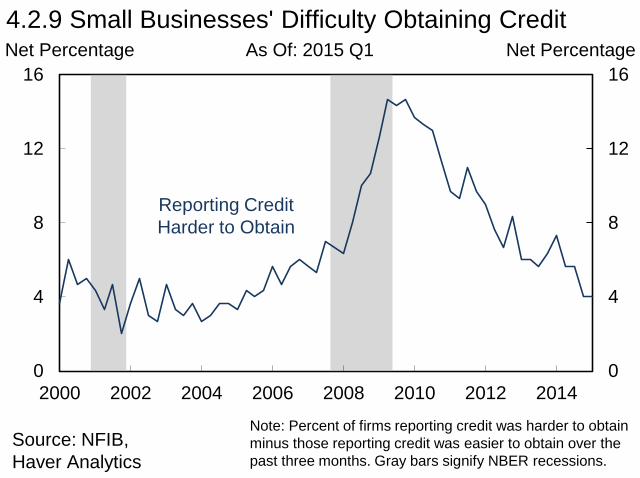
Source: NFIB, Haver Analytics
As Of: 2015 Q1 Net Percentage 4.2.9 Small Businesses' Difficulty Obtaining Credit
Note: Percent of firms reporting credit was harder to obtain minus those reporting credit was easier to obtain over the past three months. Gray bars signify NBER recessions.
Net Percentage
Reporting Credit Harder to Obtain

0
25
50
75
100
125
150
0
25
50
75
100
125
150
1992 1996 2000 2004 2008 2012
Source: BEA, Financial Accounts of the United States, Haver Analytics
As Of: 2014 Q4 Percent
4.2.10 Household Debt as a Percent of Disposable Personal Income
Note: Other Household Credit includes debts of both households and nonprofits.
Percent
Other Household Credit Consumer Credit Mortgages

9
10
11
12
13
14
15
9
10
11
12
13
14
15
1980 1985 1990 1995 2000 2005 2010
Source: Federal Reserve, Haver Analytics
As Of: 2014 Q4 Percent 4.2.11 Household Debt Service Ratio
Note: Ratio of debt service payments to disposable personal income. Seasonally adjusted. Gray bars signify NBER recessions.
Percent

0
3
6
9
12
15
0
3
6
9
12
15
2003 2005 2007 2009 2011 2013
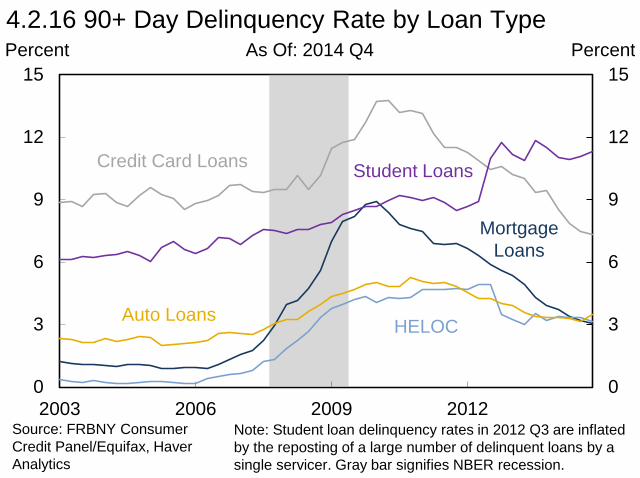
Source: FRBNY Consumer Credit Panel/Equifax, Haver Analytics
As Of: 2014 Q4 Percent 4.2.12 Share of Household Debt by Delinquency Status
Note: Severely derogatory loans are loans for which there are reports of a repossession, charge off to bad debt, or foreclosure.
Percent
Severely Derogatory 120+ Days Late 90 Days Late 60 Days Late 30 Days Late

-40
-20
0
20
40
60
80
100
120
-40
-20
0
20
40
60
80
100
120
2000 2002 2004 2006 2008 2010 2012 2014Source: Financial Accounts of the United States, Haver Analytics
As Of: 2014 Q4 Trillions of US$ 4.2.13 Household and Nonprofit Balance Sheets
Note: Other Assets primarily include life insurance reserves, pension entitlements, and noncorporate equities. Other Debt primarily includes security credit, trade payables, and unpaid life insurance premiums.
Trillions of US$
Other Assets Equities Credit Market Instruments Cash Instruments Real Estate
Mortgages Consumer Credit Other Debt
Net Worth

30
40
50
60
70
30
40
50
60
70
1990 1994 1998 2002 2006 2010 2014
1990-2005 Average
4.2.14 Owners’ Equity as Share of Household Real Estate Percent Percent
Source: Financial Accounts of the United States, Haver Analytics
Note: Gray bars signify NBER recessions.
As Of: 2014 Q4

0
200
400
600
800
1000
1200
0
200
400
600
800
1000
1200
2003 2006 2009 2012Source: FRBNY Consumer Credit Panel/Equifax, Haver Analytics
As Of: 2014 Q4 Billions of US$ 4.2.15 Components of Consumer Credit
Note: Gray bar signifies NBER recession.
Billions of US$
Credit Card Debt
Auto Loans
Student Loans
Other Household Debt
0
3
6
9
12
15
0
3
6
9
12
15
2003 2006 2009 2012Source: FRBNY Consumer Credit Panel/Equifax, Haver Analytics
As Of: 2014 Q4 Percent 4.2.16 90+ Day Delinquency Rate by Loan Type
Note: Student loan delinquency rates in 2012 Q3 are inflated by the reposting of a large number of delinquent loans by a single servicer. Gray bar signifies NBER recession.
Percent
Mortgage Loans
HELOC Auto Loans
Credit Card Loans Student Loans
13
16
19
22
25
13
16
19
22
25
1965 1975 1985 1995 2005 2015 2025
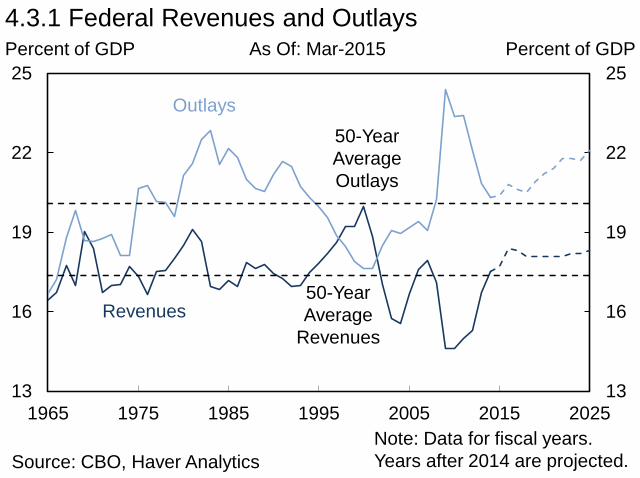
Percent of GDP As Of: Mar-2015 4.3.1 Federal Revenues and Outlays
Source: CBO, Haver Analytics
Percent of GDP
Revenues
Outlays
Note: Data for fiscal years. Years after 2014 are projected.
50-Year Average Outlays
50-Year Average
Revenues

0
2
4
6
8
10
0
2
4
6
8
10
1965 1975 1985 1995 2005 2015 2025
Percent of GDP As Of: Mar-2015 4.3.2 Outlays in Major Budget Categories
Source: CBO, Haver Analytics
Percent of GDP
Medicare and Medicaid Social Security Other Mandatory Defense Discretionary Nondefense Discretionary Net Interest
Note: Other Mandatory comprises all mandatory spending other than that for Medicare, Medicaid, and Social Security. Data for fiscal years. Years after 2014 are projected.
0
30
60
90
120
150
0
30
60
90
120
150
1948 1958 1968 1978 1988 1998 2008 2018
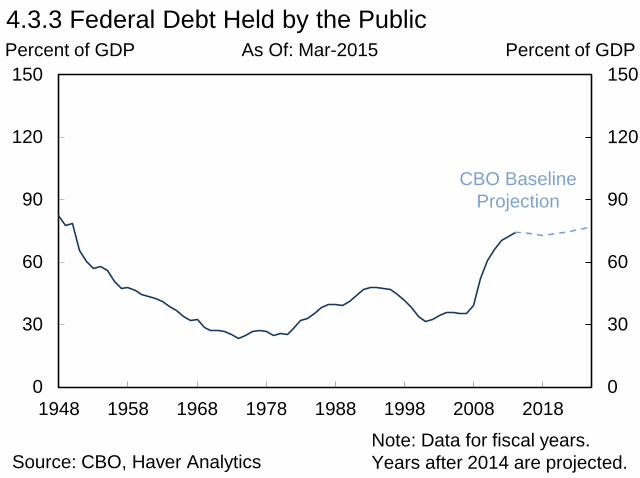
Source: CBO, Haver Analytics
As Of: Mar-2015 Percent of GDP 4.3.3 Federal Debt Held by the Public
Note: Data for fiscal years. Years after 2014 are projected.
Percent of GDP
CBO Baseline Projection

40
44
48
52
56
60
64
68
72
1.0
1.4
1.8
2.2
2.6
3.0
3.4
1981 1986 1991 1996 2001 2006 2011Source: BEA, OMB, Haver Analytics
As Of: 2014 Q4 Percent of GDP
4.3.4 Interest Outlays and Average Maturity of U.S. Public Debt
Note: Gray bars signify NBER recessions.
Months
Interest Outlays (left axis)
Average Maturity of Outstanding Debt
(right axis)

-6-4-202468101214
-6-4-202468
101214
1998 2000 2002 2004 2006 2008 2010 2012 2014
4.3.5 Change in State and Local Government Tax Revenues Percent Percent
Source: Census Bureau
Note: Data represents year-over-year change. Revenue measures includes revenues from property, individual income, corporate income, and sales taxes. Gray bars signify NBER recessions.
As Of: 2014 Q4

17.5
18.0
18.5
19.0
19.5
20.0
17.5
18.0
18.5
19.0
19.5
20.0
2000 2002 2004 2006 2008 2010 2012 2014
Source: BLS, Haver Analytics
As Of: Apr-2015 Millions of Employees 4.3.6 State and Local Government Employment
Note: Gray bars signify NBER recessions.
Millions of Employees
-20
-15
-10
-5
0
5
10
15
-20
-15
-10
-5
0
5
10
15
2007 2008 2009 2010 2011 2012 2013 2014 2015
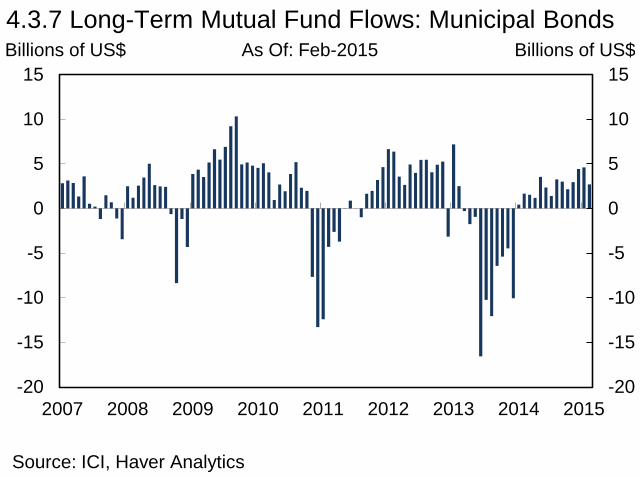
Source: ICI, Haver Analytics
As Of: Feb-2015 Billions of US$ 4.3.7 Long-Term Mutual Fund Flows: Municipal Bonds
Billions of US$

Billions of US$
0
100
200
300
400
500
600
0
100
200
300
400
500
600
2004 2006 2008 2010 2012 2014
New Capital Refunding
4.3.8 Municipal Bond Issuance Billions of US$
Source: Thomson Reuters, SIFMA
As Of: 2014
Note: Excludes maturities of 13 months or less and private placements.

4.3.9 Municipal Bond Spreads
Source: Thomson Reuters MMD
-200
0
200
400
600
800
-200
0
200
400
600
800
2008 2009 2010 2011 2012 2013 2014 2015
Basis Points Basis Points As Of: 31-Mar-2015
Note: Spreads between 10-year municipal and 10-year Treasury securities.
AAA GO
Michigan California
A GO
Illinois Puerto Rico
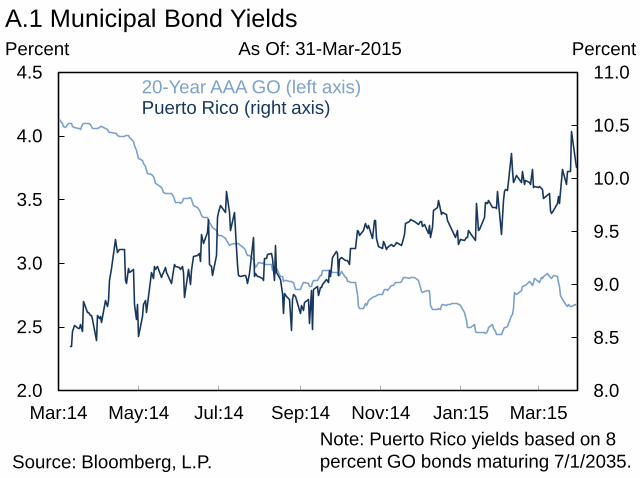
A.1 Municipal Bond Yields
Source: Bloomberg, L.P.
8.0
8.5
9.0
9.5
10.0
10.5
11.0
2.0
2.5
3.0
3.5
4.0
4.5
Mar:14 May:14 Jul:14 Sep:14 Nov:14 Jan:15 Mar:15
Percent Percent As Of: 31-Mar-2015
20-Year AAA GO (left axis) Puerto Rico (right axis)
Note: Puerto Rico yields based on 8 percent GO bonds maturing 7/1/2035.

-8
-6
-4
-2
0
2
4
6
8
-8
-6
-4
-2
0
2
4
6
8
2014 Q1 2014 Q2 2014 Q3 2014 Q4
4.4.1 Advanced Economies Real GDP Growth Percent Percent As Of: 2014 Q4
Source: Eurostat, CAO, BEA, Haver Analytics
Note: Data represents seasonally adjusted quarter-over-quarter annualized real GDP growth rates.
United Kingdom Japan
Euro Area
United States
-6
-4
-2
0
2
4
6
8
10
-6
-4
-2
0
2
4
6
8
10
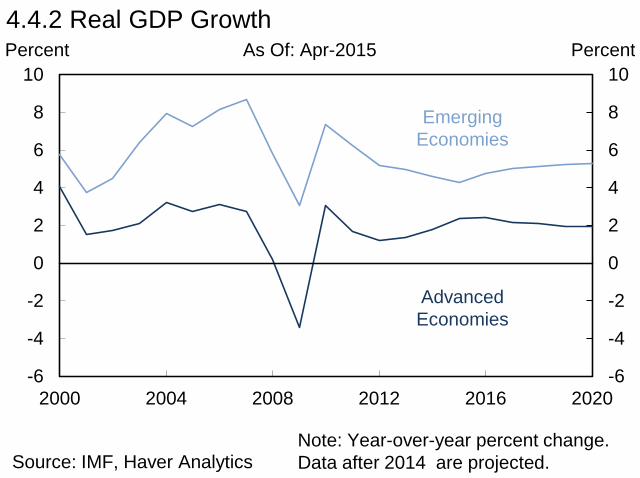
2000 2004 2008 2012 2016 2020
Source: IMF, Haver Analytics
As Of: Apr-2015 Percent 4.4.2 Real GDP Growth
Note: Year-over-year percent change. Data after 2014 are projected.
Percent
Advanced Economies
Emerging Economies

-6
-4
-2
0
2
4
6
-6
-4
-2
0
2
4
6
2002 2005 2008 2011 2014 2017 2020
Source: IMF, Haver Analytics
As Of: Apr-2015 Percent 4.4.3 Euro Area Real GDP Growth
Note: Year-over-year percent change. Data after 2014 are projected.
Percent
Spain France Euro Area Italy Germany

-1
0
1
2
3
4
5
-1
0
1
2
3
4
5
2005 2006 2007 2008 2009 2010 2011 2012 2013 2014 2015
4.4.4 Euro Area Consumer Price Inflation Percent Percent
Source: Statistical Office of the European Communities, Haver Analytics
As Of: Mar-2015
Headline Current Target
Note: Year-over-year percent change.
Core

-8
-6
-4
-2
0
2
4
6
8
-8
-6
-4
-2
0
2
4
6
8
2014Q1
2014Q2
2014Q3
2014Q4
2015 2016 2017
4.4.5 Japanese Real GDP Growth Percent Percent As Of: 2014 Q4
Source: Cabinet Office of Japan, IMF, Haver Analytics
Note: Data from 2014 represents seasonally adjusted annualized quarter-over-quarter real GDP growth rates. Data from 2015 and beyond represents seasonally adjusted year-over-year real GDP growth rates. Data after 2014 is projected.
-3
-2
-1
0
1
2
3
-3
-2
-1
0
1
2
3
1997 2000 2003 2006 2009 2012 2015
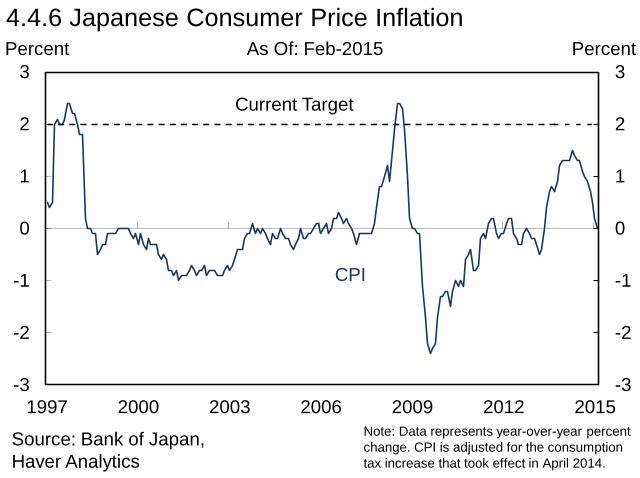
4.4.6 Japanese Consumer Price Inflation Percent Percent
Source: Bank of Japan, Haver Analytics
As Of: Feb-2015
CPI
Current Target
Note: Data represents year-over-year percent change. CPI is adjusted for the consumption tax increase that took effect in April 2014.

0
2
4
6
8
10
12
14
16
0
2
4
6
8
10
12
14
16
2000 2002 2004 2006 2008 2010 2012 2014
4.4.7 Chinese Real GDP Growth Percent Percent
Source: China National Bureau of Statistics, Haver Analytics
As Of: 2014
Note: Year-over-year percent change from the fourth quarter of the previous year.
100
104
108
112
116
120
-15
-10
-5
0
5
10
15
2011 2012 2013 2014 2015
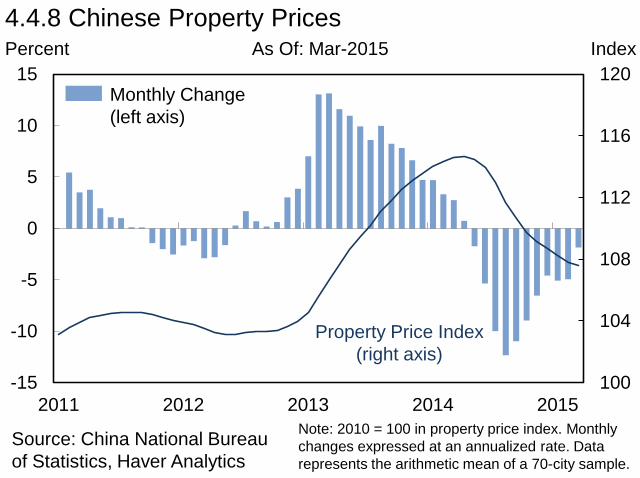
4.4.8 Chinese Property Prices Percent Index
Source: China National Bureau of Statistics, Haver Analytics
As Of: Mar-2015
Note: 2010 = 100 in property price index. Monthly changes expressed at an annualized rate. Data represents the arithmetic mean of a 70-city sample.
Monthly Change (left axis)
Property Price Index (right axis)

Percent As Of: Mar-2015 4.4.9 Chinese Credit Growth
Source: The People’s Bank of China, Haver Analytics
0
10
20
30
40
50
60
70
0
10
20
30
40
50
60
70
2008 2009 2010 2011 2012 2013 2014 2015
Percent
Bank Credit
Nonbank Credit
Total Credit
Note: 12-month percentage change of 3-month rolling average.

Percent As Of: Mar-2015 4.4.10 Components of Chinese Nonbank Credit Growth
Source: The People’s Bank of China, Haver Analytics
-50
0
50
100
150
200
250
300
-50
0
50
100
150
200
250
300
2008 2009 2010 2011 2012 2013 2014 2015
Percent
Other Nonfinancial Equity Financing Bankers’ Acceptance Bills Trust Loans Entrusted Loans
Note: 12-month percentage change of 3-month rolling average.

100
120
140
160
180
200
100
120
140
160
180
200
2008 2009 2010 2011 2012 2013 2014
4.4.11 Credit to the Chinese Nonfinancial Private Sector Percent of GDP Percent of GDP As Of: 2014 Q3
Source: China National Bureau of Statistics, BIS, Haver Analytics Note: Rolling 4-quarter sum of GDP.

Percent As Of: 31-Mar-2015 5.1.1 10-Year Treasury Yields
Source: U.S. Department of the Treasury
-2
-1
0
1
2
3
4
5
-2
-1
0
1
2
3
4
5
2009 2010 2011 2012 2013 2014 2015
Percent
Treasury Notes
Treasury Inflation-Protected Securities
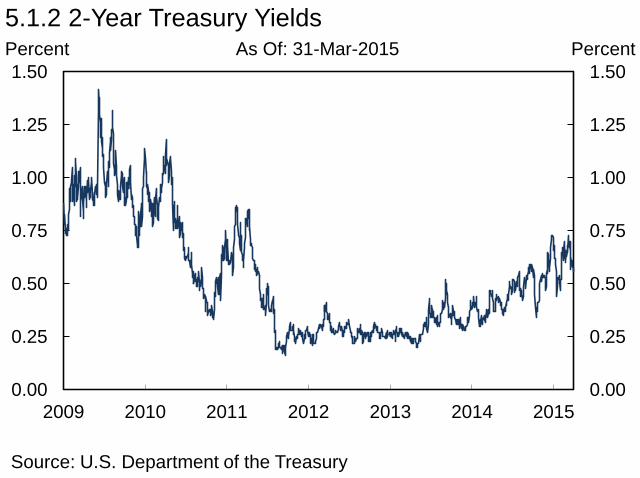
Percent As Of: 31-Mar-2015 5.1.2 2-Year Treasury Yields
Source: U.S. Department of the Treasury
0.00
0.25
0.50
0.75
1.00
1.25
1.50
0.00
0.25
0.50
0.75
1.00
1.25
1.50
2009 2010 2011 2012 2013 2014 2015
Percent

0
3
6
9
12
15
0
3
6
9
12
15
2001 2003 2005 2007 2009 2011 2013 2015Source: U.S. Department of the Treasury, Haver Analytics
As Of: Mar-2015 Trillions of US$ 5.1.3 Publicly Held Federal Debt Outstanding
Trillions of US$

0
20
40
60
80
100
0
20
40
60
80
100
2000 2002 2004 2006 2008 2010 2012 2014
5.1.4 Foreign Holders of U.S. Federal Debt Percent Percent
Source: U.S. Department of the Treasury, Haver Analytics
As Of: Feb-2015
China
Japan
Euro Area
Other

0
50
100
150
200
250
300
0
50
100
150
200
250
300
2005 2006 2007 2008 2009 2010 2011 2012 2013 2014 2015
Merrill Lynch Option Volatility Estimate
(MOVE) Index
1994-Present MOVE Average
5.1.5 Fixed Income Implied Volatility Basis Points Basis Points
Source: Bloomberg, L.P.
As Of: 31-Mar-2015
Note: Implied volatility is calculated using a yield curve-weighted index of the normalized implied volatility on 1-month Treasury options.

0
8
16
24
32
40
0
4
8
12
16
20
2010 2011 2012 2013 2014 2015
Source: Bloomberg, L.P.
As Of: 31-Mar-2015 Percent 5.1.6 European 10-Year Yields
Percent
Greece (right axis) Portugal (left axis) Spain (left axis) Italy (left axis) United Kingdom (left axis) Germany (left axis)

-300
-100
100
300
500
-300
-100
100
300
500
2006 2007 2008 2009 2010 2011 2012 2013 2014
Net Inflows
Portfolio Flows Bank Flows
Foreign Direct Investment
5.1.7 Gross Capital Flows to EMEs Billions of US$ Billions of US$
Source: IMF, Haver Analytics
As Of: 2014 Q3
0
100
200
300
400
500
600
700
0
100
200
300
400
500
600
700
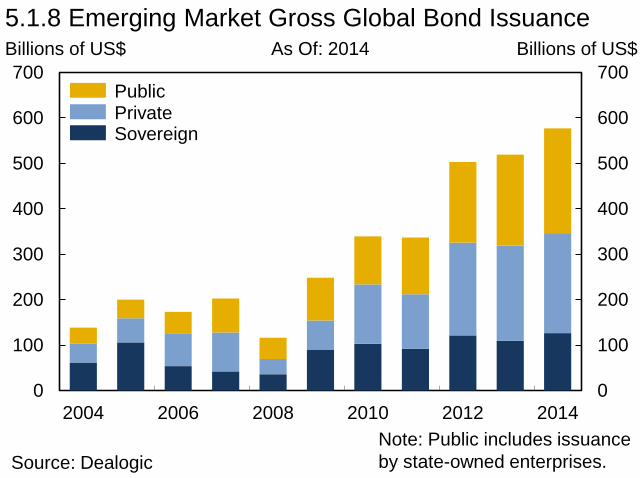
2004 2006 2008 2010 2012 2014
5.1.8 Emerging Market Gross Global Bond Issuance Billions of US$ Billions of US$
Source: Dealogic
As Of: 2014
Note: Public includes issuance by state-owned enterprises.
Private Public
Sovereign

0
200
400
600
800
1000
0
200
400
600
800
1000
2008 2009 2010 2011 2012 2013 2014 2015Source: JP Morgan, Haver Analytics
As Of: 31-Mar-2015 Basis Points 5.1.9 Emerging Market Bond Spreads
Note: JP Morgan EMBI+ Sovereign Spreads indices for each region.
Basis Points
Latin America Europe Asia

0.0
0.5
1.0
1.5
2.0
2.5
0.0
1.0
2.0
3.0
4.0
5.0
6.0
7.0
2005 2007 2009 2011 2013 2015
Source: Bloomberg, L.P.
As Of: 31-Mar-2015 Percent 5.1.10 Agency MBS Yield and Spread
Percent
Fannie Mae 30-Year MBS (left axis)
Agency MBS Spread Over 10-Year Treasury
(right axis)
0
50
100
150
200
250
0
50
100
150
200
250
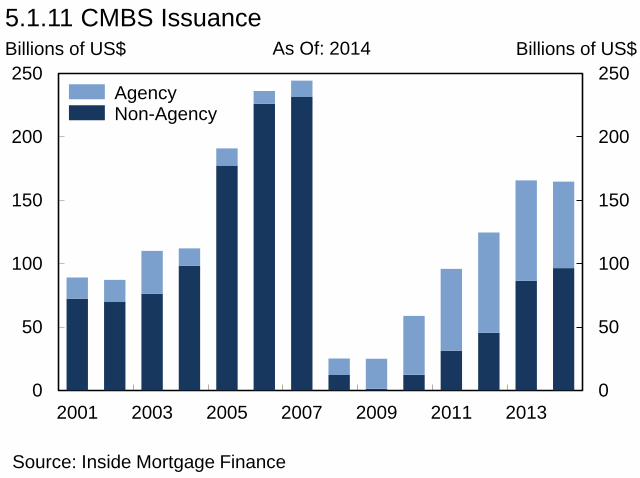
2001 2003 2005 2007 2009 2011 2013
5.1.11 CMBS Issuance Billions of US$ Billions of US$
Source: Inside Mortgage Finance
As Of: 2014
Agency Non-Agency

0
50
100
150
200
250
0
50
100
150
200
250
Mar:11 Mar:12 Mar:13 Mar:14 Mar:15
New Issue LCF
5.1.12 CMBS Senior Debt Spreads Basis Points Basis Points
Source: Barclays
As Of: 26-Mar-2015
Note: Cash spread of new issue non-agency 3.0 duper 10-year LCF CMBS.
0
200
400
600
800
1000
0
50
100
150
200
250
300
350
400
2010 2011 2012 2013 2014 2015
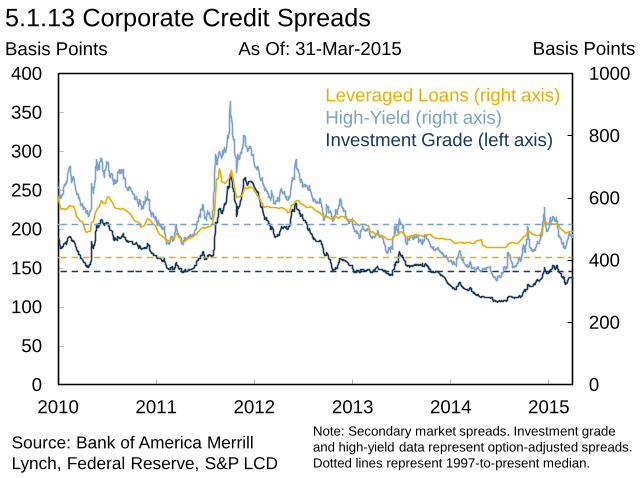
5.1.13 Corporate Credit Spreads
Source: Bank of America Merrill Lynch, Federal Reserve, S&P LCD
As Of: 31-Mar-2015
Leveraged Loans (right axis) High-Yield (right axis) Investment Grade (left axis)
Basis Points Basis Points
Note: Secondary market spreads. Investment grade and high-yield data represent option-adjusted spreads. Dotted lines represent 1997-to-present median.

0.0
0.5
1.0
1.5
2.0
2.5
3.0
0.0
0.5
1.0
1.5
2.0
2.5
3.0
2004 2006 2008 2010 2012 2014
5.1.14 Total High-Yield Debt Outstanding Trillions of US$ Trillions of US$
Source: BAML High-Yield Strategy, S&P LCD
As Of: 2014
High-Yield Bonds Leveraged Loans
0
1
2
3
4
0
1
2
3
4
2005 2006 2007 2008 2009 2010 2011 2012 2013 2014
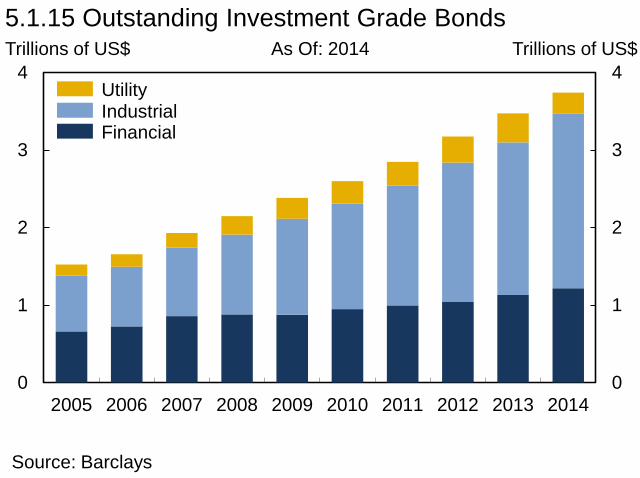
5.1.15 Outstanding Investment Grade Bonds Trillions of US$ Trillions of US$ As Of: 2014
Industrial Utility
Financial
Source: Barclays
0
1
2
3
4
5
6
7
8
0
1
2
3
4
5
6
7
8
2001 2003 2005 2007 2009 2011 2013
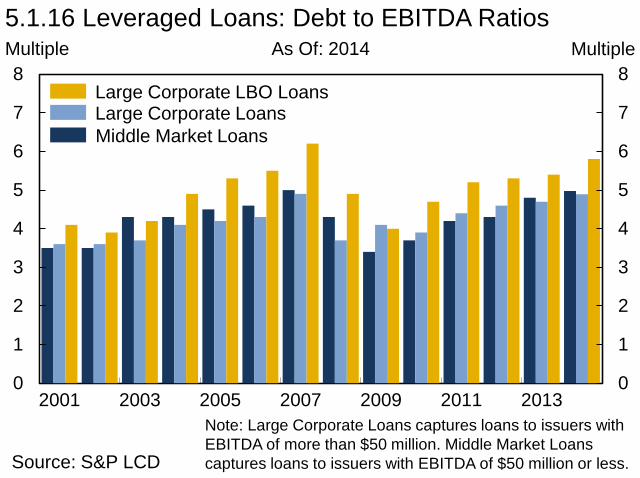
5.1.16 Leveraged Loans: Debt to EBITDA Ratios Multiple Multiple
Source: S&P LCD
As Of: 2014
Large Corporate LBO Loans Large Corporate Loans
Note: Large Corporate Loans captures loans to issuers with EBITDA of more than $50 million. Middle Market Loans captures loans to issuers with EBITDA of $50 million or less.
Middle Market Loans
0
10
20
30
40
50
60
0
10
20
30
40
50
60
2005 2006 2007 2008 2009 2010 2011 2012 2013 2014
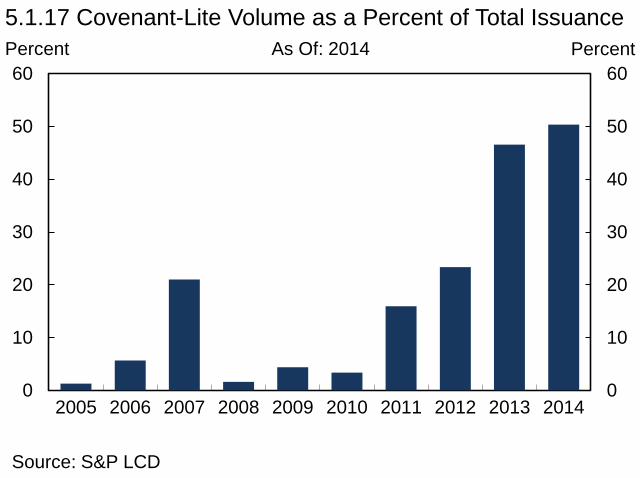
5.1.17 Covenant-Lite Volume as a Percent of Total Issuance Percent Percent
Source: S&P LCD
As Of: 2014

0
20
40
60
80
100
120
140
0
20
40
60
80
100
120
140
2004 2006 2008 2010 2012 2014
5.1.18 CLO Issuance Billions of US$ Billions of US$
Source: S&P LCD
As Of: 2014

5.1.19 Share of Leveraged Loan Primary Market by Investor Type
Source: S&P LCD
0
10
20
30
40
50
60
70
0
10
20
30
40
50
60
70
2005 2006 2007 2008 2009 2010 2011 2012 2013 2014
Percent Percent
Finance & Security Companies
As Of: 2014
CLOs
Insurance Companies Loan Mutual Funds Hedge Funds
Banks

0
20
40
60
80
100
120
140
160
0
100
200
300
400
500
600
1995 1999 2003 2007 2011 2015
C.1 Commodity Prices: Metals vs. Oil Index US$/Barrel
Source: Bloomberg, L.P.
As Of: 31-Mar-2015
Brent Oil (right axis)
GSCI Metals Index (left axis)

0
200
400
600
800
1000
0
200
400
600
800
1000
2010 2011 2012 2013 2014 2015
C.2 High-Yield Bond Spreads Basis Points Basis Points
Source: Bloomberg, L.P.
As Of: 31-Mar-2015
High-Yield Energy Sector
High-Yield
Note: Spreads to worst.
90
100
110
120
130
140
90
100
110
120
130
140
1998 2000 2002 2004 2006 2008 2010 2012 2014
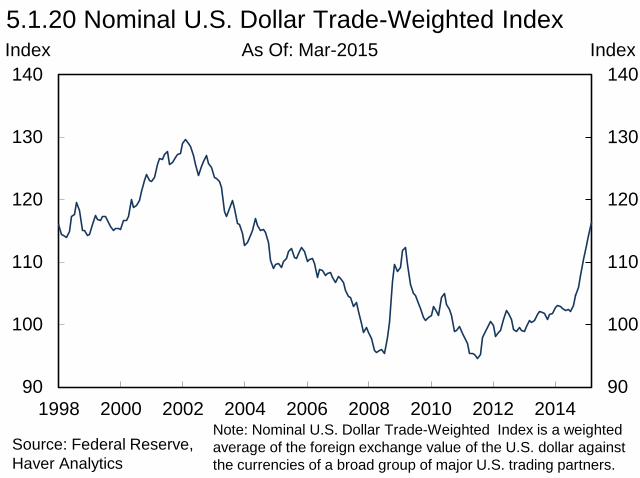
Source: Federal Reserve, Haver Analytics
As Of: Mar-2015 Index 5.1.20 Nominal U.S. Dollar Trade-Weighted Index
Note: Nominal U.S. Dollar Trade-Weighted Index is a weighted average of the foreign exchange value of the U.S. dollar against the currencies of a broad group of major U.S. trading partners.
Index

0
5
10
15
20
25
30
35
40
0
5
10
15
20
25
30
35
40
2008 2009 2010 2011 2012 2013 2014 2015
Currency VIX Average,
2002-Present
5.1.21 Currency Implied Volatility Percent Percent As Of: 31-Mar-2015
Source: Bloomberg, L.P.
3-Month Euro-Dollar 3-Month Dollar-Yen Currency VIX

60
70
80
90
100
110
120
130
140
150
60
70
80
90
100
110
120
130
140
150
2008 2009 2010 2011 2012 2013 2014 2015
Source: Federal Reserve, Haver Analytics
As Of: 31-Mar-2015 Index 5.1.22 U.S. Dollar Exchange Rates
Note: 1-Jan-2008 = 100. EM is a weighted average of the FX values of the dollar against a subset of currencies in the broad index that do not circulate widely outside the country of issue.
Index
Euro-Dollar Major Dollar Index EM Yen-Dollar

-40
-30
-20
-10
0
10
20
-40
-30
-20
-10
0
10
20
5.1.23 Change in Exchange Rates (Mar 2014 - Mar 2015) Percent Percent
Source: JP Morgan, Haver Analytics
As Of: Mar-2015
Note: Change in exchange rate is the change in a country's JP Morgan Broad Nominal Effective Exchange Rate Index.

Change from 31-Mar-2014 to 31-Mar-2015
Annual growth rate from 31-Mar-2010 to
31-Mar-2015 Major Economies U.S. (S&P) 10% 12% Euro (Euro Stoxx) 17% 6% Japan (Nikkei) 30% 12% U.K. (FTSE) 3% 4% Selected Europe Germany (DAX) 25% 14% France (CAC) 15% 5% Italy (FTSE MIB) 7% 0% Spain (IBEX) 11% 1% Emerging Markets MSCI Emerging Market Index -2% -1% Brazil (Bovespa) 1% -6% Russia (RTS) -28% -11% India (Sensex) 25% 10% China (Shanghai SE) 84% 4% Hong Kong (Hang Seng) 12% 3%
5.1.24 Returns in Selected Equities Indices
Source: Capital IQ

1.0
1.5
2.0
2.5
3.0
3.5
10
15
20
25
30
2008 2009 2010 2011 2012 2013 2014 2015
5.1.25 S&P 500 Key Ratios Ratio Ratio
Source: Bloomberg, L.P.
P/B Ratio (right axis)
Trailing P/E Ratio (left axis)
As Of: 31-Mar-2015
Note: Dotted lines represent 1995-to-present median.

0
20
40
60
80
100
0
20
40
60
80
100
2008 2009 2010 2011 2012 2013 2014 2015
VIX
1995-2014 Average
5.1.26 Market Volatility Percent Percent
Source: Capital IQ
As Of: 31-Mar-2015

0
25
50
75
100
125
150
175
200
0
25
50
75
100
125
150
175
200
2008 2009 2010 2011 2012 2013 2014 2015Source: Energy Information Administration, S&P, Haver Analytics
As Of: 31-Mar-2015 Index 5.1.27 Commodities
Note: 02-Jan-2008 = 100.
Index
Agriculture (S&P GSCI Agricultural Spot Index) Industrial Metals (S&P GSCI Industrial Metals Spot Index) Crude Oil (WTI) Natural Gas

80
100
120
140
160
180
200
220
80
100
120
140
160
180
200
220
2000 2002 2004 2006 2008 2010 2012 2014Source: CoreLogic, FHFA, Haver Analytics
As Of: Feb-2015 Index 5.1.28 National Repeat Sales Home Price Indices
Note: Jan-2000 = 100. Gray bars signify NBER recessions.
Index
CoreLogic (including
distressed sales) CoreLogic (excluding
distressed sales)
FHFA
0
2
4
6
8
10
12
0
200
400
600
800
1000
1200
1992 1996 2000 2004 2008 2012
30-Year Mortgage Rate (right axis)
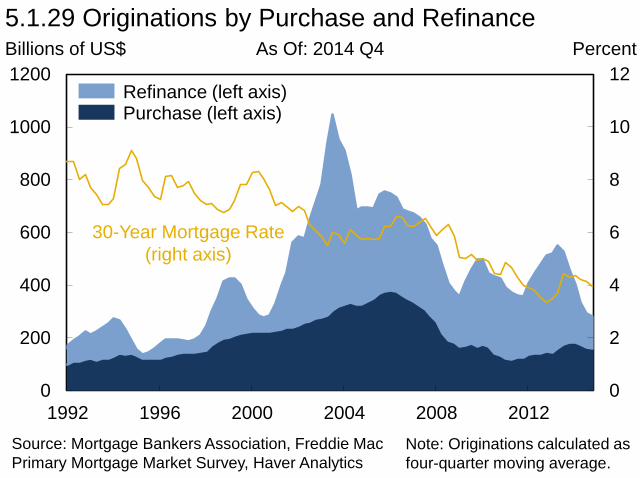
5.1.29 Originations by Purchase and Refinance Billions of US$ Percent
Source: Mortgage Bankers Association, Freddie Mac Primary Mortgage Market Survey, Haver Analytics
As Of: 2014 Q4
Refinance (left axis) Purchase (left axis)
Note: Originations calculated as four-quarter moving average.

0
5
10
15
20
25
30
300
400
500
600
700
800
900
2010 2011 2012 2013 2014
Value of Negative Equity in Residential Mortgages
(left axis)
Percent of Residential
Mortgages with Negative Equity
(right axis)
5.1.30 Mortgages with Negative Equity Billions of US$ Percent
Source: CoreLogic
As Of: 2014 Q4

0
1
2
3
4
5
6
0
1
2
3
4
5
6
2000 2002 2004 2006 2008 2010 2012 2014Source: Mortgage Bankers Association, Haver Analytics
As Of: 2014 Q4 Percent 5.1.31 Mortgage Delinquency and Foreclosure
Note: Percent of all mortgages.
Percent
Mortgage Foreclosure Inventory
Mortgage Payments Past-Due 90+ Days

0
20
40
60
80
100
0
20
40
60
80
100
2002 2004 2006 2008 2010 2012 2014
5.1.32 Purchase Origination Volume by Credit Score Percent of Originations Percent of Originations
Source: CoreLogic, Inside Mortgage Finance, OFR calculations
As Of: 2014
Note: Includes first lien purchases only.
<600
600-660
660-700
700-720
720-760
>760

0
20
40
60
80
100
0
20
40
60
80
100
2000 2002 2004 2006 2008 2010 2012 2014
5.1.33 Mortgage Originations by Product Percent of Originations Percent of Originations
Source: Inside Mortgage Finance
As Of: 2014
FHA / VA
GSE
Private Portfolio and Securitized
0.0
0.5
1.0
1.5
2.0
2.5
3.0
0.0
0.5
1.0
1.5
2.0
2.5
3.0
2000 2002 2004 2006 2008 2010 2012 2014
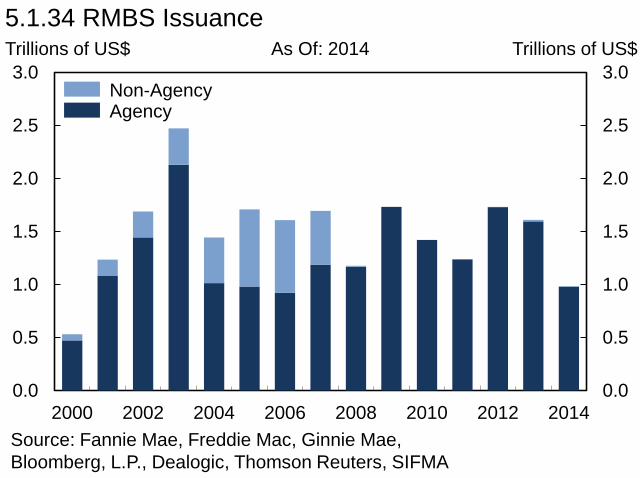
5.1.34 RMBS Issuance Trillions of US$ Trillions of US$
Source: Fannie Mae, Freddie Mac, Ginnie Mae, Bloomberg, L.P., Dealogic, Thomson Reuters, SIFMA
As Of: 2014
Non-Agency Agency

0
2
4
6
8
10
0
2
4
6
8
10
2011 2012 2013 2014
5.1.35 Mortgage Servicing Market Trillions of US$ Trillions of US$
Source: Inside Mortgage Finance
As Of: 2014 Q4
Nonbank Bank
Note: Data covers top 25 servicers in each quarter.
40
60
80
100
120
140
40
60
80
100
120
140
2008 2009 2010 2011 2012 2013 2014 2015
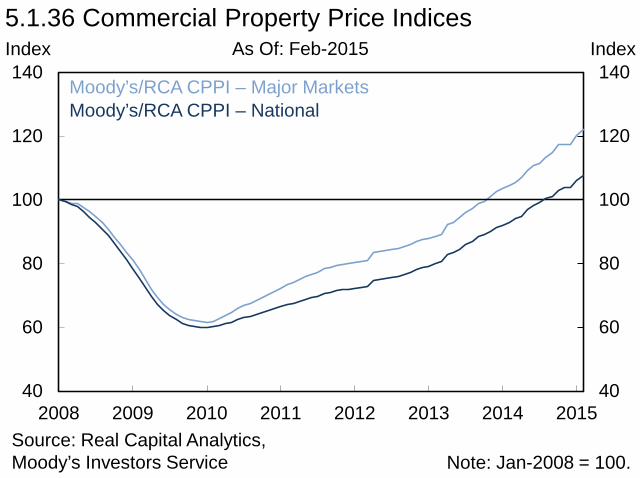
5.1.36 Commercial Property Price Indices Index Index
Source: Real Capital Analytics, Moody’s Investors Service
Moody’s/RCA CPPI – National
Note: Jan-2008 = 100.
Moody’s/RCA CPPI – Major Markets
As Of: Feb-2015

60
80
100
120
140
160
180
4
5
6
7
8
9
10
2003 2005 2007 2009 2011 2013
Source: FDIC, Financial Accounts of the United States, Haver Analytics
As Of: 2014 Q4 Trillions of US$ 5.2.1 Composition of Bank Short-Term Funding
Note: Retail deposits are from all FDIC-insured institutions. Wholesale funding includes a system-wide measure of repurchase agreements.
Percent
Short-Term Wholesale Funding (left axis)
Wholesale Funding as a Percent of Retail Deposits
(right axis)
Retail Deposits (left axis)

0.0
0.5
1.0
1.5
2.0
2.5
0.0
0.5
1.0
1.5
2.0
2.5
2001 2003 2005 2007 2009 2011 2013 2015
5.2.2 Commercial Paper Outstanding Trillions of US$ Trillions of US$ As Of: 25-Mar-2015
Domestic Financial Domestic Nonfinancial Foreign Financial
Asset-Backed
Other Foreign Nonfinancial
Source: Federal Reserve Note: Domestic includes CP issued in the U.S. by entities with foreign parents.

0
1
2
3
4
5
0
1
2
3
4
5
2002 2004 2006 2008 2010 2012 2014
5.2.3 Value of the Repo Market Trillions of US$ Trillions of US$
Source: FRBNY
As Of: 31-Mar-2015
Note: Limited data were provided by the clearing banks prior to April 2008. These figures are estimates based on the data provided. Daily Federal Reserve RRP operations beginning in September 2013 are depicted; small-scale RRP test operations undertaken periodically at earlier dates are not depicted. Gray bar signifies NBER recession.
FR 2004 Primary Dealer Repo
Tri-Party Repo Market (excluding Federal
Reserve RRPs)
Tri-Party Repo Market (including Federal Reserve RRPs)

0
1
2
3
4
5
0
1
2
3
4
5
2000 2002 2004 2006 2008 2010 2012 2014
5.2.4 Primary Dealer Repo Agreements Trillions of US$ Trillions of US$ As Of: 25-Mar-2015
Source: FRBNY
Overnight/Continuing Term

0.0
0.5
1.0
1.5
2.0
2.5
3.0
0.0
0.5
1.0
1.5
2.0
2.5
3.0
Jan:13 Jul:13 Jan:14 Jul:14 Jan:15
5.2.5 Collateral in Tri-Party Repo Trillions of US$ Trillions of US$
Source: FRBNY, Haver Analytics
As Of: 10-Mar-2015
Note: Other includes CDOs, international, money market, municipal debt, and whole loans.
Agency MBS Agency Debentures and Strips Agency CMOs
U.S. Treasuries excluding Strips ABS Equities U.S. Treasury Strips
Corporates
Other Private Label CMOs

0.0
0.5
1.0
1.5
2.0
2.5
3.0
3.5
4.0
4.5
0.0
0.5
1.0
1.5
2.0
2.5
3.0
3.5
4.0
4.5
2008 2009 2010 2011 2012 2013 2014 2015
5.2.6 Value of Securities on Loan Trillions of US$ Trillions of US$
Source: Markit Group Limited
Global Market (including U.S.)
U.S. Market
As Of: 31-Mar-2015
Note: Data is based on a survey of agent-based lenders.

0
20
40
60
80
100
0
20
40
60
80
100
2008 2009 2010 2011 2012 2013 2014 2015
5.2.7 Composition of Securities Lending by Security Type Percent of Lending Percent of Lending
Source: Markit Group Limited
Government Bonds
As Of: 31-Mar-2015
Equities
Note: Data is based on a survey of agent-based lenders. Other includes ETFs, emerging market bonds, and depository receipts.
Corporate Bonds
Other
0
50
100
150
200
250
0.0
0.3
0.6
0.9
1.2
1.5
1.8
2000 2002 2004 2006 2008 2010 2012 2014
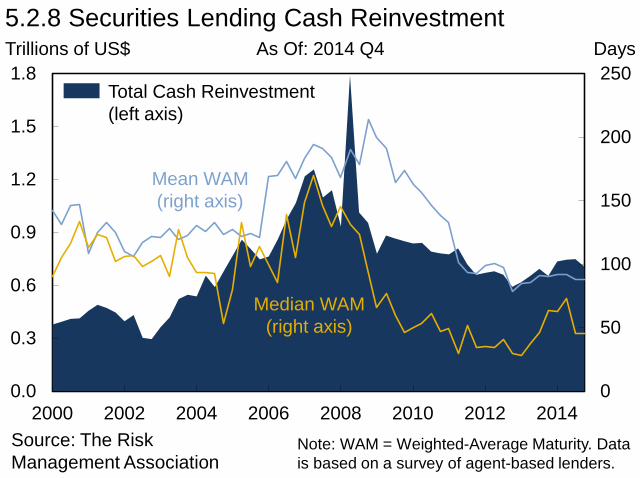
5.2.8 Securities Lending Cash Reinvestment Trillions of US$ Days
Source: The Risk Management Association
Mean WAM (right axis)
Median WAM (right axis)
As Of: 2014 Q4
Note: WAM = Weighted-Average Maturity. Data is based on a survey of agent-based lenders.
Total Cash Reinvestment (left axis)

-1200
-900
-600
-300
0
300
600
900
1200
-1200
-900
-600
-300
0
300
600
900
1200
2006 2007 2008 2009 2010 2011 2012 2013 2014
5.3.1 Domestic BHC Pre-Tax Income Billions of US$ Billions of US$
Source: FR Y-9C
As Of: 2014
Noninterest Income Net Interest Income
Total Pre-Tax Income
Provisions Noninterest Expense Realized Gains/Losses on Investments

-1.5
-1.0
-0.5
0.0
0.5
1.0
1.5
-1.5
-1.0
-0.5
0.0
0.5
1.0
1.5
1996 1998 2000 2002 2004 2006 2008 2010 2012 2014
Percent Percent As Of: 2014 Q4
Source: FR Y-9C
5.3.2 Return on Average Assets for Domestic BHCs
1996-2005 Average
-100
0
100
200
300
400
2.0
2.4
2.8
3.2
3.6
4.0
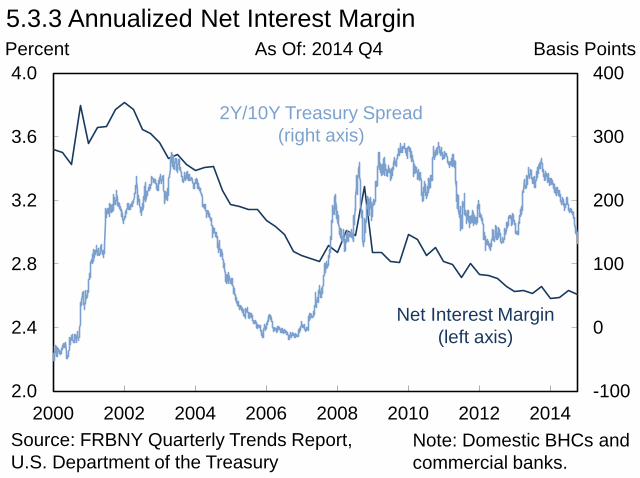
2000 2002 2004 2006 2008 2010 2012 2014
2Y/10Y Treasury Spread (right axis)
5.3.3 Annualized Net Interest Margin Percent Basis Points
Source: FRBNY Quarterly Trends Report, U.S. Department of the Treasury
As Of: 2014 Q4
Note: Domestic BHCs and commercial banks.
Net Interest Margin (left axis)

0
100
200
300
400
500
600
700
0
100
200
300
400
500
600
700
2012 2013 2014
5.3.4 Total Residential Mortgage Originations Billions of US$ Billions of US$
Source: Mortgage Bankers Association, Haver Analytics
As Of: 2014 Q4
Purchases Refinancings

0.0
0.4
0.8
1.2
1.6
2.0
1.0
1.5
2.0
2.5
3.0
3.5
4.0
4.5
5.0
5.5
2010 2011 2012 2013 2014 2015
Source: Bloomberg, L.P.
As Of: 31-Mar-2015 Percent 5.3.5 U.S. Mortgage Spread
Percent
30-Year Agency MBS Yield (left axis)
30-Year Mortgage Rate (left axis)
Spread (right axis)
0
10
20
30
40
50
0
10
20
30
40
50
2010 2011 2012 2013 2014
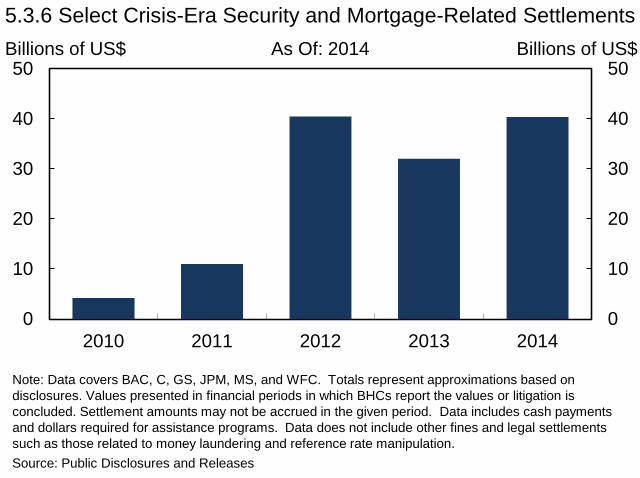
5.3.6 Select Crisis-Era Security and Mortgage-Related Settlements Billions of US$ Billions of US$
Source: Public Disclosures and Releases
As Of: 2014
Note: Data covers BAC, C, GS, JPM, MS, and WFC. Totals represent approximations based on disclosures. Values presented in financial periods in which BHCs report the values or litigation is concluded. Settlement amounts may not be accrued in the given period. Data includes cash payments and dollars required for assistance programs. Data does not include other fines and legal settlements such as those related to money laundering and reference rate manipulation.

0.00
0.05
0.10
0.15
0.20
0.25
0.30
0.00
0.05
0.10
0.15
0.20
0.25
0.30
-5 0 5 10 15
5.3.7 Maturity Gap at Large Banks Density Density
Source: Call Reports; Federal Reserve staff estimates
2003 Q3 2012 Q4 2013 Q4 2014 Q4
As Of: 2014 Q4
Note: Banks with assets over $50 billion. Approximations based on midpoint of Call Report ranges. Liquid deposits assumed to have 1-year maturity.
Increasing Interest Rate Sensitivity
Years

0.00
0.05
0.10
0.15
0.20
0.25
0.30
0.00
0.05
0.10
0.15
0.20
0.25
0.30
-5 0 5 10 15 20
5.3.8 Maturity Gap at Small Banks Density Density
Source: Call Reports; Federal Reserve staff estimates
2003 Q3 2012 Q4 2013 Q4 2014 Q4
As Of: 2014 Q4
Note: Banks with assets less than or equal to $50 billion. Approximations based on midpoint of Call Report ranges. Liquid deposits assumed to have 1-year maturity.
Increasing Interest Rate Sensitivity
Years
0
20
40
60
80
100
120
140
160
0
20
40
60
80
100
120
140
160
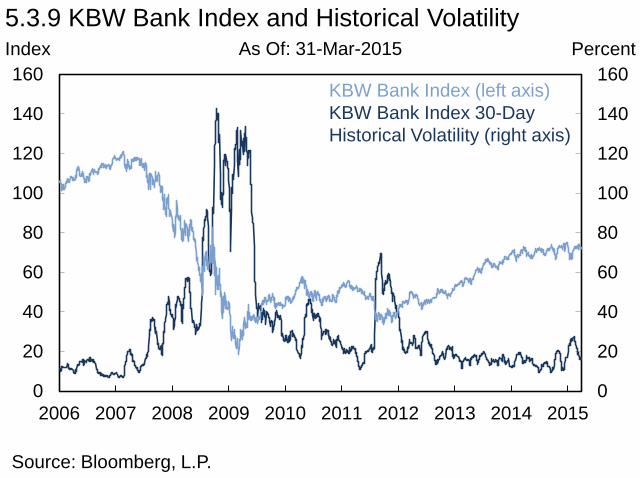
2006 2007 2008 2009 2010 2011 2012 2013 2014 2015
5.3.9 KBW Bank Index and Historical Volatility Index Percent
Source: Bloomberg, L.P.
As Of: 31-Mar-2015
KBW Bank Index (left axis) KBW Bank Index 30-Day Historical Volatility (right axis)

5.3.10 P/B and P/E Ratios of Six Large Complex BHCs
Source: Bloomberg, L.P.
0
10
20
30
40
50
60
0
1
2
3
4
5
2000 2002 2004 2006 2008 2010 2012 2014
Ratio Ratio As Of: 31-Mar-2015
P/B Ratio (left axis)
2000-2014 Average P/E (right axis)
2000-2014 Average P/B
(left axis)
P/E Ratio (right axis)
Note: Market cap-weighted average of BAC, C, GS, JPM, MS, and WFC.

Basis Points
0
100
200
300
400
500
600
700
0
100
200
300
400
500
600
700
2009 2010 2011 2012 2013 2014 2015
5.3.11 CDS Spreads of Six Large Complex BHCs Basis Points As Of: 31-Mar-2015
Source: Markit Group Limited Note: CDS spreads of BAC, C, GS, JPM, MS, and WFC.
Maximum Value Equal-Weighted Average Minimum Value

11.65 11.76
9
10
11
12
13
9
10
11
12
13
CommonEquity Capital
Ratio(4Q13)
RWAChangeImpact
NetIssuanceof Stock
RetainedEarnings
OtherAdjustments
CommonEquity Capital
Ratio(4Q14)
(1.10) .77
.52
(.10)
5.3.12 Change in Aggregate Common Equity Capital Ratios for Domestic BHCs
Percent of RWA Percent of RWA
Source: FR Y-9C
As Of: 2014 Q4
Note: In 2013 Q4, the tier 1 common capital ratio is used to measure common equity capital for all BHCs. In 2014 Q4, the tier 1 common capital ratio is used for non-advanced approaches BHCs and the common equity tier 1 capital ratio is used for advanced approaches BHCs.

0
5
10
15
20
25
30
0
5
10
15
20
25
30
2007 2008 2009 2010 2011 2012 2013 2014
5.3.13 Consolidated BHC Liquid Assets Ratio by Firm Size Percent Percent
Source: FR Y-9C
BHCs > $700B All BHCs BHCs $50-700B BHCs < $50B
As Of: 2014 Q4
Note: Liquid assets ratio is the sum of interest-bearing bank balances, FFS, repos, U.S. Treasury securities, U.S. government agencies, and U.S. government-sponsored agencies less pledged securities divided by total assets.

5.3.14 Non-Performing Loans (90+ Days and Non-Accrual)
Source: SNL Financial
0
2
4
6
8
10
0
2
4
6
8
10
2009 2010 2011 2012 2013 2014
Percent Percent
Residential
As Of: 2014 Q4
Other Consumer
C&I
Credit Card
Total NPLs CRE

0
1
2
3
4
5
6
0
1
2
3
4
5
6
2000 2002 2004 2006 2008 2010 2012 2014
5.3.15 Credit Quality Percent of Total Loans Percent of Total Loans As Of: 2014 Q4
Annualized Net Charge-Offs
Total Non-Performing
Loans
Source: FRBNY Quarterly Trends Report
Note: Domestic BHCs and commercial banks. Non-performing loans include loans that are 90+ days past due and still accruing and loans that are non-accrual.

0
50
100
150
200
250
300
350
0
50
100
150
200
2000 2002 2004 2006 2008 2010 2012 2014
As a Percent of Non-Performing Loans
(left axis) As a Percent of Annualized Net
Charge-Offs (right axis)
5.3.16 Loan Loss Reserves Percent Percent As Of: 2014 Q4
Source: FRBNY Quarterly Trends Report, FSOC calculations
Note: Domestic BHCs and commercial banks. Non-performing loans include loans that are 90+ days past due and still accruing and loans that are non-accrual.

0
2
4
6
8
10
12
14
0
2
4
6
8
10
12
14Pre-Stress Post-Stress Minimum
5.3.17 Initial and Stressed Tier 1 Common Capital Ratios Percent Percent
Source: Federal Reserve
As Of: Mar-2015
Note: Aggregate ratios shown for all participants in each year. Post-stress ratios reflect the minimum ratio observed at any point under the severely adverse supervisory scenario.
DFAST 2013 DFAST 2014 DFAST 2015
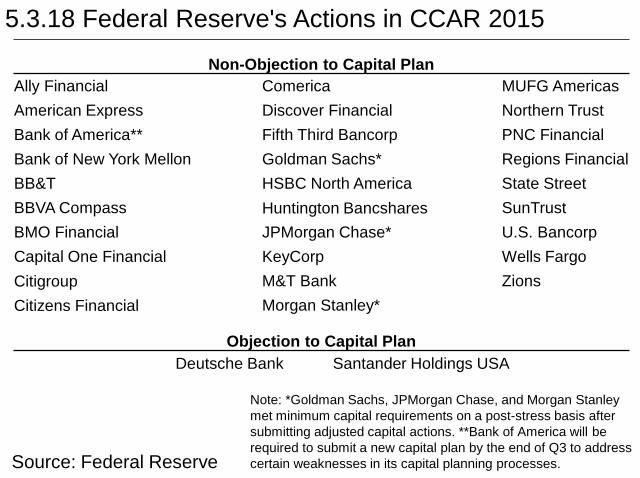
5.3.18 Federal Reserve's Actions in CCAR 2015
Note: *Goldman Sachs, JPMorgan Chase, and Morgan Stanley met minimum capital requirements on a post-stress basis after submitting adjusted capital actions. **Bank of America will be required to submit a new capital plan by the end of Q3 to address certain weaknesses in its capital planning processes. Source: Federal Reserve
Non-Objection to Capital Plan Ally Financial Comerica MUFG Americas American Express Discover Financial Northern Trust Bank of America** Fifth Third Bancorp PNC Financial Bank of New York Mellon Goldman Sachs* Regions Financial BB&T HSBC North America State Street BBVA Compass Huntington Bancshares SunTrust BMO Financial JPMorgan Chase* U.S. Bancorp Capital One Financial KeyCorp Wells Fargo Citigroup M&T Bank Zions Citizens Financial Morgan Stanley*
Objection to Capital Plan Deutsche Bank Santander Holdings USA

0
1
2
3
4
5
0
100
200
300
400
500
600
1980 1985 1990 1995 2000 2005 2010Source: BEA, FDIC, Haver Analytics
As Of: 2014 Number of Institutions 5.3.19 FDIC-Insured Failed Institutions
Note: No FDIC-insured institutions failed during 2005 and 2006.
Percent
Number of Institutions (left axis)
Assets of Failed Institutions as a Percent
of Nominal GDP (right axis)

-1000
-750
-500
-250
0
250
500
750
1000
-1000
-750
-500
-250
0
250
500
750
1000
2006 2007 2008 2009 2010 2011 2012 2013 2014
Noninterest Income Net Interest Income
Noninterest Expense Provisions
Realized Gains/Losses on Investments
5.3.20 Commercial Bank and Thrift Pre-Tax Income Billions of US$ Billions of US$
Source: FDIC Note: Includes all FDIC-insured commercial banks and thrifts.
As Of: 2014
Total Pre-Tax Income
63
66
69
72
75
78
-1.5
-1
-0.5
0
0.5
1
1.5
2
2006 2008 2010 2012 2014
Source: FDIC, Haver Analytics
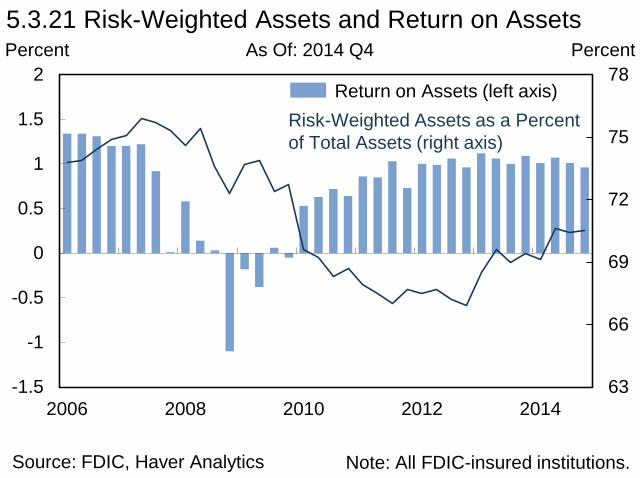
As Of: 2014 Q4 Percent 5.3.21 Risk-Weighted Assets and Return on Assets
Note: All FDIC-insured institutions.
Percent
Return on Assets (left axis) Risk-Weighted Assets as a Percent of Total Assets (right axis)

0.0
0.5
1.0
1.5
2.0
2.5
3.0
3.5
4.0
0.0
0.5
1.0
1.5
2.0
2.5
3.0
3.5
4.0
2004 2006 2008 2010 2012 2014Source: Federal Reserve, Haver Analytics
As Of: 2014 Q4 Trillions of US$ 5.3.22 U.S. Branches and Agencies of Foreign Banks: Assets
Note: Other assets includes government securities, asset-backed securities, and other trading assets.
Trillions of US$
Cash and Balances Due from Depository Institutions (excluding Reserve Balances)
Non-C&I Loans C&I Loans Net Due From Related Depository Institutions
Reserve Balances
Other Assets
Securities Purchased with Repos & Fed Funds Sold

0.0
0.5
1.0
1.5
2.0
2.5
3.0
3.5
4.0
0.0
0.5
1.0
1.5
2.0
2.5
3.0
3.5
4.0
2004 2006 2008 2010 2012 2014Source: Federal Reserve, Haver Analytics
As Of: 2014 Q4 Trillions of US$
5.3.23 U.S. Branches and Agencies of Foreign Banks: Liabilities
Note: Other liabilities includes transaction accounts, non-transaction accounts, and other borrowed money.
Trillions of US$
Deposits & Credit Balances Net Due to Related Depository Institutions
Other Liabilities Securities Sold with Repos & Fed Funds Purchased
0.6
0.8
1.0
1.2
1.4
1.6
0.6
0.8
1.0
1.2
1.4
1.6
Jan:13 Jul:13 Jan:14 Jul:14 Jan:15
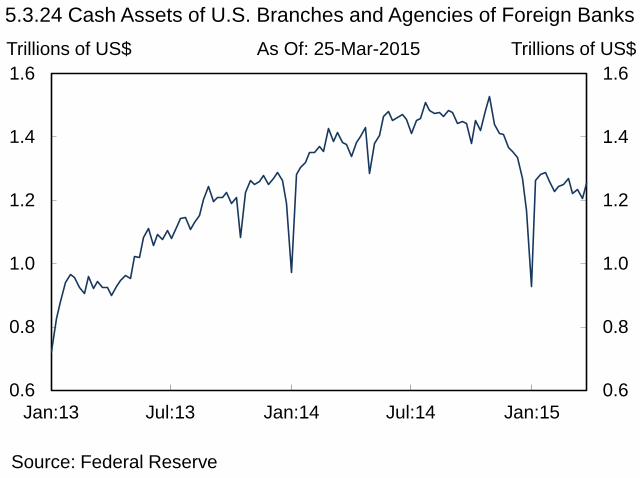
5.3.24 Cash Assets of U.S. Branches and Agencies of Foreign Banks Trillions of US$ Trillions of US$
Source: Federal Reserve
As Of: 25-Mar-2015

-60
-45
-30
-15
0
15
30
45
60
-60
-45
-30
-15
0
15
30
45
60
2006 2007 2008 2009 2010 2011 2012 2013 2014
Net Income
5.3.25 Federally Insured Credit Union Income Billions of US$ Billions of US$
Source: NCUA
As Of: 2014
Noninterest Income Net Interest Income
Noninterest Expense Provisions
Realized Gains/Losses on Investments

45
50
55
60
65
20
25
30
35
2005 2006 2007 2008 2009 2010 2011 2012 2013 2014
5.3.26 Credit Union Deposits Percent Percent
Source: NCUA
As Of: 2014 Q4
Money Market and IRA Deposit Share
(left axis)
Interest-Sensitive Deposit Share
(right axis)

0
10
20
30
40
50
0
10
20
30
40
50
2005 2006 2007 2008 2009 2010 2011 2012 2013 2014
5.3.27 Credit Union Net Long-Term Assets Percent of Total Assets Percent of Total Assets
Source: NCUA
As Of: 2014 Q4
Mortgage Loans Maturing in 5+ Years
Long-Term Investments Business Loans Fixed Assets

0
5
10
15
20
25
30
35
0
5
10
15
20
25
30
35
2006 Q4 2012 Q4 2013 Q4 2014 Q4
5.3.28 Credit Union Investments by Maturity Percent of Total Assets Percent of Total Assets
Source: NCUA
As Of: 2014 Q4
1-3 Years 3-5 Years
5-10 Years <1 Year
>10 Years
Note: Investments <1 Year excludes securities with maturities <3 months.

0
100
200
300
400
0
100
200
300
400
2009 2010 2011 2012 2013 2014
Sale of Investment Company Shares
Margin Interest Other
Underwriting
Fees – Supervision, Advisory, Administration
Commissions
5.4.1 Broker-Dealer Revenues Billions of US$ Billions of US$
Source: FINRA
As Of: 2014

0
1
2
3
4
5
6
7
2005 2006 2007 2008 2009 2010 2011 2012 2013 20140
8
16
24
32
40
5.4.2 Broker-Dealer Assets and Leverage Trillions of US$ Ratio
Source: FINRA
As Of: 2014
Note: Leverage is the ratio of total assets to total ownership equity.
Total Assets (left axis)
Leverage (right axis)

24
28
32
36
40
0
1
2
3
4
5
2010 2011 2012 2013 2014
BHC-Affiliated Assets (left axis) FBO-Affiliated Assets (left axis) Other Affiliation Assets (left axis)
BHC-Affiliated Leverage (right axis) FBO-Affiliated Leverage (right axis) Other Affiliation Leverage (right axis)
5.4.3 Large Broker-Dealer Assets and Leverage by Affiliation Trillions of US$ Ratio
Source: FINRA
As Of: 2014
Note: Leverage is the ratio of total assets to total ownership equity. Data covers the 20 largest broker-dealers.
-300
-200
-100
0
100
200
300
400
500
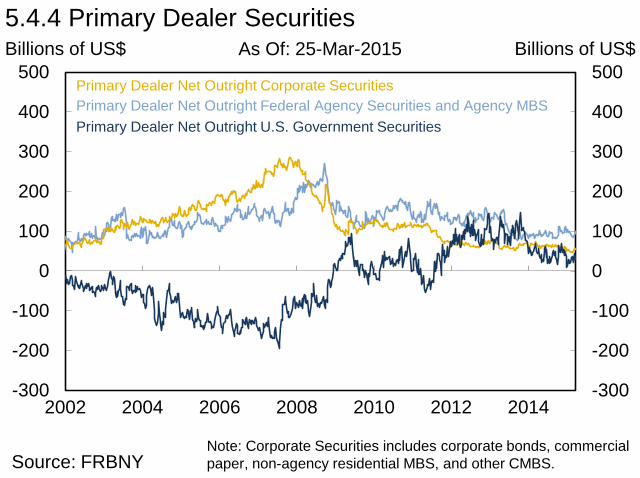
2002 2004 2006 2008 2010 2012 2014-300
-200
-100
0
100
200
300
400
500
5.4.4 Primary Dealer Securities Billions of US$ Billions of US$
Source: FRBNY
Primary Dealer Net Outright Corporate Securities
Primary Dealer Net Outright U.S. Government Securities Primary Dealer Net Outright Federal Agency Securities and Agency MBS
As Of: 25-Mar-2015
Note: Corporate Securities includes corporate bonds, commercial paper, non-agency residential MBS, and other CMBS.

Name Total Assets Name Total Assets JPMorgan Chase 2,572,773,000 PNC 345,243,081 Bank of America 2,106,796,000 Capital One 309,083,481 Citigroup Inc. 1,842,181,000 HSBC North America 290,100,702 Wells Fargo 1,687,155,000 State Street 274,119,072 MetLife 902,337,000 TIAA-CREF 272,073,395 Goldman Sachs 856,301,000 New York Life 265,555,200 Morgan Stanley 801,510,000 Lincoln 253,377,000 Prudential Financial 766,655,000 TD Bank 248,144,842 Berkshire Hathaway 526,186,000 Hartford 245,013,000 AIG 515,581,000 Northwestern Mutual 230,089,502 GE Capital 508,255,287 Voya 226,951,400 U.S. Bancorp 402,529,000 Principal 219,087,000 Bank of New York Mellon 385,303,000 MassMutual 209,136,072
5.4.5 Select U.S. Financial Holding Companies and Insurers
Note: Thousands of U.S. dollars. Data as of 2014 Q4. GAAP and SAP accounting. Insurers listed in blue. Entity classifications correspond to those used by the National Information Center and SNL Financial. Asset levels correspond to consolidated financial reporting.
Source: National Information Center, SNL Financial

0
15
30
45
60
75
0
15
30
45
60
75
2009 2010 2011 2012 2013 2014
5.4.6 Insurance Industry Net Income Billions of US$ Billions of US$
Source: SNL Financial
As Of: 2014
Life P&C
Note: Life includes accident and health.

2
3
4
5
6
7
2009 2010 2011 2012 2013 20142
3
4
5
6
7
5.4.7 Net Yield on Invested Assets Percent Percent
Source: SNL Financial, Bank of America Merrill Lynch
Life
P&C
Yield on A-Rated Corporate Debt
As Of: 2014
Note: Life includes accident and health.
0
150
300
450
600
750
900
2009 2010 2011 2012 2013 20140
10
20
30
40
50
60
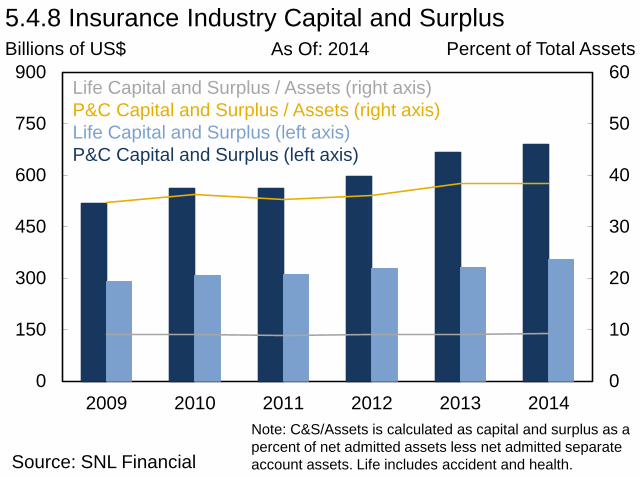
5.4.8 Insurance Industry Capital and Surplus Billions of US$ Percent of Total Assets
Life Capital and Surplus / Assets (right axis) P&C Capital and Surplus / Assets (right axis) Life Capital and Surplus (left axis) P&C Capital and Surplus (left axis)
As Of: 2014
Note: C&S/Assets is calculated as capital and surplus as a percent of net admitted assets less net admitted separate account assets. Life includes accident and health. Source: SNL Financial

20
25
30
35
40
45
0
200
400
600
800
1000
2008 2009 2010 2011 2012 2013 2014
5.4.9 Variable Annuities with Guaranteed Living Benefits Billions of US$ Percent
Source: LIMRA
As Of: 2014
Variable Annuity Assets with GLBs (left axis)
Share of Variable Annuity Assets with GLBs
(right axis)
Note: Data is based on a survey of domestic insurance companies.
0.0
0.4
0.8
1.2
1.6
2.0
0.0
0.4
0.8
1.2
1.6
2.0
2001 2003 2005 2007 2009 2011 2013 2015
Source: Federal Reserve, Haver Analytics
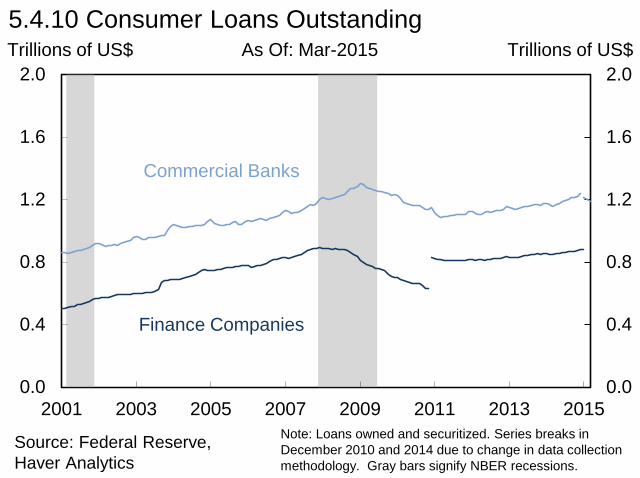
As Of: Mar-2015 Trillions of US$ 5.4.10 Consumer Loans Outstanding
Note: Loans owned and securitized. Series breaks in December 2010 and 2014 due to change in data collection methodology. Gray bars signify NBER recessions.
Trillions of US$
Commercial Banks
Finance Companies

0.0
0.4
0.8
1.2
1.6
2.0
0.0
0.4
0.8
1.2
1.6
2.0
2001 2003 2005 2007 2009 2011 2013 2015
Source: Federal Reserve, Haver Analytics
As Of: Mar-2015 Trillions of US$ 5.4.11 Business Loans Outstanding
Trillions of US$
Commercial Banks
Finance Companies
Note: Loans owned and securitized. Series break in December 2010 due to change in data collection methodology. Gray bars signify NBER recessions.

0
15
30
45
60
75
0
200
400
600
800
1000
1200
2000 2002 2004 2006 2008 2010 2012 2014
5.4.12 Auto Loans Outstanding and Originations by Type Billions of US$ Billions of US$
Source: FRBNY Consumer Credit Panel/Equifax, Haver Analytics
Bank Originations (right axis)
Finance Company Originations (right axis)
As Of: 2014 Q4
Aggregate Balance Outstanding (left axis)
Note: Originations calculated as four-quarter moving average.

0
50
100
150
200
250
300
0
50
100
150
200
250
300
2008 2009 2010 2011 2012 2013 2014
Credit Card Student Loans
Auto Housing Related Other
Equipment
5.4.13 ABS Issuance Billions of US$ Billions of US$
Source: Thomson Reuters, SIFMA
As Of: 2014
0
50
100
150
200
250
0
50
100
150
200
250
2010 2011 2012 2013 2014 2015
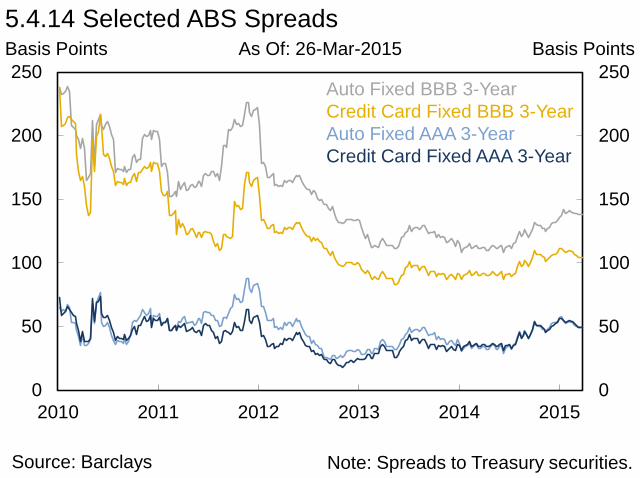
5.4.14 Selected ABS Spreads Basis Points Basis Points
Source: Barclays
Auto Fixed BBB 3-Year Credit Card Fixed BBB 3-Year Auto Fixed AAA 3-Year Credit Card Fixed AAA 3-Year
As Of: 26-Mar-2015
Note: Spreads to Treasury securities.
As Of: 2014 Q4
0
100
200
300
400
500
0
3
6
9
12
15
18
2000 2002 2004 2006 2008 2010 2012 2014
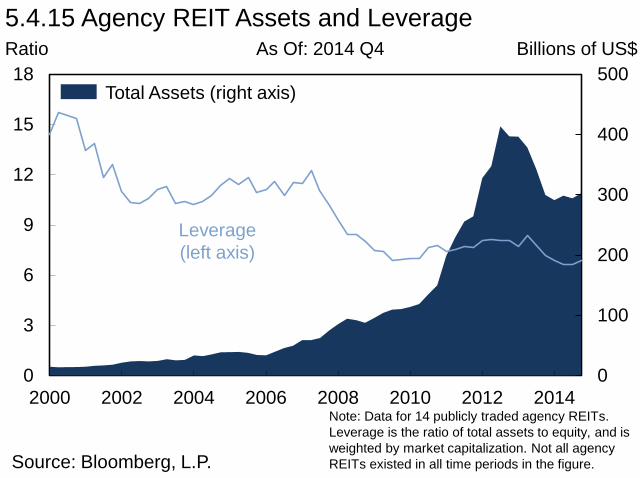
5.4.15 Agency REIT Assets and Leverage Ratio Billions of US$
Source: Bloomberg, L.P.
Leverage (left axis)
Total Assets (right axis)
Note: Data for 14 publicly traded agency REITs. Leverage is the ratio of total assets to equity, and is weighted by market capitalization. Not all agency REITs existed in all time periods in the figure.

0.0
0.5
1.0
1.5
2.0
0.0
0.5
1.0
1.5
2.0
2000 2002 2004 2006 2008 2010 2012 2014
5.4.16 Agency REIT Price-to-Book Ratio Ratio Ratio
Source: Bloomberg, L.P.
As Of: 2014 Q4
Note: Data for 14 publicly traded agency REITs. Price-to-book ratio is weighted by market capitalization. Not all agency REITs existed in all time periods in the figure.
0.0
0.5
1.0
1.5
2.0
2.5
3.0
3.5
4.0
0.0
0.5
1.0
1.5
2.0
2.5
3.0
3.5
4.0
2011 2012 2013 2014 2015
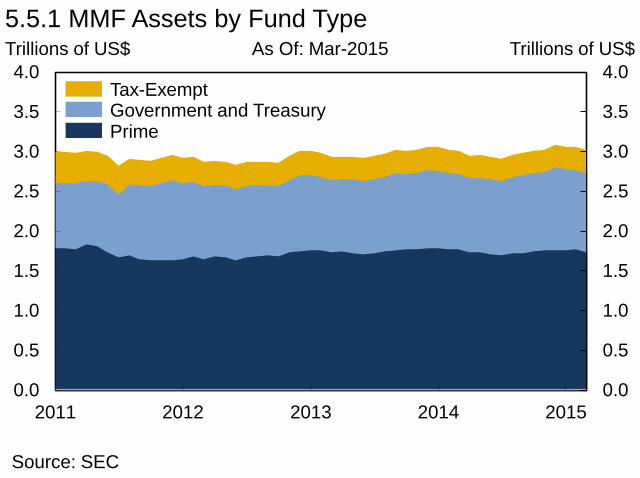
5.5.1 MMF Assets by Fund Type Trillions of US$ Trillions of US$
Source: SEC
As Of: Mar-2015
Prime Government and Treasury Tax-Exempt

0
100
200
300
400
500
600
700
0
100
200
300
400
500
600
700
2011 2012 2013 2014 2015
Repo with European Counterparties
ABCP issued by European Entities
5.5.2 U.S. MMF Holdings of European Entities’ CP, CD, and Repos Billions of US$ Billions of US$ As Of: Feb-2015
Source: SEC Form N-MFP filings, OFR calculations
Unsecured CDs and CP issued by
European Entities
Note: Assets valued at amortized cost.

20
25
30
35
40
45
50
20
25
30
35
40
45
50
2011 2012 2013 2014 2015
5.5.3 Liquidity of Prime MMFs Percent of Total Assets Percent of Total Assets
Source: SEC
As Of: Mar-2015
Daily Liquidity
Weekly Liquidity
Note: Weighted by fund size.

Note: Weighted by fund size.
5.5.4 Weighted-Average Life of MMFs
Source: SEC
60
65
70
75
80
85
60
65
70
75
80
85
2011 2012 2013 2014 2015
Days Days
Prime Funds
All Funds
As Of: Mar-2015

0
4
8
12
16
20
0
4
8
12
16
20
1990 1994 1998 2002 2006 2010 2014
5.5.5 Net Assets of the Investment Company Industry Trillions of US$ Trillions of US$ As Of: 2014
ETFs Other
Equity Bond/Hybrid MMFs
Note: Other is composed of unit investment trusts and closed-end funds. Source: ICI, Haver Analytics

-70-60-50-40-30-20-10010203040
-70-60-50-40-30-20-10
010203040
Jan:13 May:13 Sep:13 Jan:14 May:14 Sep:14 Jan:15
Source: ICI, Haver Analytics
As Of: Feb-2015 Billions of US$ 5.5.6 Monthly Bond Mutual Fund Flows
Billions of US$
Tax-Exempt Taxable

-30
-20
-10
0
10
20
30
40
-30
-20
-10
0
10
20
30
40
Jan:13 May:13 Sep:13 Jan:14 May:14 Sep:14 Jan:15
Source: ICI, Haver Analytics
As Of: Feb-2015 Billions of US$ 5.5.7 Monthly Equity Mutual Fund Flows
Billions of US$

-30
-20
-10
0
10
20
30
40
50
60
70
-30
-20
-10
0
10
20
30
40
50
60
70
2005 2006 2007 2008 2009 2010 2011 2012 2013 2014
5.5.8 Bank Loan Mutual Funds: Annual Flows Billions of US$ Billions of US$
Source: Morningstar, Inc.
As Of: 2014

-5
0
5
10
15
20
25
30
35
40
45
-5
0
5
10
15
20
25
30
35
40
45
2005 2006 2007 2008 2009 2010 2011 2012 2013 2014
5.5.9 Alternative Mutual Funds: Annual Flows Billions of US$ Billions of US$
Source: Morningstar, Inc.
As Of: 2014

-600
-400
-200
0
200
400
600
-600
-400
-200
0
200
400
600
2009 2010 2011 2012 2013 2014 2015
5.5.10 Cumulative Equity Fund Flows Billions of US$ Billions of US$
Source: Morningstar, Inc.
As Of: Mar-2015
Note: Includes ETFs and mutual funds.
International Passively Managed U.S. Passively Managed International Actively Managed U.S. Actively Managed

0
4
8
12
16
20
24
28
0
4
8
12
16
20
24
28
2007 2008 2009 2010 2011 2012 2013 2014Source: Financial Accounts of the United States, Haver Analytics
As Of: 2014 Q3 Trillions of US$ 5.5.11 Retirement Fund Assets by Plan Type
Trillions of US$
Private Defined Benefit Plans
Individual Accounts Private Defined Contribution Plans
State and Local Federal

60
70
80
90
100
110
120
60
70
80
90
100
110
120
2002 2004 2006 2008 2010 2012 2014
5.5.12 Public and Private Pension Funding Levels
Source: Public Fund Survey, Milliman 2015 Pension Funding Study
Percent Percent
Public Defined Benefit Plans
Private Defined Benefit Plans
As Of: 2014

0.0
0.6
1.2
1.8
2.4
0.0
0.6
1.2
1.8
2.4
2002 2004 2006 2008 2010 2012 2014
5.5.13 U.S. Private Equity AUM Trillions of US$ Trillions of US$
Source: Preqin
As Of: 2014 Q3
YTD
Undeployed Capital Existing Investments
5.0
5.5
6.0
6.5
7.0
7.5
8.0
240
260
280
300
320
2010 2011 2012 2013 2014 2015
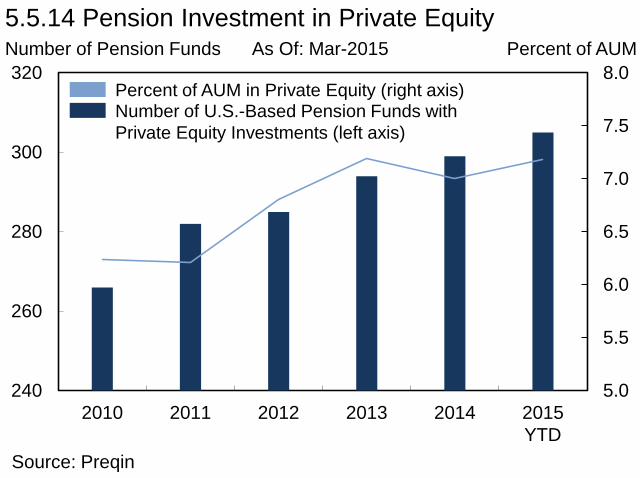
5.5.14 Pension Investment in Private Equity Number of Pension Funds Percent of AUM
Source: Preqin
As Of: Mar-2015
YTD
Percent of AUM in Private Equity (right axis) Number of U.S.-Based Pension Funds with Private Equity Investments (left axis)
0
10
20
30
40
50
60
0.0
1.5
3.0
4.5
6.0
7.5
9.0
2005 2006 2007 2008 2009 2010 2011 2012 2013 2014 2015
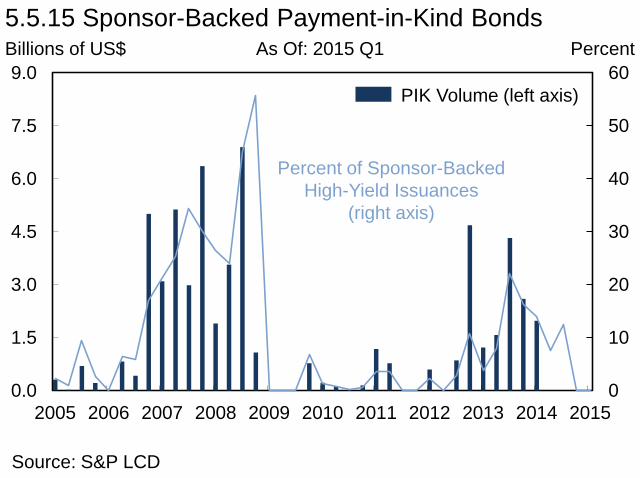
5.5.15 Sponsor-Backed Payment-in-Kind Bonds Billions of US$
Source: S&P LCD
As Of: 2015 Q1
PIK Volume (left axis)
Percent of Sponsor-Backed High-Yield Issuances
(right axis)
Percent

0
300
600
900
1200
1500
1800
0.0
0.5
1.0
1.5
2.0
2.5
2007 2008 2009 2010 2011 2012 2013 2014
5.5.16 U.S.-Listed ETP AUM and Count Trillions of US$ Number of Funds
Source: Morningstar, Inc.
As Of: 2014
AUM (left axis)
Number of Funds (right axis)

0
100
200
300
400
500
600
700
800
0
100
200
300
400
500
600
700
800
2000 2002 2004 2006 2008 2010 2012 2014
Source: BIS, Haver Analytics
As Of: 2014 Q4 Trillions of US$ 5.6.1 Global OTC Derivatives Market
Note: Notional values.
Trillions of US$
Unallocated
Interest Rate Contracts
Commodity Contracts Credit Default Swaps
Equity-linked Contracts
FX Contracts

0
10
20
30
40
50
60
70
0
10
20
30
40
50
60
70
2005 2007 2009 2011 2013
Source: BIS, Haver Analytics
As Of: 2014 Q4 Trillions of US$ 5.6.2 Credit Derivatives Outstanding
Note: Notional values.
Trillions of US$
Single Name Multi-Name
0
1
2
3
4
5
6
0
1
2
3
4
5
6
2000 2002 2004 2006 2008 2010 2012 2014
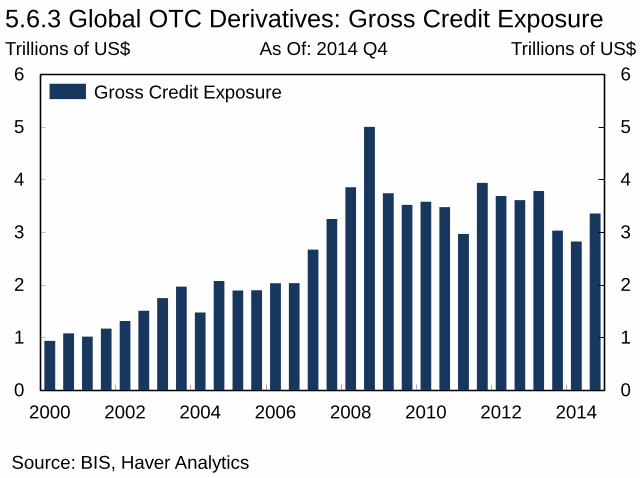
5.6.3 Global OTC Derivatives: Gross Credit Exposure Trillions of US$ Trillions of US$
Source: BIS, Haver Analytics
As Of: 2014 Q4
Gross Credit Exposure

0
50
100
150
200
250
0
50
100
150
200
250
Futures andForwards
Options CreditDerivatives
Total Swaps Total DerivativeNotionals
5.6.4 Concentration of U.S. Derivative Exposures Trillions of US$ Trillions of US$ As Of: 2014 Q4
Source: OCC Quarterly Report on Bank Trading and Derivatives Activities
Note: Notional values. Data covers insured U.S. commercial banks and savings associations.
All Other Banks Top 4 Banks

0
1
2
3
4
Jan:14 Mar:14 May:14 Jul:14 Sep:14 Nov:14 Jan:150
1
2
3
4
5.6.5 Swap Execution Facility Weekly Volume Trillions of US$ Trillions of US$
Source: Futures Industry Association
As Of: 30-Jan-2015
Note: Notional values.
FX Interest Rate
Credit

D.1 Bilateral Derivatives Market
Uncleared
Large Financial Institution
Large Financial Institution
Large Financial Institution
Large Financial Institution
Large Financial Institution
Small Financial Institution
Small Financial Institution
Small Financial Institution
Small Financial Institution
Client
Client
Clients
Client
Client
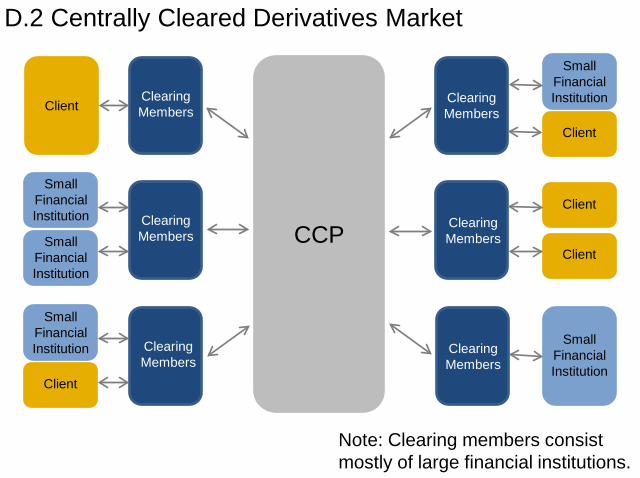
D.2 Centrally Cleared Derivatives Market
Note: Clearing members consist mostly of large financial institutions.
CCP
Client
Small Financial Institution
Client
Clearing Members
Clearing Members
Clearing Members
Clearing Members
Clearing Members
Clearing Members
Small Financial Institution
Small Financial Institution
Small Financial Institution
Client
Client
Client
Small Financial Institution

0
20
40
60
80
100
0
20
40
60
80
100
Oct:12 Apr:13 Oct:13 Apr:14 Oct:14
D.3 Centrally Cleared Swap Market
Source: CFTC
Percent Percent
Percentage of Interest Rate
Swaps Cleared
Percentage of Credit Swaps
Cleared
As Of: 27-Mar-2015
Note: Notional values. Data are adjusted for double-counting of cleared trades to show a single exposure for each trade. Methodology for collecting and reporting data changed in October 2013.

0
20
40
60
80
100
0
20
40
60
80
100
Futures CashEquities
FX (Spot) U.S.Treasuries
Agencies Std. InterestRate Swaps
IG (Cash)
7.3.1 Use of Electronic Trading by Asset Class Percent Percent As Of: 2012
Source: McKinsey
Note: Projected 2015 Level displays McKinsey projections. U.S. Treasuries measures on-the-run securities in the dealer-to-client market.
Projected 2015 Level Estimated 2012 Level
1.8
1.9
2.0
2.1
2.2
1.8
1.9
2.0
2.1
2.2
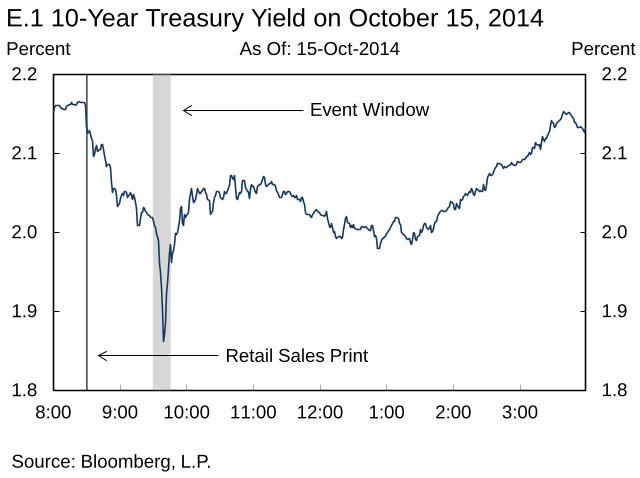
8:00 9:00 10:00 11:00 12:00 1:00 2:00 3:00
E.1 10-Year Treasury Yield on October 15, 2014 Percent Percent
Source: Bloomberg, L.P.
As Of: 15-Oct-2014
Retail Sales Print
Event Window
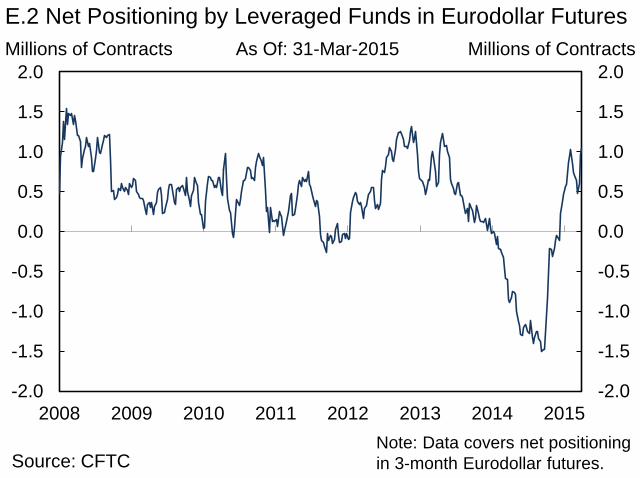
Millions of Contracts As Of: 31-Mar-2015
E.2 Net Positioning by Leveraged Funds in Eurodollar Futures
Source: CFTC
-2.0
-1.5
-1.0
-0.5
0.0
0.5
1.0
1.5
2.0
-2.0
-1.5
-1.0
-0.5
0.0
0.5
1.0
1.5
2.0
2008 2009 2010 2011 2012 2013 2014 2015
Millions of Contracts
Note: Data covers net positioning in 3-month Eurodollar futures.

0
1
2
3
4
5
0
1
2
3
4
5
JPMorganChase
Citigroup Bank ofAmerica
Wells Fargo GoldmanSachs
MorganStanley
7.8.1 Total Exposure of Six Large Complex BHCs Trillions of US$ Trillions of US$
Source: Company Y-15 Reports
As Of: 2014
2012 2013
Note: Total exposure is calculated using total assets plus the net value of certain securities financing transactions, credit derivatives and commitments, and counterparty risk exposures.
2014
0.0
0.5
1.0
1.5
2.0
2.5
0.0
0.5
1.0
1.5
2.0
2.5
JPMorganChase
Citigroup Bank ofAmerica
Wells Fargo GoldmanSachs
MorganStanley
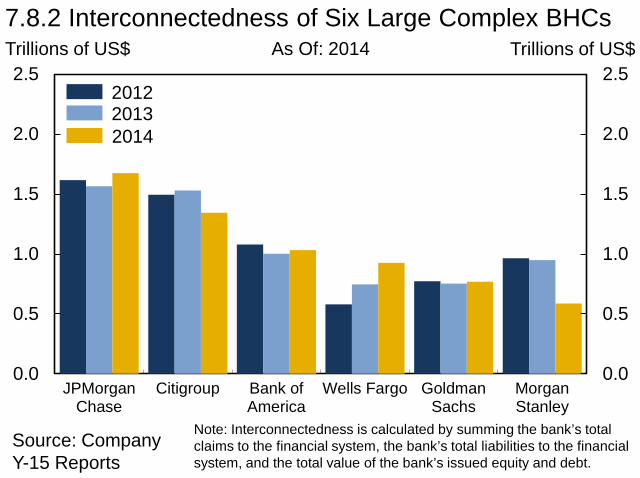
7.8.2 Interconnectedness of Six Large Complex BHCs Trillions of US$ Trillions of US$
Source: Company Y-15 Reports
As Of: 2014
2012 2013
Note: Interconnectedness is calculated by summing the bank’s total claims to the financial system, the bank’s total liabilities to the financial system, and the total value of the bank’s issued equity and debt.
2014

0
20
40
60
80
100
0
20
40
60
80
100
JPMorganChase
Citigroup Bank ofAmerica
Wells Fargo GoldmanSachs
MorganStanley
7.8.3 OTC Derivatives Held by Six Large Complex BHCs Trillions of US$ Trillions of US$
Source: Company Y-15 Reports
As Of: 2014
2012 2013 2014
Note: Notional values.

0
30
60
90
120
150
0
30
60
90
120
150
JPMorganChase
Citigroup Bank ofAmerica
Wells Fargo GoldmanSachs
MorganStanley
7.8.4 Level 3 Assets Held by Six Large Complex BHCs Billions of US$ Billions of US$
Source: Company Y-15 Reports
As Of: 2014
2012 2013
Note: Level 3 assets are assets whose fair value cannot be determined by using observable inputs.
2014

0
1
2
3
4
5
6
0
1
2
3
4
5
6
2005 2007 2009 2011 2013 2015
7.8.5 Systemic Risk Measures
Source: Bloomberg, L.P., OFR calculations
As Of: Mar-2015
CoVaR SES DIP
Index Index
Note: Sample consists of BAC, C, GS, JPM, MS, and WFC. Measures are standardized by their historical volatility.

0
2
4
6
8
0
2
4
6
8
2007 2008 2009 2010 2011 2012 2013 2014 2015
7.8.6 Moody’s Systemic Support Uplift Notches Notches
Citibank
Bank of America
JPMorgan Chase Bank Bank of
New York Mellon
Wells Fargo Bank
U.S. Bank
As Of: Mar-2015
Source: Moody’s Analytics, FRBNY calculations
Note: Uplift is defined as the difference between Moody’s long-term issuer rating and Moody’s bank financial strength rating, which provides an estimate of the effect of implicit guarantees and external support.
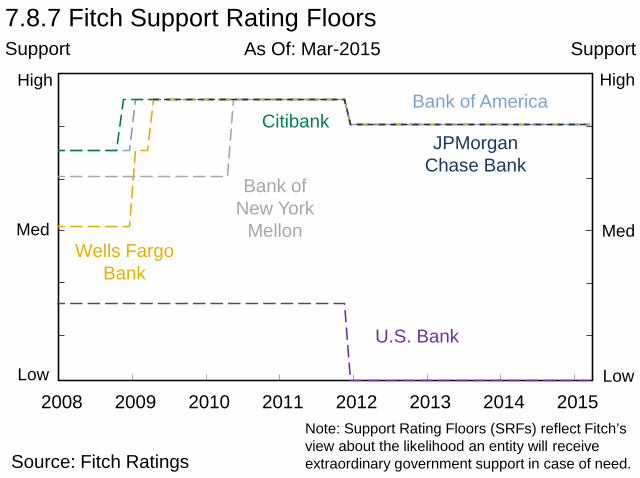
2008 2009 2010 2011 2012 2013 2014 2015
Support High
Med
Low
Source: Fitch Ratings
7.8.7 Fitch Support Rating Floors Support
Citibank Bank of America
JPMorgan Chase Bank
Bank of New York
Mellon Wells Fargo
Bank
U.S. Bank
As Of: Mar-2015
Note: Support Rating Floors (SRFs) reflect Fitch’s view about the likelihood an entity will receive extraordinary government support in case of need.
High
Med
Low