4.1 crop yield and nutrient requirements h. vankeulen
TRANSCRIPT

4.1 Crop yield and nutrient requirements
H. vanKeulen
4.1.1 Introduction
In the previous chapters it has been shown that plants need energy (supplied by the sun), carbon dioxide and water to produce organic material. However, plant tissue contains not only oxygen, hydrogen and carbon, but also other elements like nitrogen, phosphorus and sulphur in proteins, and potassium accompanying organic anions. Many other elements are found in small quantities as constituents of enzymes.
These elements must be taken up by the root system from the soil. In many cases the soil in its natural situation does not supply sufficient plant nutrients to satisfy the demand of the crop. The yield level obtained is then determined by the amount of the limiting element that can be absorbed by the vegetation.
In the foregoing chapters a quantitative treatment has been given of the influence of energy and water on the agricultural production process. In this chapter the influence of plant nutrients will be treated, with this difference, however, that the dynamic aspect, i.e. the change with time, is not considered.
4.1.2 Nutrient supply and crop response
Since the discovery, during the middle of last century, that inorganic ions are needed by growing crops, an enormous number of fertilizer experiments have been carried out at different locations, with various elements and with many crops. In general these trials yield information of the type presented in Figure 39, i.e. the measured yield is presented as a function of the amount of an element supplied. This graph, referring to experiments carried out at IRRI, in the Philippines (Tanaka et al., 1964), shows clearly one of the difficulties encountered in interpreting these experiments: the results are extremely variable.
It should be realized, therefore, that to obtain a yield response to fertilizer application two conditions must be fulfilled:
~ the fertilizer that is applied to the soil (or in the case of bunded rice to the water) must be taken up by the crop.
- after uptake by the crop it must be utilized to produce the required plant material, i.e. grains in the case of rice and maize, roots in the case of
cassava.
Both processes may be hampered by external or internal conditions. A presen-
155

grain yield ( tha- 1 ) 8 -
x»dry season • = wet season
4 i
50 100 150 N application (kg ha-1)
Figure 39. Relation between nitrogen application and grain yield for bunded rice grown at IRRl, Los Banos, the Philippines in the dry season and the wet season (Tanaka et al., 1964).
tation such as that in Figure 39 gives no clue to the relative importance of both in the final response. For useful interpretation of fertilizer experiments, yield determinations must be accompanied by chemical analysis of the harvested material, so that the uptake of the element by the vegetation can be calculated and its distribution in the plant.
When in fertilizer experiments both yield and chemical composition have been determined, graphical presentation of the results as suggested by de Wit (1953) facilitates interpretation. The method is illustrated in Figure 40, using the same data as in Figure 39. Figure 40 consists of three graphs: in the first quadrant, Quadrant a, the relation is given between the economic yield (grain) and the total uptake of the element in the above ground parts of the vegetation, that is both in grain and in straw. This value is calculated by multiplying the amounts of grain and straw harvested by their respective nitrogen concentrations.
Exercise 48 Calculate the total uptake of nitrogen for the following experiment: N application Yield Nitrogen concentration (kg ha"1)
0 50
100 150
(kg ha"1)
grain
4400 5450 6200 6350
straw
4500 5200 6250 6400
( % )
grain
1.12 1.29 1.24 1.43
straw
0.44 0.40 0.52 0.55
156

8 grain yield ( t ha~1)
(a)
.x—•-
x dry season • wet season
120 90 60 30 N application (kg ha - 1 )
150 N uptake (kg h a )
30
60
90
120
(b)
N application (kg ha"1)
Figure 40. The relation between nitrogen uptake and grain yield; the relation between nitrogen application and nitrogen uptake, and the relation between nitrogen application and grain yield for bunded rice grown at IRRI, Los Banos, the Philippines, in the dry season and the wet season (Tanaka et al., 1964). Numbers in lower half of the graphs denote recovery fraction of applied fertilizer.
Quadrant b shares the uptake axis with Quadrant a, while on the vertical axis the amount of fertilizer applied is given in downward direction. Quadrant c shows the relation between fertilizer application and yield, i.e. that given in Figure 39. The three graphs are not independent, as one can always be constructed from the other two through elimination of one variable.
The lower end of the curve in Quadrant a passes through the origin, i.e. at zero uptake no yield is to be expected. Because uptake refers to total uptake in both grain and straw, theoretically a situation could exist where only vegetative material is produced, which contains some nitrogen, so that zero yield is associated with a small nitrogen uptake. For all practical purposes, however, that phenomenon may be neglected and the easily obtained origin may be considered part of the curve. At low levels of nitrogen uptake, a proportional relation exists between total uptake and grain yield. This proportionality reflects the existence of a minimum nitrogen concentration, both in grain and in straw. In the grain, no further accumulation of dry matter can take place beyond the point where nitrogen has been diluted to its minimum concentra-
157

tion. In the straw, which in the reproductive phase looses nitrogen to the developing grains, a residual non - remobilizable level of nitrogen remains. The fact that each unit of nitrogen taken up, yields a constant amount of grain also indicates that the ratio between grain yield and total dry matter yield (the harvest index) is not strongly influenced in that range.
A different situation may arise under arid and semi - arid conditions. Moisture limitation during the post — anthesis phase may hamper crop assimilation due to stomatal closure and accelerated leaf senescence, and thus interfere with the growth of the storage organs. The consequence of such behaviour is a very unfavourable harvest index. An additional effect is that not all the nitrogen in the vegetative plant parts can be remobilized and translocated, but material dies with a high residual nitrogen content. Moreover, the nitrogen content of the storage organs is high, because nitrogen is incorporated preferentially in the storage organs and is subsequently not diluted (van Keulen, 1977; van Keulen & van Heemst, 1982). The art of nitrogen fertilizer application in such situations is to apply the fertilizer judiciously so that the moisture is just depleted when the seed ripens. In semi-arid regions, too liberal an application at the early growth stages must be avoided, because that leads to abundant vegetative growth with the associated high water use and the risk of moisture shortage during the reproductive stage. These intricate interrelations are treated and simulated in detail elsewhere (van Keulen & Seligman, 1986). The combination of a poor harvest index and a high protein content in the harvested plant material, decreases the efficiency of nitrogen utilization considerable, even under limited nitrogen supply. In such situations it is, therefore, much more difficult to predict the effect of nitrogen uptake on economic yield quantitatively.
A similar situation may arise when a high proportion of the total nitrogen uptake takes place after anthesis. Such a process hardly influences the harvest index, but it leads to high protein contents in the storage organs and incomplete remobilization of the proteins from the vegetative material. However, such a situation rarely occurs under conditions of limited nitrogen supply, except if temporary water shortage during the pre- anthesis phase is followed by abundant water supply during the post - anthesis phase. In the situations described here, the yield - uptake curve must thus be applied cautiously.
Exercise 49 Calculate the harvest index for the treatments of the experiment presented in Exercise 48. What is the mathematical relation between the harvest index and the grain/ straw ratio?
158

With increasing uptake of nitrogen the yield - uptake curve deviates from the straight line, reflecting an increase in nitrogen concentration in the harvested products. The efficiency of nitrogen utilization, expressed as grain yield per unit nitrogen taken up, thus decreases. However, the quality of the harvested material, in terms of its protein content increases.
Finally, the yield curve reaches a plateau level, where further uptake of nitrogen is not reflected in higher yields. At that point, nitrogen availability is no longer the determinant factor for growth and production. The level of the plateau in any actual situation is determined by the growth factor that is constraining. If there is a sufficient supply of the.other major inorganic elements, such as phosphorus and potassium, and the other chemical properties, of the soil are also favourable (pH, salinity), the yield plateau is equal to that calculated for Production Situation 2, i.e. for situations where either radiation or water may be at times limiting. If by means of proper drainage and irrigation facilities also the moisture status of the soil can be maintained around its optimum value, the yield plateau is that of Production Situation 1, i.e. potential production determined by radiation and temperature only. The influence of other limiting factors on the level of the plateau will be treated in more detail in Subsection 4.1.2. The yield - uptake curve will extend to a point where the vegetation has taken up so much nitrogen that the maximum concentration in the tissue is maintained throughout the plants life cycle.
Various analyses of yield - uptake curves have shown that the relationship is independent of the type of fertilizer applied, provided the fertilizer is only effective through its main acting element (van Keulen & van Heemst, 1982; van Keulen, 1982; van Keulen, 1977; de Wit, 1953).
The relation in Quadrant b appears to be linear over the complete range of applications presented, which is characteristic for the majority of fertilizer experiments for nitrogen. Of course, when very high amounts of fertilizer are applied, a situation may be created where the vegetation is continuously 'saturated' with nitrogen, i.e. it is always at its maximum concentration, so that uptake does not increase any more at the highest application levels. For most practical situations, however, the relation in Quadrant b may be characterized by two parameters: the intercept with the uptake axis, representing the uptake from the unfertilized soil, and the slope with respect to the vertical, representing the proportion of the applied fertilizer taken up by the above-ground plant material. This is referred to as the recovery fraction.
The nitrogen uptake at zero fertilizer application shows wide fluctuations, partly because of soil characteristics, partly because of variations in environmental conditions like temperature and rainfall. Furthermore, management influences are of importance such as crop rotation and water management.
The fertilizer recovery fraction may vary between 0.1 and 0.8: the efficiency of uptake is influenced by such factors as fertilizer type, method and timing of application, environmental conditions, etc.
159

Exercise 50 In a certain situation, the uptake of nitrogen at zero N application is 20 kg ha"1 and at a fertilizer rate of 100 kg ha"1 the nitrogen uptake is 60 kg ha"1. What is the recovery fraction of the applied nitrogen?
The recovery fraction is smaller than one, because many processes are competing for the applied nitrogen: uptake by plants, immobilization by bacteria, volatilization, leaching and denitrification. The linearity of the application rate - uptake relation suggests strongly that all these processes proceed at a rate which is proportional to the concentration of mineral nitrogen (N03", NH4
+) in the soil solution, so that they can be described as first-order reactions.
It is obvious from this presentation that the curves in Quadrant c may vary widely under different conditions, because both uptake without fertilizer application and recovery of applied fertilizer show wide variability. In order to suggest methods for improvement in a given situation it is, however, necessary to know all three relations depicted in Figure 40.
Exercise 51 Construct the three quadrant diagram for the experiment given in Exercise 48.
4.1.3 Yield - uptake relations
Initial slope
Rice In Figure 41, a number of representative examples are given for yield-up
take curves of nitrogen on rice, representing a range of cultivars, environmental conditions, fertilizer treatments and management practices. The plateau level in the various examples presented is not necessarily the yield level of Production Situation 2, because at the higher rates of N application other elements could have been in short supply. However, information about this is, in general, lacking. For our purpose that is immaterial because only the initial slope of the yield - uptake curve is considered here, and points on this slope materialize only if elements other than nitrogen are not limiting. Examination of the various curves shows that the initial slope, expressed in kg grain (at a moisture content of 0.15 kg kg"1) per kg nitrogen taken up varies in the examples between 51 (Figure 41a) and 80 (Figure 41b). These variations reflect differences in grain/straw ratios in the various experiments, resulting from
160

«rV 12 r y
6
3
240
480
(b) .*» * IR8 • Minabar- 2
u 100 200 300 400
50
75
8 r
» flooded • flooding/
drying u
j L 150
8 r y
150
- A
100
7 5 -
150
(f) * broadcast • placed
Figure 41. The relation between total nitrogen uptake (u, in kg ha"1) and grain yield, y (t ha-1), at a moisture content of 0.15 kg kg-' and the relation between nitrogen application, A (kg ha~'), and nitrogen uptake of bunded rice. Numbers in lower half of the graphs denote recovery fractions of applied fertilizer, a. India (Majumdar, 1973). b. Peru (Sanchez et al., 1973). c. USA (Reddy & Patrick, 1978). d. Philippines (Khind & Ponnamperuma, 1981). e. Thailand (Koyama et al., 1973). f. Indonesia (Ismunadji & Sismiyati, 1976).
differences in growing conditions or cultivar characteristics. The experiment of Figure 41a was carried out in India with a local tall indica cultivar, Raghu-sail, producing a relatively abundant vegetative apparatus, hence the average grain/straw ratio of 0.53. On the other hand, the improved short straw culti-
161

var IR8 growing under the conditions of the coastal plain in Peru, ended up with a grain/straw ratio of 1.3 (Figure 41b).
Exercise 52 Calculate the harvest index for the examples of Figures 41a and 41b.
In both situations, however, and in the other examples in Figure 41, the minimum nitrogen concentration in the grains was around 0.01 kg kg"1, whereas in the straw the residual N concentration was around 0.004 kg kg"1. On the basis of these parameters the initial efficiency, Ein, can be calculated as:
Ein = 1/(0.01 +s/gx 0.004) (78)
where
s is weight of straw (kg ha"1) g is weight of grain (kg ha"1)
Exercise 53 Calculate the 'theoretical' efficiencies for the two examples of Figures 41a and 41b.
In an extensive analysis of yield-uptake curves for nitrogen on rice (van Keulen, 1977), it was shown that the initial efficiencies are always within the range set by the two extremes in Figure 41. Also in pot trials similar values are obtained.
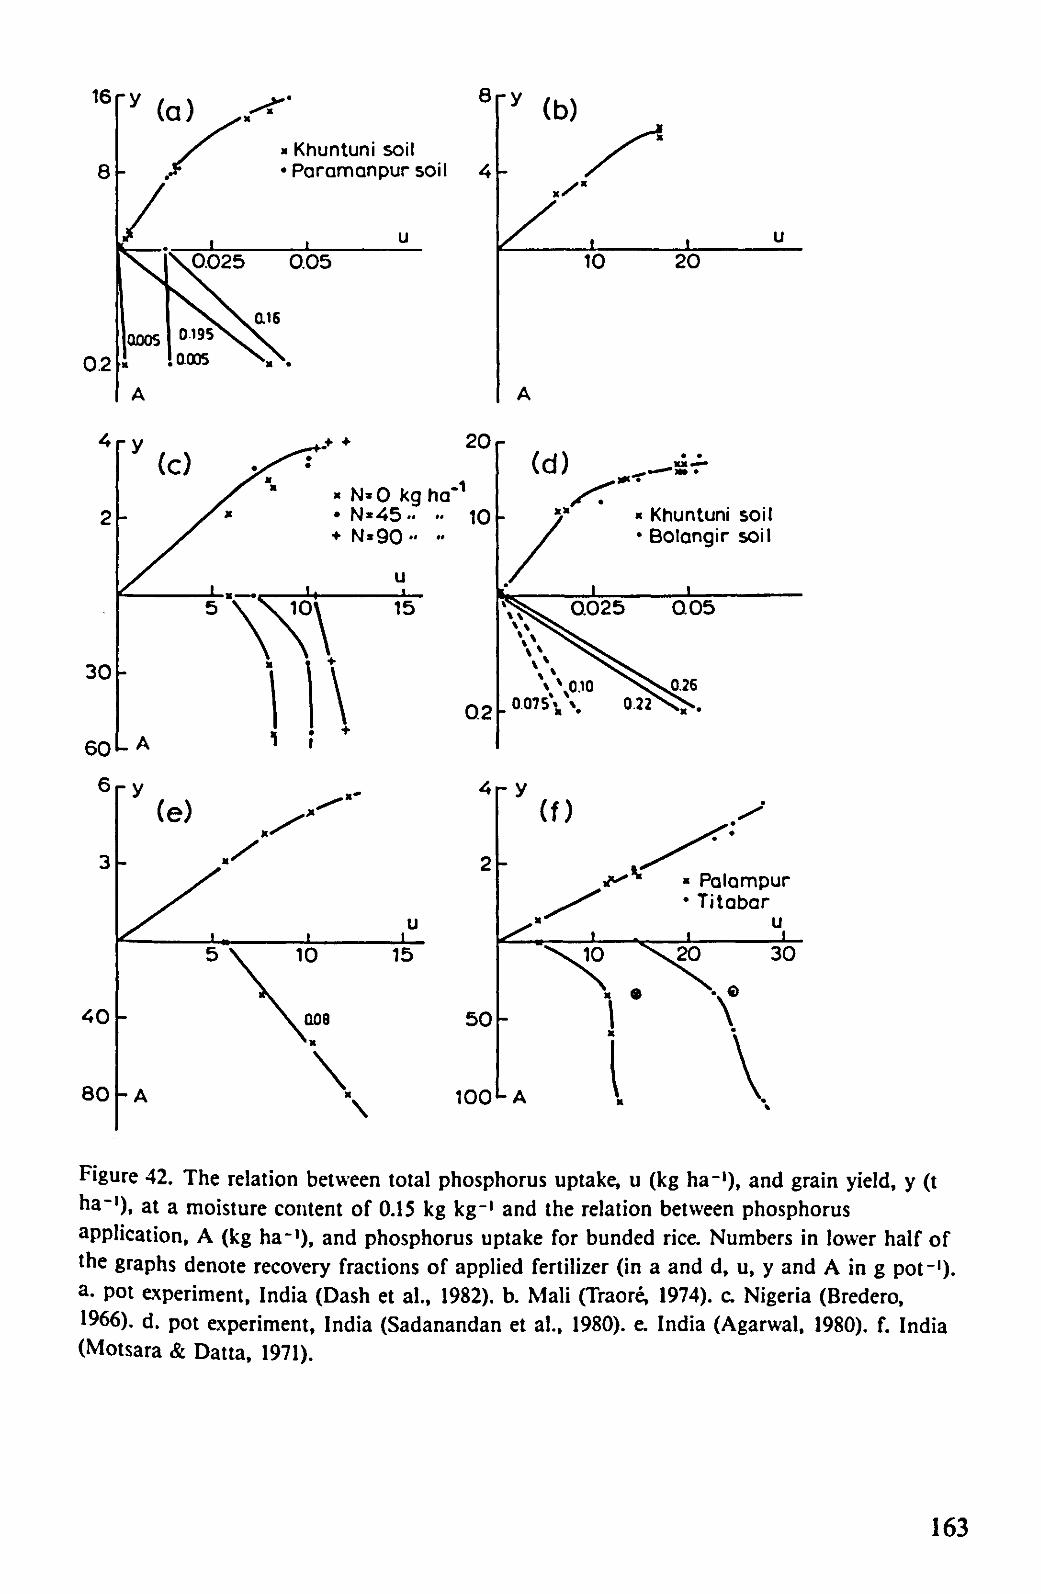
In Figure 42, a similar analysis is presented for the effect of phosphorus on rice. Because less sufficiently detailed field data are available where phosphorus is the limiting factor for rice production, some results of pot trials have also been included. The minimum phosphorus concentrations in grain and straw found in various experiments are 0.0011 and 0.0005 kg kg"1, respectively. Applying the same reasoning as in the case of nitrogen and, assuming a value of one for the grain/straw ratio, leads to an initial efficiency of 625 kg grain per kg phosphorus taken up. The slopes in Figure 42 vary between 410 and 625 kg kg"1, the variability being again mainly the result of variations in the grain/straw ratio.
162
*Khuntuni soil •Paramanpursoil
8 r y (b)
« / "
10 u
20
.• •
* N*0 kg ha • N*45 •» •• 10 • N»90 •• ••
3 -
4 0 -
8 0 -
u 15
(e)
-
- A
i _
5 \ ;
1
10
\ Q08
\ X
\
u 1
15
« Khuntuni soil • Bolangir soil
02 \ \0.10
0 075% \ 0 22 ,„
4 r y
50
100
« Palampur • Titabar
u
10 .20 30
X $
\ w
L A I V Figure 42. The relation between total phosphorus uptake, u (kg ha-1), and grain yield, y (t ha-'), at a moisture content of 0.15 kg kg-1 and the relation between phosphorus application, A (kg ha-1), and phosphorus uptake for bunded rice. Numbers in lower half of the graphs denote recovery fractions of applied fertilizer (in a and d, u, y and A in g pot-1)-a. pot experiment, India (Dash et al., 1982). b. Mali (Traore, 1974). c. Nigeria (Bredero, 1966), d. pot experiment, India (Sadanandan et al., 1980). e. India (Agarwal, 1980). f. India (Motsara & Datta, 1971).
163
Exercise 54 Calculate the grain/straw ratio of the experiment presented in Figure 42b, where the initial efficiency is 410 kg grain per kg P taken up.
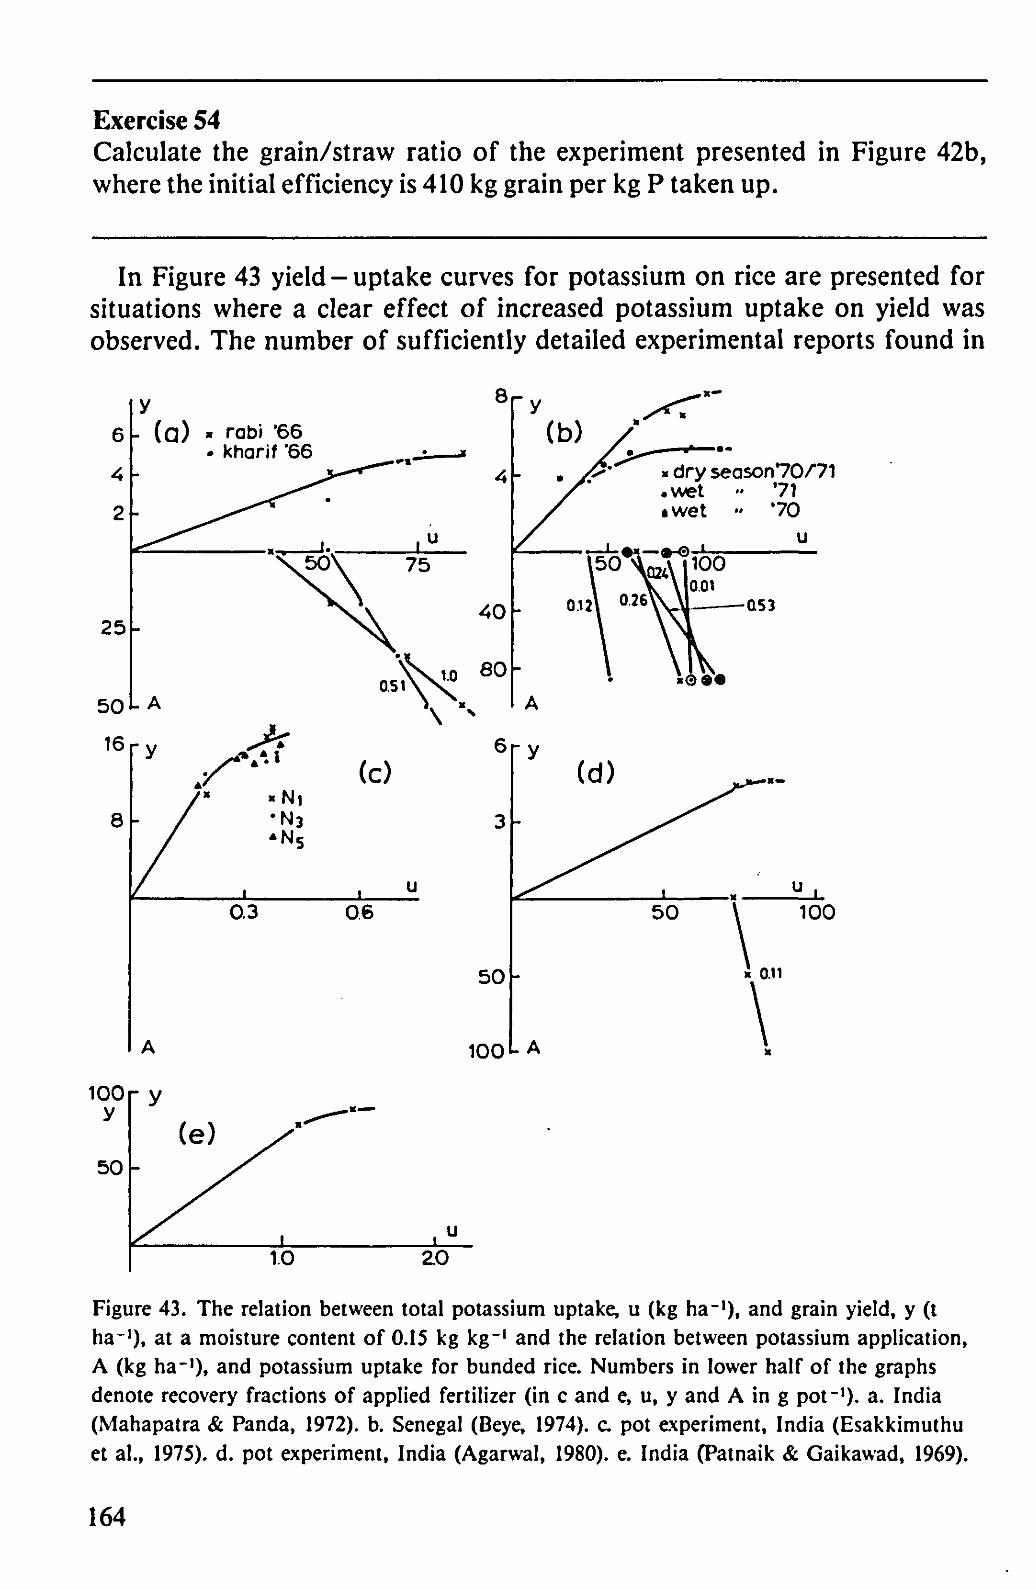
In Figure 43 yield - uptake curves for potassium on rice are presented for situations where a clear effect of increased potassium uptake on yield was observed. The number of sufficiently detailed experimental reports found in
6h ( a ) * rabi '66 kharif '66
4 -
2 -
• dry season70/71 • wet » '71 • wet » *70
100
100 L
uu y
50
- y
(e) M * * ^
! 1.0
« * " • " * —
• u
20
Figure 43. The relation between total potassium uptake, u (kg ha-1), and grain yield, y (t ha-1), at a moisture content of 0.15 kg kg-1 and the relation between potassium application, A (kg ha-1), and potassium uptake for bunded rice. Numbers in lower half of the graphs denote recovery fractions of applied fertilizer (in c and e, u, y and A in g pot-1), a. India (Mahapatra & Panda, 1972). b. Senegal (Beye, 1974). c. pot experiment, India (Esakkimuthu et al., 1975). d. pot experiment, India (Agarwal, 1980). e. India (Patnaik & Gaikawad, 1969).
164

the literature is still smaller than for phosphorus. The variation in initial slope for this element is larger than for either nitrogen or phosphorus. One reason is that at maturity the larger part of the potassium is found in the straw. Therefore, variations in the grain/straw ratio have a more pronounced effect on the slope of these curves, whereas also losses of potassium due to inevitable leaf loss at the end of the growing period will have greater effect. Another reason for the variability may be the fact that the element has a double function in the plant. For one part it is an essential element for certain physiological functions, for another part it serves as a positive charge, accompanying organic and inorganic anions during transport through the plant. In the latter function it may be almost completely replaced by other positive ions, if present in sufficient amounts.
However, the minimum concentrations in the vegetative material at maturity seem to be around 0.008 kg kg"1 and in the grains between 0.0025 and 0.005 kg kg"1. The combination of these two values with a grain/straw ratio of one, yields an initial slope of 55-80 kg grain per kg potassium absorbed. The examples presented in Figure 43 all fall within this range.
Maize Yield-uptake curves for nitrogen on maize are presented in Figure 44.
Despite the fact that maize is a C4 species, which are reported to be more economical with respect to nitrogen (Brown, 1978), the initial slopes found here vary between 55 and 70 kg kg"1 and appear, thus, not to be different from those for rice. It is true that under low nitrogen availability the residual N concentration in the vegetative structures may drop to values as low as 0.002, which is lower than found for rice, but normal variations in grain/straw ratio mask this effect. Average grain/straw ratios for the experiments of Figure 44 vary between 0.85 and 1.33.
In Figure 45 yield-uptake curves for phosphorus on maize are given. The value of the initial efficiency varies between 420 and 590 kg kg"1, which is again very similar to the values found for rice, suggesting that the minimum P concentrations in the tissue are identical for this graminae as well.
For potassium on maize the number of suitable experiments found in the literature was even more limited than for rice. Whatever was available is presented in Figure 46, which again shows a wide variability in initial efficiencies. In this case it may well be that in some of the experiments presented the potassium - supplying capacity of the soil in the absence of fertilizer application was so high that the minimum levels in the tissue were not really attained.
Cassava Yield - uptake curves for the three macro - elements on cassava are present
ed in Figures 47, 48 and 49, respectively. For nitrogen, the initial efficiency in the examples presented here varies between 34 kg tuber dry matter per kg N taken up (Figure 47a) to 175 kg kg"1 (Figure 47b). These variations seem a
165

8 r -
90 -
180 L A
112.5 -
1 0 0 "
200
(a)
100 150
0.71
i
Id
6
75
50
- y
**
-A
(b)
i
100 u
200
200
200
Figure 44. The relation between total nitrogen uptake, u (kg ha-1), and grain yield, y (t ha-1), at a moisture content of 0.15 kg kg-' and the relation between nitrogen application, A (kg ha-1), and nitrogen uptake for maize. Numbers in lower half of the graph denote recovery fractions of applied fertilizer, a. Nigeria (Balasubramanian & Singh, 1982). b. USA (Olson, 1980). c USA (Jung et al., 1972). d. USA (Rabuffetti & Kamprath, 1977). e. Brasil (Grove et al., 1980). f. USA (Flynn et al., 1957).
little too high if the reasoning followed for rice and maize also applies to this crop. However, the ratio of root weight to top weight varies between 0.8 and 1.75, which is a much greater variation than in the case of grains. Part of this
166

4 r V
2 -
(a)
/ ' z u 10
A
6 r y
> hill band
. broadcast
40L A M • •
(c) >K—
^ «
15
20
4 0 L A
8 h
4 -
« Suwan Farm • Prome's Farm
2 5 -
50LA
30
60
(e)
/^ « conventional tillage • no tillage
u 20
i i
« Bladen Norfolk
u. 30
Figure 45. The relation between total phosphorus uptake, u (kg ha-'), and grain yield, y (t ha-') at a moisture content of 0.15 kg kg-', and the relation between phosphorus application, A (kg ha~'), and phosphorus uptake for maize. Numbers in lower half of the graphs denote recovery fractions of applied fertilizer, a. Mali (Traore, 1974). b. Nigeria (Kang & Yunusa, 1977). c. Thailand (Suwanarit, 1975). d. USA (Krantz et al., 1949). e. USA (Moschler & Martens, 1975).
variation may be due to the fact that leaves fallen from the plant in the later growth stages have not been taken into account in the final dry weight (Nij-holt, 1936). That has also its consequences for the total amount of N utilized,
167
8ry
75
150 L A
(a) K conventional 4 • no tillage » no dung
with dung
u 50 100
• • 1
_1 100
1 0 0 -
200 L A
* Minn. 3 • Minn. 4
150
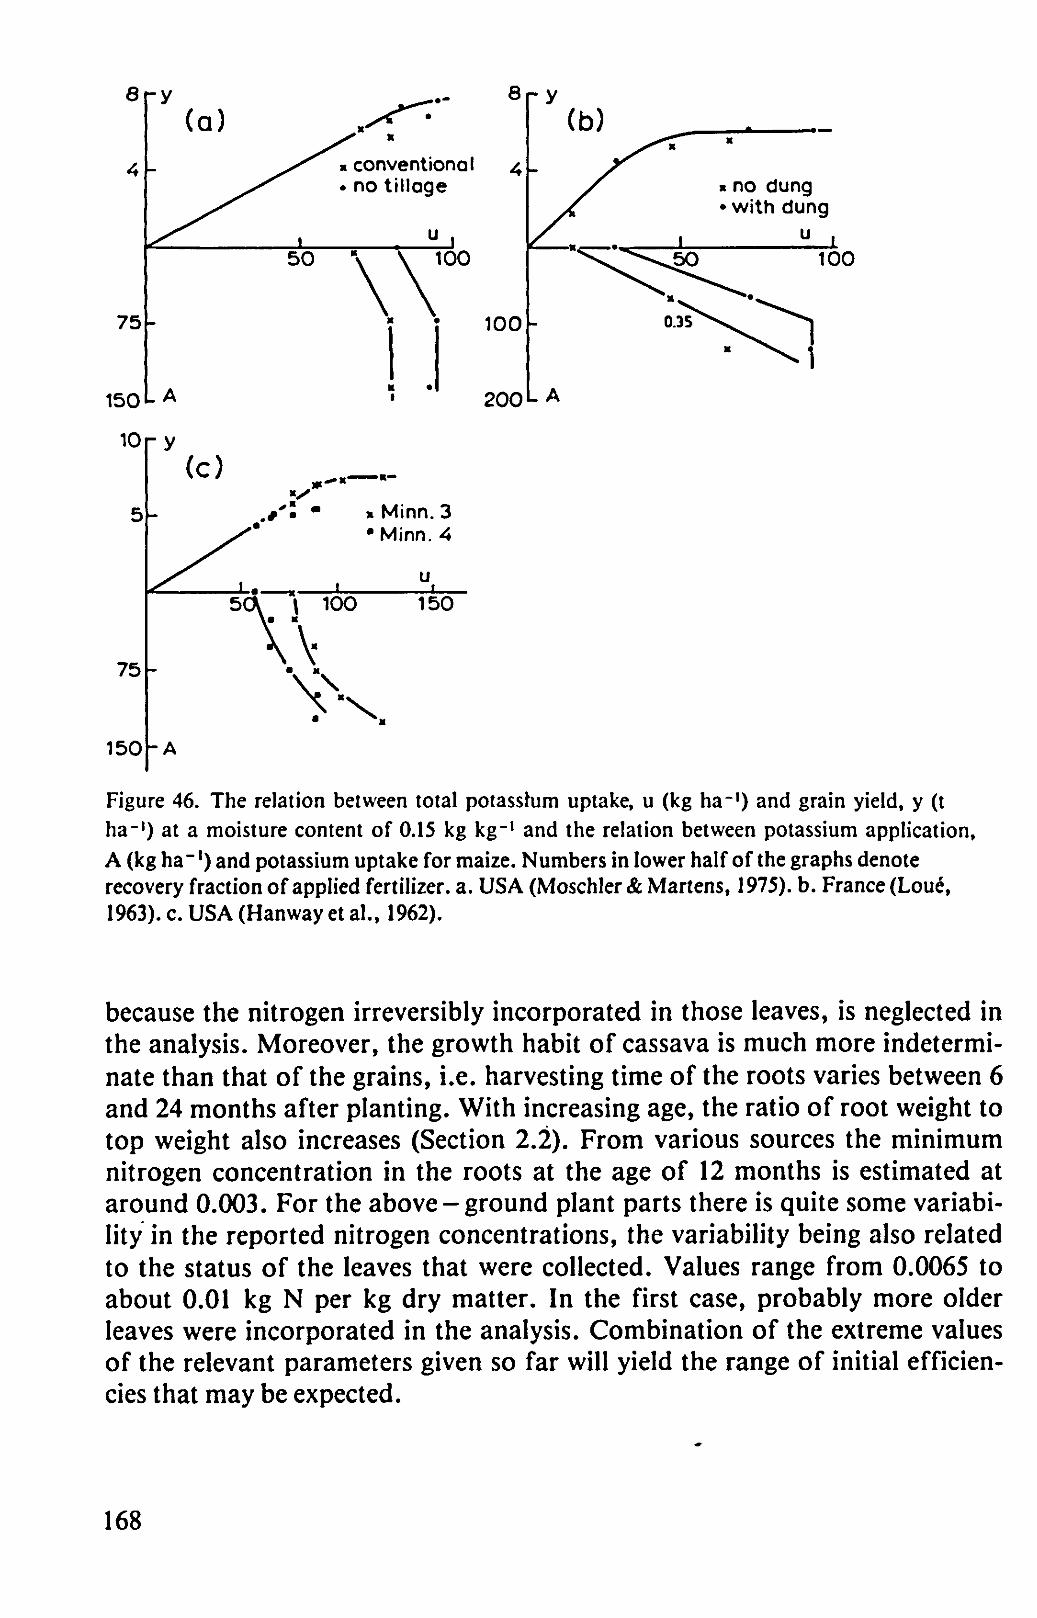
Figure 46. The relation between total potassium uptake, u (kg ha*1) and grain yield, y (t ha-1) at a moisture content of 0.15 kg kg-1 and the relation between potassium application, A (kg ha~') and potassium uptake for maize. Numbers in lower half of the graphs denote recovery fraction of applied fertilizer, a. USA (Moschler & Martens, 1975). b. France (Loue, 1963). c. USA (Hanway et al., 1962).
because the nitrogen irreversibly incorporated in those leaves, is neglected in the analysis. Moreover, the growth habit of cassava is much more indeterminate than that of the grains, i.e. harvesting time of the roots varies between 6 and 24 months after planting. With increasing age, the ratio of root weight to top weight also increases (Section 2.2). From various sources the minimum nitrogen concentration in the roots at the age of 12 months is estimated at around 0.003. For the above-ground plant parts there is quite some variability in the reported nitrogen concentrations, the variability being also related to the status of the leaves that were collected. Values range from 0.0065 to about 0.01 kg N per kg dry matter. In the first case, probably more older leaves were incorporated in the analysis. Combination of the extreme values of the relevant parameters given so far will yield the range of initial efficiencies that may be expected.
168

300
150
y - (a)
- *
j S .1 5
A
—«—
I
10 u
24 r
12-
"y
(b) .S
S^ 1
50
A
• 100
« ^
X
V 150
10r
100
200
y ' (d)
• Cidra «Corozal
200
L A
*u
10
37.5
75
- y (e)
- A
i 80
u
160
036
Figure 47. The relation between total nitrogen uptake, u (kg ha"1) and root dry matter yield, y (t ha-'), and the relation between nitrogen application, A (kg ha"1), and nitrogen uptake for cassava. Numbers in lower half of the graphs denote recovery fraction of applied' fertilizer (in a, u, y and A in g pof1). a. Argentine (Orioli et al., 1967). b. Indonesia (Nijholt, 1936). c. Malaysia (Kanapathy, 1974). d. Puerto Rico (Fox et al., 1975). e. Thailand (Somsak, 1974).
169

300
150
y
(a)
*
^ ^ ,
0.5
A
> ^
« 10
u
24 r
12-
r y (b) .
/ r 25
A
X
1 50
u
/
5 -
- y
-
(c)
X *
1
25 1
50
u
Figure 48. The relation between total phosphorus uptake, u (kg ha-1) and root dry matter yield, y (t ha*1), for cassava (in a, u, y and A in g pot*1), a. Argentine (Orioli et al., 1967). b. Indonesia (Nijholt, 1936). c. Malaysia (Kanapathy, 1974).
Exercise 55 Calculate the minimum and maximum value of the initial efficiency for nitrogen on cassava on the basis of the numerical values given in this section. What equation is applied?
The reasoning followed for nitrogen applies also to phosphorus and potassium. In Figure 48 the initial efficiency of phosphorus utilization varies between 230 and 510 kg tuber dry matter per kg P taken up. For potassium (Figure 49) the values range between 40 and 100 kg tuber dry matter per kg K absorbed.
On the whole, it must be said that the lack of quantitative data and the indeterminate growth habit of cassava are a disadvantage for the treatment of nutrient response of this crop. However, the indicative values given here enable a first approximation of the nutrient requirements of the crop for different production situations.
The ceiling yield level As mentioned in Subsection 4.1.1, the ceiling yield level of the yield-up-
170

300 -
150
(a)
24 r
12-
u 200 400 600
10
5
"y
A
(c)
•
50
/
X
1
100
u
150
12
6
" y
/ X
/
A
(d) X
/
1
100 1
200 i
300
u
Figure 49. The relation between total potassium uptake, u (kg ha-1), and root dry matter yield, y (t ha-1) for cassava (in a, u, y and A in g pot*1), a. Argentine (Orioli et al., 1967). b. Indonesia (Nijholt, 1936). c. Malaysia (Kanapathy, 1974). d. Madagascar (Dufournet & Goarin, 1957).
take curve is determined by the growth factor that is in short supply. By definition this plateau is beyond the point where the factor considered, i.e. the uptake of a particular nutrient element influences growth and production.
In Figure 50 some experimental data are summarized that illustrate the influence of various growth factors on the level of the plateau. Figure 50a shows the influence of the radiation level in a potential production situation (Production Situation 1) for bunded rice in the Central Plain of Thailand. The 'dry season' crop maturated during a period with an average daily irradiance of about 22 MJ m"2, whereas average daily irradiance during maturation of the 'wet season* crop amounted to about 17.5 MJ m"2.
Figure 50b illustrates the effect of moisture supply on the plateau level for maize grown in Missourri, USA. In 1951, a total of 625 mm of rain fell during the growing period of maize, whereas in 1953 it was only 306 mm during the same period. The experiment in question was a fertilizer experiment and not an irrigation experiment. Therefore it can be concluded that the plateau level is that of Production Situation 2 in 1953, but in 1951 it could be either that of Production Situation 1 or Production Situation 2.
171

• = dry season * = wet season
6
4
2
60
on
y
_A
(c) X
50
6
4
2
100
y
-
(b)
i -
50'
200 - A
xP 'O • P = 26 kg ha"
u
«=1951 • = 1953
u,
xN'O . . Ns100kgha
Figure 50. The relation between nutrient uptake, u (kg ha-1), and yield, y (t ha-1) and the relation between nutrient application, A (kg ha~l) and nutrient uptake. Numbers in lower half of the graphs denote recovery fraction of applied fertilizer, a. Rice, Thailand, y is grain yield at a moisture content of 0.15 kg kg-1, u and A are expressed in kg N ha-1 (Walcott et al., 1977). b. Maize, USA. y is grain yield at a moisture content of 0.15 kg kg, u and A are expressed in kg N ha-1 (Flynn et al., 1957). c. Grain sorghum, USA. y is grain yield at a moisture content of 0.15 kg kg, u and A are expressed in kg N ha-1 (Roy & Wright, 1973; 1974). d. Rice, Nigeria, y is grain yield at a moisture content of 0.15 kg kg, u and A are expressed in kg P ha*1 (Bredero, 1965).
Figure 50c refers to grain sorghum in the USA and illustrates the effect of phosphorus application on the level of the plateau. If no phosphorus is applied, the plateau level is a grain yield of about 3500 kg ha"1, whereas at a phosphorus application rate of 22 kg ha"1 the plateau level increases to about 5500 kg ha"1. On the basis of this information it is not possible to conclude whether the latter level indeed represents Production Situation 3, but it does not seem unlikely.
The reverse effect is illustrated in Figure 50d referring to bunded rice grown in Nigeria. Application of phosphorus in the absence of nitrogen application leads to an increase in yield, but the effect is rather small, because soon nitrogen becomes the limiting factor. At a nitrogen application rate of about
172
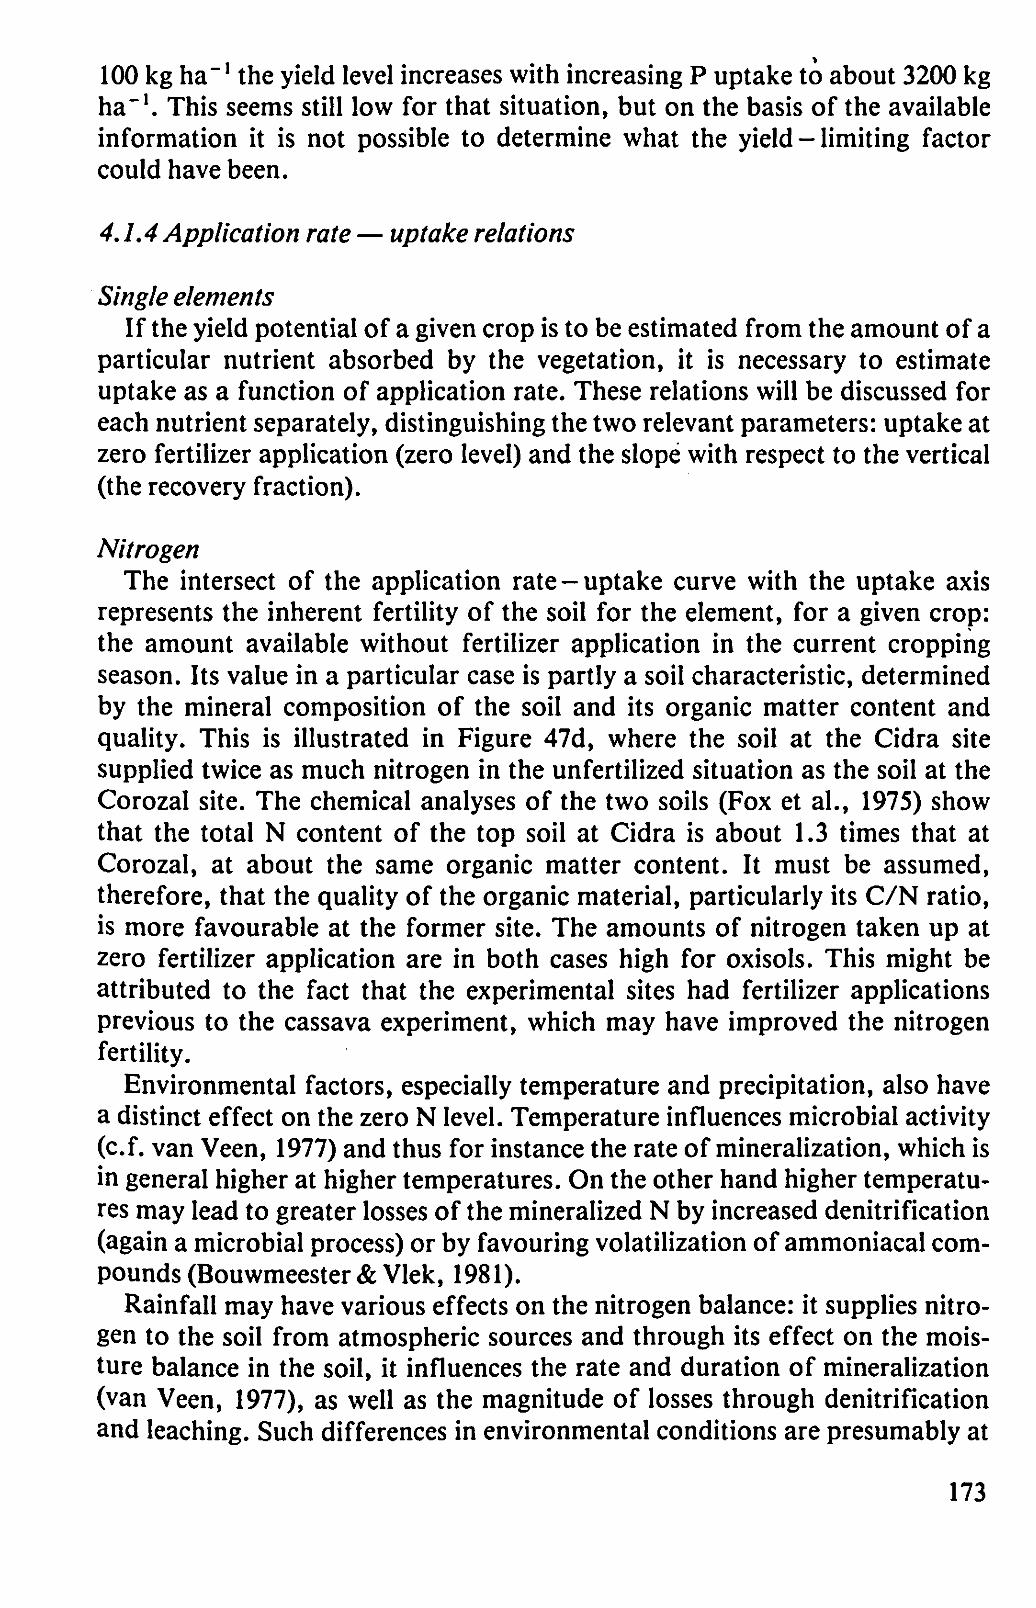
100 kg ha"1 the yield level increases with increasing P uptake to about 3200 kg ha"1. This seems still low for that situation, but on the basis of the available information it is not possible to determine what the yield - limiting factor could have been.
4.1.4 Application rate — uptake relations
Single elements If the yield potential of a given crop is to be estimated from the amount of a
particular nutrient absorbed by the vegetation, it is necessary to estimate uptake as a function of application rate. These relations will be discussed for each nutrient separately, distinguishing the two relevant parameters: uptake at zero fertilizer application (zero level) and the slope with respect to the vertical (the recovery fraction).
Nitrogen The intersect of the application rate - uptake curve with the uptake axis
represents the inherent fertility of the soil for the element, for a given crop: the amount available without fertilizer application in the current cropping season. Its value in a particular case is partly a soil characteristic, determined by the mineral composition of the soil and its organic matter content and quality. This is illustrated in Figure 47d, where the soil at the Cidra site supplied twice as much nitrogen in the unfertilized situation as the soil at the Corozal site. The chemical analyses of the two soils (Fox et al., 1975) show that the total N content of the top soil at Cidra is about 1.3 times that at Corozal, at about the same organic matter content. It must be assumed, therefore, that the quality of the organic material, particularly its C/N ratio, is more favourable at the former site. The amounts of nitrogen taken up at zero fertilizer application are in both cases high for oxisols. This might be attributed to the fact that the experimental sites had fertilizer applications previous to the cassava experiment, which may have improved the nitrogen fertility.
Environmental factors, especially temperature and precipitation, also have a distinct effect on the zero N level. Temperature influences microbial activity (cf. van Veen, 1977) and thus for instance the rate of mineralization, which is in general higher at higher temperatures. On the other hand higher temperatures may lead to greater losses of the mineralized N by increased denitrification (again a microbial process) or by favouring volatilization of ammoniacal compounds (Bouwmeester&Vlek, 1981).
Rainfall may have various effects on the nitrogen balance: it supplies nitrogen to the soil from atmospheric sources and through its effect on the moisture balance in the soil, it influences the rate and duration of mineralization (van Veen, 1977), as well as the magnitude of losses through denitrification and leaching. Such differences in environmental conditions are presumably at
173

the basis of (sometimes large) differences in zero N level between years, as in Figures 41a and 41c. In these cases it is not possible to pinpoint the exact process responsible for the differences, because the reports do not provide sufficient details.
Some other examples, mostly referring to experiments in the temperate zone, are given in Figure 51. The first one refers to the first spring cut after an early nitrogen application to permanent pasture in the Netherlands. The spring in 1961 was warm with almost normal precipitation, whereas in 1962 it was a cold spring with rainfall about 25% above normal. In the latter year the low temperatures, hampering microbial activity and the high rainfall, favouring denitrification and leaching, resulted in a zero N level of less than half that of the previous season.
In Figure 51b, the effect of precipitation per se is illustrated for a winter wheat crop in Germany. In one of the treatments of this experiment winter rainfall was intercepted by protective shelters, which increased the uptake of nitrogen in the non - fertilized situation by about 15 kg ha"1, presumably because leaching of the mineralized nitrogen beyond the rooting zone was prevented (and maybe denitrification was suppressed).
Land reclamation also improves the availability of native nitrogen as illustrated in Figure 51c, which refers to an experiment with winter wheat in one of the reclaimed polders in the Netherlands. In the well —drained plot, where the watertable was below 30 cm throughout the growing period, appreciably more native N is available to the crop than in the plot where under natural drainage the watertable was less than 10 cm below the surface from October till April. In the latter situation, the high soil-water content and the associated low oxygen concentration hamper organic matter decomposition and favour denitrification. In many cases, therefore, land reclamation has a triple effect on crop yield, as it improves concurrently the plateau level, the uptake at the zero N level and the efficiency of nitrogen - fertilizer utilization (Section 7.1).
Management practices can also have an influence on the uptake of nitrogen from natural sources. Figure 5Id shows that the introduction of a leguminous crop in a rotation increased the uptake at zero — fertilizer application, in this case by about 25 kg ha"1. The magnitude of the gain depends on the growing conditions for the legume, the effectiveness of nodulation and nitrogen fixation and the conditions for decomposition in the subsequent crop growing season.
Figure 51e illustrates the effect of weed control on nitrogen availability at zero - fertilizer application. When weeds are allowed to compete with the crop, part of the available nitrogen is absorbed by these unwanted plants and is thus lost for the crop. In this particular case, the difference in nitrogen uptake by the crop amounts to about 45 kg ha"1.
The effect of a rather common phenomenon in growth of rice under rained conditions is illustrated in Figure 51 f: that of temporary,drying of the field when rain is insufficient to maintain a water layer. In the situation depicted
174

05
>*•<
* without vetch • vetch in rotation
^55" \
8 r y (e)
• weeding * no weeding
u
100
12
9
6
75
150
- y
A \
- A
(c) , • "
/
J?' » shallow water table .well-drained
u 150
x continuous flooding • intermittent drying
Figure 51. The relation between total nitrogen uptake, u (kg kg*1), and yield, y (t ha-1) and that between nitrogen application (A in kg ha-1) and nitrogen uptake. Numbers in lower half of the graphs denote recovery fraction of applied fertilizer, a. Permanent pasture, the Netherlands, y is total dry matter (Oostendorp, 1964). b. Winter wheat, Western Germany. yf
is grain yield at a moisture content of 0.15 kg kg-1, c. Winter wheat, the Netherlands, y is total dry matter (Sieben, 1974). d. Rice, USA. y is grain yield at a moisture content of 0.15 kg kg-1 (Williams et al., 1972). e. Maize, Nigeria, y is grain yield at a moisture content of 0.15 kg kg-1 (Kang et al., 1977). f. Rice, USA. y is grain yield at a moisture content of 0.15 kg kg-' (Patrick et al., 1967).
175

here, intermittent drying substantially reduces the availability of native nitrogen, as compared to situations of continuous flooding. The most likely explanation is that during the periods of soil drying nitrification takes place, leading to an abundance of nitrates in the soil. During subsequent flooding, reduced conditions build up in the root zone and the resulting denitrification leads to the loss of nitrogen from the system. Poor water control is in many cases the cause of substantial losses of nitrogen from the soil-plant system of bunded rice.
In conclusion, it may be stated that despite the existence of a great deal of knowledge about the factors influencing nitrogen availability at zero - fertilizer application, reliable quantitative predictions for concrete situations are very difficult. For many situations, an alternative is the analysis of yield data at low input levels, from which nitrogen uptake may be derived (Section 4.2).
The slope of the application - uptake curve represents the efficiency of uptake of the fertilizer, or in other words the fraction of that fertilizer that is recovered in the (mostly above-ground) plant material. This variable determines how much of the expensive input is effectively utilized and is therefore of prime importance for decisions on economically feasible fertilizer application rates.
In general there is a positive correlation between the uptake at zero - fertilizer application and the recovery fraction in a given situation (cf. Brockman et al., 1971), because the processes rendering the nutrient unavailable to the plants act in identical ways on nitrogen from natural sources and on nitrogen applied as fertilizer. In the examples presented in Figures 41, 44 and 47, in most cases a higher uptake of native N coincides with a higher recovery fraction.
In addition to the factors discussed before, the recovery fraction may be
*(NHJ2S0* NaN03
.N03 • urea
Figure 52. The relation between total nitrogen uptake, u (kg ha1) and yield, y(t ha*1), and that between nitrogen application, A (kg ha-1), and nitrogen uptake. Numbers in lower half of the graphs denote recovery fraction of applied fertilizer, a. Winter wheat, the Netherlands. Netherlands, y is grain yield at a moisture content of 0.15 kg kg-1 (Lehr, 1959). b. Natural rangeland, Mali, y is total dry matter (Penning de Vries et al., 1980).
176
influenced by the type of fertilizer applied, as illustrated in Figure 52a for a winter wheat crop growing in one of the reclaimed Usselmeer polders. The nitrate fertilizer is absorbed 2.5 times as efficiently as the ammoniacal fertilizer. This is due to losses through ammonia volatilization on the lime-rich gritty clay soil (pH 8.2) in these polders.
In contrast to that, the recovery of nitrate fertilizer is less than one third of that of urea for the situation depicted in Figure 52b. This refers to an experiment on a heavy clay soil in the Sahelian region, which received run-off water from surrounding areas and was flooded for some time during the growing season. The low recovery of nitrate must be due to denitrification and/or leaching. The much higher recovery of urea indicates that nitrification must have been slow under these conditions, so that nitrogen remained in the system in ammoniacal form.
Fertilizer recovery is also influenced by timing and method of application. The effect of method of application is illustrated in Figure 41 f, which refers to an experiment with bunded rice on Java, Indonesia. Placement of urea fertilizer directly into the reduced soil layer, where oxygen is absent, prevents the transformation of ammonium ions, formed after hydrolysis of urea into nitrates (nitrification), and the subsequent loss through denitrification. When urea is broadcast onto the layer of standing water, nitrification takes place in the aerobic environment, after which the nitrates formed enter the reduced soil layer, either by mass flow or by diffusion. In that environment, rapid denitrification follows, which results in a much lower availability of nitrogen for the vegetation.
Split application of the total amount of nitrogen fertilizer generally results in higher recovery fractions (Figure 41e), because it leads to a shorter average residence time of the element in the soil and hence to lower losses. The same effect plays a role in comparisons between early application and later applications. In the latter situation, the rate of crop growth is higher, which increases the demand for nitrogen and hence the rate of nutrient uptake.
Differences in recovery fraction between different cultivars (Figures 41b and 44c) may also be related to the same phenomenon. Minabar-2 is a traditional tall cultivar that produces much more vegetative material than the improved short straw cultivar IR8 (grain/straw ratio 0.9 vs. 1.5). The recovery fractions in practice vary typically between 0.1 and 0.8, with a value of 0.5 as an Acceptable norm'. If the recovery fraction is much lower than that, too much of the expensive nitrogen fertilizer is lost and achieving much higher values may require too much investment in sophisticated management practices.
Phosphorus In many parts of the world, crop production under natural conditions is
limited by phosphorus availability (e.g. Penning de Vries et al., 1980). Therefore phosphorus fertilizer application is necessary to achieve potential yields.
177
In contrast to nitrogen, a major part of the total phosphorus store in a soil may be present as inorganic compounds of low solubility, notably aluminium, iron and calcium compounds. There are, however, large variations in the relative proportions of the inorganic and organic forms of phosphorus in different soils.
The inherent fertility level of the soil for phosphorus (zero P level) may vary as a result of variations in mineralogical composition as well as in quantity and quality of their organic matter content. Such differences are illustrated in Figure 45c, where Prome's farm yields almost twice as much P as Suwan's farm. That may be related to the difference in pH, because the former soil is slightly alkaline, the latter acidic. Under low pH the concentration of Al ions tends to be higher, leading to formation of insoluble phosphates when fertilizer is applied.
As for nitrogen, different environmental conditions may result in differences in the zero P level. This is partly related to the conditions affecting decomposition of organic material, which supplies part of the phosphorus, and partly to the inorganic P cycle in the soil, which is affected by temperature and soil moisture conditions (Beek, 1979).
There is an interesting example of the interaction between nitrogen and phosphorus in Figure 42c, where increased N availability improves uptake of native phosphorus even though phosphorus is the limiting element for production. This aspect will be treated in more detail in Subsection 4.1.4.
The relation between application rate and uptake is much more complex for phosphate fertilizers than for nitrogen, as is clear from Figures 42 and 45. In some situations the relation seems to be a straight line (Figure 45c), but the recovery fraction is so low in this case that not much importance can be attached to these results.
The complexity of the relation may be expected because, contrary to the situation with N, the kinetics of the reactions of phosphorus between the soil solution and the solid phase of the soil are not of first-order (Beek, 1979). Phosphate ions are effectively removed from the soil solution by absorption, precipitation and immobilization, so that the concentration in the soil solution is more or less constant and not proportional to the amount of fertilizer applied. The recovery of applied phosphorus fertilizer is therefore in general low and often decreases with increasing rates of application, because the longer residence time in the soil leads to larger proportions being immobilized by precipitation or incorporation in the organic fraction (Figures 42c, 45b). In such situations, where recovery is low, a more efficient utilization of the fertilizer may be achieved by concentrating the fertilizer in a limited soil volume, for instance by placement (de Wit, 1953).
A 'special' case is encountered in Figure 42f, where the recovery fraction first decreases with increasing application rate and subsequently increases at higher application rates. A possible explanation for this phenomenon is that with addition of phosphates to the soil precipitation takes place, which increa-
178
ses with increasing concentration of phosphates. At the highest application rate, all free cations that may form insoluble phosphates (Fe3+, Al3+, Ca2+) are exhausted. The phosphate concentration in the soil solution will then rise, resulting in increased uptake of the fertilizer.
The results presented here clearly illustrate that the relation between phosphorus application rate and uptake by a crop may be highly variable and that it is difficult to predict the effect of phosphorus application without detailed knowledge of the local conditions.
Potassium The potassium content in plant tissue is generally high as may be deduced
from the uptake-yield curves. In areas with less intensive agriculture, however, yields are predominantly limited by availability of nitrogen and phosphorus, hence potassium shortage is not widespread. Moreover, at harvest, most of the potassium is in the crop residues that are partly or completely left in the field or returned to the field later on. That is probably the main reason that so few relevant experimental results could be collected.
The potassium - supplying capacity of soils is mainly determined by their mineralogical composition. The main sources of the element are minerals like micas and feldspars, which upon weathering release large amounts of potassium. Therefore clay soils, which contain more of these minerals, are generally superior in the supply of native potassium to sandy soils.
The reactions involved in the supply of potassium from the soil store to the plant are equilibrium reactions whose rate is governed by the relative concentrations of the various forms of potassium: ions in the soil solution, ions adsorbed in exchangeable form on negatively - charged clay or organic matter particles and potassium chemically bound in the clay minerals (van Diest, 1978). Thus, conditions changing these relative concentrations influence the zero K level. Weather plays an important role: higher temperatures and more favourable moisture conditions favour weathering of minerals and increase potassium availability. Differences between years may therefore be considerable (Figures 43a and b).
It has also been observed that crops differ considerably in their ability to extract potassium from a given soil (van Keulen & van Heemst, 1982), which could be related to the different potassium requirements of the crops, but also to the length of the growing season and hence the time available for uptake.
Two main processes influence the efficiency of uptake of potassium fertilizer. In sandy soils potassium ions are very mobile and may be easily lost by leaching. Clay soils, on the other hand - especially those having a high proportion of a special type of clay minerals (illite, vermiculite) - may fix potassium. In that case, potassium is absorbed at specific sites in the clay lattice, rendering it unavailable for plant uptake. The result is that, especially at lower application levels, the recovery of fertilizer may be very low (cf. Figure 43b) but increases gradually at higher levels of application, when the
179

absorption sites are more or less saturated (van Keulen & van Heemst, 1982). Where the processes of leaching and fixation are not of great importance,
recoveries of potassium fertilizers are generally high, and, as in the case of nitrogen, independent of the amount applied (Figures 43a and 46b).
Levelling off of the application - uptake rate at high levels of application (Figure 46b) must be attributed to active exclusion of potassium ions by the plant at high concentrations in the solution. When the concentration in the tissue has reached its maximum value, further uptake is apparently inhibited. This will, however, only happen at very high levels, because 'luxury* consumption does apparently occur quite often (Figures 43b and 46b).
4.1.5 Interaction between elements
In Subsection 4.1.2 it was shown that the response of a crop to a specific element is also influenced by the supply of other elements. For example, increased uptake of nitrogen may not lead to higher yields if the supply of phosphorus is insufficient (Figure 50c). However, the uptake of a specific element may also be affected by the supply of other elements, as is illustrated for example in Figures 50c and d. It shows, that the application of phosphorus increases the uptake of nitrogen in the absence of nitrogen application, and vice versa. Similar reactions have also been observed in Sahelian natural pasture (Penning de Vries & van Keulen, 1982) and in other experiments with bunded rice (de Wit, 1957).
For an explanation of this phenomenon, it is necessary to consider the dynamics of the two elements in the plant tissue. It has been argued that at maturity species - characteristic minimum and maximum element concentrations exist in the various plant organs, provided that other elements are not in short supply. This is not only the case at maturity, but at each point in the plants life cycle such characteristic minimum and maximum concentrations may be established. In general there is a ratio of about four to one between the maximum and the minimum concentrations of one element at a particular phenological stage. Both values decline during ageing of the plant. This gradual decrease in characteristic concentration is related to the physiological functioning of the plant. In the early stages of plant growth, protein-rich' material - mainly in the leaves - is being produced, whereas later on more supporting tissue, such as cell walls is formed, consisting for the larger part of structural carbohydrates with less nitrogenous compounds. The specific function of nitrogen and that of phosphorus in the plant are strongly related: both elements are found in the nucleic acids; nitrogen is an essential component of the enzymes, whereas phosphorus plays a role in the molecules that are responsible for energy transfer in enzymatic processes. It may be expected, therefore, that a correlation exists between the functional concentration of nitrogen in the plant and that of phosphorus. That is borne out by experimental results obtained in the field (Penning de Vries & van Keulen, 1982) and
180
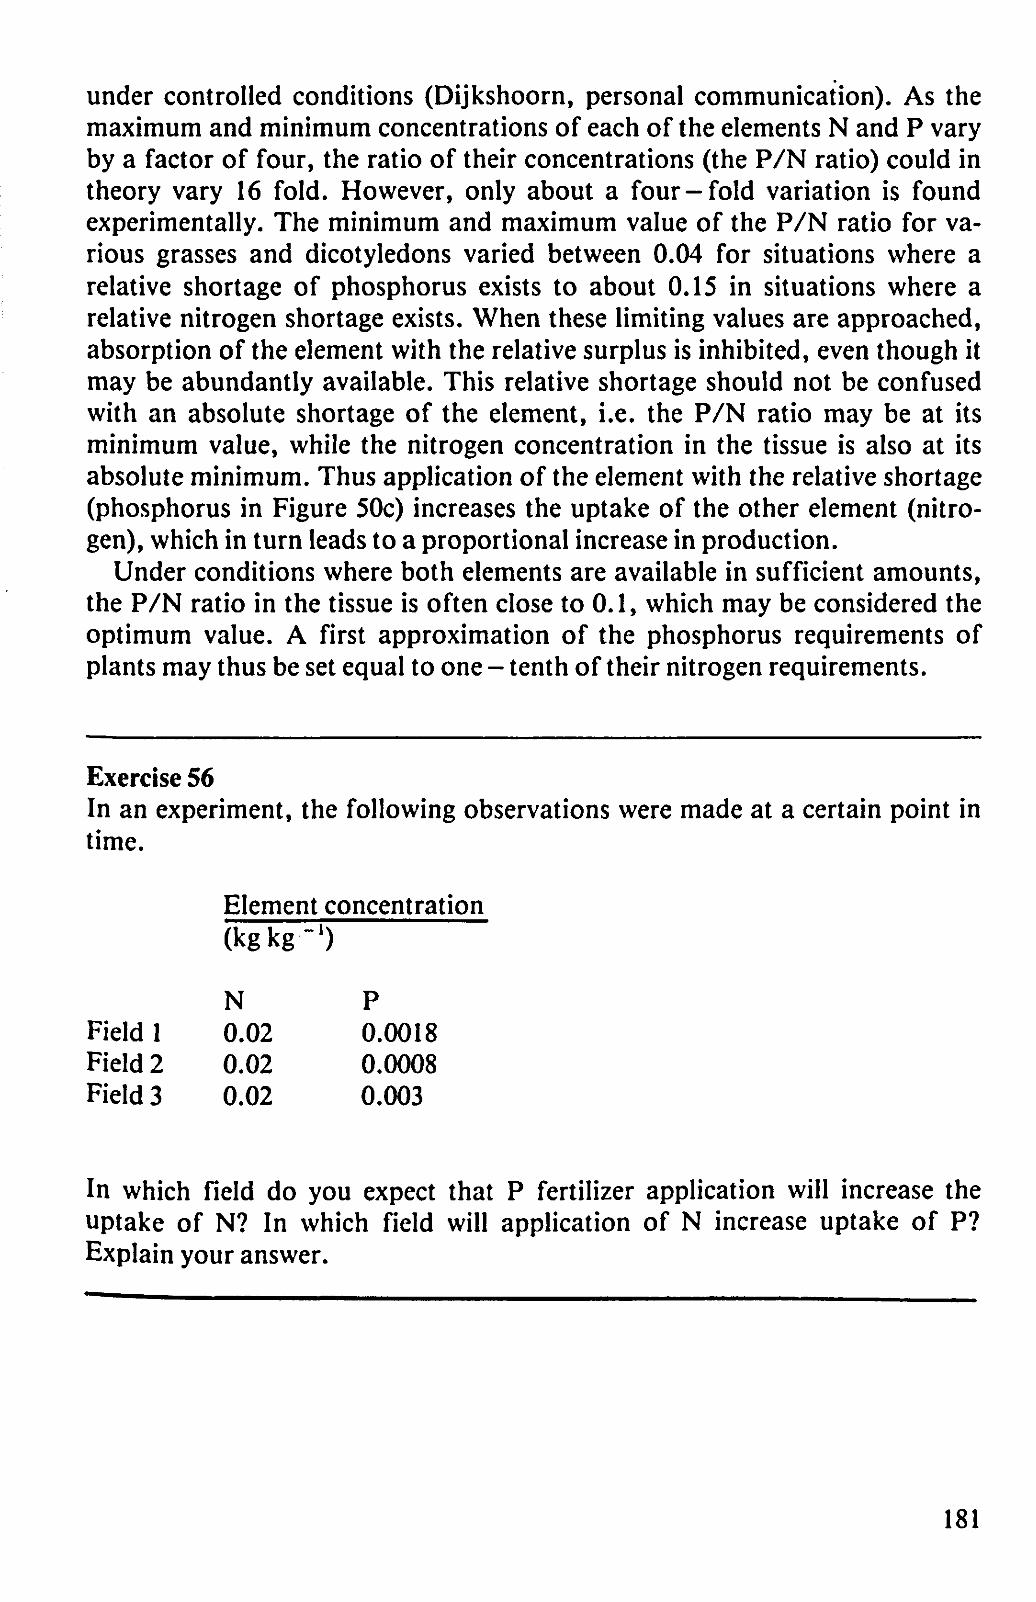
under controlled conditions (Dijkshoorn, personal communication). As the maximum and minimum concentrations of each of the elements N and P vary by a factor of four, the ratio of their concentrations (the P/N ratio) could in theory vary 16 fold. However, only about a four-fold variation is found experimentally. The minimum and maximum value of the P/N ratio for various grasses and dicotyledons varied between 0.04 for situations where a relative shortage of phosphorus exists to about 0.15 in situations where a relative nitrogen shortage exists. When these limiting values are approached, absorption of the element with the relative surplus is inhibited, even though it may be abundantly available. This relative shortage should not be confused with an absolute shortage of the element, i.e. the P/N ratio may be at its minimum value, while the nitrogen concentration in the tissue is also at its absolute minimum. Thus application of the element with the relative shortage (phosphorus in Figure 50c) increases the uptake of the other element (nitrogen), which in turn leads to a proportional increase in production.
Under conditions where both elements are available in sufficient amounts, the P/N ratio in the tissue is often close to 0.1, which may be considered the optimum value. A first approximation of the phosphorus requirements of plants may thus be set equal to one - tenth of their nitrogen requirements.
Exercise 56 In an experiment, the following observations were made at a certain point in time.
Element concentration
Field 1 Field 2 Field 3
(kg kg"')
N 0.02 0.02 0.02
P 0.0018 0.0008 0.003
In which field do you expect that P fertilizer application will increase the uptake of N? In which field will application of N increase uptake of P? Explain your answer.
181