4 research and development technical report eco'm ... · pdf file4 research and...
TRANSCRIPT

This Document Contains Page/s
Reproduced Fromn~ Best Available Copy
4 Research and Development Technical Report
ECO'M -4548
~'_CHEMICALLY POLISHED QUA RTZ~
)0 John R.f evu
yetronics Technology & Devices Laboratory
0*9Novin77
I ~ DISTRIBUTION STATEMENTc., : Approved for public release;
LU distribution unlimited.
US ARMY ELECTRONICS COMMAND FORT MONMOUTH, NEW JERSEY 07103

This Document Contains Page/s
_.._. . ...-.. .. ' Reproduced FromBest Available Copy
NOTICES
Disclaimers
The findings in this report are not to be construed as anofficial Department of the Army position, unless so desig-nated by other authorized documents.
The citation of trade names and names of manufacturers inthis report is not to be construed as official Governmentindorsement or approval of commercial products or servicesreferenced herein.
Disposition
Destroy this report when it is no longer needed. Do notreturn it to the originator.

UNCLASSI FIEDSECURITY CLASSIFICATION OF THIS PAGE CWhef Dae. Bse"e4_________________
REPORT DOCMENTATION PAGE _____________ram_
1. RUPORT NUMICA/ 12 GOVT ACCESSIO : NO S.RCI8E CATALOG NUMBER
14. TITLE (NId Sub,111e) S. TYPE OF REPORT 4k PEIWOD COVEREDTechnica.J. Report
CHEMICALLY POLISHED QUARTZ janita!Z;76-September 77S. PERFORING ORE. REPORT NMBUER
1. AuTap~pjS. CONAC IRGAT Noisly"
John R. Vig, John W. LeBus, andRaymond L. Filler
11. WERFORMING ORGANIZATION NAME AND ADDRESS Ia. pR YASKSM
US Army Electronics Commnand A u.RATTN: DRSEL-TL-MF 612705.H94.F3.11.O1 R450Fort Monmouth, NJ 07703 ILI 62705 M. 9A
it. CONTROLLING OFFICE NAME AND ADDRESS 12. ARPORT DATS
US Army Electron ics Conmiand November 1977ATTN: DRSEL-TL-MF IS. NUM11911OF PACEIFort Monmouth, NJ 0770ý 37____________I.MONI ToRIN AGENCY NAME A ADDRESS(II different foam Cuentrolihtj Office) IS. SECURITY CLASS. (of Mile *on)IUNCLASSIFIED
a, UNIFICATION DWNGMAOIPG
16. DISTRIBUTION STATEMEN4T (of this Roporn)
Statement A. Approved for public release; distribution unlimitejde'ý
17. DISTRIBUTION STATEMENT (of glue abstract entered In lilac 20), If differnat from ftspeN) T"
IS. SUPPLEMENTARY NOTES
This report is a slightly modified version of the report which appeared inthe Proceedings of the 31st Annual Symposium on Frequency Control, June 1977.
IS. IKEY wORDS (Coal mu. on reverse aide It necessary and Identdify by black rumnbfr)
QurzDislocations Quartz ResonatorsEcigEtch Channels Quartz CrystalsLpigCultured Quartz Chemical Polishing
Etching in a saturated solution of anmnonium bifluoride is showun to be capable of
of poli~ing depends primarily on the temperature of the etching bath. In an188 degjree C etching bath, starting with 3 micrometers lapped blanks, chemicallypolished blanks with a surface roughness of 0.1 micrometer and a roughness
D JAN" 3 EIIOOIOVSISSLT UNCLASSIFIEDSECURITY CLASSIFICATION OF rhIS PAGE (*AN b4100 iatord

I a TV pkgPAVIOW9 TI PH~A639M% AM
AA STRACT (continued)
angle of 1 degree can be produced in 15 minutes. Starting with a finer surfacefinish can produce a smoother chemically polished surface.
Chemically polished blanks are shown to be extremely strong. Fundamental mode20 MHz resonators made with chemically polished natural quartz blanks showed noQ degradation with increasing depth of etch.
Of sixteen different varieties of cultured a from ten different growers,most were found not to be suitable for chemical lishing because of a' largenumber of etch channeis generated by the etching. The 'incidence of channelsvaried greatly from cultured quartz to cultured qua z. A vacuum-sweptcultured quartz was the only variety from which chem al polishing couldproduce blanks free of etch channels. Of a large numb r of 6.4 mm diameterchemically polished natural quartz blanks, approximatel two-thirds were freeof etch channels.
MC!SIN for
t'" IS
...... ............ .......
•1,•I,3 T / 4! •q ,T CIALE
UNCLASSIFIEDLSECURITY CLASIPICATION OF TNIS FA02WMOM DOMt MR0t0l6

CONITNTS
INTRODUCTION ............... ........................... . . . 1
CHEMICAL POLISHING ................. ........................... 1
ETCHING EXPERIMENTS ...................... .......................... 4
SURFACE EVALUATION.......................... . 4
Etching Apparatus . ...... .... ... ... .. ...... . 6
Etching Procedure . ... . ............... ... ... 8
Inspection Procedure ...................................... . 10
Etching Variables ............... ......................... 11
a. Depth of Etch .......... ...................... 11
b. Surface Finish Prior to Etching ................. .11
c. Temperature ....... ................... ... ....... 20
d. Agitation................................... . . . . 20e. tc Bath Depletio . . . .. . .. .. .. . . . .. . . 21
Se. Etch BtDeeton.............................2
f. Quality of Quartz--Natural vs. Cultured . . . .... .. 21
THE STRENGTHS OF CHEMICALLY POLISHED BLANKS ....... .............. .. 29
THE Q OF CHEMICALLY POLISHED RESONATORS ......... ................ .. 31
CONCLUSIONS ....................... .............................. . 33
ACKNOWLEDGEMENTS ............... ........................... . 33
REFERENCES ............... ............................... 34
APPENDIX A ................ ............................... ....... 37
FIGURES:
1. Polished Surface after Etching ......... .................. 2
2. A Rough Surface at the Beginning of Etching .......... 3
3. Chemically Polished Surface .... ................... . ..... 3
4. SEM Micrographs of the Same Surface from
Two Different Observation Angles.. ...... .....................5

5. Profile Meter Scans of the Same Surfacealong Two Orthogonal Directions ............. ................ 6
6. Etching Apparatus ...... .. ....................... 7
7. Temperature Dependence of Etching Rate ........ ............. 9
8. Unetched 3 pm Lapped Surface .......... ................. ..12
9. Surface Etched to Af - 1.5fof 13................13o f
10. Surface Etched to Af = 2.1foff ................ 13
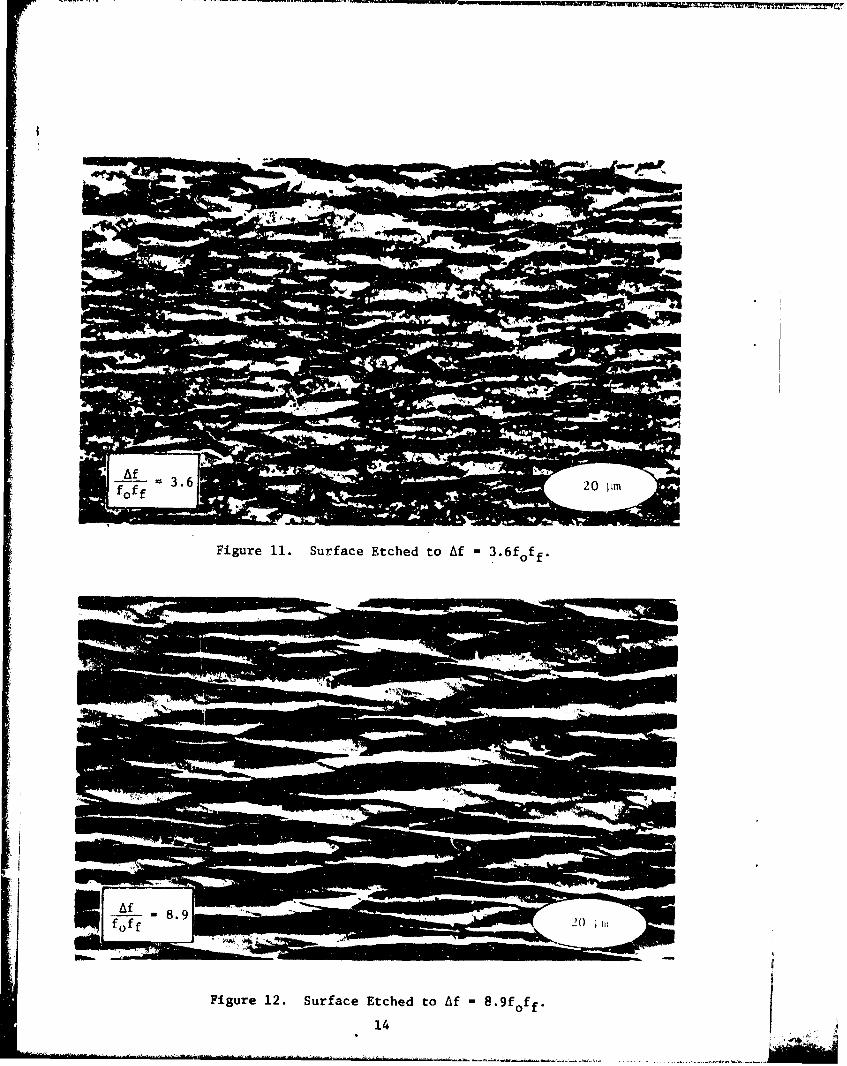
11. Surface Etched to Af = 3.6foff .................. 14
12. Surface Etched to Af - 8.9foff ........ ................. .. 14
13. Surface Etched to Af - 31.Sfoff ......... ................ .. 15
14. Surface Etched to Af = 85foff ......... ................. .. 15
15. Surface Roughness vs. Depth of Etching for3 pm and 12 pm Lapped Blanks .......... .................. ..16
16. Roughness Angle vs. Depth of Etching for3 pm and 12 pm Lapped Blanks .......... .................. ..17
17. Profile Meter Scan of Polished Blank afterEtching to Af - 92foff .......... ..................... .. 18
18. 3 Um MICROGRIT Abrasive ........... .................... 19
19. A Cultured Quartz Blank after Etching ....... ........... .. 23
20. Etch Pits and Etch Channels in Deeply Etched Cultured Quartz . 24
21. Etch Channels at the Bottom of Etch Pits ...... ............ 25
22. Etch Channels Observed under a Microscopewith Edge Illumination .......... ..................... .. 25
23. Etch Channels in a Blank Made of Poor Quality Cultured Quartz . 26
24. Vacuum Swept vs. Unswept Blanks from the Same Bar ofCultured Quartz ................. ........................ .. 27
25. Etch Pit in a Deeply Etched Natural Quartz Blank ............ ..29
26. Apparatus for Blank Strength Evaluation ..... ............ .. 30
TABLES
SA-I. The Etch Rates of Quartz
Aii

INTRODUCTION
High precision and high `requency quartz resonators, particularly thosefor high shock applications, require quartz plates whose surfaces are free ofimperfections, such as scratches and pits. The most common method of achiev-ing such surfaces is mechanical polishing. The mechanical polishing processesare difficult to control (i.e., it is difficult to produce defect-free sur-faces, at the correct frequency, with a high yield). Moreover, as has been'known since the last century, even when the polished surfaces appear to befree of defects when examined at high magnification, the surfaces containhidden defIcts. 1I 2 These defects can be revealed by X-ray diffractiontopography and by etching subsequent to polishing.
Figure 1 is an SEM micrograph which shows the two most co.,only observeddefects revealed by etching polished quartz blanks: scratch marks and pits.As we shall discuss later, the pits often extend deep into the blanks.
The objective of the study to be described in this report was to overcomethe difficulties associated with mechanical polishing by finding an etchingprocedure capable of producing chemically polished quartz crystal surfaces.
CHEMICAL POLISHING
At the beginning of this study, a literature search was conducted todetermine what previous studies, if any, have been reported on the subject ofpolishing quartz chemically. No such reports were found. Perhaps, this isdue to the fact that it has been widely known that the etch rates of quartzvary greatly with crystallographic direction. 4 ' 5 The rate along the fastestetch direction, the Z direction, is over one hundred times the rate along theslowest etch direction, which is the -X direction for right-handed quartz. Atfirst glance, therefore, achieving a chemically polished quartz surface mayseem like a hopeless task.
It has, however, been shown th&t other highly anisotropic materials, suchas silicon and germanium, can be polished chemically. 0 To understand why suchanisotropic materials can be so polished, let us examine the etchingmechanism.
i. Rabinowitz, E., "Polishing," Scientific American, Vol. 218, pp. 91-99,
June 1968.
2. Holland, L., "The Properties of Glass Surfaces," London: Chapman andHall, Chapter 1 (1964).
3. Newkirk, J. B., Young, J. D., and Spencer, J. P., "Defect Structures onPolished Quartz Surfaces as Seen by X-ray Diffraction Microscopy," J.Appl. Phys. Vol. 35, pp. 1362-1363 (1964).
4. Frondel, C., "The System of Mineralogy ... ,vol. III, Silica Minerals,New York and London: John Wiley and Sons, Inc., pp. 162-163 (1962).
5. Ernaberger, F. M., "Structural Effects in the Chemical .Reactivity ofSilica and Silicates," J. Phys. Chem. Solids, Vol. 13, pp. 347-351 (1960).
6. Holmes, P. J., "The Electrochemistry of Semiconductors," London and NewYork: Academic Press, Chapters 6 and 8 (1962).

,llow
Figure 1. Polished Surface after EtcHig.
Etching can be considered to be a five-step process. The etchant must:
1. diffuse to the surface,2. be adsorbed,3. react chemically;
the reaction products must:
4. be desorbed, and5. diffuse away from the surface.
The etching rate may be limited by any one of these steps. In chemicalpolishing, the rate controlling step is generally the diffusion to or fromthe surface. Diffusion control means that, in particular, the inherent rateat which a reaction takes place at the surface is higher than the rate ofdiffusion; i.e., the etchant molecules at the surface react at a rate whichis faster than the rate at which the concentration at the surface can be
2i ll IIim-"

replenished by the diffusion of other etchant molecules. A depleted surfacelayer therefore exists, outside which the etchant concentration is uniform,but inside which the concentration decreases to near zdro at the surface.
Under such conditions, the etching is principally determined not by theproperties of the surface being etched, but by the diffusion. It is clearthat if a surface initially consists of hills and valleys, as shown in Fig-ure 2, the probability of an etchant molecule diffusing to the top of a hillwill be much greater than the probability of its diffusing to the bottom of avalley. The hills will therefore be etched faster than the valleys, and the3urface will become increasingly smooth as the etching progresses.
Figure 2. A Rough Surface at the Beginning of Etching.
Eventually, the surface becomes so smooth that the depleted layer canhave uniform thickness everywhere, e.g., as shown in Figure 3. From thatpoint, the surface is etched evenly everywhere, and the surface smoothness nolonger improves with further etching. Chemically polished surfaces are there-fore not perfectly flat but are microscopically undulating.
Figure 3. Chemically Polished Surface.
3•,

ETCHING EXPERIMENTS
Not cnough information exists at the present time for one to be able topredict the conditions under which a given etchant can chemically polishquartz. At the beginning of this study, an empirical evaluation of a numberof the known etchants for quartz was planned. The evaluation began with ammo-nium bifluoride (VTH4 F*HF), simply because that had been the etchant used inour fabrication process and was therefore the most readily available. As itturned out, we need not have looked any further.
Most of the experiments were performed on AT-cut plano-plano naturalquartz blanks which had been final lapped with 3 pm MICROGRIT aluminum oxideabrasive 7 and then etched under various conditions in increments up toAf - 160 foff, where Af is the change in frequency in kHz, and fo and ff arethe initial and final frequencies, respectively, in MHz. In the past, thedepth of etch has usually been expressed in units of f 2 because the depths ofetch normally used in crystal fabrication have been small enough so that itdid not matter if f meant fo or ff. For the deep etches evaluated in th eexperiments, the proper unit is foff. (Since to and tf f I At h .)To ff -of
For AT-cut quartz, lfoff = 1.66 Um removed from the thickness.
SURFACE EVALUATION
The etched blanks were first inspected with a light microscope to assurethat no gross defects were present. The blanks were then examined with ascanning electron microscope (SEM) and with a Talysurf profile meter. 8
The topography of deeply etcbed AT-cut quartz surfaces consists of hillsand valleys which extend in a direction about 40 from the X axis. Therefore,in both the SEM and profile meter measurements, the topography appears smooth-est when examined along a direction parallel to the hills and valleys, andappears roughest when examined perpendicular to the hills and valleys.Figure 4 shows SEM micrographs of the same surface taken from the two dif-ferent angles. These SEM micrographs, as well as ali the others in thisreport were taken along an observation angle of 600 from the normal in orderto provide good contrast and resolution. The micrograph on the left was takenlooking along the hills and valleys; the micrograph on the right was takenlooking across the hills and valleys. The scale is represented by an ovalbecause of the oblique observation angle used.
Similarly, Figure 5 shows profile meter scans for the same surface alongthe two orthogonal directions. The profile meter is a stylus type instrument,similar to a phonograph. A very fine diamond needle is moved across thesurface. The up and down displacements of the needle are converted to anelectrical signal which is displayed on a chart. Since the depths of thevalleys were generally small compared to the separations of the hills, thevertical scale in this example is magnified 200 times as compared to thehorizontal scale. The surface appears roughest along the Z direction,
7. Micro Abrasives Corp., 720 Southampton Rd., Westfield, MA 01085.
8. Talysurf 4, The Rank Organisation, Rank Taylor Hobson, Leicester, England.
4

'E, Bill -IS..
#ALI
Figure 4. SEM Micrographs of the Same Surface fromTwo Different Observation Angles.
i.e., the direction. where the needle is moving perpendicular to the hills andvalleys, it is, therefore, this direction on which all calculations of sur-face roughness in this report are based.
The Z direction profile meter scans were digitized,9 and from this datathe surface topography was characterized for each sample by two parameters:the surface roughness and the roughness angle. The surface roughness wasderived by calculating the root mean square deviation from an imaginary,smooth "z'-.ro spacially averaged" line which is chosen so that the area ofmountains above this line is equal to the area of valleys under this line.The roughness angle is the average angle which the sides of the hills makewith the plane of the crystal blank.
9. Model 9869A Digitizer with a 9820A Calculator, Hewiett-Packar' Co.,
Palo Alto, CA 94303.
5
." .... , ... , . .

-~ ~~ Ix INU~k~
a TO o D t
Etchin 7 A0ar tu
f f
shw in Fiur5. A"00mls ouerbeke cotan wae ad__flotin
thermistoruseno 1 w5s usfied Mteonro Scheo thempeatue oufthwaterurtnding theTelonbeaker The tepraturegofa threctimonsu.ilurd sltolhtly lare ger than the outer beakerw uad aiemev
tiown fo the beakers. e 10 i -gh ofuthi discontalsosevdto pad athe inner
40mTelnbeaker,1 dowh n toasrththefuid leoelains the innerbaker wasmalways
aboutu3cm belw slth wAteraleve inteouter bekr.iA hole throug 'th
cetrlo thube dicpermitted the agitatio of.0C AhcrysTaflsn duing withadiamete
slincel threr theraln odciiyo the Tue e~~rwsueflo bak oerisow to minimize eaoatetime freqirdmo the bekr.Themperahtur of thes dinne bathere to reach tequiibriu
with the outer bath when the hot plate was first turned on, the inner bath waspreheated in boiling water in a separate container. Even with this method
10. Model No. J40, Fluoroware, Inc., Jonathan Industrial Center, Chaska,
HN 55318.
11. Model No. 4812, Cole Parmer Co., 7425 N. Oak Park Ave., Chicago,IL 60646.
6

I c ~ w r ~ a n i * ~ ;n rrg .a lB a .. . . . ...... s .
r... .....
Figure 6. Etching Apparatus
it took well over an hour after the hot plate was turned on for the inner
bath to stabilize at 850C, for example. In production, it may be preferableto use direct heating of the solution by means of an alumina or Teflon-coatediinersion heater.
7

The crystals were held in a Teflon jig which was designed to assure thatonly point contacts existed between the jig and the crystals. For crystalswith a diameter greater than 16 mi, a comrcially available jig12 was foundto be adequate. For the smaller crystals used throughout most of our experi-ments, a small "home made" Teflon jig was used, which fit on the same Teflonhandle as the coumercial device. The crystals were agitated slowly in bothdirections by means of a constant-speed electric motor, a (now obsolete)Hewlett-Packard Model 297A Sweep Drive. During most of the experiments, themotor was set to rotate the etching jig through an tngle of approximately360* before reversing direction. The rate of agitation was about 5 cyclesper minute.
Etching Procedure
The etching procedure consists of the following steps;
1. A saturated solution of ammonim bifluoride is prepared in a Tefloncontainer. The amonium bifluoride (NH4 F.HF) flakes13 are mixed with dis-tilled water, and the solution is heated to the desired temperature. Theamount of NH4 F.HF used is such that after the solution reaches the equilib-rium tempezature, some undissolved flakes remain in the bottom of the con-tainer throughout the etching process. (The solubility of NH4F.HF in waterincreases from 61 grams per 100 ml of solution at 60*C to 86 grams per 100 mlat 1O09C. 14 ) The solution preparation and the etching are performed under avented hood to prevent inhalation of the vapors from the etching bath.
2. The crystals are cleaned thoroughly. To assure that the surfaces areetched evenly, it is particularly important to remove all contaminants such aswaxes and greases, which may be impervious to the etchant. The crystals usedin these experiments were thoroughly degreased by a process which included theimmersion of the blanks in ethyl alcohol in a Petri dish whose bottom waslined with open-cell urethane foam. Both sides of each blank were sLrubbedwith a foam swab. The crystals were then placed into the slots in the etchingjig and agitated ultrasonically in a detergent solution and rinsed thoroughly.Plasma cleaning in an oxygen plasma15 has been found to be a reliable alterna-tive to scrubbing.
3. From the final rinse the crystals are transferred, while wet, intothe etching bath and are jiggled around to make sure that there are no trappedair bubbles in the etching jig. During etching, the crystals are agitated inboth directions to assure even etching on both sides. The approximate etchingtime can be calculated from the etching rate vs. temperature curve of Figure 7,which will be discussed later. A table such as the one in Appendix A can beused to facilitate the etching to frequency.
12. Model No. A14-01, Fluoroware, Inc., Chaska, MN 55318.
13. Catalog No. A-664, Fisher Scientific Co., Fair Lawn, NJ 07410. (Alsoobtained the same results with Catalog No. 0618, J. T. Baker Chemical Co.,Phillipsburg, NJ 08865.)
14. "Guide to Physical Properties of J. T. Baker Industrial Inorganic Chemi-cals," J. T. Baker Chemical Co., Phillipsburg, NJ 08865.
15. Plasmod model, Tegal Corp., 860 Wharf St., Richmond#CA 94804.
8

15--
1.2~
0.3-
I iz j 0.2- w- :-7
0.2--
* I Ii3(kinzT7
Figue 7 Teueraure epedenc ofEtchng ate

4. After the crystals reach the desired frequency, the etching jig isremoved rapidly from the etch bath and is immersed immediately into a con-tainer of hot water, then given a thorough rinse under running hot water, thenagitated ultrasonically in hot water, then given another rinse in running dis-tilled water, then dried by spin drying. A thorough rinse is important inorder to remove all residues of the etchant.
5. The crystals are then inspected under a microscope for uniformity ofetch and for defects such as scratch marks, etch pits, and etch channels.
Non-uniform appearance of the etched surfaces can have the followingcauses: (a) contamination on the crystals prior to etching, (b) contaminationin the etch bath which adsorbs onto the crystals, (c) air bubbles on the crys-tals which remain after the crystals are immersed in the etch bath, (d) con-tact between the crystals and the etching jig due to poor jig design orinadequate agitation, (e) poor quality quartz in which a large number of etchpits and etch channels are produced by the etching, and (f) inadequate rinsingat the completion of etching.
Silicon dioxide surfaces on oxidized silicon slices have been shown toretain fluorides even after a 2-minute rinse in 95 0C water. 1 6 The authors ofthis report ascribe the "tenacious behavior of the fluoride ion . . . to thestrength of the silicon-fluoride bond (136 kcal/mol compared to 106 kcal/molfor Si-O) on the . . . SiO2 surface." However, a careful analysis by AugerElectron Spectroscopy of several of our etched quartz blanks which had beenrinsed thoroughly with distilled water failed to reveal any traces of fluorineon the surfaces. (To minimize the possibility of electron beam-induceddesorption of the fluorine, the samples were translated across the primarybeam continuously while repeatedly scanning a narrow range of energies aboutthe fluorine peak.)
Inspection Procedure
The inspection of etched blanks is performed under a microscope at about40 X magnification using a black background with the light incidence perpen-dicular to the axis of the microscope. First, the crystal is inspected forsurface irregularities such as scratch marks, pits, and twinned areas by tilt-ing the crystal so as to reflect light into the microscope. The crystal isthen inspected for etch channels by holding it so that the light incidence is
in the plane of the crystal (i.e., edge illumination). The etch channels aremost visible when the edge illumination is incident along a direction perpen-dicular to the direction of the channels. For example, in most culturedquartz, the etch channels tend to be along directions near the Z direction.These channels are most easily visible, therefore, with a light incident fromthe X direction. To help make the etch channels more visible without rotatingthe crystals, it is helpful to use for the edge illumination two lights inci-dent at a right angle to each other, or a ring light. The etch channelsappear as small, bright streaks which extend through the blank from one sideto the other. The thicker the blank, the longer the streaks; and the deeperthe blank has been ecched, the brighter the streaks.
16. Larrabee, G. B., Heinen, K. G., and Harrel, S. A., "Measurement of theRetention of Fluoride by Silicon and Silicon Dioxide Surfaces," J.Electrochem. Soc., Vol. 114, pp. 867-869, August 1967.
- 10 U10

"Etching Variables
The etching variables investigated in this study were: the depth of
etch, the surface finish prior to etching, the etching temperature, agitationduring etching, etching bath depletion, and the quality of quartz used.
a. Depth of etch: Figure 8 shows an SEM micrograph of the 3 um aluminalapped surface prior to etching. The surface is filled with pits, crevicei,and loose and nearly loose particles. After etching to Af - 1.5foff, theloose and nearly loose particles have been etched away, as shown in Figure 9;however, numerous pits remain visible. A surface etched to Af - 2 .lfoff, inFigure 10, shows fewer pits. The pits have become broader and shallower.
Figure 11 show'i the topography corresponding rt a depth of etch ofAf - 3.6 foff. Evidence of the surface damage produced by lapping has nearlydisappeared. The hills and valleys, which tend to extend along about the Xdirection, have become more apparent. The surface roughness at this point is0.19 Um, and the roughness angle is 4.00.
As the etching progresses, the hills move further apart, and the valleysbecome shallower. Figures 12 and 13 show the topographies corresponding todepths of etch of Af - 8.9foff and Af - 31.5feff. The surface roughnessesand roughness angles are 0.13 Um and 2.80, and 0.09 Pm and O.7, respectively.
Upon further etching, the topography changes less and less with increas-ing depth of etch. The surface roughnesses and roughness angles approach theequilibrium values of 0.075 um and 0.25", respectively. Beyond a depth ofetch of Af = 8 0foff, the topography no longer changes with increasing depthof etch. Figure 14 shows an SEM micrograph for a surface etched toAf u 85foff.
The effect of the hills and valleys on the sueface areas of thesechemically polished blanks is small. For example, at a depth of etch ofAf - 25foff, the ratio of surface areas between chemically polished blanksan.d "perfectly" polished blanks is less rhan 0.01%.
b. Surface finish prior to etching: Four groups of crystal blanks,each with a different surface finish prior to etching, were etched at 85*C.The surface roughness and roughness angle vs. depth of etch was determinedfor each group. The four groups were prepared as follows: one group was cutwith a diamond saw blade (80 grit) and was not lapped at all; the secondgroup was final lapped with 12 jim MICROGRIT aluminum oxide abrasive; thethird group was final lapped with 3 pm MICROGRIT; and the fourth group waslapped with 3 Um MICROGRIT, etched, then polished with cerium oxide.
The surface roughnesses and roughness angles of the blanks with thediamond saw blade surface finish continued to decrease, with little sign ofleveling off, all the way to a depth of etch of Af - 300 foff, the maximumdepth to which this group was etched. The surface roughnesses and roughnessangles decreased nearly linearly from 3.0 Pm and 3.6, respectively, atAf ll0foff, to 1.2 um and 0.9* at Af.- 300foff. As the etching progressed,the blanks becamse more and more transparent.
11I •
H.

*7!"':
Figure--no "."eNhO3WI ape urae
ft IA12

A; f
R-fI Ot 20 Orn
Figure 9. Surface Etched to Af =1.5f ff.
;.al
2.11 . 20 till
Ut_-
Figure 10. Surface Etched to Af =2. if ff
13
Figur 112ufc0thd oA .ff~
Figure 12. Surface Etched to Af -8.9foff*
14

This Document Contains Page/s
Reproduced From
Best Available Copy
Fiue1-Sraeschdt f 3.ff~
Figure 14. Surface Etched to iAf 3185f0 ff
15
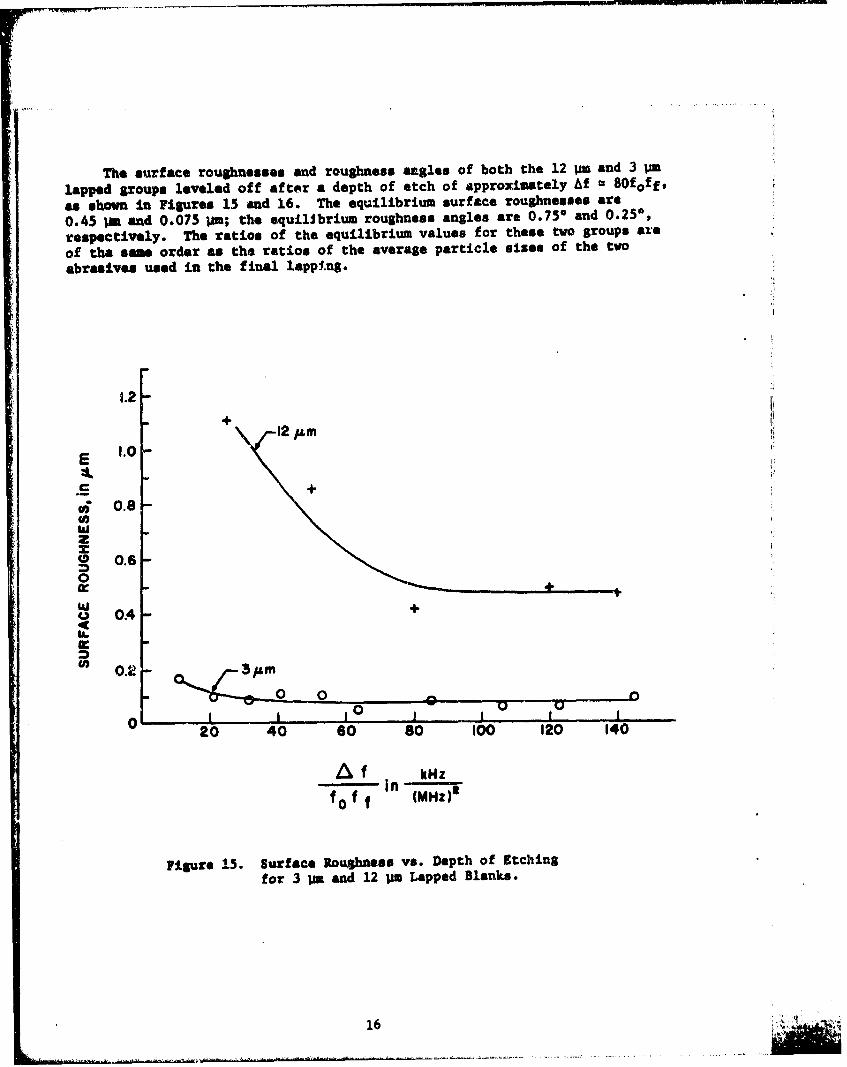
The surface roughnesses and roughness ar.gles of both the 12 Wn and 3 Um
lapped groups leveled off after a depth of etch of approximately Af = 80£off,
as shown in Figures 15 and 16. The equilibrium surface roughnesses are
0.45 u and 0.075 w; the equilibrium roughness angles are 0.750 and 0.25*,
respectively. The ratios of the equilibrium values for these two groups are
of the sea order as the ratios of the average particle sizes of the two
abrasives used in the final lapping.
1.2!
+
1.0 -
C 4
• 0.8
0.6.0
It "0 .+
U) 0.2 3/,,m. •- 0 0 ,u
0 20 40 60 80 100 120 140
A fI kHz
fo f f (MHz)*
Figure 15. Surface Roughness vs. Depth of Etchingfor 3 Um and 12 Us Lapped Blanks.
16

3.0
2.5
a~• 12 rn
m 2.0-
U;
co 1.5-
"44C
0,,
'I)MLWM 1.0-CD
0.5-
i0 p i p p
20 40 60 80 100 120 140
/Mf kHzin ----f 0 f f (NOZ),
Figure 16. Roughness Angle vs. Depth of Itcbing for3 p.a and 12 Um Lapped Blanks.
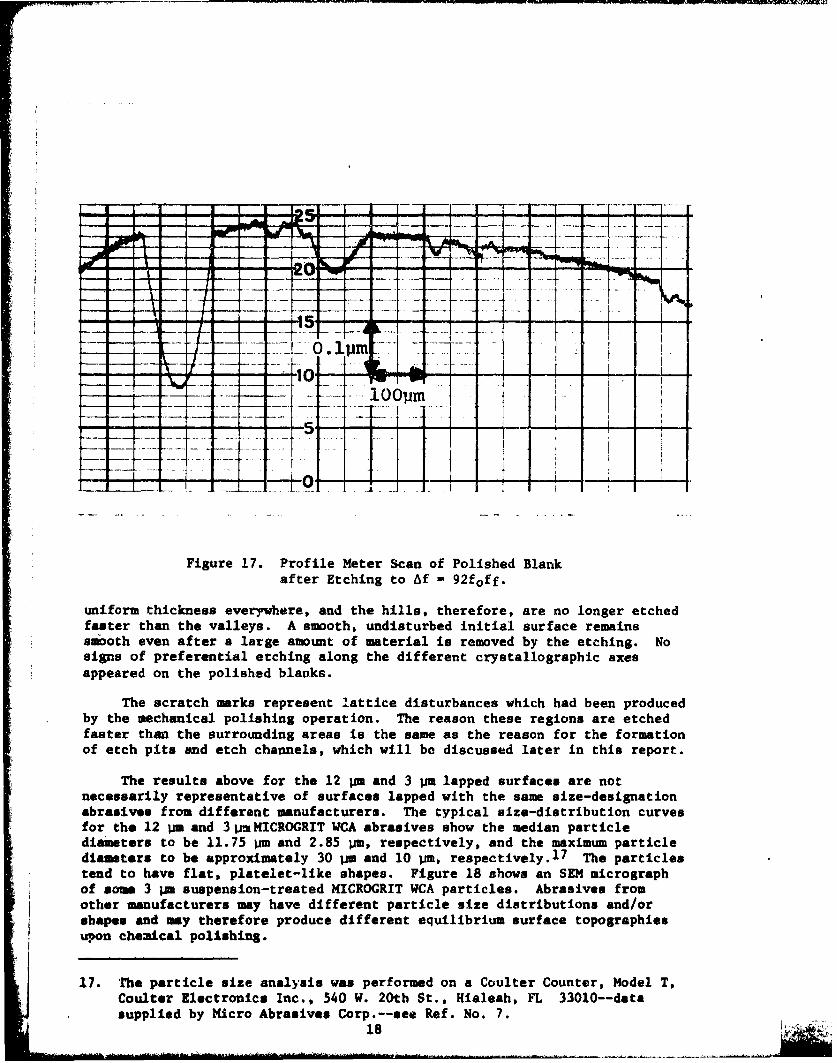
The regular array of hills and valleys which developed on the lappedblanks did not develop on the group of polished blanks. The equilibriumtopographies on these blanks consisted of smooth areas and scratch marks only.Figure 17 shows the profile meter scan for a polished blank after it wasetched to Af - 92foff. It shows a 0.28 ini deep scratch mark, plus somesmaller ones. However, between the scratch marks, the surface is smooth, towithin the resolution of the profile meter which is 0.01 Vi.
These results are consistent with the contention that the ettchig isdiffusion controlled. The rougher the initial surface, the rougher the finalequilibrium surface, where the depleted surface layer of etching solution has
S17
-i i --- 10p
ILI
1 4
Figure 17. Profile Meter Scan of Polished Blankafter Etching to Af - 92faff.
uniform thickness everywhere, and the hills, therefore, are no longer etchedfaster than the valleys. A smooth, undisturbed initial surface remainssmooth even after a large amount of material is removed by the etching. Nosigns of preferential etching along the different crystallographic axesappeared on the polished blanks.
The scratch marks represent lattice disturbances which had been producedby the mechanical polishing operation. The reason these regions are etchedfaster than the surrounding areas is the same as the reason for the formationof etch pits and etch channels, which will be discussed later in this report.
The results above for the 12 jm and 3 Um lapped surfaces are notnecessarily representative of surfaces lapped with the same size-designationabrasives from different manufacturers. The typical size-distribution curvesfor the 12 Um and 31j MICROGRIT WCA abrasives show the median particlediaieters to be 11.75 Wnn and 2.85 Um, respectively, and the maximum particlediameters to be approximately 30 Um and 10 rnm, respectively. 1 7 The particlestend to have flat, platelet-like shapes. Figure 18 shows an SEM micrographof some 3 Um suspension-treated HICROGRIT WCA particles. Abrasives fromother manufacturers may have different particle size distributions and/ors hapes and may therefore produce different equilibrium surface topographiesupon chemical polishing.
17. The particle size analysis was performed on a Coulter Counter, Model T,Coulter Electronics Inc., 540 W. 20th St., Hialeah, FL 33010--datasupplied by Micro Abrasives Corp.--see Ref. No. 7.
18

Figure 18. 3 lim MICROGRIT Abrasive.
The above results imply that the less deeply arid the more uniformly dia-
turbed the surface is prior to etching, the smoother will be the chemicallypolished surface. Accordingly, one should lap with as fine an abrasive aspossible prior to etching. Since the finer the abrasive, the slower the lap-"ping, it may be preferable to perform the chemical polishing in two steps inorder to attain the optimum surface finish. First, lap the crystals with arelatively coarse abrasive, e.g., 3 pm; then etch to Af = 1 0 foff to remove the
damaged layer and chemically polish the surface. At this point the (r.m.s.)
surface roughness is 0.11 pjj, and the profile meter scans show that thelargest hills on the surface (if the surface is free of etch nhannels) extendless than 0.5 pm above the valleys. To •roduce a semi-polished surface, it is
therefore sufficient to remove Af - 0.3f with a fine abrasive. From such a
semi-polished surface, a small amount of etching should produce a very smooth
chemically polished surface.
19

In cur experience, etching surfaces which had been fully polished withcerium oxide prior to etching have generally produced scratch marks. Althoughthe above suggestion for using a semi-polished surface for zhemical polishinghas not yet been proven experimentally, the semi-polished surface may bepreferable to a fully polished one, because rather than aiming for a perfectlyscratch-free surface, lapping with a fine abrasive produces a uniformly"scratched" surface similar to the ones produced by the 12 U and 3 Uamabrasives, except on a smaller scale.
c. Temperature: The temperature at which the etching is performed doesnot have a significant effect on the final surface roughness in the tempera-ture range studied, 45 0 C to 90 0 C. The temperature does, however, have asignificant effect on the rate of etching. Figure 7 shows a semi-log plot ofthe temperature dependence of etch rate in saturated ammonium bifluoride.(Note the temperature scale in °C at the top of the graph.) The rateincreases from Af - 0.063foff per minute at 450C to Af - 1.lfoff per minuteat 900C. It is lfoff per minute at 88°C, which implies that from a 3 Umsurface, a chemically polished surface can be produced at thjs temperature inless than 15 minutes. The etch rate curve in Figure 7 fits the equation
ER(T) - Ae kT (1)
where R(T) is the etch rate in units of kHz per (MHz) 2 per minute,
A - 5.083 x 10' x Af/(foff min), (2)
E - 14.4 kcal/mol (=0.62eV), (3)
k is Boltzmann's constant, and T is the temperature in OK. All etch rates arethe rates for chemically polished surfaces. (The initial etch rates on roughsurfaces are always higher.)
The 14.4 kcal/mol activation energy is higher than the activationenergies characteristic of diffusion controlled processes, 6 which are 4 to6 kcal/mol. The simple expression above, however, does not take into accounttwo effects. First, the etching solution is saturated at all temperatures,which means that the concentration increases with increasing temperature.Secondly, the etching reaction liberates heat wh'.ch makes the temperatures atwhich the reaction takes place higher than the bulk solution temperature.
Both of these effects tend to change the apparent activation energy to a valuewhich is higher than the "true" activation energy of the etching.
d. Agitation: The agitation rate has only a minor effect on the etchrate. For example, the etch rate with an agitation rate of 50 cycles perminute was compared with the etch rate with no agitation, at 85*C. A group,of crystals was etched in 15-minute increments, alternating between agitationand no agitation. The etch rates were found to be ll higher during theagitation periods.
Such a change in etch rate at 85*C could be accounted for by a change inetchant temperature of only 2*C, which is close to the uncertainty in ourtemperature control. This uncertainty in temperature control could thereforepossibly account for at least part of the observed increase in etch rate.
20

While agitation does not appear to have a significant effect on the etchrate, proper agitation, preferably in both directions, is important to assurethat the crystals are etched uniformly on both sides. Agitation also servesto minimize temperature gradients in the etch bath, which in turn minimizesche blank-to-blank etch rate variations.
e. Etch bath depletion: To obtain an indication of the effects of asevere depletion of the etch bath, a handful (approximately 40 grams) ofcrystal blanks were dissolved completely in approximately 200 al of etchingsolution. This is equivalent to the depletion that would be produced in aone-liter etch bath by etching 100,000 blanks of 6.4 mm diameter toAf - l4foff. The "depleted'" etch bath contained enough NH4 F.HF flakes toassure that some undissolved flakes remained on the bottom of the bath afterall the crystal blanks had dissolved.
A group of blanks was then etched in this bath from 14.8 MHz to 20.0 MHz(Af/(foff) - 17.6) at 53°C. SEM photos of the etched surfaces revealed nodifference between these surfaces and surfaces etched the same amount in afresh etching bath. The etching rate in the depleted etch bath, however, waslower by a factor of seven.
No attempt was made to chemically analyze the depleted etch bath.Judge1 8 has, however, examined by Raman spectroscopy a solution of NH4 F andHF ("7:1 buffered HF") before and after dissolving SiO2 in it. The "before"solution showed no detectable absorptions. In the spectrum of the solutionwith Si02 dissolved in it, "a very large number of peaks are observed, indi-cating the presence of multiple product species." The lower etch rate in the"depleted" etch bath is probably due to the presence of a high concentrationof these species.
f. Quality of quartz--natural vs. cultured: At the completion of chemi-cal polishing, the blanks are inspected for etch pits and etch channels usingthe technique described earlier. At the two points where an etch channelintersects the blank surfaces, etch pits have always been found; however,the etch pits are not always associated with etch channels. Although theeffects of etch pits and etch channels on resonator performance have not yetbeen determined, we are currently rejecting all blanks with etch channels.There are primarily two reasons for this. First, the etch channels are prob-ably filled with ammonium bifluoride at the completion of etching. Rinsingthe blanks will almost certainly fail to remove all of the flubrides from thechannels. The presence of fluorides in the etch channels, therefore, islikely to adversely affect the resonator's stability. Since the etch ratethrough the etch channels can be about 100 times as high as through the restof the blank, even lightly etched blanks may contain channels which extend atleast part way into the blanks.
18. Judge, J. S., "A Study of the Dissolution of SiOi in Acidic FluorideSolutions," J. Electrochem. Soc., Vol. 118, pp. ~772-1775, November 1971.
21-~~~ -, -i, -

The second reason Lu that the inspection for etch channels can be per-formed early in the resonator fabrication sequence. For example, in the fab-rication of circular resonators, a deep etch and inspection for channels can
follow the rounding operation, at which point the cost of a blank is still
relatively small. The deep etch at that point can also serve to prepare the
blanks for fine lapping by removing material from the blanks rapidly, con-veniently, without angle change, and without producing any surface damage
(in fact, the deep etch removes the surface damage left by the previous
abrasive).
Since the institution of the deep etch followed by inspection as part ofour resonator fabrication process, we have inspected well over one thousandnatural quartz blanks, in several lots. The blanks were 6.4 =-diameter andwere intended for being made into 20 MHz fundamental resonators. The inci-dence of etch channels in these 6.4 mm diameter blanks was between 30% and40%; i.e., in each lot, 60% to 70% of the blanks were free of etch channels.In larger diameter blanks, of course, the incidence of etch channels is higher.
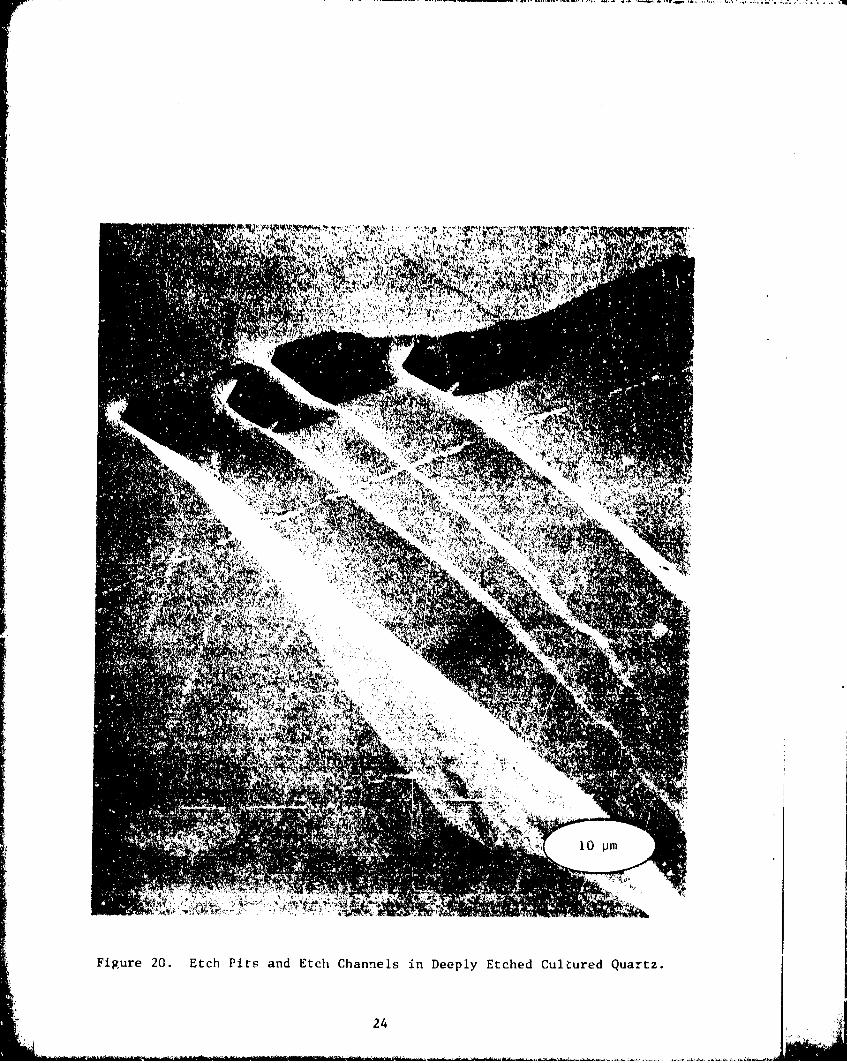
When the chemical polishing was attempted on a group of cultured quartzblanks, the resulting surfaces appeared to the unaided eye to be unevenlyetched. A closer examination of the surfaces revealed that the poor chemicalpolish was due to a very large number of etch pits on the surfaces, most ofwhich were the terminations of etch channels. Figures 19, 20, and 21 showSEM micrographs at different magnifications of one such surface showing theetch pits and etch channels. None of the blanks in this group were free ofetch channels.
To investigate how the different varieties of cultured quartz comparewith natural quartz with respect to the incidence of etch channels, sixteenvarieties of cultured quartz from ten different growers were deeply etched andinspected for etch channels. Three of the varieties were swept quartz.
The sixteen varieties could be divided into three categories. Onevariety, a swept quartz, was free of etch channels. Five varieties had only afew etch channels per blank--on the order of 10 channels per cm2 of blanksurface. The two remaining swept varieties were in this second category.Figure 22 shows a light micrograph of how such a blank appears during inspec-tion with edge illumination. The remaining ten varieties contained a largenumber of etch channels per cm2 . Inspection of blanks from the worst varietiesin this group is comparable to observing the Milky Way at night, as shown inFigure 23.
The one variety which was free of etch channels was vacuum swept at SandiaLaboratories by a process similar to that described by King. 1 9 Some of theeffects of sweeping in vacuum, as cpposed to sweeping in other atmospheres,has also been discussed by Krefft, 2 0
19. King, J. C., "Vacuum Electrolysis of Quartz," US Patent No. 3,932,777,Jan. 13, 1976.
20. Krefft, G. B., "Effects of High Temperature Electrolysis on the ColorationCharacteristics and OH-Absorption Bands in Alpha-Quartz," RadiationEffects, Vol. 26, pp. 249-259 (1975).
22

Th's Document C ontains page/,Reproduced From
Best Available Copy
Figurc 19. A Cultured Quartz Blank after Etching
23
44 'T 'T N
24

This Document Contains Page/s
Reproduced From
Best Available Copy
Figure 21. Etch Channels at the Bottom of Etch Pits.
Vi gure 22. Etch Channe]ls Observed under a Micr-oscope
with Edge [1llumninat ion.425

J.mm
Figure 23. Etch Channels in a Blank Made ofPoor Quality Cultured Quartz.
and by King and Sander, 2 1 who showed that resonators made from vacuum-sweptcultured quartz exhibited much lower frequency offsets after burst irradiationthan resonators made from natural quartz or air-swept cultured quartz.
We were able to obtain a few blanks from both the vacuum-swept andunswept portions of the same bar of cultured quartz. Whereas the blanks fromthe swept portion were completely free of etch channels (three blanks wereetched, each 15 mm in diameter), the blanks from the unswept portion containednumerous etch channels. Figure 24 shows a side-by-side comparison of the
21. King, J. C., and Sander, H. H., "Transient Change in Q and Frequency ofAT-cut Quartz Resonators Following Exposure to Pulse X-rays," IEEE Trans.on Nuclear Science, Vol. NS-20, pp. 117-125 (1973).
26

This Document Contains Page/s
Reproduced From
Best Available Copy
swept and unswept blanks as they appeared under the microscope with edgeillumination. Even after the swept blanks were etched further, until a totalof 300 pm was removed in an 85 0 C etch bath, not a single etch channel wasobservable. There were, however, several etch pits visible on each of thesurfaces. The number of etch pits on the vacuum-swept blanks appeared to befewer than on the unswept blanks, although the sample sizes were not largeenough to allow us to draw a definite conclusion about this, especially sincethere were areas on both types of blanks which were free of etch pits.
Figure 24. Vacuum Swept vs. Unswept Blanks fromthe Same Bar of Cultured Quartz.
27 [

Etch channels in quartz have been observed previously.22 29* They areprobably a consequence of dislocations at which impurities had segregated. 6 ,22Impurities dissolved in the quartz, particularly those which do not fit intothe lattice, segregate at dislocations. There is a strain energy associatedwith the presence of these impurities which results in the dislocationsbeing etched more readily than the rest of the surface; i.e., the activationenergy for etching in reduced by the strain energy. The dislocation may alsoact as a point of nucleation of attack. In such a case, when there is also aconsiderable heat of reaction, the heat generated can enhance both the dif-fusion and the rate of reaction in the vicinity of the dislocation, which canresult in an etch channel and/or etch pit being formed. Figure 25 shows anSEM micrograph of etch pits on the surface of a deeply etched (Af = 85foff)
I. natural quartz blank. In natural quartz, some of the etch channels may be
due to fission tracks. 3 0*.
Sweeping is known to be able to remove interstitial impurities fromquartz. The low incidence of etch channels in the three swept quartz varie-ties is probably due to the relief of the strain energy associated with theseimpurities. The difference in the incidence of etch channels between thevacuum-swept quartz and the other two swept varieties (which were swept inair) may possibly be accounted for by the fact that when sweeping takes placein air, as the impurities in the crystal diffuse toward the cathode, impuri-ties from the air can diffuse into the crystal from the anode side.
The presence of etch channels also seems to be associated with anapparent increase in the etch rate of quartz. A group of natural quartz anda group of one of the better quality cultured quartz blanks were etched andinspected for channels. From the group of natural quartz blanks, the oneswith etch channels were eliminated. The cultured quartz blanks were 7.6 mmdiameter and contained about ten channels per blank. The two groups of blankswere etched simultaneously side by side, in the same etch bath, at 850C. Therate of etching was measured, as usual, by measuring Af per minute.
fO ffIt was found that the etch rate for the cultured quartz group was 1.6% higher.When the experiment was repeated with a group of natural quartz blanks with-out any etch channels and a group of poor quality ("Milky Way-like") quartz,the etch rate of the "Milky Way" quartz was found to be 4.9% higher. Whentwo groups of natural quartz blanks were etched side by side, although thegroups had been obtained from different suppliers and had different initialsurface finishes (12 pm vs. 3 .m), different frequencies (6.5 MHz vs. 5 MHz),and different geometries (circular vs. square), the average etch rates for the-two groups differed by less than 0.2% (although blank-to-blank etch ratevariations larger than 0.2% were observed in each of the two groups). Alletch rates were measured after the blanks had been chemically polished.
30. Macdougall, J. D., "Fission--Track Dating," Scientific American,Vol. 235, pp. 114-122, December 1976.
*See'list of references on p. 35.
28

This Document Contains Page/s
Reproduced From
Best Available Copy
-~g V
Figure 25. Etch Pit in a Deeply Etched Natural Quartz Blank.
THE STRENGTHS OF CHEMICALLY POLISHED BLANKS
The theoretical inherent strengths of elastic materials are generallyorders of magnitude greater than the measured strengths of the ordinary formsof these materials. This reduction in strength is known to be caused princi-pally by surface flaws, such as scratches, which concentrate the appliedstress and thereby lead to fracture at loads which are much lower than thetheoretical maximum. Removal of all flaws from the surface permit thestrengths of materials to approach the theoretical maximum. For example,3 1
the theoretical strength of fused quartz (and of other glasses) is about1.8 x 1010 Pa. The actual strengths measured are in the range of 107 to
18Pa. However, by heating glasses to above their softening point (i.e.,fire polishing) the surface flaws can be eliminated. The strength of fire
31. Doremus, R. H-., "Glass Science," New York: John Wiley & Sons. Inc.,Chapters 15 and 17 (1973).
29
polished fused quartz has been measured to be as high as 1.5 x 10¹⁰ Pa,ne6rly as high as the theoretical maximum.
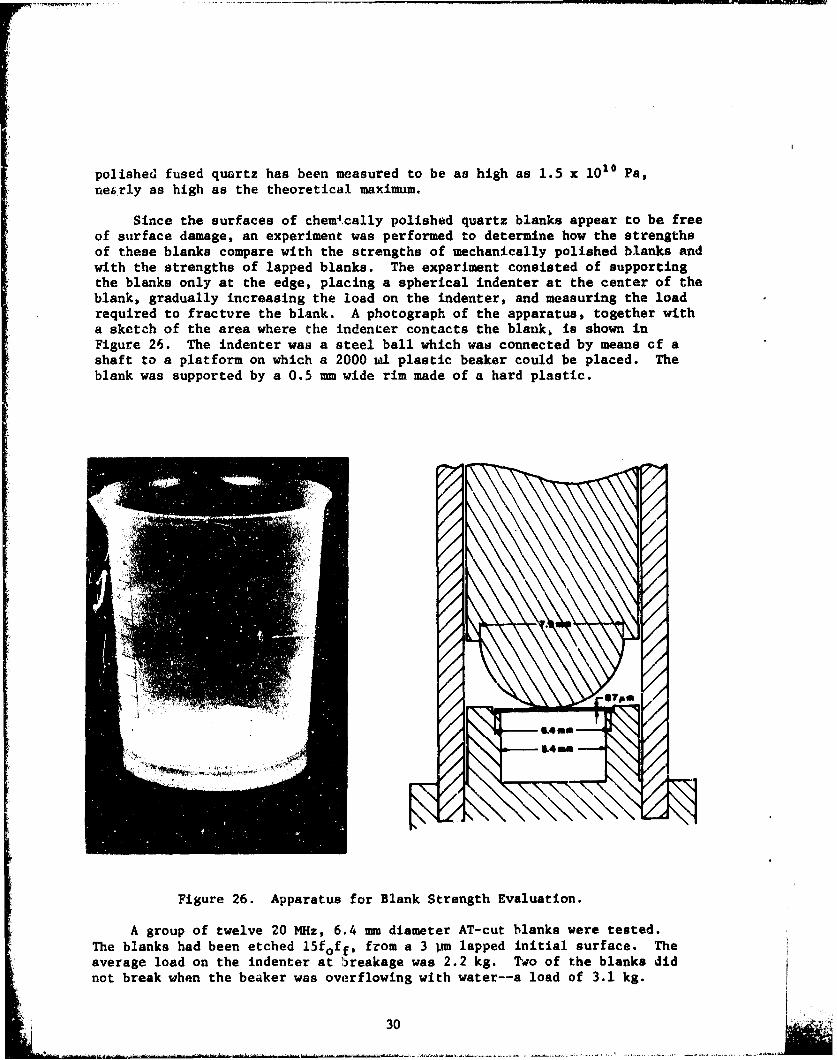
Since the surfaces of chemi.cally polished quartz blanks appear to be freeof surface damage, an experiment was performed to determine how the strengthsof these blanks compare with the strengths of mechanically polished blanks andwith the strengths of lapped blanks. The experiment consisted of supportingthe blanks only at the edge, placing a spherical indenter at the center of theblank, gradually increasing the load on the indenter, and measuring the loadrequired to fracture the blank. A photograph of the apparatus, together witha sketch of the area where the indenter contacts the blank, is shown inFigure 26. The indenter was a steel ball which was connected by means cf ashaft to a platform on which a 2000 ml plastic beaker could be placed. Theblank was supported by a 0.5 mm wide rim made of a hard plastic.
Figure 26. Apparatus for Blank Strength Evaluation.
A group of twelve 20 MHz, 6.4 mmn diameter AT-cut blanks were tested.The blanks had been etched l5fofft from a 3 Wi lapped initial surface. Theaverage load on the indenter at breakage was 2.2 kg. Twio of the blanks didnot break when the beaker was overflowing with water--a load of 3.1 kg.
30 'Y .

(These numbers should be considered to be only a semi-quantitative indicationof the inherent strength of these blanks because, for example, each time ablank fractured, the rim on which the blanks were supported was damaged. Theload on the next blank, therefore, may not have been as uniformly distributaed
It was not possible with this apparatus to measure the strengths of* blanks of the same dimensions which had been mechanically polished or lapped
with 3 pm abrasive, because all such blanks broke under the weight of theplatform alone (i.e., without the beaker)--a weight of 157 grams.
To place the strength of the chemically polished blanks in perspective,consider the fact that the weight of a 20 MHz blank of 6.4 mm diameter isonly 7.0 mg; i.e., the ratio between the average load on the indenter atbreakage and weight of the blank is about 300,000. This also means that theshock level at which the load on the blank due to its own weight is equal tothe average load on the indenter at breakage is 300,000g.
To obtain a rough approximation of the shock levels the 20 MHz funda-mental chemically polished blanks can survive when supported by four pointmounts, the rim on which the blanks were supported was reduced to four smallareas 900 apart. The dimensions of each area were 0.5 mm in the radialdirection and 0.4 mm in the tangential direction. The average load on theindenter at breakage was thus reduced to 550 grams, which correspondsi to aload due to a shock of about 80,000g.
An additional indication of the high resistance to fracture in thesechemically polished blanks is that when some 14 mm diameter blanks were etchedfrom 15 MHz to above 120 MHz, the blanks flexed like very thin sheets of mica.For example, holding such a blank at diametrically opposite points betweentwo fingers, the blank could be bent about 900 before it broke.
THE Q OF CHEMICALLY POLISHED RESONATORS
The Q of a resonator can be defined by
Q - 2w Energy StoredEnergy Dissipated per Cycle
The energy dissipated per cycle is the sum of the energies dissipated by thevarious loss mechanisms. For a chemically polished resonator, the losses maybe due to: the mounting, the bonding, the electrodes, contamination, theatmosphere surrounding the resonator, the intrinsic losses in the quartz,plus the losses due to the features produced by chemical polishing, i.e., theregular array of hills and valleys, the etch channels, and the etch pits.Q-1 can therefore be expressed as the sum of the Q-l's due to the various lossmechanisms, i.e.,
I 1 + 1. +Q Qmounting Qbonding Qetch pits
If the regular array of hills and valleys due to chemical polishingproduces an inherent Q degradation, then in a group of resonators made fromblanks which received the same chemical polishing, the resonator with thehighest Q represents a lower limit on the Q achievable with that chemicalpolish (at the given frequency).
31

Since these investigations on chemical polishing began, we have fabri-cated approximately 300 resonators using chemically polished blanks. All ofthe resonators were fundamental mode, in the 18 MHz to 22 MHz range. Theblanks were plano-piano, 6.4 mm diameter natural quartz. Most of the resona-tors were of the high shock, nickel electrobonded type described previously. 3 2
The depths of etch ranged from Af - 2foff to Af - 22foff. The surfaces hadbeen lapped with 3 tim MICROGRIT prior to etching. For the highest Q resona-tors in each group, the motional capacitances ranged from 12 fF to 13.5 fF;the resistances ranged from 3 f to 5 f2; and the Q's thus ranged from 140,000to 210,000, with no apparent Q degradation with depth of etch.
The highest Q resonators made from polished blanks of the same blankgeometry, but of a low shock nickel electrobonded design, 3 3 had Q's whichwere no higher (Q = 180,000) than the highest Q resouators made from chemi-cally polished blanks. In fact, the highest Q resonator of that blankgeometry we have made to date (Q = 210,000) was a 19 MHz high shock resonator,with a depth of etch of Af - l6foff.
In an attempt to investigate the effect of an extreme amount of etching,a group of crystal blanks were etched from 10.5 MHz to 22.4 MHz, which cor-responds to a Af - 50foff. Prior to etching, these blanks had been in processto be made into 20 MHz resonators. Normally, the blanks would have beenlapped to at least 15 MHz with 3 pm MICROGRIT before being etched to the finalfrequency. Although the 10.5 MHz blanks were lapped with the 3 pm abrasive,the amount of material removed with this abrasive was much less than usual,and the surface finish prior to etching may not have been a true 3 pm finish.
The highest Q resonator in this group (of eleven resonators) had a Q of110,000 (C1 - 13.4 fF, K - 5 1). Most of the resonators in this group hadanomalously low Cl's, the cause of which has not yet been determined. Thisexperiment did shoi, however, that if the extremely deep etching produces aQ degradation, this degradation is not a drastic one--at least not for funda-mental mode resonators in the 20 MHz range. The Q's of the above resonatorswere not evaluated on overtone operation because the electrodes were gold,with about a 1.0 f2 plateback, which is known to be too heavy for overtoneoperation.
3 4
32. Filler, R. L. and Vig, J. R., "The Effect of Bonding on the Frequency vs.Temperature Characteristics of AT-cut Resonators," Proc. of the 30thAnnual Symposium on Frequency Control, US Army Electronics Command,Ft. Monmouth, NJ, pp. 264-268 (1976). Copies available from ElectronicsIndustries Assoc., 2001 Eye Street, NW, Washington, DC 20006; alsoavailable as AD A030316.
33. Vig, J. R., LeBus, J. W., and Filler, R. L., "Further Results on UVCleaning and Ni Electrobonding," Proc. of the 29th Annual Symposium onFrequency Control, US Army Electronics Coumand, Ft. Monmouth, NJ,pp. 220-229 (1915). Copies available from EIA, as in Ref. 32.
34. Bennett, R. E., editor, "Quartz Resonator Handbook." Union Thermoelec-
tric Div., 1960, pp. 113-115. Copies available from NTIS, AD 251289.
32

As the frequency increases so that the~wavelength of the acoustic waveapproaches the dimensions of the etch features, it would not be surprising tofind a Q degradation. However, in any systematic study of the inherent Q
degradation due to the array of hills and valleys which develop during chemi-cal polishing, great care would have to be taken to use only those blankswhich are free of both etch channels and etch pits, since the dimensions ofthese features are usually at least an order of magnitude larger than thedimensions of the hills and valleys. In the above resonators, the blanksselected were free of etch channels but not necessarily of etch pits.
CONCLUSIONS
Etching in a saturated solution of ammonium bifluoride has been shown tobe capable of chemically polishing AT-cut quartz over a broad range of condi-tions. The quality of surface finish which can be produced by this methoddepends primarily on the surface finish prior to etching, the depth of etch,and the quality of quartz used. The speed at which chemically polished sut-faces can be produced depends primarily on the temperature of the ntch bath.In an 880 C etch bath, for example, starting with 3 Um lapped blanks, chemi-cally polished surfaces can be produced in less than 15 minutes. Depletion ofthe etch bath slows down the etching rate but does not affect the surfaceroughness.
The process can remove large amounts of material from lapped blanks whilesimultaneously producing an improved surface finish, without producing shiftsin the angles of cut. The process can also produce blanks of great strength,which is particularly important for high shock applications.
Since depth of etch is not critical, the chemical polishing may allowmanufacturers to stock lapped blanks at only a few frequencies at each com-monly used angle of cut, then etch the blanks to the required frequencies anthe need arises. The method may also permit the manufacturi-g of miniaturecontoured high frequency resonators, since such small diameter resonators cannow be contoured at conventional frequencies, then etched up to high frequen-cies. If a masking material which is resistant to the etch solution can befound, the method may also permit the fabrication of high frequency resonatorsand filters with the inverted mesa structure.
Inspection of deeply etched blanks for etch channels is a simple screen-ing technique which can reveal large differences among blanks made from dif-ferent varieties of quartz. The incidence of etch channels has not yet beencorrelated with resonator performance parameters such as stability, Q, radia-tion hardness, etc. From ind'rect evidence, however, it seems probable that,everything else being equal, resonators made from blanks which are free ofetch channels will perform better than those which show etch channels upondeep etching.
ACKNOWLEDGMENTS
The authors gratefully acknowledge the skillful contributions of:D. Eckart, C. F. Cook, and A. Dunlap who provided the SEM and light micro-graphs, J. Falcone who provided the profile meter scans, D. Fox who performedthe Auger Electron Spectroscopy, and H. Spaights who prepared some of thelapped blanks used in these experiments. We would also like to thank our
33 ..
friends in the crystal industry who provided us with the samples of differentvarieties of cultured quartz. We are particularly grateful to Tom Young ofSandia Laboratories for supplying the vacuum-swept and unswept blanks fromthe same bar of cultured quart•.
REFERENCES
1. Rabinowitz, E., "Polishing," Scientific American, Vol 218, pp. 91-99,June 1968.
2. Holland, L., "The Properties of Glass Surfaces," London: Chapman andHall, Chapter 1 (1964).
3. Newkirk, J. B., Young, J. D., and Spencer, J. P., "Defect Structures onPolished Quartz Surfaces as Seen by X-ray Diffraction Microscopy," J.Appl. Phys. Vol. 35, pp. 1362-1363 (1964).
4. Frondel, C., "The System of Mineralogy ... ," Vol. III, Silica Minerals,New York and London: John Wiley and Sons, Inc., po. 162-163 (1962).
5. Ernsberger, F. M., "Structural Effects in the Chemical Reactivity ofSilica and Silicates," J. Phys. Chem. Solids, Vol. 13, pp. 347-351 (1960).
6. Holmes, P. J., "The Electrochemistry of Semiconductors," London and NewYork: Academic Press, Chapters 6 and 8 (1962).
7. Micro Abrasives Corp., 720 Southampton Rd., Westfield, MA 01085.
8. Talysurf 4, The Rank Organisation, Rank Taylor Hobson, Leicester,England.
9. Model 9869A Digitizer with a 9810A Calculator, Hewlett-Packard Co.,Palo Alto, CA 94303.
10. Model No. J40, Fluoroware, Inc., Jonathar. Industrial Center, Chaska,MN 55318.
11. Model No. 4812, Cole Parmer Co., 7425 N. Oak Park Ave., Chicago,IL 60648.
12. Model No. A14-01, Fluoroware, Inc., Chaska, MN 55318.
13. Catalog No. A-664, Fisher Scientific Co., Fair Lawn, NJ 07410. (Alsoobtained the same results with Catalog No. 0618, J. T. Baker ChemicalCo., Phillipsburg, NJ 08865.)
14. "Guide to Physical Properties of J. T. Baker Industrial Inorganic Chemi-f cals," J. T. Baker Chemical Co., Phillipsburg, NJ 08865.
15. Plasmd model, Tegal Corp., 860 Wharf St., Richmond, CA 94804.
16. Larrabee, G. B., Heinen, K. G., and Harrel, S. A., "'Measurement of theRetention of Fluoride by Silicon and Silicon Dioxide Surfaces," J.Electrochem. Soc., Vol. 114, pp. 867-869, August 1967.
34
17. The particle size analysis was performed on a Coulter Counter, Model T,Coulter Electronics Inc., 590 W. 20th St., Hialeah, FL 33010--datasupplied by Micro Abrasives Corp.--see Ref. No. 7.
18. Judge, J. S., "A Study of the Dissolution of Si02 in Acidic FluorideSolutions," J. Electrochem. Soc., Vol. 118, pp. 1772-1775, November 1971.
19. King, J. C., "Vacuum Electrolysis of Quartz," US Patent No. 3,932,777,Jan. 13, 1976.
20. Krefft, G. B., "Effects of High Temperature Elertrolysis on the Colora-tion Characteristics and OH-Absorption Bands in Alpha-Quartz," RadiationEffects, Vol. 26, pp. 249-259 (1975).
21. King, J. C. and Sander, H. H., "Transient Change in Q and Frequency ofAT-cut Quartz Resonators Following Expoqure to Pulse X-rays," IFEE Trans.on Nuclear Science, Vol. NS-20, pp. 117-125 (1973).
22. Nielsen, J. W. and Foster, F. G., "Unusuai Etch Pits in Quartz Crystals,"The American Mineralogist, Vol. 45, pp. 299-310, March-April 1960.
23. Arnold, G. W., Jr., "Defects in Quartz Crystals," Proc oi the llth AnnualSymposium on Frequency Control, US Army Electronics Command, Ft. Monmouth,NJ, pp. 112-129 (1957). Covies avail, from NTIS. AD 298323.
24. Augustine, F., "Improving the Quality of Synthetic Quartz," Proc. of thel1th Annual Symposium on Frequency Controi, US Army Electronics Command,Ft. Monmouth, NJ, pp. 130-1.41 (1957). Copies avail, from NTIS, AD 298323.
25. Augustine, F. and Hale, D. R., "Topography ard Etch Patterns of SyntheticQuartz," J. Phys. Chem. Solids, Vol. 13, pp. 344-346 (1960).
26. Hanyu, T., "Dislocation Etch Tunnels in Quartz Crystals," J. Phys. Soc.Japan, Vol. 19, p. 1489 (1964).
27. Cilzow-Qual, G., "Atzversuche an Synthetishem Quarz," Physica StatusSolidi, Vol. 1, pp. 62-67 (1961).
28. Tsinzerling, E. V. and Mironova, Z. A.,, "Revealing Dislocations inQuartz by the Selective Etch Method," Soy. Phys. Crystallogr., Vol. 8,pp. 89-91 (1963).
29. Volskaya, 0. B., "Selective Etchants for Quartz," Soy. Phys. Crystallogr.,Vol. 13, pp. 620-623, Jan-Feb 1969.
30. Macdougall, J. D., "Fission--Track Dating," Scientific American, Vol.235, pp. 114-122, December 1976.
31. Doremus, R. H., "Class Science," New York: John Wiley & Sons, Inc.,Chapters 15 and 17 (1973)
35
32. Filler, R. L. and Vig, J. R., "The Effect of Bonding on the Frequencyvs. Temperature Characteristics of AT-cut Resonators," Proc. of the50th Annual Symposium on Frequency Control, US Army ElectronicsCommand, Ft. Monmouth, NJ, pp. 264-268 (1976). Copies available fromElectronics Industries Assoc., 2001 Eye Street, NW, Washington, DC20006; also available as AD A030316.
33. Vig, J. R., LeBus, J. W., and Filler, R, L.A, "Further Results on UVCleaning and Ni Electrobonding," Proc. of the .29th Annual Symposium onFrequency Control, US Army Electronics Command, Ft. Monmouth, NJ,pp. 220-229 (1975). Copies available from EIA, as in Ref. 32.
34. Bennett, R. E., editor,fQuartz Resonator Handbook," Union ThermoelectricDiv., 1960, pp. 113-115. Copies available from NTIS, AD 251289.
SI* I
36

This Document Contains Page/s
Reproduced From
Best Available Copy
APPENDIX A
TIE ETCH RATES OF QUARTZ
The table below shows the etch rates of AT-cut quartz as a function of
temperature, T, in OC, and as a function of blank frequency, f, in MHz. In
each square, the larger number is the rate in kHz per minute; the smaller
number in the upper right hand corner is the rate in kHz per 10 seconds. The
table also shows the rate as a function of temperature in units of pm removed
from the blank thickness per minute and also in units of Af , wheref (rmin)
Af is in kHz and f is in MHz.
TABLE A-i. THE ETCH RATES OF QUARTZ
jTL.o03.35.0 10 15 20 30yfTin
60 60 0.32 0.1930.193 2.1 4,8 19 43 77 174 - -
65 'N9 Yý,6 5 0.,42 0.2550.255 2.7 6.4 26 57 102 23070 Nod-'•,• o ,o,, ,036 3.9 9.0 36 81 44 24.36
75 7 5 o., .0.47 S.1 11.R 47 106 19 47 10.8'.4
80 '~80108.60.65 7.1 65 146 260 -8 -
8 5 N N,8 5 11.41 0.850.85 9.2 21.3 85 191 3 765
90 N eN' 9 0 11.83 1.10
1.10 12 27.5 110j- 248 0 990
1.0 o3.3 5.0 10 15 20 3ofW 2'4n•--(mn)
* ým/min REMOVED FROM F -[--kHz PER 10 SECONDS
THE BLANK THICKNESS W- k Hz PER MINUTE
37 HISA-MI-2198-77