4. 1 - indian etd repository @ inflibnet: home
TRANSCRIPT

The Sample
Nature of the Organization
Bhilai Steel Plant
Research Design
Tools Used
Scoring Procedures
Research Procedure
4. 1
TOOLS & METHODOLOGY
Research Methodology is a method of systematically solving the
research problem. To do any research in a scientific manner, the
investigator generally adopts various steps in a very logical way. The
investigator has to be certain which techniques and procedures will
be applicable to the problem undertaken in the research work. In
this study also the investigator has taken into consideration the
above aspects before deciding how to go about solving the research
problem. The investigator has in a very logical manner decided the
method to be used.
THE SAMPLE
The study was restricted to Bhilai Steel Plant, Bhilai, Dist. Durg;
Chhattisgarh. The sample for the present study was confined to the
employees of Bhilai Steel Plant, Steel Authority of India Limited
(SAIL), a “Maharatna Company”, the leading steel-making company
in India. It is a fully integrated iron and steel maker, producing both
the basic and special steels for domestic construction, engineering,
power, railway, automotive and defense industries and for sale in
export markets.
It is neither feasible nor desirable to conduct the study of the entire
population. Moreover, an accurate assessment of Organizational
Development interventions effectiveness and outcomes can not
assessed from any single department or individual. For each
Organizational Development intervention people are involved at
4. 2
TOOLS & METHODOLOGY
different levels in different departments. Therefore, sampling was
done in which data was collected starting from the General
Managers, Assistant General Managers to the level of Operating staff,
who were directly a part of this interventions.
The data was collected from permanent employees of Bhilai Steel
Plant on a random basis.
Top level – 10 (which will consist of AGMs & Above)
Middle Level – 20 (Supervisors upto the level of Managers)
Lower Level – 70 (Technicians & Operators)
For each intervention, 10 Assistant General Managers (AGMs) were
randomly selected from the shop floor where each intervention is
used accordingly for 4 interventions, 31 Assistant General Managers,
were randomly selected.
Similarly for each intervention, 20 middle level managers upto the
level of Supervisors were randomly selected for each intervention and
accordingly 65 middle level managers were the sample respondents.
And 70 work forces from the level of technicians, operators and
ministerial staff were randomly selected from the shop floors and the
Departments where these said interventions were conducted, and the
sample respondent size in the category of technicians and operators
is 254.

4. 3
TOOLS & METHODOLOGY
However, in the case of Customers Delight – In Services intervention,
the entire Telecommunication Department was covered and the total
strength of the Department was 50 employees who comprised of 1-
Assistant General Manager, 1- Manager, 4 Junior Executives and the
rest 44 employees are Technicians and Operators. Accordingly, the
break up of the sample size for each said intervention is as follows:
Table – 4-1: Sample Profile
S. N. Interventions
AGMs upto the level of General
Managers
Managers upto the level of
Supervisors
Technicians &
Operators Total
1 Competency
Mapping 10 20 70 100
2 Multiskilling 10 20 70 100 3 Customers Delight 1 5 44 50 4 Microplanning 10 20 70 100 Total
Respondents 31 65 254 350
Total 350 sample respondents constitute the sample for the study.
NATURE OF THE ORGANIZATION
Steel Authority of India Limited (SAIL)- A Maharatna Company , is
the leading steel-making company in India. It is a fully integrated
iron and steel maker, producing both basic and special steels for
domestic construction, engineering, power, railway, automotive and
defense industries and for sale in export markets.
Ranked amongst the top ten public sector companies in India in
terms of turnover, SAIL manufactures and sells a broad range of
4. 4
TOOLS & METHODOLOGY
steel products, including hot and cold rolled sheets and coils,
galvanized sheets, electrical sheets, structural‟s, railway products,
plates, bars and rods, stainless steel and other alloy steels. SAIL
produces iron and steel at five integrated plants and three special
steel plants, located principally in the eastern and central regions of
India and situated close to domestic sources of raw materials,
including the Company's iron ore, limestone and dolomite mines. The
company has the distinction of being India‟s second largest producer
of iron ore and of having the country‟s second largest mines network.
This gives SAIL a competitive edge in terms of captive availability of
iron ore, limestone, and dolomite which are inputs for steel making.
SAIL's wide range of long and flat steel products is much in demand
in the domestic as well as the international market. This vital
responsibility is carried out by SAIL's own Central Marketing
Organization (CMO) that transacts business through its network of
37 Branch Sales Offices spread across the four regions, 25
Departmental Warehouses, 42 Consignment Agents and 27
Customer Contact Offices. CMO‟s domestic marketing effort is
supplemented by its ever widening network of rural dealers who meet
the demands of the smallest customers in the remotest corners of the
country. With the total number of dealers over 2000, SAIL's wide
marketing spread ensures availability of quality steel in virtually all
the districts of the country.
4. 5
TOOLS & METHODOLOGY
SAIL's International Trade Division (ITD), in New Delhi- an ISO
9001:2000 accredited unit of CMO, undertakes exports of Mild Steel
products and Pig Iron from SAIL‟s five integrated steel plants.
With technical and managerial expertise and know-how in steel
making gained over four decades, SAIL's Consultancy Division
(SAILCON) at New Delhi offers services and consultancy to clients
world-wide.
SAIL has a well-equipped Research and Development Centre for Iron
and Steel (RDCIS) at Ranchi which helps to produce quality steel and
develop new technologies for the steel industry. Besides, SAIL has its
own in-house Centre for Engineering and Technology (CET),
Management Training Institute (MTI) and Safety Organization at
Ranchi. Our captive mines are under the control of the Raw
Materials Division in Kolkata. The Environment Management
Division and Growth Division of SAIL operate from their
headquarters in Kolkata. Almost all our plants and major units are
ISO Certified.
BHILAI STEEL PLANT
The Bhilai Steel Plant (known as BSP), a public sector undertaking
run by the Steel Authority of India, was built with Soviet co-
operation and technology, and began production in 1959.
Nine - times winner of Prime Minister's Trophy for best Integrated
Steel Plant in the country, Bhilai Steel Plant (BSP) is India's sole

4. 6
TOOLS & METHODOLOGY
producer of rails and heavy steel plates and major producer of
structural steel. The plant is the sole supplier of the country's
longest rail tracks of 260 meters. With an annual production
capacity of 3.153 MT of saleable steel, the plant also specializes in
other products such as wire rods and merchant products. Since BSP
is accredited with ISO 9001:2000 Quality Management System
Standard, all saleable products of Bhilai Steel Plant come under the
ISO umbrella.
IS0:14001 have been awarded for Environment Management System
in the Plant, Township and Dalli, Rajahara Mines and it is the only
steel plant to get certification in all these areas. The Plant is
accredited with internationally recognized certifications, like SA:
8000 certification for social accountability and the OHSAS-18001
certification for Occupational health and safety.
The plant is headed by a Managing Director, who is a member of the
Board of Directors and reports to the Chairman, SAIL. At plant level
the top management comprises of MD and his DROs at ED / GM
level who are functional heads. The senior level is made up of the
Zonal Heads/HODs who are DROs to the functional heads, mostly
GMs /DGMs.
The Middle level is of sectional heads at DGM / AGM level, and the
front line executives consist of Senior Managers down to Junior
4. 7
TOOLS & METHODOLOGY
Managers. Non-Executive employees are categorized into four levels
i.e. unskilled, skilled, highly skilled & supervisory.
Bhilai Steel Plant is located Forty kms west of Raipur, the capital city
of Chhattisgarh, along the Howrah-Mumbai railway line and the
Great-Eastern highway. The plant spreads in about 17 Square
Kilometers.
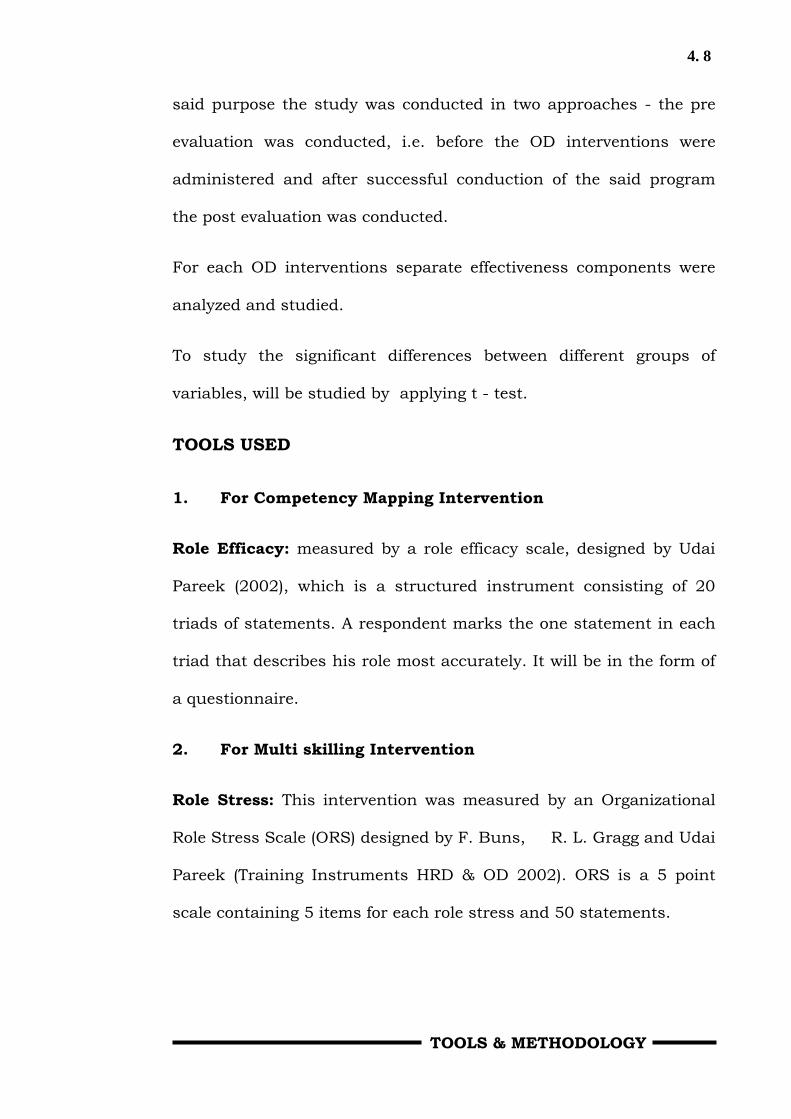
Exhibit – 4-1:
PRODUCTS
PRODUCT-MIX TONNES/ANNUM
Semis 5,53,000
Rail & Heavy Structural 7,50,000
Merchant Products (Angles, Channels, Round & TMT bars)
5,00,000
Wire Rods (TMT, Plain & Ribbed) 4,00,000
Plates (up to 3600 mm wide) 9,50,000
Total Saleable steel 31,53,000
RESEARCH DESIGN
It can be said that the design of a research is the conceptual
framework within which research should be conducted. It is the blue
print for the collection, measurement and analysis of the data
collected. Design gives an outline of what the investigator will have to
do from formulating the hypothesis along with its operational
implication to the final analysis of data.
In this research work the main focus was in analyzing the outcomes
that had yielded results after conducting OD interventions. For the
4. 8
TOOLS & METHODOLOGY
said purpose the study was conducted in two approaches - the pre
evaluation was conducted, i.e. before the OD interventions were
administered and after successful conduction of the said program
the post evaluation was conducted.
For each OD interventions separate effectiveness components were
analyzed and studied.
To study the significant differences between different groups of
variables, will be studied by applying t - test.
TOOLS USED
1. For Competency Mapping Intervention
Role Efficacy: measured by a role efficacy scale, designed by Udai
Pareek (2002), which is a structured instrument consisting of 20
triads of statements. A respondent marks the one statement in each
triad that describes his role most accurately. It will be in the form of
a questionnaire.
2. For Multi skilling Intervention
Role Stress: This intervention was measured by an Organizational
Role Stress Scale (ORS) designed by F. Buns, R. L. Gragg and Udai
Pareek (Training Instruments HRD & OD 2002). ORS is a 5 point
scale containing 5 items for each role stress and 50 statements.
4. 9
TOOLS & METHODOLOGY
3. For Customers Delight in Services
Rumination Analysis: It contains 7 items, three items are pairs, the
respondent is required to choose one item in each pair. The others
contain statements which the respondents were required to choose
one item in each pair. This instrument is designed by R. Roskins, J.
K. Pillai and Muthaiah. (Training Instruments HRD & OD 2002)
4. For Micro Planning Intervention
Organizational Learning Diagnostics: This intervention was
studied using a 5 point scale, designed by M. Alexander, M. Sashkin
and S. B. Parry Organizational Learning Diagnostics has 23 items.
(Training Instruments HRD & OD 2002)
The questionnaire was administered separately for pre and post
result evaluation of the program to assess the above stated points.
SCORING PROCEDURE
1. For Competency Mapping Intervention
Role Efficacy: The role efficacy scale is a structured instrument
consisting of 20 triads of statements. A respondent marks the one
statement in each triad that describes his role most accurately.

4. 10
TOOLS & METHODOLOGY
CONCEPTUAL FRAMEWORK
The Concept of Role Efficacy
The performance of a person working in an organization depends on
his own potential effectiveness, technical competence, managerial
experience, etc. as well as on the design of the role that he performs
in an organization. It is the integration of the two (the person and the
role) that ensures a person‟s effectiveness. Unless a person has the
requisite knowledge, technical competence and skills required for the
role, he cannot be effective. Equally important is how the role, which
he occupies in the organization, is designed. If the role does not allow
the person to use his competence, and if he constantly feels
frustrated in the role, his effectiveness is likely to be low.
The integration of a person and a role comes about when the latter is
able to fulfill the needs of the individual, and when the individual in
turn is able to contribute to the evolution of the role. The more we
move from role making, the greater is the likelihood of the role being
effective. Role taking is responding to the expectations of others,
while role making is taking the initiative to creatively design the role
so that the expectations of both others and the role occupant are
integrated - the effectiveness, the potential effectiveness of the role,
and the organizational climate. The potential effectiveness can be
termed as efficacy.
4. 11
TOOLS & METHODOLOGY
Personal efficacy is the potential effectiveness of a person in personal
and interpersonal situations. Role efficacy is the potential
effectiveness of an individual occupying a particular role in an
organization. Role efficacy can be seen as the psychological factor
underlying role effectiveness.
Aspects of role Efficacy
Role efficacy has several aspects. The more aspects there are, the
higher is the efficacy. These aspects can be classified into three
groups or dimensions. One dimension is role making (as opposed to
role taking). The former is an active attitude towards defining and
making one‟s role as one likes, whereas the latter is a passive
attitude that mainly responds to others‟ expectations.
Dimension 1: Role Making
1. Self-role integration: Every person has strength, experience,
technical training, special skills, and some unique contribution to
make. When his role provides him with greater opportunity for
using such special strength, his role efficacy is likely to be higher.
This is called self-role integration. The self, or the person, and the
role get integrated through the possibility of a person‟s use of his
special strength in the role. All of us want our special strengths to
be used in a role so that we can demonstrate our effectiveness.
Integration, therefore, contributes to high role efficacy. On the
4. 12
TOOLS & METHODOLOGY
other hand, if there is a distance between the self and the role,
role efficacy is likely to be low.
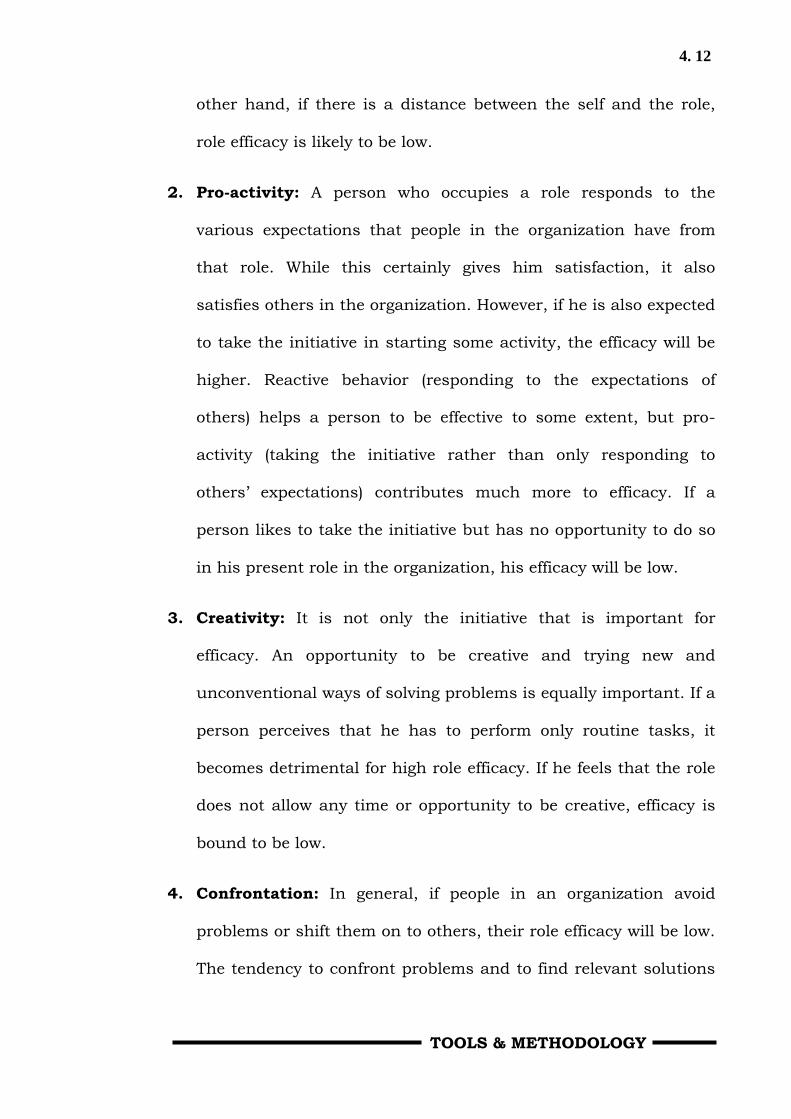
2. Pro-activity: A person who occupies a role responds to the
various expectations that people in the organization have from
that role. While this certainly gives him satisfaction, it also
satisfies others in the organization. However, if he is also expected
to take the initiative in starting some activity, the efficacy will be
higher. Reactive behavior (responding to the expectations of
others) helps a person to be effective to some extent, but pro-
activity (taking the initiative rather than only responding to
others‟ expectations) contributes much more to efficacy. If a
person likes to take the initiative but has no opportunity to do so
in his present role in the organization, his efficacy will be low.
3. Creativity: It is not only the initiative that is important for
efficacy. An opportunity to be creative and trying new and
unconventional ways of solving problems is equally important. If a
person perceives that he has to perform only routine tasks, it
becomes detrimental for high role efficacy. If he feels that the role
does not allow any time or opportunity to be creative, efficacy is
bound to be low.
4. Confrontation: In general, if people in an organization avoid
problems or shift them on to others, their role efficacy will be low.
The tendency to confront problems and to find relevant solutions

4. 13
TOOLS & METHODOLOGY
contributes to efficacy. When people facing interpersonal
problems sit down, talk about them and search out solutions,
their efficacy is likely to be higher compared to situations where
they either deny having such problems or refer them to their
higher officers.
Dimension2: Role Centering
5. Centrality: If a person feels that the role he occupies is central to
the organization, his role efficacy is likely to be high. If people feel
that their roles are peripheral i.e. not very important, their
potential effectiveness will be low. This is true for all persons and
not only for those at the lowest level.
6. Influence: A relative concept is that of influence or power. The
more influence a person is able to exercise in his role, the higher
its efficacy is likely to be. One factor that makes roles in the
public-sector or in civil services more efficacious is the
opportunity to influence a larger section of the society. One
obvious factor underlying the higher motivation of the workers
was the discretion given to the roles.
7. Personal growth: Another factor which contributes to role
efficacy is the perception that the role provides the individual with
an opportunity to grow and develop. There are several instances of
people leaving one role and becoming very effective in another.
This happens primarily because they have greater opportunity to
4. 14
TOOLS & METHODOLOGY
grow in the second role. The main reason is the lack of
opportunity for them to grow systematically in their roles.
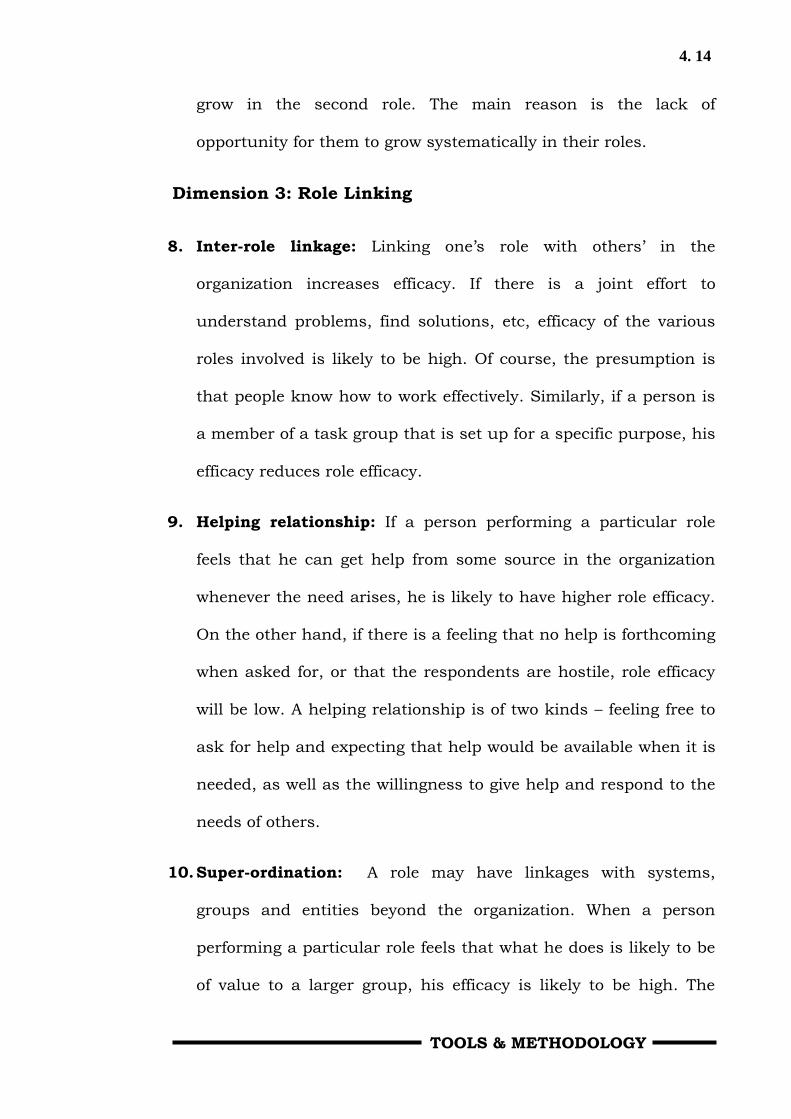
Dimension 3: Role Linking
8. Inter-role linkage: Linking one‟s role with others‟ in the
organization increases efficacy. If there is a joint effort to
understand problems, find solutions, etc, efficacy of the various
roles involved is likely to be high. Of course, the presumption is
that people know how to work effectively. Similarly, if a person is
a member of a task group that is set up for a specific purpose, his
efficacy reduces role efficacy.
9. Helping relationship: If a person performing a particular role
feels that he can get help from some source in the organization
whenever the need arises, he is likely to have higher role efficacy.
On the other hand, if there is a feeling that no help is forthcoming
when asked for, or that the respondents are hostile, role efficacy
will be low. A helping relationship is of two kinds – feeling free to
ask for help and expecting that help would be available when it is
needed, as well as the willingness to give help and respond to the
needs of others.
10. Super-ordination: A role may have linkages with systems,
groups and entities beyond the organization. When a person
performing a particular role feels that what he does is likely to be
of value to a larger group, his efficacy is likely to be high. The
4. 15
TOOLS & METHODOLOGY
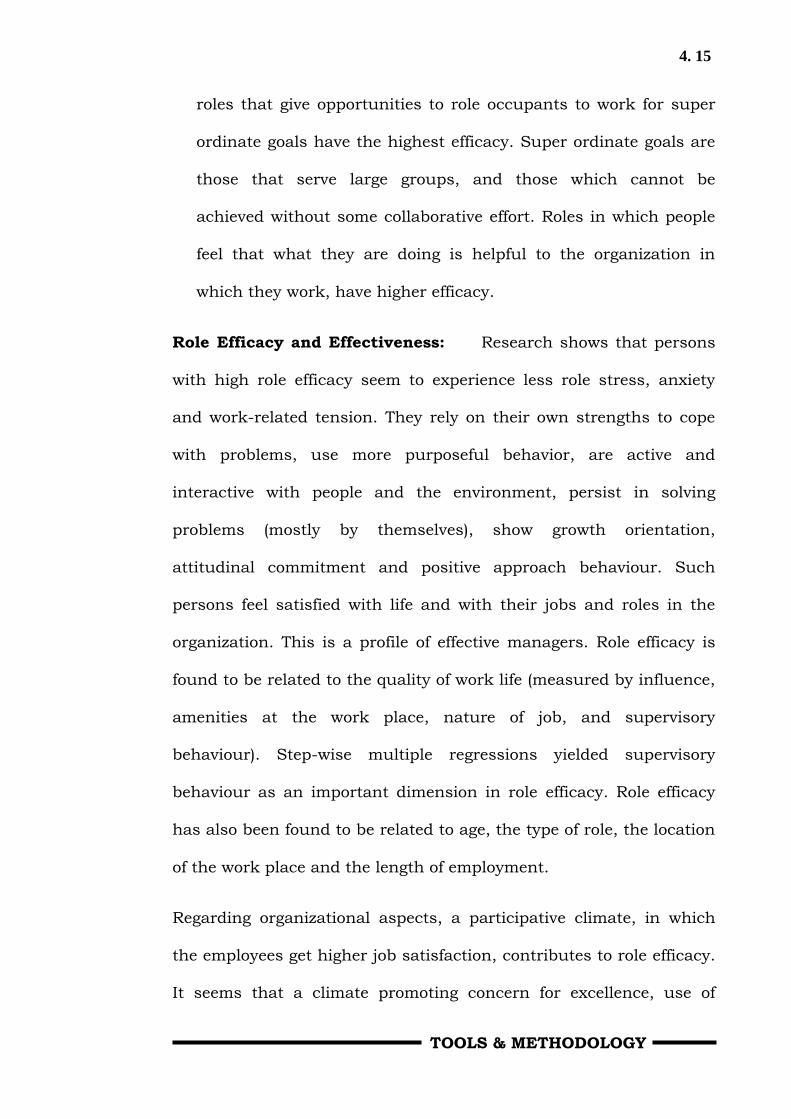
roles that give opportunities to role occupants to work for super
ordinate goals have the highest efficacy. Super ordinate goals are
those that serve large groups, and those which cannot be
achieved without some collaborative effort. Roles in which people
feel that what they are doing is helpful to the organization in
which they work, have higher efficacy.
Role Efficacy and Effectiveness: Research shows that persons
with high role efficacy seem to experience less role stress, anxiety
and work-related tension. They rely on their own strengths to cope
with problems, use more purposeful behavior, are active and
interactive with people and the environment, persist in solving
problems (mostly by themselves), show growth orientation,
attitudinal commitment and positive approach behaviour. Such
persons feel satisfied with life and with their jobs and roles in the
organization. This is a profile of effective managers. Role efficacy is
found to be related to the quality of work life (measured by influence,
amenities at the work place, nature of job, and supervisory
behaviour). Step-wise multiple regressions yielded supervisory
behaviour as an important dimension in role efficacy. Role efficacy
has also been found to be related to age, the type of role, the location
of the work place and the length of employment.
Regarding organizational aspects, a participative climate, in which
the employees get higher job satisfaction, contributes to role efficacy.
It seems that a climate promoting concern for excellence, use of
4. 16
TOOLS & METHODOLOGY
expertise, and concern for the large issues also contributes to role
efficacy. On the other hand, a climate characterized by control and
affiliation seems to lower employees‟ role efficacy. An innovation-
fostering climate was found to be a strong predictor of role efficacy.
Role efficacy has also been reported as a strong moderator or
mediating variable, having a dramatic influence in predicting or
enhancing organizational climate.
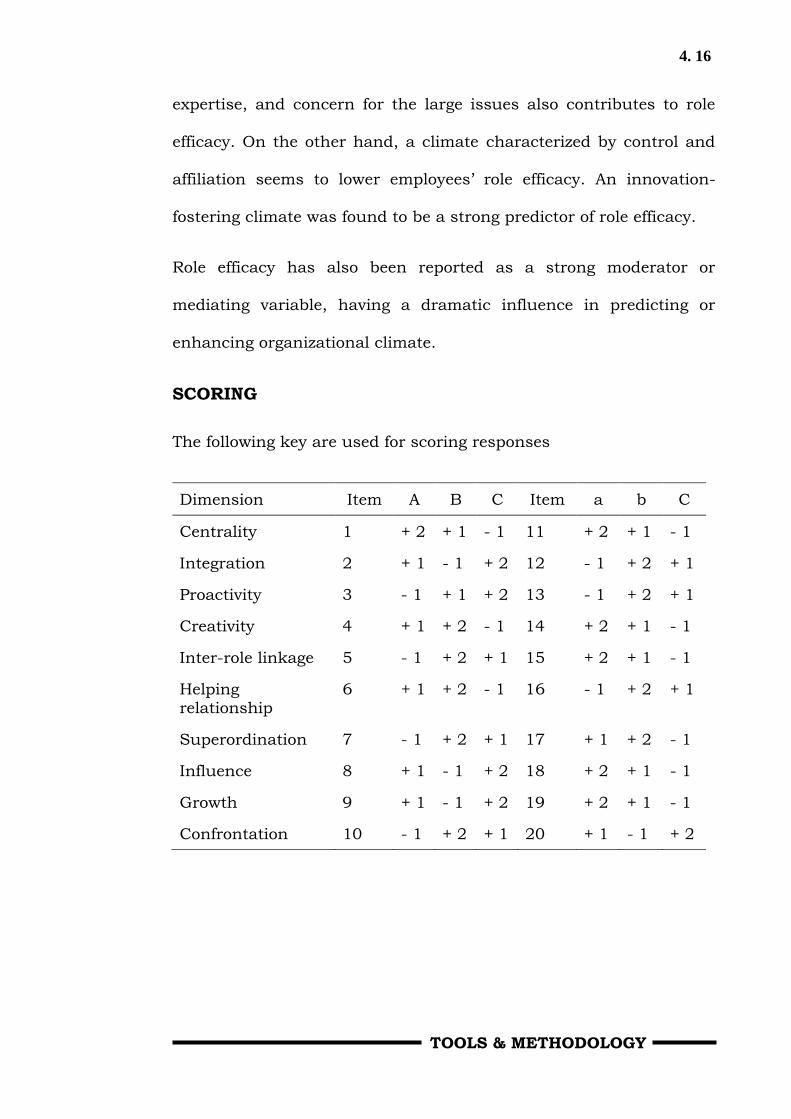
SCORING
The following key are used for scoring responses
Dimension Item A B C Item a b C
Centrality 1 + 2 + 1 - 1 11 + 2 + 1 - 1
Integration 2 + 1 - 1 + 2 12 - 1 + 2 + 1
Proactivity 3 - 1 + 1 + 2 13 - 1 + 2 + 1
Creativity 4 + 1 + 2 - 1 14 + 2 + 1 - 1
Inter-role linkage 5 - 1 + 2 + 1 15 + 2 + 1 - 1
Helping relationship
6 + 1 + 2 - 1 16 - 1 + 2 + 1
Superordination 7 - 1 + 2 + 1 17 + 1 + 2 - 1
Influence 8 + 1 - 1 + 2 18 + 2 + 1 - 1
Growth 9 + 1 - 1 + 2 19 + 2 + 1 - 1
Confrontation 10 - 1 + 2 + 1 20 + 1 - 1 + 2
4. 17
TOOLS & METHODOLOGY
RELIABILITY
Sen (1982) reported a retest reliability of .68 significant at .001 level.
This shows the high stability of the scale. Sen has also reported high
internal consistency, indicated by significant correlation values
among the items.
VALIDITY
Sayeed (1985) reported item-total correlation for twenty Role Efficacy
Scale (RES) items for a total sample of 658 managers, and for eleven
organizations separately. For the total sample the lowest correlation
was 0.16 (for item 20) and the highest 0.51. The mean corrected
item-total correlation for the entire sample was -0.36, with an alpha
coefficient of 0.80. The alpha coefficients for the mean corrected
item-total correlations of the eleven organizations ranged from 0.71
to 0.85. These results show internal homogeneity of the scale. This,
however, is only one dimension of the validity of the scale.
CORRELATES
Sen (1982) reported negative and significant correlations between
role efficacy and the eight role stresses (including total role stress),
all being significant at .001 level for bank employees. Sayeed (1985)
has reported negative correlation between work-related tension and
the overall role efficacy measure.
4. 18
TOOLS & METHODOLOGY
Das (1984) found role efficacy to be negatively related to some role
stress variables, implying that role efficacy not only helps in
experiencing job behaviour as purposeful but also in overcoming the
experience of some kinds of role conflicts.
Role efficacy has been reported to have a high positive correlation
with the internal locus of control. Sen (1982) revealed a positive and
significant correlation between role efficacy and internality, and a
significant negative correlation between role efficacy and externality
of all kinds (relating to others, relating to chance and the total).
Surti (1983) reported a positive correlation of role efficacy with the
approach model of coping with stress, and a negative correlation
between role efficacy and the avoidance coping mode. Both report
positive correlation of role efficacy with intra-persistive coping mode.
Both report positive correlation of role efficacy with intra-persistive
copying style and negative correlation of role efficacy with impunitive
style.
The relationship between role efficacy and managerial behaviour was
found by re-analyzing data of 500 managers, complied by Sen (1982).
It was found that the approach for six motives was significant at .001
level in three cases (achievement, influence and extension), at .01
level in two cases (control and dependency), and at .05 level for
affiliation. When role efficacy scores were correlated with the
operating effectiveness index on the six motives, all correlations were
4. 19
TOOLS & METHODOLOGY
found to be positive and significant at .001 level (except affiliation,
which was significant at .01 level).
A positive correlation (significant at 0.001 level) has been reported by
Sen between role efficacy and achievement-oriented climate (one
promoting concern and pursuit of excellence). He has also reported
positive correlations between role efficacy and extension climate
(significant at 0.01 level) and expert power climate. In the former, the
organizational practices promote concern for employees and the
organization, whereas in the letter, the practices promote expertise
(utilizing, rewarding, etc.). The correlations between role efficacy and
dependency climate (promoting the attitudes of expecting solutions
from superiors), and between role efficacy and affiliation climate
(promoting personal relationship) were not found to be significant by
Sen. His data revealed a negative correlation (significant at 0.01 level)
only with the control climate (promoting centralization of power).
USE IN OD
Role efficacy can be assessed through this instrument. The 10
aspects can be probed and one can work out ways to increase
effectiveness by increasing the aspect on which one‟s score is low.
4. 20
TOOLS & METHODOLOGY
2. For Multi skilling Intervention
Role Stress:
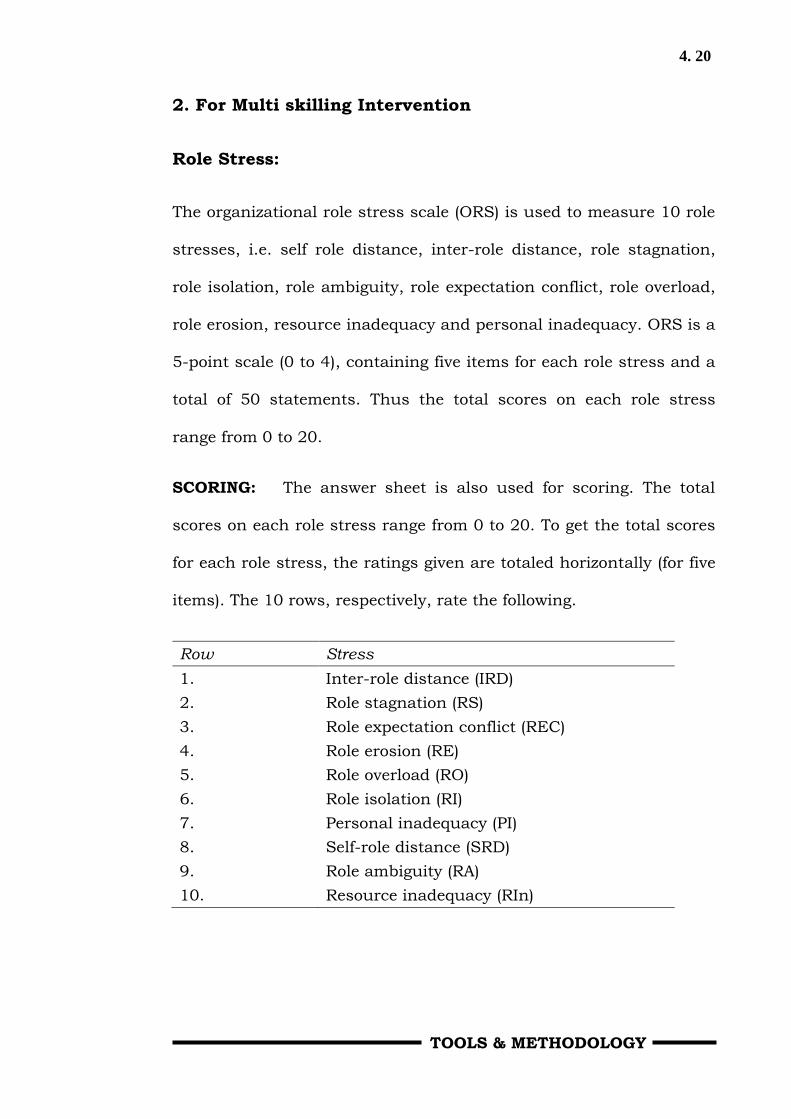
The organizational role stress scale (ORS) is used to measure 10 role
stresses, i.e. self role distance, inter-role distance, role stagnation,
role isolation, role ambiguity, role expectation conflict, role overload,
role erosion, resource inadequacy and personal inadequacy. ORS is a
5-point scale (0 to 4), containing five items for each role stress and a
total of 50 statements. Thus the total scores on each role stress
range from 0 to 20.
SCORING: The answer sheet is also used for scoring. The total
scores on each role stress range from 0 to 20. To get the total scores
for each role stress, the ratings given are totaled horizontally (for five
items). The 10 rows, respectively, rate the following.
Row Stress
1. Inter-role distance (IRD)
2. Role stagnation (RS)
3. Role expectation conflict (REC)
4. Role erosion (RE)
5. Role overload (RO)
6. Role isolation (RI)
7. Personal inadequacy (PI)
8. Self-role distance (SRD)
9. Role ambiguity (RA)
10. Resource inadequacy (RIn)

4. 21
TOOLS & METHODOLOGY
RELIABILITY
Retest reliability coefficients were calculated for a group of about 500
employees from three banks (Sen, 1982). Studies gives retest
reliability (after eight weeks) for all the eight stresses, as well as for
the total role stress score. All the coefficients, except one, are
significant at .001 level; one coefficient is significant at .003 level.
The scale has acceptable reliability.
Exhibit – 4-2:
Retest Reliability of Role Stress Variables Variables Coefficient Levels of Significance
1. Self-role distance .45 .001
2. Inter-role distance .58 .001
3. Role stagnation .63 .001
4. Role ambiguity .65 .001
5. Role overload .53 .001
6. Role erosion .37 .003
7. Role inadequacy .58 .001
8. Total role stress .73 .001
Validity: Item Analysis
Some evidence about validity is provided by a measure of self-
consistency in an instrument. Each item was correlated with the
total score on the instrument for about 500 respondents. All but two
correlations were significant at .001 level; one was significant at .002
and another at .008 levels. The results show high internal
consistency of the scale. Only values of three items are below .36
(item 9, 15 and 25). In the entire scale only two items (9 and 25) were
4. 22
TOOLS & METHODOLOGY
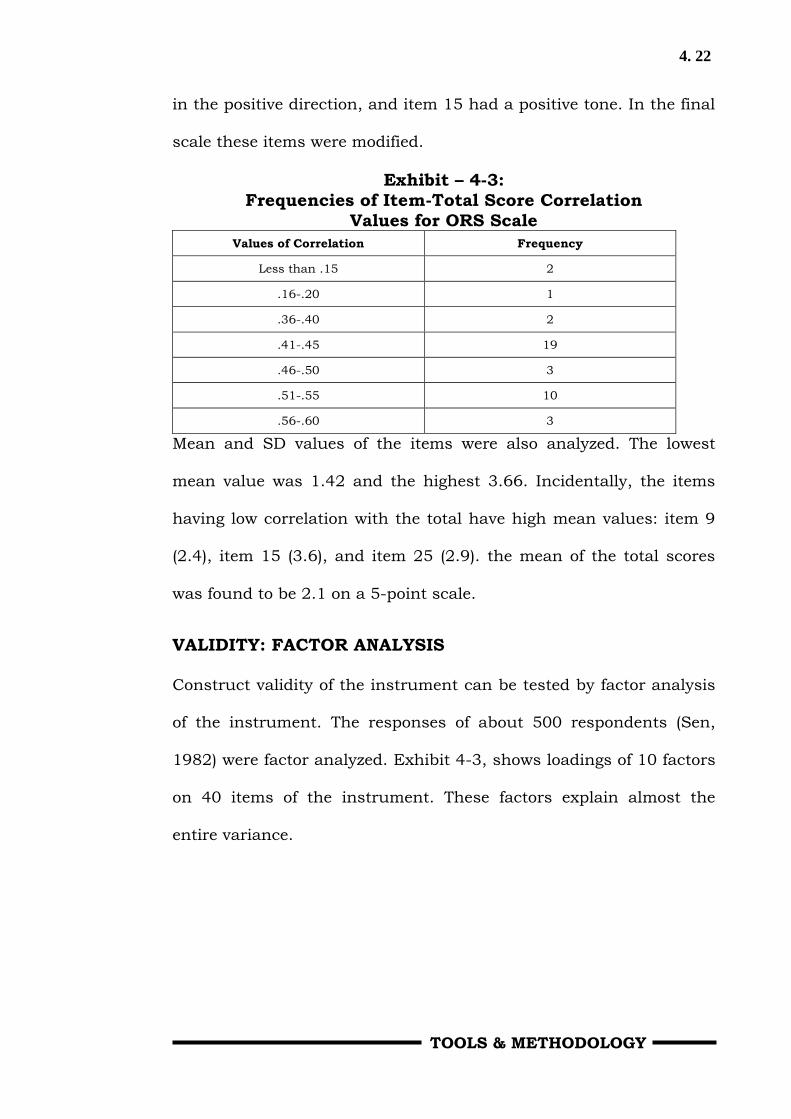
in the positive direction, and item 15 had a positive tone. In the final
scale these items were modified.
Exhibit – 4-3:
Frequencies of Item-Total Score Correlation
Values for ORS Scale
Values of Correlation Frequency
Less than .15 2
.16-.20 1
.36-.40 2
.41-.45 19
.46-.50 3
.51-.55 10
.56-.60 3
Mean and SD values of the items were also analyzed. The lowest
mean value was 1.42 and the highest 3.66. Incidentally, the items
having low correlation with the total have high mean values: item 9
(2.4), item 15 (3.6), and item 25 (2.9). the mean of the total scores
was found to be 2.1 on a 5-point scale.
VALIDITY: FACTOR ANALYSIS
Construct validity of the instrument can be tested by factor analysis
of the instrument. The responses of about 500 respondents (Sen,
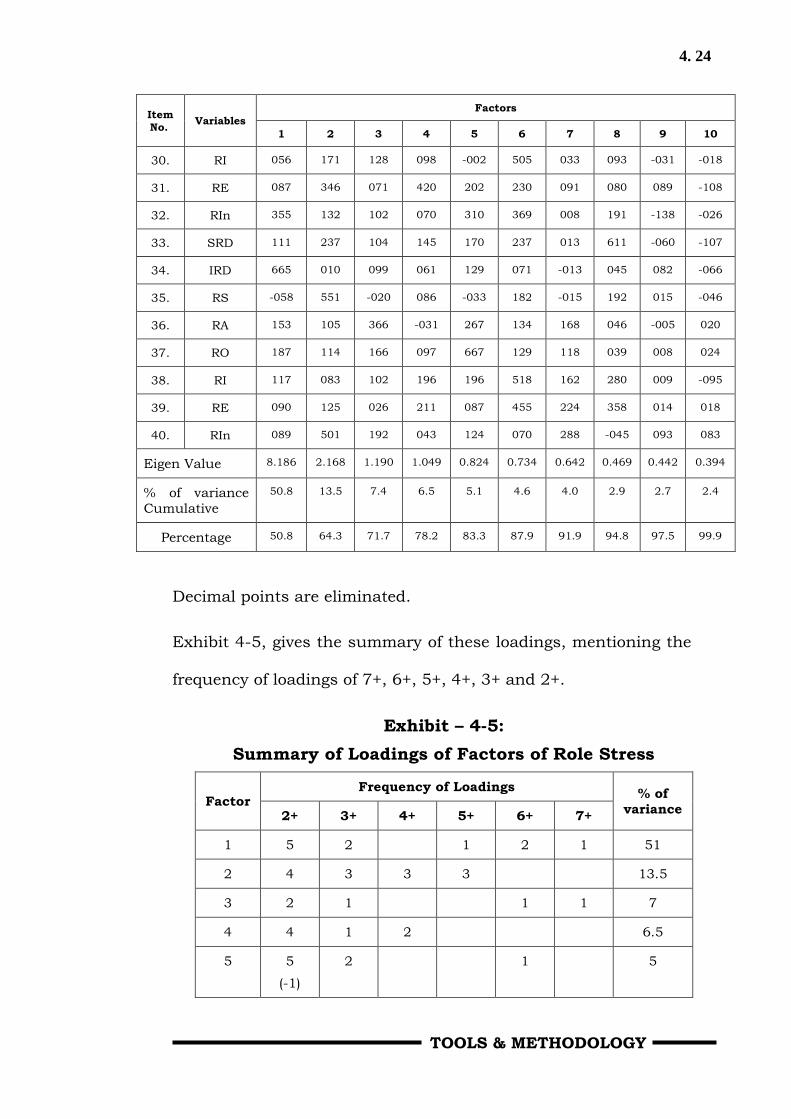
1982) were factor analyzed. Exhibit 4-3, shows loadings of 10 factors
on 40 items of the instrument. These factors explain almost the
entire variance.

4. 23
TOOLS & METHODOLOGY
Exhibit – 4-4:
Factor Loading of Roles Stress
Item
No. Variables
Factors
1 2 3 4 5 6 7 8 9 10
1. SRD 165 051 167 046 149 153 085 388 -096 -012
2. IRD 619 310 005 065 -002 038 167 131 055 076
3. RD 076 451 -105 088 -062 096 067 372 -286 161
4. RA 144 119 154 228 034 157 366 269 -160 155
5. RO 335 -098 076 076 335 184 076 024 033 320
6. RI 105 001 122 339 181 458 146 150 055 299
7. RE 109 103 073 477 -038 244 114 253 -011 127
8. RIn 016 126 228 048 099 309 038 325 044 296
9. SRD -057 031 -034 -041 026 018 125 125 -415 016
10. IRD 798 005 124 110 -025 056 121 -038 007 -028
11. RS 246 407 126 226 103 033 158 058 029 186
12. RA 196 097 724 127 065 100 005 171 002 101
13. RO 257 255 158 007 181 143 112 146 060 140
14. RI 014 254 167 093 -047 316 040 259 186 193
15. RE -025 248 -105 -049 -241 148 059 131 256 -142
16. RIn 224 121 099 103 033 061 449 098 -248 072
17. SRD 012 179 049 064 -032 193 126 503 208 120
18. IRD 584 085 172 -058 135 208 027 035 -071 027
19. RS 076 309 057 114 059 -029 249 204 156 075
20. RA 183 048 618 058 118 170 136 075 039 012
21. RO 264 148 129 016 281 013 241 198 139 020
22. RI 135 434 114 -043 002 441 -031 038 089 078
23. RE 140 264 203 265 118 098 178 080 083 -051
24. RIn 154 117 064 049 083 497 238 149 -007 107
25. SRD 018 143 006 007 047 027 139 -047 410 053
26. IRD 056 060 128 091 187 151 220 129 020 131
27. RS 055 536 081 003 091 171 195 152 042 -130
28. RA 115 159 061 098 109 233 459 046 034 -044
29. RO 225 155 168 -032 242 226 383 101 155 007
4. 24
TOOLS & METHODOLOGY
Item
No. Variables
Factors
1 2 3 4 5 6 7 8 9 10
30. RI 056 171 128 098 -002 505 033 093 -031 -018
31. RE 087 346 071 420 202 230 091 080 089 -108
32. RIn 355 132 102 070 310 369 008 191 -138 -026
33. SRD 111 237 104 145 170 237 013 611 -060 -107
34. IRD 665 010 099 061 129 071 -013 045 082 -066
35. RS -058 551 -020 086 -033 182 -015 192 015 -046
36. RA 153 105 366 -031 267 134 168 046 -005 020
37. RO 187 114 166 097 667 129 118 039 008 024
38. RI 117 083 102 196 196 518 162 280 009 -095
39. RE 090 125 026 211 087 455 224 358 014 018
40. RIn 089 501 192 043 124 070 288 -045 093 083
Eigen Value 8.186 2.168 1.190 1.049 0.824 0.734 0.642 0.469 0.442 0.394
% of variance
Cumulative
50.8 13.5 7.4 6.5 5.1 4.6 4.0 2.9 2.7 2.4
Percentage 50.8 64.3 71.7 78.2 83.3 87.9 91.9 94.8 97.5 99.9
Decimal points are eliminated.
Exhibit 4-5, gives the summary of these loadings, mentioning the
frequency of loadings of 7+, 6+, 5+, 4+, 3+ and 2+.
Exhibit – 4-5:
Summary of Loadings of Factors of Role Stress
Factor Frequency of Loadings
% of
variance 2+ 3+ 4+ 5+ 6+ 7+
1 5 2 1 2 1 51
2 4 3 3 3 13.5
3 2 1 1 1 7
4 4 1 2 6.5
5 5
(-1)
2 1 5

4. 25
TOOLS & METHODOLOGY
Factor Frequency of Loadings
% of
variance 2+ 3+ 4+ 5+ 6+ 7+
6 6 3 4 2 5
7 6 2 2 4
8 5 4 1 1 3
9 4
(-2)
2
(-1)
3
10 1 1 2
It may be seen from Exhibit that factor 10 has a loading of 3+ only
on one item, and of 2+ on another item. It contributes 2% to the total
variance. In view of these considerations, this factor can be dropped,
Factor 9 has loading of 3 on one self-distance item. It has a negative
loading of 3 on another self-role distance item. This factor may be
ignored. Only those factors which have at least three loadings of 3
are taken. Thus only those with eight factors are left.
Factor 1 has high loadings on four items of inter-role distance and
one item each of role overload and role inadequacy. Three IRD items
relate to conflict between the organizational role and the family role.
Role overload, in a way, also contributes to such a conflict. Role
inadequacy (item 32) relates to doing “all the things I feel should be
done”. In a way, this item also relates to inter-role distance. This
factor has loading of about 8 on item 10 (“My role does not allow me
to have enough time with my family”). It may be recalled as an inter-
role distance (F) factor. F stands for family. This factor has the
dominant theme of conflict between the organizational role and
family role. IRD can be of two types: IRD (F) and IRD (S) – one

4. 26
TOOLS & METHODOLOGY
concerned with conflict with family roles, and the other with social
roles.
Exhibit – 4-6:
Summary of Loading of 3+ on eight Factors on Role Stress
Dimension
Factors
Role Stress Dimensions
Inte
r
Role
Dis
tan
ce
Role
Sta
g-n
ati
on
Role
Am
bi-
guit
y
Role
Ero
sio
n
Role
Overl
oad
Role
Isola
tion
Role
Inadeq-u
acy
Self
Role
Dis
ta-
nce
1 4 1 1
2 1 5 1 1 1
3 3
4 2 1
5 2 1
6 1 5 3
7 2 1 1
8 1 1 1 3
Factor 2 has high loadings on all five role stagnation items, and on
one each of inter-role distance, role erosion, role isolation, and role
inadequacy. On role isolation item, on which it has a 4+ loading,
relates to consultation with other roles; one role erosion item (31)
relates to the desire to have more functions in one‟s own role
(indirectly referring to role stagnation); one role inadequacy item (40)
on which the factor has 5+ loading refers to lack of skills in handling
responsibility (reflecting role stagnation). Since most of these items
4. 27
TOOLS & METHODOLOGY
refer to stagnation, termed as a role stagnation factor, interpreting
stagnation as lack of growth of the individual, and lack of growth of
the role. This factor contributes 13.5% to the total variance of role
stress.
Factor 3 (explaining about 7% variance) has high loadings on only
three role ambiguity items: number 12, on conflicting demands of
various people (loading of 7+); number 20, relating to conflicting
demands of peers/subordinates (loading of 6+); and number 36,
relating to demands of clients and others having expectations
(loading of 3+). Its loadings of other role ambiguity items relating to
clarity of responsibilities (4), and clarity about what people expect
(28) are very low (-0 or +1). Therefore, these factors can be called the
role ambiguity (CE). CE stands for conflict or expectations. Role
ambiguity may consist of two elements: lack of clarity and conflict of
expectation – Role ambiguity (LC) and Conflict Expectation (CE).
Factor 4 has high loadings on two role erosion items with loadings of
4+: number 7 relating to reduce of importance of the role; and
number 31, relating to important functions being assigned to other
roles. It has a slightly negative loading (of 1 +) on item 15 relating to
taking on more responsibility. On other role erosion items it has
loadings of 2+. It has a high loading on item 6 (role isolation, “other
role occupants do not give enough attention and time to my role.”)
This item also reflects the lower importance of the role. This factor
can be called role erosion, in which taking responsibility is not

4. 28
TOOLS & METHODOLOGY
significant, but the general feeling of the importance given by others
to the role is the central theme.
Factor 5 has high loadings on two role overload items: number 37,
relating to the need to reduce some parts of the role (loading of 6+),
and number 5, stating workload being high (loading of 3+), and one
role inadequacy item (“I do not have sufficient time or resources to do
all the things I feel should be done”). The role inadequacy item also
reflects a feeling of role overload with the existing resources. On
other role overload items it has 2+ (on two items) and 1+ (on one
item). This factor is called as a overload.
Factor 6 has high loadings on all five role isolation items, three role
inadequacy items and one role erosion item. It has a loading of 5+ on
items related to joint problem solving (item 30) and response for
collaboration and help (item 38); a loading of 4+ on items related to
attention from other role occupants (item 6) and mutual consultation
(item 22); and a loading of 3+ on an item related to interaction with
other roles (item 14). It also has loading of 4+ on role inadequacy
items related to getting the needed information. This item also
denotes isolation. However, there are two other role inadequacy items
on which it has loadings of 3+, one related to authority given (item 8),
and the other to time and resources available (item 32). The main
theme in this factor is lack of linkages with other roles also called as
a role isolation factor. This factor contributes about 50% of the total
variance.
4. 29
TOOLS & METHODOLOGY
Factor 7 (accounting for 4% variance) has high loadings on two role
ambiguity items, and one each of role overload and role inadequacy.
It has loading of 4+ on a role inadequacy item (16) related to lack of
adequate knowledge, and a role ambiguity item (28: “I do not know
what the people I work with expect of me”). The emphasis in the
letter item seems to be on one‟s own inadequacy, “I do not know”.
Similarly, it has loadings of 3+ on a role ambiguity item (number 4 “I
am not clear…”), and a role overload item (number 29.: “Too many
people expect too much…”). Both these items show helplessness and
personal inadequacy. This factor is called role inadequacy (P), P
standing for personal. There may be two types of role inadequacy:
personal inadequacy (lack of internal resources to meet the role
demands); and resource inadequacy – role inadequacy (R) – related to
lack of external resources to meet role demands. This factor accounts
for about 3% variance of role stress.
Factor 8 has high loadings on three self-role distance items, and one
each on role stagnation, role erosion and role inadequacy items. It
has a loading of 6+ on SRD item 33 (value-role conflict), loading of 5+
on SRD item 17 (inter-responsibility conflict), and loading of 3+ on
SRD item 1 (value-role performance conflict). All these are self-role
distance items. The other items on which it has loadings of 3+ are:
role stagnation item 3 (not learning in the role), role inadequacy item
8 (not having enough responsibility) and role erosion item 39
(attention being given to other roles). Out of these, item 3 reflects
4. 30
TOOLS & METHODOLOGY
conflict between self-image (of learning) and the role contents. We
may thus call this a self-role distance factor. This factor explains
about 3% variance.
This brings the following factors for ORS Scale:
Factor 1: Inter-role distance (IRD) 51% variance
Factor 2: Role stagnation (RS) 14% variance
Factor 3: Role expectation conflict (REC)7% variance
Factor 4: Role erosion (RE) 7% variance
Factor 5: Role overload (RO) 5% variance
Factor 6: Role isolation (RI) 5% variance
Factor 7: Role inadequacy (personal) (R in P) 4% variance
Factor 8: Self-role distance (SRD) 3% variance
Factor analysis of the responses of 380 executives from three
organizations, one each in the public, private and joint sector, gave
similar evidence of the validity of the scale, although role underload
was also suggested as a factor (Srinivasan and Anantharaman 1988).
Srivastav (1993) got similar results from factor analysis of data on
ORS of about 400 executives in a public sector company.

4. 31
TOOLS & METHODOLOGY
NORMS
Based on median and quartile deviation, the following norms are
suggested (Khanna 1985) for managers:
Stress Medium Low High
SRD 5 3 9
IRD 5 2 8
RS 5 2 8
RI 6 3 9
RA 3 1 7
REC 4 2 7
RO 3 1 6
RE 9 7 12
R In 5 2 8
PI 4 2 8
CORRELATES
Srivastava (1991) found a significant positive correlation of various
dimensions of role stress with the symptoms of mental ill health.
Stress arising from role ambiguity and role stagnation most
intensively correlated with somatic concomitants of anxiety.
In a sample of 120 engineering executives, Rajagopalan and
Khandelwal (1988) found total role stress had a positive correlation
(.28) with avoidance and a negative correlation (-.29) with approach
coping styles, both being significant at .001 level. REC, RE and SRD
were not correlated with each other; correlations in case of IRD, RI
4. 32
TOOLS & METHODOLOGY
and RA were significant at .05 level, and in others (RS, RO, Pi and
RIn) these were significant at .01 level.
USE IN OD
These instruments give data about the number of different role
stresses experienced by a respondent. A detailed analysis of stresses
on which a respondent has high scores can be done and some plans
can be worked out to manage and reduce these.
3. For Customers Delight in Services
Rumination Analysis:
THE INSTRUMENT AND ITS ADMINISTRATION
Dealing with Emotions contains seven items. Three items are pairs;
the respondent is required to choose one item in each pair. The
others contain statements which the respondent is required to rate
on a five-point scale, indicating the frequency of occurrence. It is
simple to administer.
THE CONCEPTUAL FRAMEWORK
Rumination and Flow
When one sits alone or day-dream and recall all our miseries,
misfortunes, failures, or bad experiences with several people, it is
called rumination. Sitting in groups and talking about past miseries
or current disappointments is also rumination. We almost relive the
4. 33
TOOLS & METHODOLOGY
same experiences and indulge in such recollections. On the other
hand, when we recollect our good experiences, enjoy such
recollection, or are involved in a highly absorbing activity it is called
flow.
Worrying about matters is also rumination. Rumination is
dysfunctional and damaging. Rumination makes the situation even
worse, particularly when one is under control not only what we think
but when we think.
Women are twice as likely to suffer depression as men because they
tend to think about problems in a way that amplify depression. Men
tend to act rather than reflect, but women tend to contemplate their
depression, mulling it over and over, trying to analyze it to determine
its source.
When a woman gets fired from her job, she tries to figure out why,
she broods and she relives the events over and over again. A man
upon getting fired acts. He gets drunk, beats someone up or
otherwise distracts himself from thinking about it.
Psychologists call this process of obsessive analysis rumination, the
usual meaning of the word being „chewing the cud‟. Ruminant
animals such as cattle, sheep and goats chew a cud which is
regurgitated, partially digested food; not a very appealing image of
what people who ruminate do with their thoughts, but an

4. 34
TOOLS & METHODOLOGY
exceedingly apt one! Rumination combined with a pessimistic
explanatory style leads to severe depression.
People who mull over bad events are called ruminators. A ruminator
can either be an optimist or pessimist. Optimist ruminators are
action-oriented. They have a pessimistic explanatory style, but they
rarely talk to themselves and when they do, it is usually about what
they plan to do, not about how bad things are. However, the belief
structure of a pessimist ruminator is pessimistic and they repeatedly
tell themselves how bad things are.
There is a positive relationship between pessimism and rumination
with both of them leading to depression. If a person believes that
he/she is helpless in some situation, and the cause of the situation
is permanent, pervasive and personal, the consequences are
depression.
The more a person ruminates; the more the feeling of helplessness
arises. And the more the feeling of helplessness, the more depressed
the person is. The consequences are depression.
People who do not ruminate tend to avoid depression even if they are
pessimists. Similarly, optimists who ruminate also avoid depression.
Changing either rumination or pessimism help relieve depression.
Changing both helps the most.
Susan Noalen Hocksama (1998) of Stanford University is the
originator of the rumination theory. When asked to rate what they
4. 35
TOOLS & METHODOLOGY
actually did when they were depressed, the majority of women
subjects said that they tried to analyze their mood or the cause
behind it, whereas most men said they did something they enjoyed.
The concept of flow is the opposite of rumination. Mihaly
Csikszentmihalyi (1976) proposed the concept of „flow‟ as deep
involvement in positive activity and thought, the joy one gets in the
recollection of good and positive experiences, or in activities
demanding high involvement. According to Mihaly C., flow exists in
the present, and it is possible to flow while engaged in any activity.
Daniel Goleman (1988) suggests five steps in achieving flow in Flow
and mindfulness: An instructional cassette (Consumer Service
Division, New York). These are: 1. Fit difficulty to skill (even match
between the difficulty of a challenge and a person‟s ability to meet it),
2. Focus attention (focusing attention to allow the merging of
awareness and activity), 3. Forget time (the ability to focus on the
moment, on here and now), 4. Relax and wake up (alert mind and
relaxed body), 5. Training for flow (e.g. dance, meditation, some
eastern martial arts, music, etc.). Thus flow means involvement in
positive thinking, recalling pleasant experiences, pleasant
daydreams, and involvement in activities that one enjoys.
4. 36
TOOLS & METHODOLOGY
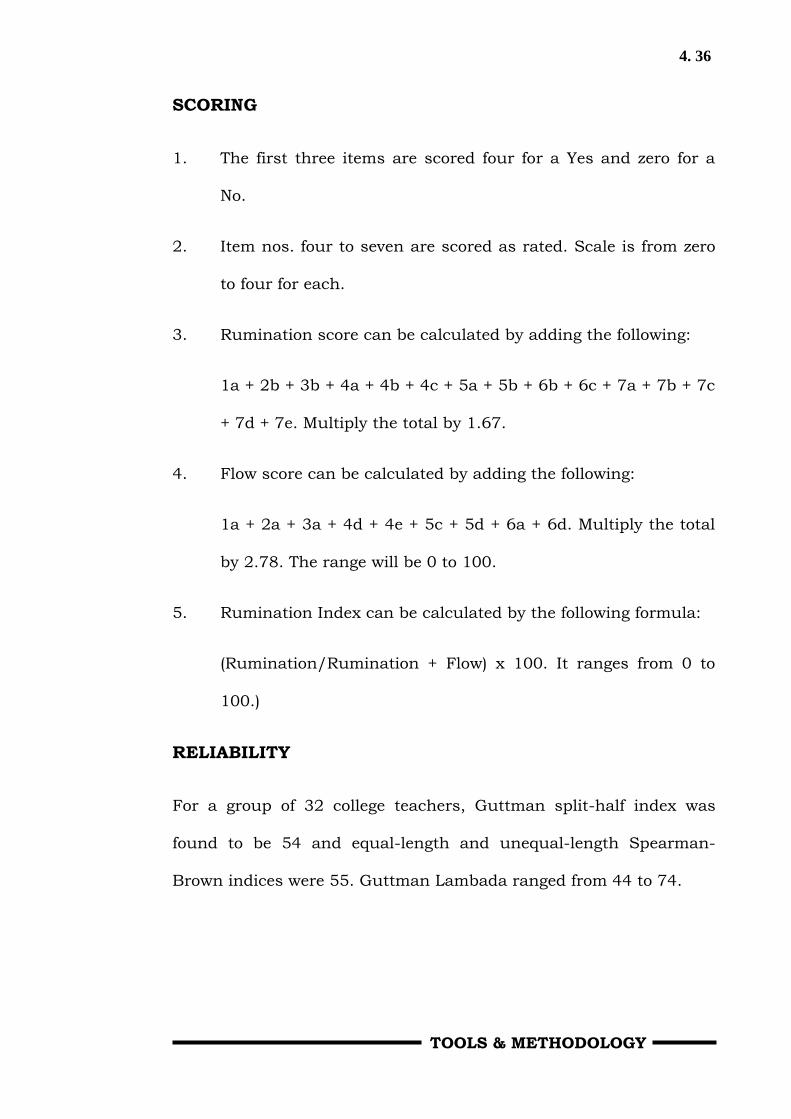
SCORING
1. The first three items are scored four for a Yes and zero for a
No.
2. Item nos. four to seven are scored as rated. Scale is from zero
to four for each.
3. Rumination score can be calculated by adding the following:
1a + 2b + 3b + 4a + 4b + 4c + 5a + 5b + 6b + 6c + 7a + 7b + 7c
+ 7d + 7e. Multiply the total by 1.67.
4. Flow score can be calculated by adding the following:
1a + 2a + 3a + 4d + 4e + 5c + 5d + 6a + 6d. Multiply the total
by 2.78. The range will be 0 to 100.
5. Rumination Index can be calculated by the following formula:
(Rumination/Rumination + Flow) x 100. It ranges from 0 to
100.)
RELIABILITY
For a group of 32 college teachers, Guttman split-half index was
found to be 54 and equal-length and unequal-length Spearman-
Brown indices were 55. Guttman Lambada ranged from 44 to 74.
4. 37
TOOLS & METHODOLOGY
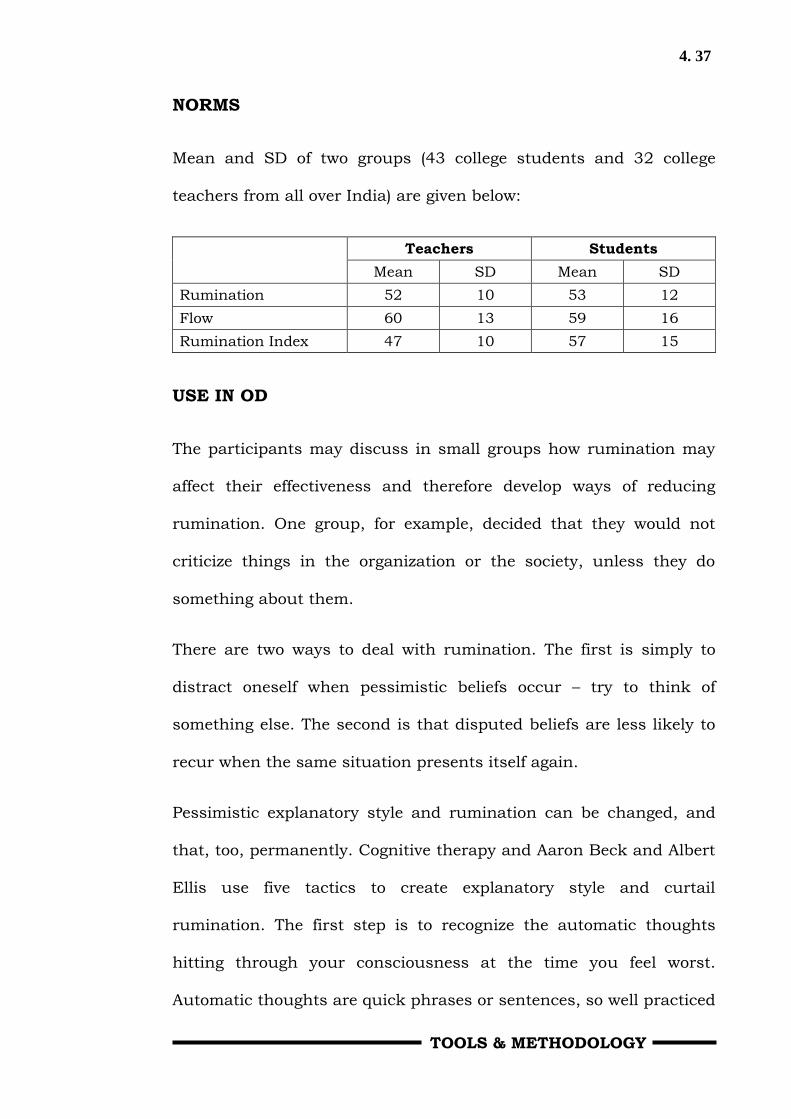
NORMS
Mean and SD of two groups (43 college students and 32 college
teachers from all over India) are given below:
Teachers Students
Mean SD Mean SD
Rumination 52 10 53 12
Flow 60 13 59 16
Rumination Index 47 10 57 15
USE IN OD
The participants may discuss in small groups how rumination may
affect their effectiveness and therefore develop ways of reducing
rumination. One group, for example, decided that they would not
criticize things in the organization or the society, unless they do
something about them.
There are two ways to deal with rumination. The first is simply to
distract oneself when pessimistic beliefs occur – try to think of
something else. The second is that disputed beliefs are less likely to
recur when the same situation presents itself again.
Pessimistic explanatory style and rumination can be changed, and
that, too, permanently. Cognitive therapy and Aaron Beck and Albert
Ellis use five tactics to create explanatory style and curtail
rumination. The first step is to recognize the automatic thoughts
hitting through your consciousness at the time you feel worst.
Automatic thoughts are quick phrases or sentences, so well practiced

4. 38
TOOLS & METHODOLOGY
as to be almost unnoticed and unchallenged, e.g. a mother screams
at her children and later feels depressed about it. She says so herself
that she is a terrible mother. She learns to become aware of these
automatic thoughts and learns that they are her explanations which
are permanent, pervasive and personal.
The second tactic is learning to dispute automatic thoughts by
marshalling contrary evidence. The mother is helped to remember
that when kids return from school, she plays with them, tutors them,
and listens to their problems. She learns to focus on this evidence
and sees that it contradicts her automatic thought that she is a bad
mother.
The third tactic is learning to make different explanations, called
reattribution‟s, and use them to dispute automatic thoughts. The
negative statements are replaced by saying “I‟m fine with the kids in
the evening and terrible in the morning”. This statement is less
permanent and pervasive.
The fourth tactic is learning to distract oneself from depressing
thoughts. The mother learns that thinking these negative things now
is not inevitable. It is better to put off thinking. One can learn to
control not only what he/she thinks but also when to think.
The fifth tactic is learning to recognize and question the depression-
sowing assumptions.
4. 39
TOOLS & METHODOLOGY
4. For Micro Planning Intervention
Organizational Learning Diagnostics:
Organizational learning diagnostics (OLD) has 23 items. Respondents
are required to rate each item on a 5-point scale, for the value and
frequency of its practice in the respondent‟s organization. The more
frequently these mechanisms are used, the stronger is the
organizational learning. These mechanisms are grouped into three
subsystems: acquiring and examining (the innovation phase),
retaining and integrating (the implementation phase), and using
adapting (the stabilization phase). These are subsystems of OL in the
sense that they are present in an organization in varying degrees and
are interrelated with a feedback loop; they are phases in the sense
that for one particular innovation, they appear in sequence. OLD
contains eight, even, and eight mechanisms, respectively for the
three subsystems or phases.
Furthermore, all 23 items can be grouped into five categories of OL
mechanisms: experimentation and flexibility, mutuality and
teamwork, contingency and incremental planning, temporary
systems, and competency building.
OLD should be administered to a fairly large number of managers in
an organization. The total organization, a subdivision (such as a
department), or both, can be rated on OLD. It can be administered in
a group, or individuals can be asked to respond to the instrument.
4. 40
TOOLS & METHODOLOGY
CONCEPTUAL FRAMEWORK
The concept of learning has traditionally been used in the context of
individuals. Recently this concept was extended to organizations,
with a distinction made between organization learning and individual
learning. Organizational Learning is defined as “the process by which
an organization acquires, retains and uses inputs for its
development, and the process results in an enhanced capacity for
continued self – learning and self renewal”.
SCORING
The scoring sheet, given below, is self-explanatory, and is used to
score an individual‟s responses. The 23 items are first grouped in
three columns, representing the three subsystems. Five other
columns, which represent five categories of mechanisms, include the
items that relate to the specific categories. The score for each item is
written on the scoring sheet in the blank adjacent to the item
number. In the first three columns, each item appears only once. In
the other five columns, an item may appear more than once.
The scores in each column are totaled, and each total is written
where indicated. Each total is then multiplied by 25, and the figure is
written in the appropriate blank. Each product is then divided by the
number that is printed beneath it, and the quotient written on the
POLI (Potential for Organizational Learning Index) line. Multiplying
by the fraction will make the scores comparable for all columns, and

4. 41
TOOLS & METHODOLOGY
each column score will range from 0 to 100. This system will allow
the score of all respondents to be averaged with a resulting range of
0 to 100. The higher the score, the higher is the potential of the
organization for learning on that dimension.
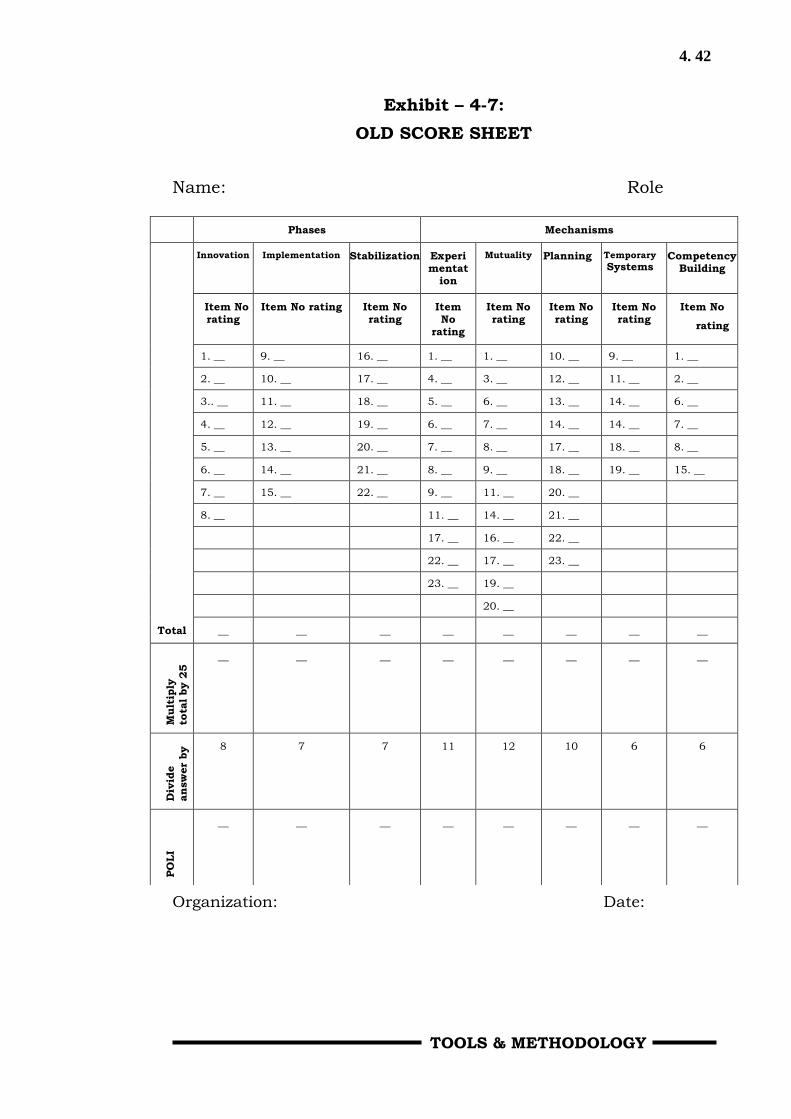
ORGANIZATIONAL-LEARNING DIAGNOSTICS (OLD)
Scoring Sheet
In the appropriate blanks in exhibit 4-7, write the rating given to
the 23 statements. In the first three columns (under phases) each of
the answers will be recorded only once. In the next five columns
(under Mechanisms) the answers will be recorded more than once.
For example, one must record the rating for statement 1 in three on
those columns (Experimentation, Mutuality and Competency
Building)
After completing the blanks, total the numbers the respondent had
entered in each column on the Total line. Then multiply each total by
25 and write the product on the next line. Now divide each of the
products by the number printed beneath it, and write the quotient
beside POLI (Potential for Organizational Learning Index).
4. 42
TOOLS & METHODOLOGY
Exhibit – 4-7:
OLD SCORE SHEET
Name: Role
Organization: Date:
Phases Mechanisms
Total
Innovation Implementation Stabilization Experimentat
ion
Mutuality Planning Temporary Systems
Competency Building
Item No rating
Item No rating Item No rating
Item No
rating
Item No rating
Item No rating
Item No rating
Item No
rating
1. __ 9. __ 16. __ 1. __ 1. __ 10. __ 9. __ 1. __
2. __ 10. __ 17. __ 4. __ 3. __ 12. __ 11. __ 2. __
3.. __ 11. __ 18. __ 5. __ 6. __ 13. __ 14. __ 6. __
4. __ 12. __ 19. __ 6. __ 7. __ 14. __ 14. __ 7. __
5. __ 13. __ 20. __ 7. __ 8. __ 17. __ 18. __ 8. __
6. __ 14. __ 21. __ 8. __ 9. __ 18. __ 19. __ 15. __
7. __ 15. __ 22. __ 9. __ 11. __ 20. __
8. __ 11. __ 14. __ 21. __
17. __ 16. __ 22. __
22. __ 17. __ 23. __
23. __ 19. __
20. __
__ __ __ __ __ __ __ __
Mult
iply
tota
l by 2
5 __ __ __ __ __ __ __ __
Div
ide
an
sw
er
by 8 7 7 11 12 10 6 6
PO
LI
__ __ __ __ __ __ __ __
4. 43
TOOLS & METHODOLOGY
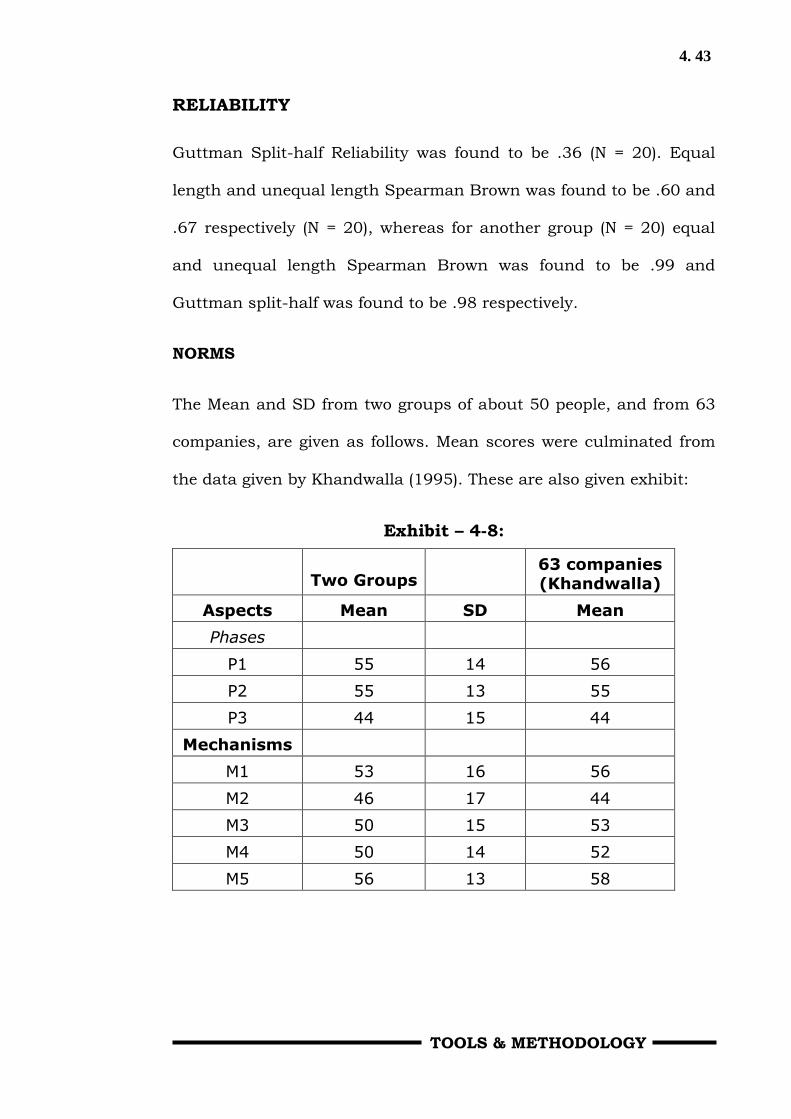
RELIABILITY
Guttman Split-half Reliability was found to be .36 (N = 20). Equal
length and unequal length Spearman Brown was found to be .60 and
.67 respectively (N = 20), whereas for another group (N = 20) equal
and unequal length Spearman Brown was found to be .99 and
Guttman split-half was found to be .98 respectively.
NORMS
The Mean and SD from two groups of about 50 people, and from 63
companies, are given as follows. Mean scores were culminated from
the data given by Khandwalla (1995). These are also given exhibit:
Exhibit – 4-8:
Two Groups 63 companies
(Khandwalla)
Aspects Mean SD Mean
Phases
P1 55 14 56
P2 55 13 55
P3 44 15 44
Mechanisms
M1 53 16 56
M2 46 17 44
M3 50 15 53
M4 50 14 52
M5 56 13 58
4. 44
TOOLS & METHODOLOGY
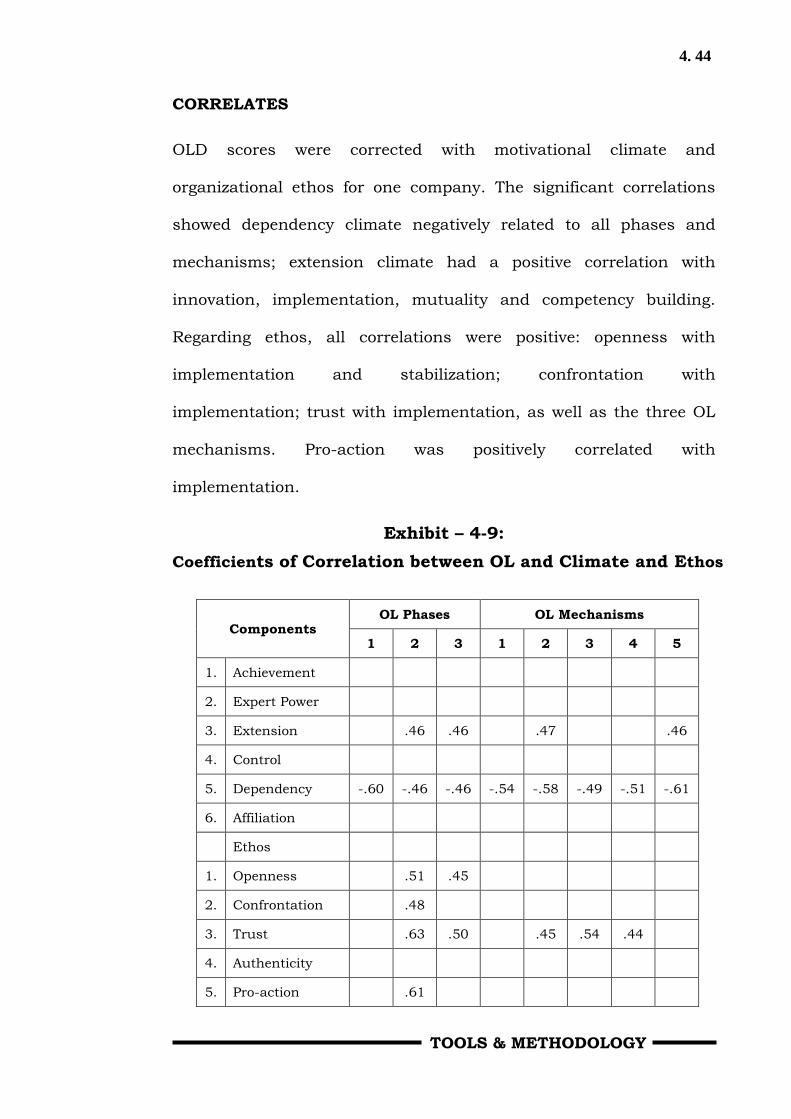
CORRELATES
OLD scores were corrected with motivational climate and
organizational ethos for one company. The significant correlations
showed dependency climate negatively related to all phases and
mechanisms; extension climate had a positive correlation with
innovation, implementation, mutuality and competency building.
Regarding ethos, all correlations were positive: openness with
implementation and stabilization; confrontation with
implementation; trust with implementation, as well as the three OL
mechanisms. Pro-action was positively correlated with
implementation.
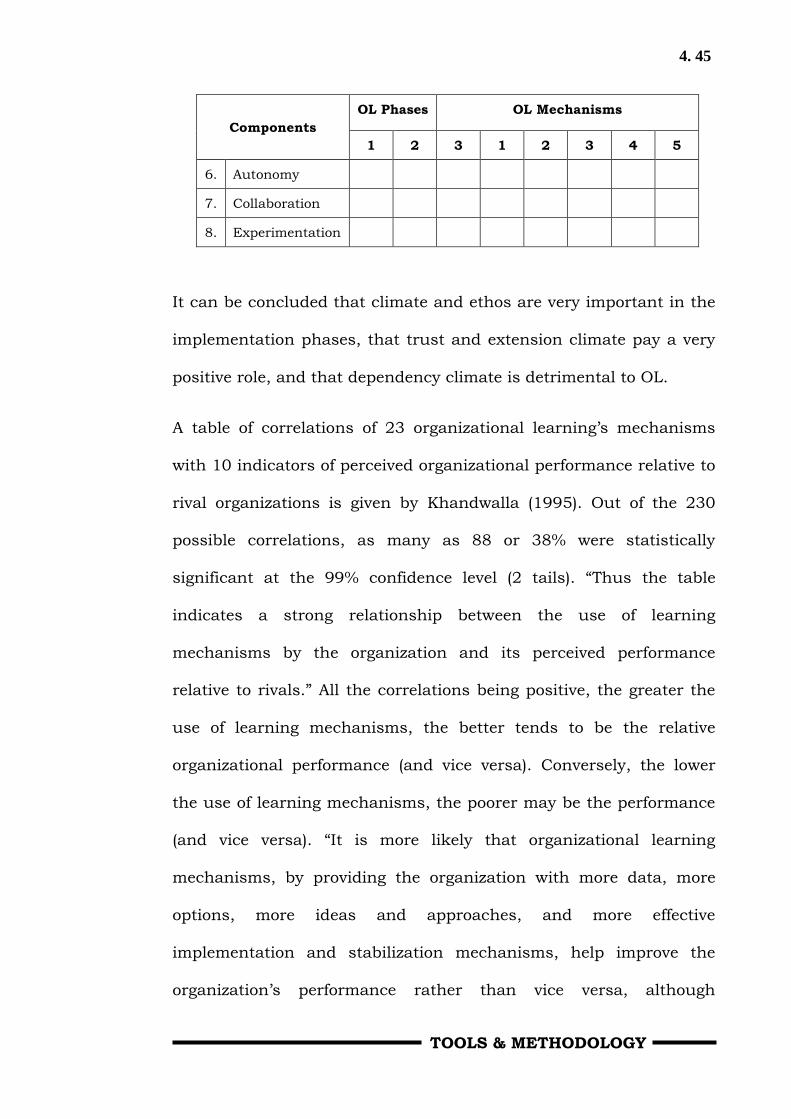
Exhibit – 4-9:
Coefficients of Correlation between OL and Climate and Ethos
Components OL Phases OL Mechanisms
1 2 3 1 2 3 4 5
1. Achievement
2. Expert Power
3. Extension .46 .46 .47 .46
4. Control
5. Dependency -.60 -.46 -.46 -.54 -.58 -.49 -.51 -.61
6. Affiliation
Ethos
1. Openness .51 .45
2. Confrontation .48
3. Trust .63 .50 .45 .54 .44
4. Authenticity
5. Pro-action .61
4. 45
TOOLS & METHODOLOGY
Components
OL Phases OL Mechanisms
1 2 3 1 2 3 4 5
6. Autonomy
7. Collaboration
8. Experimentation
It can be concluded that climate and ethos are very important in the
implementation phases, that trust and extension climate pay a very
positive role, and that dependency climate is detrimental to OL.
A table of correlations of 23 organizational learning‟s mechanisms
with 10 indicators of perceived organizational performance relative to
rival organizations is given by Khandwalla (1995). Out of the 230
possible correlations, as many as 88 or 38% were statistically
significant at the 99% confidence level (2 tails). “Thus the table
indicates a strong relationship between the use of learning
mechanisms by the organization and its perceived performance
relative to rivals.” All the correlations being positive, the greater the
use of learning mechanisms, the better tends to be the relative
organizational performance (and vice versa). Conversely, the lower
the use of learning mechanisms, the poorer may be the performance
(and vice versa). “It is more likely that organizational learning
mechanisms, by providing the organization with more data, more
options, more ideas and approaches, and more effective
implementation and stabilization mechanisms, help improve the
organization‟s performance rather than vice versa, although
4. 46
TOOLS & METHODOLOGY
occasionally it is likely that well-performing organizations may
channel some of their „organizational slack‟ (that is, surplus
resources) into prestigious, image-building organizational learning
mechanisms.” It is also possible that in times of decline,
organizations might cut back on some of these image-building
learning mechanisms. However, studies of turnarounds from
organizational sickness suggest that sickness arises precisely
because of learning failure, and when the use of learning
mechanisms is stepped up, performance rises sharply. The available
evidence therefore does point to a stronger causal arrow from
organization learning mechanisms to organizational performance
than vice versa.”
Organizational performance indicators were highly unevenly sensitive
to the set of learning mechanisms studied. For example, relative
efficiency, profitability, and growth rate rare hardly influenced by
these learning mechanisms. On the other hand, relative
innovativeness, social impact, and stag morale are improved by
practically every learning mechanism. Thus, learning mechanisms,
particularly the ones studied in this chapter, can make a very
significant contribution to making Third World organizations
dynamic, innovative, socially relevant, and exciting to work in”.
“it is also interesting to observe from the table that „business‟
indicators of corporate performance – profitability, growth rate,
financial strength, performance stability, and efficiency – are
4. 47
TOOLS & METHODOLOGY
improved more by learning mechanisms that aid implementation of
initiatives and, to a lesser extent, by learning mechanisms that aid
implementation of initiatives and, to a still lesser extent, by learning
mechanisms that stabilize initiatives, than by learning mechanisms
that aid the generation of new ideas. There were 11 significant
correlations between implementation mechanisms and „business‟
indicators, and only one between innovative ideas generating
mechanisms and „business‟ indicators. Thus, organizations seeking
excellence vis-à-vis „business‟ indicators should institutionalize
especially those learning mechanisms that facilitate implementation
and stabilization of innovations, new projects, or fresh initiatives.
Khandwalla also found correlations between 20 management styles
and the 23 organizational learning items or mechanisms
(Khandwalla, 1995, p. 98-99).
There were in all 127 significant correlations between management
styles and learning mechanisms, about 28% of the 460 possible
correlations. The number suggests a fairly strong overall relationship
between management styles and learning mechanisms. Of these 127
correlations, 87 were positive and only 40 negative. Thus, on the
whole, management styles and learning mechanisms seem to have a
beneficial relationship. The „pure‟ styles accounted for 81 out of the
87 positive correlations and the defective styles accounted for 37 out
of the 40 negative correlations. Thus, pure style promote the use of
learning mechanisms and vice versa, while defective styles avoid

4. 48
TOOLS & METHODOLOGY
learning mechanisms, and/or the use of learning mechanisms
reduce the use of defective styles of management.
There were more positive correlations between the styles and
implementation and stabilization oriented mechanisms (31 and 34
respectively) than with idea generating mechanisms (22), and also
that there were more negative correlations between styles and idea
generating mechanisms than between styles and implementation,
and styles and stabilization-orientation mechanisms (respectively 16,
11 and 13). Thus, management styles tend to be much more effective
in harnessing mechanisms for generating such idea.
The pure altruistic, participative, bureaucratic, and entrepreneurial
styles account for the bulk of the positive correlations with learning
mechanisms, with the pure professional and organic styles also
making significant contribution. “These six styles may, therefore,
quickly instill into the organization learning, adapting and innovating
culture”. …The most powerful brakes on the emergence of a learning
culture may be the defective intuitive, conservative, and
authoritarian styles. Conversely, organizations that refuse to learn
may come to employ these defective styles, to the extent that
management styles reflect of learning mechanisms rather than vice
versa. For, it is always open to the top management to employ
learning mechanisms such as task forces, staff seminars, collective
sharing of experiences, contingency plans, staff training,
encouragement to innovation and experimentation, etc.”
4. 49
TOOLS & METHODOLOGY
The strong relationships of the pure altruistic and bureaucratic
styles with learning mechanisms were intriguing. One interpretation
is that a strong top management commitment to ideals and social
relevance as well as to order and accountability, commonplace in
well-managed public sector corporations, catalyses a learning culture
in the organization, exemplified by the use of numerous learning
mechanisms. Another interpretation is that the use of various
learning mechanisms impels the organization towards commitment
to ideals, social relevance, and accountability. For commercial
organizations (the study sample consisted of enterprises), the search
for social relevance in the Third Word context may well imply
venturing into uncharted terrains in which learning needs are acute.
On the other hand, learning mechanisms yield a rich crop of
information about the operating environment, which in turn may
furnish apex decision-makes, opportunities for commercial ventures
that also contribute to social-economic development, such as
production of import substitutes or critically needed products or
services. Thus, altruism in management and the use of
organizational learning mechanisms may reinforce one another.”
Use in OD
POLI provides a diagnostic insight into the OL processes of an
organization. The scores on the OLD can be used by top management
to diagnose the organization‟s strengths and weakness. The
instrument can also be used for remedial purposes by taking steps to
4. 50
TOOLS & METHODOLOGY
improve the dimensions that are weak. Since each item relates to a
specific mechanism, it may be easy to decide what to do. For
example, if the total mean score on temporary systems is 35,
members of the organization can look at the individual items that
received very low scores to discuss and determine the specific
mechanisms that can be used to raise the score.
If developing on OL system is a direction that an organization has
accepted, it needs to develop action guidelines or policies to facilitate
the process. Focusing on the following concerns has been helpful to
some organizations developing policies.
Policy Guidelines: Enhancing functional autonomy with
accountability: Policies should promote autonomy (within defined
limits) of a subsystem (for example, a department or unit) and
emphasize accountability for the tasks that the subsystem agrees to
undertake without functional autonomy, a system innovative.
Availability of support and resources: Implementing change
requires resources, and accountability is possible when the needed
resources are provided. Providing resources also shows an interest in
employees and the system, and indicates high expectations for them.
Competency building: Organizational policies should promote and
upgrade competencies needed for the objectives of the organization.
Networking: Various subsystems involved in a particular area of
work need to learn from one another, and they can collaborate in
4. 51
TOOLS & METHODOLOGY
many areas. The development of a network of experts, groups, and
organizations enhances learning. Organizational policies need to
promote such networking.
Based on the inter-correlation matrix of 23 items of OLD on
responses from 63 organizations, Khandwalla (1995) suggested that
the number of significant correlations of the item with its power can
be used as a learning mechanism to catalyse other learning
mechanisms.
It shows, for example, that attending external training programs and
conferences by the staff (item 2), although important from the point
of view of human resource development, does not possess much
power of catalyzing other organizational learning mechanisms. On
the other hand, several mechanisms have relatively high catalytic
power: task forces specifically set-up to evaluate innovations
empirically rather than just qualitatively (item 16); taking the trouble
to conceptualize alternative ways of implementing changes (item 23);
using skilled staff to implement changes (that is, using staff with
demonstrated competence in successful implementation of new
initiatives) (item 15); holding staff seminars on new developments in
fields related to the activities of the organization (item 8); task forces
set up specifically for implementing and evaluating new projects and
innovation (item 9 and 18); and, preparation of alternative plans for
implementing changes and innovation depending on contingencies
that may arise (such as fast growth of industry versus a slower

4. 52
TOOLS & METHODOLOGY
growth) (item 10). In the Third World context, these need to be used
extensively by organizations seeking to improve their performance
through effective learning. The data suggest that organizations that:
(1) take the trouble to invest the time of competent change agents in
specific learning related activities (such as task forces setup with the
mandate of evaluating or implementing new projects); (2) make
conscious attempts to evolve alternatives and take into consideration
alternative scenarios; and (3) ensure information sharing with the
rank-and-file, may quickly institutionalize a culture of learning and
innovating. Those organizations, may therefore fail to adapt
effectively to environmental changes, increase in competitive
pressures, or greater environmental complexity.” His analysis also
indicated that “mechanisms which aid implementation and
stabilization of new initiatives and innovations are more likely to
catalyze an organizational learning culture. The average number of
times an innovation stabilization mechanism was a main correlate of
other learning mechanisms was 3.9. This figure was 2.7 for the
learning mechanisms that aid implementation of new initiatives and
was only 2.0 for the learning mechanisms that did the generation of
innovative ideas. Thus, an organization that focuses sharply on
stabilizing and implementing new ideas tend to develop a sturdier
learning culture than those that just flirt with new ideas.” These are
HRD implications.
4. 53
TOOLS & METHODOLOGY
Khandwalla (1995) concludes (p. 101-102) “From a practical point of
view, those learning mechanisms are especially valuable that
catalyze other learning mechanisms and simultaneously improve
organizational performance along a number of indicators. A
concentration on institutionalizing the three learning mechanisms
task forces to evaluate innovation empirically, use of skilled staff for
implementing changes, and staff seminars on new developments may
not only rapidly bring to the organization a culture of learning
innovation, and adaptation, it may also rapidly improve the overall
performance of the organization along several indicators. Styles of
management that institutionalize these three learning mechanisms
are especially useful, while the ones that hinder their adoption are
worth avoiding.”
RESEARCH PROCEDURE
After the finalization of the research topic, the related literature was
reviewed, the hypothesis were formulated, the tools and samples
were decided, and finally the actual procedure of data collection was
started.
To collect data the investigator approached Bhilai Steel Plant
authorities and got the permission for undertaking the study of four
OD Interventions in the Bhilai Steel Plant.
4. 54
TOOLS & METHODOLOGY
The investigator requested the Departmental heads of various
departments to help in administering the test on the employees (pre
& post).
The employees were given a set of questionnaires in small groups (3
to 5 employees), during their lunch, tea time or after their working
hours. The total sample tested was 350 pre & 350 post. Once the pre
and post evaluation questionnaires were collected then the scoring
was done according to the instructions given. The responses of all
the 350 employees were collected and the statistical treatment of the
scores was done according to the methods stated earlier.