3the practice architecture · arundel west sussex bn18 0de united kingdom ... figure has been...
TRANSCRIPT

Architect: Dietmar Feichtinger ArchitectesProject: Groupe scolaire Lucie AubracPlace: Nanterre - France
Architecture -the Practice3

Mirza & Nacey Reserach LtdSouthdown HouseFord Lane, FordArundelWest SussexBN18 0DEUnited Kingdom
Telephone: +44 1243 555302email: [email protected]
MIRZA & NACEY RESEARCH
Registered office: Southdown House, Ford Lane, Ford, Arundel, West Sussex BN18 0DE. Registered in England and Wales. Company No. 04618115
CHART 3-2Average size of architectural practices
3.1 Profile of Architectural Practices The number of private architectural practices in EUROPE-26 is estimated to be 163 000. This figure has been estimated by creating a model and then inserting data from the survey. The model is described in Appendix I. Grossing-up this figure to reflect all 31 European countries produces an estimate of 169 000 private architectural practices in Europe, 6 per cent higher than the 2012 estimate of 160 000 practices*.
The majority of private practices are one person practices. The 2014 estimate is that 74 per cent of all practices comprise one person, this is higher than in previous surveys and is likely to be a result of the recession. There are now
* Methodological Note: The base ‘EUROPE-31’ is different from the base used for the 2012 survey. Previously ‘EUROPE-33’ included FYROM, Bosnia and Poland. Serbia has been included from 2014. The 2012 figure has been re-calculated using the 2014 base number of countries, so the 2012 estimate of 160 000 practices is directly comparable with the 2014 figure, but is different from estimates published in previous survey reports.
0
50
100
150
200
2014201220102008
tota
l num
ber o
f arc
hite
ctur
al p
ract
ices
, 000
s
estimated to be fewer medium sized practices in Europe, again most probably due to the economic crisis.
The information in this section is based on the questionnaires completed by Principals. These include Sole Principals, Freelancers, and Partners & Directors in Private Practice.
CHART 3-1Change in estimated number of practices in EUROPE-31, 2008-14
3 - 32The Architectural Profession in Europe 2014

Mirza & Nacey Reserach LtdSouthdown HouseFord Lane, FordArundelWest SussexBN18 0DEUnited Kingdom
Telephone: +44 1243 555302email: [email protected]
MIRZA & NACEY RESEARCH
Registered office: Southdown House, Ford Lane, Ford, Arundel, West Sussex BN18 0DE. Registered in England and Wales. Company No. 04618115
TABLE 3-1Estimated number and size of architectural practices
per cent architects employed0 10 20 30 40 50
over 50 staff
31 to 50 staff
11 to 30 staff
6 to 10 staff
3 to 5 staff
2 staff
1 staff
per cent architectural practices0 10 20 30 40 50 60 70 80
over 50 staff
31 to 50 staff
11 to 30 staff
6 to 10 staff
3 to 5 staff
2 staff
1 staff
size of architectural practice (number of architectural staff) TOTALnumber (estimate)
1 staff 2 staff 3 to 5 staff 6 to 10 staff 11 to 30 staff
31 to 50 staff
over 50 staff
Austria 1 072 393 299 62 15 1 0 1 842 Belgium 2 620 558 396 79 22 2 1 3 677 Bulgaria* 623 129 165 23 21 0 0 962 Croatia 393 214 151 17 4 0 0 778 Czech Republic* 1 438 448 146 75 31 0 0 2 138 Denmark 1 208 278 177 38 48 8 2 1 759 Estonia* 79 123 13 33 3 0 0 252 Finland 481 87 95 41 12 2 0 717 France 5 894 1 351 883 152 20 1 0 8 302 Germany 29 824 6 436 3 633 858 347 16 2 41 117 Greece 4 418 703 416 95 29 0 0 5 661 Ireland 513 144 72 18 4 0 0 752 Italy 47 659 4 623 3 662 292 42 5 1 56 284 Latvia* 157 16 54 18 0 0 0 245 Luxembourg 129 42 54 15 5 1 0 244 Malta* 57 36 29 7 1 0 0 130 Netherlands* 2 116 1 100 429 68 0 0 0 3 714 Portugal 2 971 760 586 133 11 2 0 4 462 Romania 1 257 324 354 92 10 0 0 2 037 Slovakia 339 71 65 11 1 0 0 487 Slovenia* 435 63 68 11 0 0 0 578 Spain 5 598 1 184 840 96 23 0 1 7 742 Sweden 1 041 143 209 78 28 2 3 1 504 Switzerland 712 377 388 102 41 7 1 1 629 Turkey 5 328 1 484 1 816 364 215 18 5 9 231 United Kingdom 3 879 1 332 1 064 372 137 36 13 6 835 2014 EUR-26 120 242 22 423 16 066 3 151 1 069 100 30 163 078per cent of practices 74 14 10 2 1 <1 <1 100
2012 EUR-25 98 193 28 134 22 663 5 247 1 305 151 35 155 725 2010 EUR-23 86 049 19 477 18 963 5 814 1 973 279 83 132 643 2008 EUR-17 37 369 13 489 10 868 5 318 2 014 449 344 69 851
CHART 3-3Practices analysed by size
CHART 3-4Proportion of architects employed in practices of different sizes
‘architectural staff’ includes principals, partners & directors; associates; salaried architects; technical staff* caution - small sample Netherlands: BNA Benchmark Research 2014
3 - 33The Architectural Profession in Europe 2014

Mirza & Nacey Reserach LtdSouthdown HouseFord Lane, FordArundelWest SussexBN18 0DEUnited Kingdom
Telephone: +44 1243 555302email: [email protected]
MIRZA & NACEY RESEARCH
Registered office: Southdown House, Ford Lane, Ford, Arundel, West Sussex BN18 0DE. Registered in England and Wales. Company No. 04618115
CHART 3-5Proportion of architectural practices that are limited companies / PLCs / corporations
The legal formation of architectural practices remains very similar to that reported in the last survey. Almost two out of three practices (65 per cent) consider themselves to be ‘independent architects’. Nearly all practices (90 per cent or more) in Greece and Italy are formed by an ‘independent architect’; while in Germany, Malta and Spain the proportion is around 70 per cent.
The next most common form of practice is the limited company; 21 per cent of practices have this business formation. At least half of practices in Sweden, Croatia, Turkey, Romania and the United Kingdom are limited companies. Nine per cent of practices are partnerships, and 4 per cent are PLCs or corporations (over 40 per cent in Finland and Switzerland).
Taken together, the proportion of practices which are limited companies, PLCs or corporations is highest in Sweden, Finland, Switzerland and Turkey, while the proportion of practices which are independent architects is highest in Greece, Italy, Portugal and Spain.
3.2 Legal Formation of Practices
3 - 34The Architectural Profession in Europe 2014

Mirza & Nacey Reserach LtdSouthdown HouseFord Lane, FordArundelWest SussexBN18 0DEUnited Kingdom
Telephone: +44 1243 555302email: [email protected]
MIRZA & NACEY RESEARCH
Registered office: Southdown House, Ford Lane, Ford, Arundel, West Sussex BN18 0DE. Registered in England and Wales. Company No. 04618115
TABLE 3-2Legal formation of architectural practices - based on type of practice in which Principals work
per cent independent architect partnership limited company
PLC (public limited
company) / corporation
economic interest group
Austria 64 6 27 2 0Belgium 48 9 39 4 0Bulgaria* 26 15 44 6 9Croatia 17 10 72 0 0Czech Republic* 17 33 33 0 17Denmark 39 35 15 11 0Estonia* 43 36 14 7 0Finland 32 4 4 59 2France 51 2 44 3 0Germany 73 16 11 0 0Greece 91 5 2 2 0Ireland 54 6 39 1 0Italy 90 8 2 0 1Latvia* 19 13 69 0 0Luxembourg 40 1 47 12 0Malta* 75 17 8 0 0Netherlands* 60 20 20 0 0Portugal 66 3 28 3 0Romania 45 2 51 1 0Slovakia 33 19 46 1 1Slovenia* 63 20 13 3 0Spain 70 5 16 2 6Sweden 22 3 72 2 1Switzerland 29 2 27 42 0Turkey 34 6 51 9 0United Kingdom 32 10 50 8 02014 EUROPE-26 65 9 21 4 12012 EUROPE-25 67 9 21 2 12010 EUROPE-23 51 10 31 5 22008 EUROPE-17 52 18 22 4 3
CHART 3-6Type of architectural businesses
Economic Interest Grouping
Public Limited Company/Corporation
Limited Liability Company
Partnership
Independent Architect
* caution - small sample Netherlands: BNA Benchmark Research 2014
3 - 35The Architectural Profession in Europe 2014
Mirza & Nacey Reserach LtdSouthdown HouseFord Lane, FordArundelWest SussexBN18 0DEUnited Kingdom
Telephone: +44 1243 555302email: [email protected]
MIRZA & NACEY RESEARCH
Registered office: Southdown House, Ford Lane, Ford, Arundel, West Sussex BN18 0DE. Registered in England and Wales. Company No. 04618115
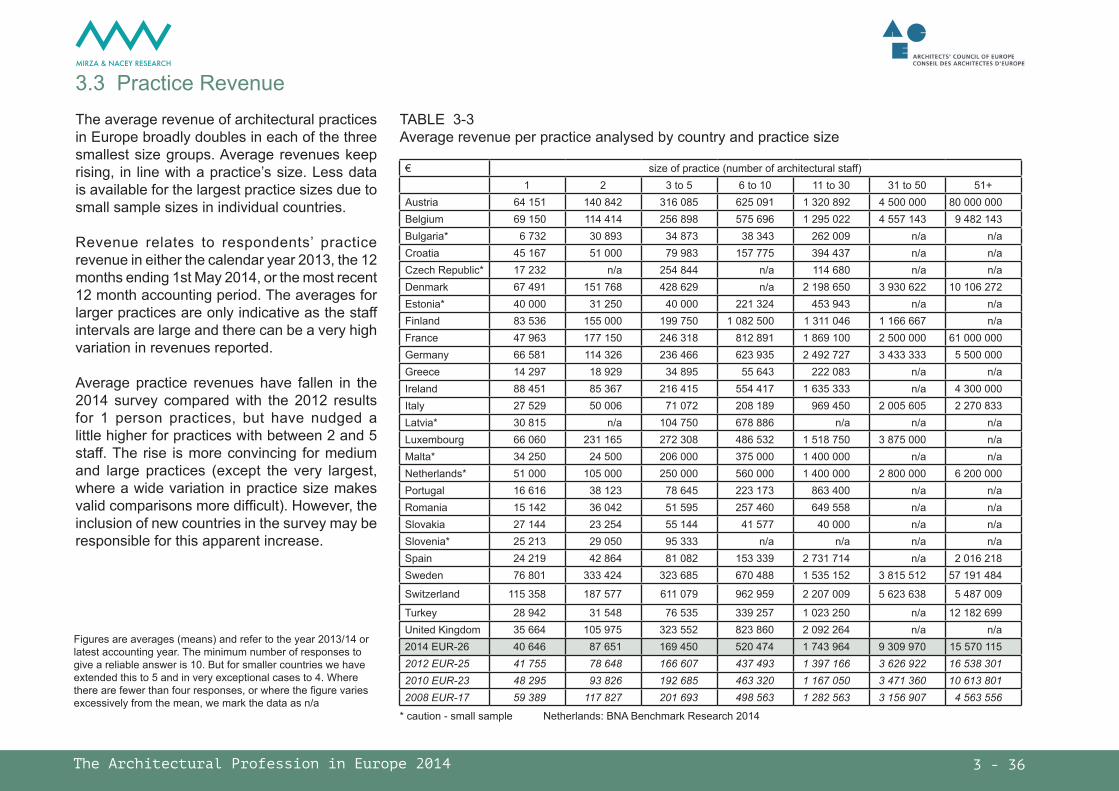
3.3 Practice RevenueTABLE 3-3Average revenue per practice analysed by country and practice size
€ size of practice (number of architectural staff)1 2 3 to 5 6 to 10 11 to 30 31 to 50 51+
Austria 64 151 140 842 316 085 625 091 1 320 892 4 500 000 80 000 000Belgium 69 150 114 414 256 898 575 696 1 295 022 4 557 143 9 482 143Bulgaria* 6 732 30 893 34 873 38 343 262 009 n/a n/aCroatia 45 167 51 000 79 983 157 775 394 437 n/a n/aCzech Republic* 17 232 n/a 254 844 n/a 114 680 n/a n/aDenmark 67 491 151 768 428 629 n/a 2 198 650 3 930 622 10 106 272Estonia* 40 000 31 250 40 000 221 324 453 943 n/a n/aFinland 83 536 155 000 199 750 1 082 500 1 311 046 1 166 667 n/aFrance 47 963 177 150 246 318 812 891 1 869 100 2 500 000 61 000 000Germany 66 581 114 326 236 466 623 935 2 492 727 3 433 333 5 500 000Greece 14 297 18 929 34 895 55 643 222 083 n/a n/aIreland 88 451 85 367 216 415 554 417 1 635 333 n/a 4 300 000Italy 27 529 50 006 71 072 208 189 969 450 2 005 605 2 270 833Latvia* 30 815 n/a 104 750 678 886 n/a n/a n/aLuxembourg 66 060 231 165 272 308 486 532 1 518 750 3 875 000 n/aMalta* 34 250 24 500 206 000 375 000 1 400 000 n/a n/aNetherlands* 51 000 105 000 250 000 560 000 1 400 000 2 800 000 6 200 000Portugal 16 616 38 123 78 645 223 173 863 400 n/a n/aRomania 15 142 36 042 51 595 257 460 649 558 n/a n/aSlovakia 27 144 23 254 55 144 41 577 40 000 n/a n/aSlovenia* 25 213 29 050 95 333 n/a n/a n/a n/aSpain 24 219 42 864 81 082 153 339 2 731 714 n/a 2 016 218Sweden 76 801 333 424 323 685 670 488 1 535 152 3 815 512 57 191 484
Switzerland 115 358 187 577 611 079 962 959 2 207 009 5 623 638 5 487 009
Turkey 28 942 31 548 76 535 339 257 1 023 250 n/a 12 182 699United Kingdom 35 664 105 975 323 552 823 860 2 092 264 n/a n/a2014 EUR-26 40 646 87 651 169 450 520 474 1 743 964 9 309 970 15 570 1152012 EUR-25 41 755 78 648 166 607 437 493 1 397 166 3 626 922 16 538 3012010 EUR-23 48 295 93 826 192 685 463 320 1 167 050 3 471 360 10 613 8012008 EUR-17 59 389 117 827 201 693 498 563 1 282 563 3 156 907 4 563 556
Figures are averages (means) and refer to the year 2013/14 or latest accounting year. The minimum number of responses to give a reliable answer is 10. But for smaller countries we have extended this to 5 and in very exceptional cases to 4. Where there are fewer than four responses, or where the figure varies excessively from the mean, we mark the data as n/a
The average revenue of architectural practices in Europe broadly doubles in each of the three smallest size groups. Average revenues keep rising, in line with a practice’s size. Less data is available for the largest practice sizes due to small sample sizes in individual countries.
Revenue relates to respondents’ practice revenue in either the calendar year 2013, the 12 months ending 1st May 2014, or the most recent 12 month accounting period. The averages for larger practices are only indicative as the staff intervals are large and there can be a very high variation in revenues reported.
Average practice revenues have fallen in the 2014 survey compared with the 2012 results for 1 person practices, but have nudged a little higher for practices with between 2 and 5 staff. The rise is more convincing for medium and large practices (except the very largest, where a wide variation in practice size makes valid comparisons more difficult). However, the inclusion of new countries in the survey may be responsible for this apparent increase.
* caution - small sample Netherlands: BNA Benchmark Research 2014
3 - 36The Architectural Profession in Europe 2014

Mirza & Nacey Reserach LtdSouthdown HouseFord Lane, FordArundelWest SussexBN18 0DEUnited Kingdom
Telephone: +44 1243 555302email: [email protected]
MIRZA & NACEY RESEARCH
Registered office: Southdown House, Ford Lane, Ford, Arundel, West Sussex BN18 0DE. Registered in England and Wales. Company No. 04618115
per cent current jobs method of calculating charge
per cent of contract value lump sum hourly charge no charge agreed (effectively “at risk”)
Austria 50 27 22 2Belgium 56 23 18 2Bulgaria* 21 47 20 12Croatia 46 36 9 10Czech Republic* 44 34 19 2Denmark 38 31 25 6Estonia* 37 44 14 6Finland 9 48 40 3France 75 13 9 4Germany 61 13 23 3Greece 27 54 7 12Ireland 32 50 13 5Italy 40 43 6 11Latvia* 38 46 12 4Luxembourg 69 15 12 3Malta* 53 22 13 12Netherlands* 6 68 25 2Portugal 45 28 12 15Romania 52 32 8 7Slovakia 39 43 13 4Slovenia* 46 33 10 11Spain 53 30 7 11Sweden 4 34 59 4Switzerland 59 21 20 1Turkey 46 36 6 12United Kingdom 31 45 21 22014 EUROPE-26 47 32 14 72012 EUROPE-25 43 36 12 92010 EUROPE-23 49 29 18 52008 EUROPE-17 56 23 16 6
TABLE 3-4How charges are calculated
Approaching half (47 per cent) of respondents’ current jobs are charged on the basis of a percentage of the contract value. This remains the most common method of calculating charges. Just under one third, 32 per cent, of current jobs are charged as a ‘lump sum’. In the case of 14 per cent of jobs, the charge is based on an hourly rate while 7 per cent of jobs are run at risk, with no charge agreed. These results are very similar to the results recorded in the 2012 and 2010 surveys.
France emerges as using the per cent of contract value method the most (75 per cent of jobs charged that way). Sweden (4 per cent) and Finland (9 per cent) stand out as being the only countries to have very low use of the per cent of contract value method of charging - here, hourly charge and lump sum is the more common method.
Countries with the highest proportion of jobs for which no charge has been agreed include Portugal, Greece, and Turkey.
3.4 How Practices Charge for their Services
* caution - small sample Netherlands: BNA Benchmark Research 2014
3 - 37The Architectural Profession in Europe 2014

Mirza & Nacey Reserach LtdSouthdown HouseFord Lane, FordArundelWest SussexBN18 0DEUnited Kingdom
Telephone: +44 1243 555302email: [email protected]
MIRZA & NACEY RESEARCH
Registered office: Southdown House, Ford Lane, Ford, Arundel, West Sussex BN18 0DE. Registered in England and Wales. Company No. 04618115
3.5 Hourly charge-out rates
Data is expressed in Euros but each country’s figure has been adjusted using an index of Purchasing Power Parity (PPP). This index takes account of price level differences across countries. We have used an index sourced from Eurostat, whose Comparative Price Level Indices assess the price level of each country in the comparison of European countries. Each country’s average hourly rates figure is divided by one hundredth of the country’s index value to create the PPP adjusted figure.
€ average (median) hourly charge-out rates ADJUSTED to take account of Purchasing Power Parities (PPP), Euros
principals architects technologistsAustria 84 75 58Belgium 59 55 46Bulgaria* 42 34 29Croatia 43 35 19Czech Republic* n/a n/a n/aDenmark 86 77 62Estonia* 50 44 n/aFinland 69 63 46France 82 69 46Germany 74 64 49Greece 17 11 9Ireland 64 53 42Italy 39 36 29Latvia* 39 40 13Luxembourg 89 70 49Malta* 65 47 38Netherlands* 70 63 48Portugal 35 29 17Romania 16 11 6Slovakia 25 21 14Slovenia* 42 19 30Spain 42 38 18Sweden 77 68 60Switzerland 74 68 55Turkey 23 13 6United Kingdom 81 75 542014 EUROPE-26 64 53 432012 EUROPE-25 54 44 292010 EUROPE-23 66 56 432008 EUROPE-17 62 50 39
Average hourly rates refer to the average charged to clients for an hour of the architect’s work, before tax. The survey results show that average rates have increased since the 2012 survey, from an average across Europe of €54 per hour for a Principal, to €64 per hour. This is a 19 per cent increase, and the data shows increases in rates charged for architects and technologists, too. Now, average rates for an Architect have increased from €44 to €53 (PPP) while for Technologists the rise has been greatest, from an average of €29 in 2012 to €54 in 2014. This year’s rises go most of the way towards correcting the falls in average hourly rates which were recorded in previous surveys.
In this table, the data has been adjusted to take account of different price levels between the countries, using a Purchasing Power Parity (PPP) index. But even adjusting the data reveals an eight-fold difference between the average rate for Principals in the country with the highest rate and that with the lowest.
The PPP hourly charge-out rates (table 3-5) are highest for Principals in Luxembourg, Denmark, Austria and United Kingdom. Lowest hourly rates are recorded in Romania. The pattern is very similar for architects and for technical staff. The unadjusted, ‘as reported’, figures are presented in table 3-6.
TABLE 3-5Average hourly charge-out rates ADJUSTED to take account of Purchasing Power Parity (PPP)
* caution - small sample Netherlands: BNA Benchmark Research 2014
3 - 38The Architectural Profession in Europe 2014

Mirza & Nacey Reserach LtdSouthdown HouseFord Lane, FordArundelWest SussexBN18 0DEUnited Kingdom
Telephone: +44 1243 555302email: [email protected]
MIRZA & NACEY RESEARCH
Registered office: Southdown House, Ford Lane, Ford, Arundel, West Sussex BN18 0DE. Registered in England and Wales. Company No. 04618115
€ average (median) hourly charge-out rates, Eurosprincipals architects technologists
Austria 90 80 63Belgium 65 60 50Bulgaria* 20 17 14Croatia 30 24 13Czech Republic* n/a n/a n/aDenmark 121 107 87Estonia* 40 35 26Finland 85 75 57France 87 75 50Germany 75 65 50Greece 15 10 8Ireland 75 63 50Italy 40 37 30Latvia* 28 29 9Luxembourg 110 86 60Malta* 52 35 28Netherlands* 96 84 63Portugal 30 25 15Romania 9 6 3Slovakia 18 15 10Slovenia* 35 16 25Spain 40 36 17Sweden 100 89 78Switzerland 115 107 86Turkey 17 8 4United Kingdom 97 85 612014 EUROPE-26 67 55 452012 EUROPE-25 55 43 302010 EUROPE-23 75 63 502008 EUROPE-17 63 50 40
CHART 3-7Average hourly charge-out rates for Principals, adjusted for Purchasing Power Parity (PPP)
TABLE 3-6Average hourly charge-out rates, unadjusted
average rate € adjusted for PPP0 20 40 60 80 100
Czech Republic
Romania
Greece
Turkey
Slovakia
Portugal
Latvia
Italy
Slovenia
Spain
Bulgaria
Croatia
Estonia
Belgium
Ireland
Malta
Finland
Switzerland
Germany
Sweden
United Kingdom
France
Austria
Denmark
Luxembourg
Netherlands
n/a
* caution - small sample Netherlands: BNA Benchmark Research 2014
3 - 39The Architectural Profession in Europe 2014

Mirza & Nacey Reserach LtdSouthdown HouseFord Lane, FordArundelWest SussexBN18 0DEUnited Kingdom
Telephone: +44 1243 555302email: [email protected]
MIRZA & NACEY RESEARCH
Registered office: Southdown House, Ford Lane, Ford, Arundel, West Sussex BN18 0DE. Registered in England and Wales. Company No. 04618115
3.6 Practice ProfitsProfits are expressed here as a percentage of revenue. In a one-person practice, profits account for 60 per cent of revenue. This falls in line with practice size, so a practice of 3 to 5 staff records an average profit of 44 per cent, falling further to 22 per cent in the largest practices.
There may be variations in the definition of ‘profits’ so inter-country comparisons should be considered with caution.
Profits as a percentage of revenue appear to have increased in all but one of the practice sizes analysed, compared with the last survey in 2012. And in 2012 average profits as a percent of revenue had increased since the previous survey - so the trend is clearly up.
CHART 3-8Practice profits analysed by practice size
TABLE 3-7Average pre-tax profits as a percentage of total revenue, analysed by country and practice size
per cent size of architectural practice (number of architectural staff)1 staff 2 staff 3 to 5 staff 6 to 10 staff 11 to 30 staff 31 to 50 staff over 50 staff
Austria 48 52 28 17 26 n/a n/aBelgium 51 37 32 21 16 13 18Bulgaria* 62 39 50 35 38 n/a n/aCroatia 33 n/a 16 n/a n/a n/a n/aCzech Republic* n/a n/a n/a n/a n/a n/a n/aDenmark 70 64 15 n/a 15 7 27Estonia* n/a n/a n/a 24 n/a n/a n/aFinland 39 32 21 19 14 11 n/aFrance 43 21 27 14 12 20 n/aGermany 59 54 38 30 18 29 n/aGreece 56 45 46 n/a n/a n/a n/aIreland 56 52 24 n/a n/a n/a n/aItaly 65 60 59 55 49 62 74Latvia* n/a n/a n/a n/a n/a n/a n/aLuxembourg 58 51 27 9 n/a n/a n/aMalta* 66 81 50 n/a n/a n/a n/aNetherlands* 25 15 12 11 5 11 11Portugal 60 52 39 26 42 n/a n/aRomania 53 48 35 38 15 n/a n/aSlovakia 42 37 36 43 0 n/a n/aSlovenia* 37 n/a n/a n/a n/a n/a n/aSpain 53 49 49 46 57 n/a n/aSweden 48 27 19 10 9 11 n/aSwitzerland 49 27 20 8 13 11 8Turkey 54 66 38 38 30 40 n/aUnited Kingdom 65 48 30 20 25 24 202014 EUR-26 60 49 44 29 22 24 222012 EUR-25 56 44 39 29 23 18 192010 EUR-23 45 34 29 22 20 13 152008 EUR17 52 44 40 31 26 17 26
profits as per cent practice revenue0 10 20 30 40 50 60 70 80
over 50 staff
31 to 50 staff
11 to 30 staff
6 to 10 staff
3 to 5 staff
2 staff
1 staff
* caution - small sample Netherlands: BNA Benchmark Research 2014
3 - 40The Architectural Profession in Europe 2014

Mirza & Nacey Reserach LtdSouthdown HouseFord Lane, FordArundelWest SussexBN18 0DEUnited Kingdom
Telephone: +44 1243 555302email: [email protected]
MIRZA & NACEY RESEARCH
Registered office: Southdown House, Ford Lane, Ford, Arundel, West Sussex BN18 0DE. Registered in England and Wales. Company No. 04618115
TABLE 3-8Proportion of practice revenue derived from outside the country, analysed by country
per cent turnover derived from outside the country
revenue from rest of Europe revenue from outside Europe TOTAL
Austria 8.3 1.2 9.5Belgium 4.6 1.1 5.7Bulgaria* 0.4 0.8 1.2Croatia 2.6 9.4 12.0Czech Republic* n/a n/a 3.9Denmark 7.3 4.0 11.3Estonia* 8.4 1.3 9.6Finland 2.5 2.5 4.9France 1.5 0.6 2.1Germany 9.1 1.1 10.2Greece 9.5 4.2 13.7Ireland 6.8 0.9 7.7Italy 2.3 2.0 4.2Latvia* 1.6 4.0 5.6Luxembourg 11.5 0.1 11.6Malta* 0.0 0.0 0.0Netherlands* 3.0 1.0 4.0Portugal 6.7 12.6 19.2Romania 2.5 3.2 5.8Slovakia 4.8 0.9 5.7Slovenia* 13.7 5.3 19.0Spain 3.8 4.9 8.7Sweden 2.6 1.3 3.9Switzerland 3.6 2.3 5.9Turkey 9.1 16.7 25.9United Kingdom 3.9 5.4 9.32014 EUROPE-26 3.7 2.7 6.42012 EUROPE-25 n/a n/a 5.62010 EUROPE-23 n/a n/a 7.72008 EUROPE-17 n/a n/a 6.0
About 6 per cent of practice revenues are generated from work undertaken outside the country in which the architectural practice is based. This proportion is estimated to be highest in Turkey (26 per cent) and also high in Slovenia, Portugal and Greece (between 14 and 19 per cent). The proportion of revenue earned from outside the practice’s country is similar to that recorded in previous surveys.
New for this year, we have asked respondents to distinguish between Europe and the rest of the world. About 58 per cent of revenue from outside the practice’s own country comes from work in another European country, while about 42 per cent comes from outside Europe. The highest proportion of total practice revenue derived from outside Europe is recorded by architects in Turkey and Portugal - over 10 per cent of total revenue in both countries.
rest of Worldrest of Europe
domestic work
work from outside own country
3.7 Revenue from outside own country
CHART 3-9Source of revenue
data is based on incomplete responses to this question and should be considered with caution * caution - small sample Netherlands: BNA Benchmark Research 2014
3 - 41The Architectural Profession in Europe 2014

Mirza & Nacey Reserach LtdSouthdown HouseFord Lane, FordArundelWest SussexBN18 0DEUnited Kingdom
Telephone: +44 1243 555302email: [email protected]
MIRZA & NACEY RESEARCH
Registered office: Southdown House, Ford Lane, Ford, Arundel, West Sussex BN18 0DE. Registered in England and Wales. Company No. 04618115
3.8 Associations
per cent no formal association
have a formal association
with architect / practice in same country
with architect / practice in another country both
Austria 87 11 1 1Belgium 86 11 1 2Bulgaria* 71 24 0 5Croatia 50 37 0 13Czech Republic* n/a n/a n/a n/aDenmark 70 21 6 3Estonia* 85 15 0 0Finland 44 43 10 3France 89 11 0 0Germany 90 8 1 1Greece 67 28 1 3Ireland 83 9 7 1Italy 77 21 1 1Latvia* 63 38 0 0Luxembourg 88 6 5 1Malta* 83 8 8 0Netherlands* 83 14 2 1Portugal 89 8 1 1Romania 79 16 4 1Slovakia 88 12 0 1Slovenia* 59 38 3 0Spain 93 5 2 0Sweden 83 15 2 0Switzerland 81 15 1 3Turkey 89 8 2 1United Kingdom 87 9 4 12014 EUROPE-26 84 14 2 12012 EUROPE-25 79 18 2 12010 EUROPE-23 82 15 2 22008 EUROPE-17 85 12 3 n/a
TABLE 3-9Proportion of practices who have a formal association with another practice
CHART 3-10 Proportion of practices who have a formal association with another practice
per cent practices0 20 40 60 80 100
both same & otherother countrysame country
Czech Republic
Spain
Portugal
Germany
Turkey
France
Luxembourg
Slovakia
Austria
United Kingdom
Belgium
Estonia
Malta
Sweden
Ireland
Netherlands
Switzerland
Romania
Italy
Bulgaria
Denmark
Greece
Latvia
Slovenia
Croatia
Finland
n/a
* caution - small sample Netherlands: BNA Benchmark Research 2014
3 - 42The Architectural Profession in Europe 2014

Mirza & Nacey Reserach LtdSouthdown HouseFord Lane, FordArundelWest SussexBN18 0DEUnited Kingdom
Telephone: +44 1243 555302email: [email protected]
MIRZA & NACEY RESEARCH
Registered office: Southdown House, Ford Lane, Ford, Arundel, West Sussex BN18 0DE. Registered in England and Wales. Company No. 04618115
3.9 Branch Offices
per cent work in branch office head office is located in...
same country as where branch office is located
same country as where architect is registered
Austria 4 93 96Belgium 5 95 95Bulgaria* 1 93 96Croatia 7 89 89Czech Republic* 8 n/a n/aDenmark 12 92 91Estonia* 15 0 0Finland 7 84 84France 2 96 97Germany 5 96 96Greece 5 94 93Ireland 5 82 85Italy 3 99 99Latvia* 15 88 100Luxembourg 4 75 73Malta* 0 100 90Netherlands* 5 95 95Portugal 9 94 89Romania 7 95 95Slovakia 7 n/a n/aSlovenia* 6 100 92Spain 4 50 50Sweden 11 69 59Switzerland 2 74 89Turkey 17 91 91United Kingdom 15 95 962014 EUROPE-26 6 96 962012 EUROPE-25 6 90 912010 EUROPE-23 12 89 982008 EUROPE-17 9 71 93
Working in a branch or subsidiary office provides information as to how many offices an architectural practice might have. Overall, few architects (6 per cent) work in a branch office. But this proportion is over 15 per cent in Turkey, the United Kingdom, Estonia and Latvia (but small sample sizes in these last two). Where architects do work in a branch office, the head office is nearly always located in the same country as the branch office and the same country as where the architect is registered (96 per cent for both). The survey figures are very similar to those recorded in 2012.
TABLE 3-10Proportion of architects working in branch office and location of branch office’s Head Office
Seventeen per cent of practices have a formal association with another practice. For most, this is an association with another practice in the same country. The highest level of formal associations can be found in Finland and Croatia - where at least half of practices are associated with another practice. Slightly fewer practices have a formal association in this year’s survey compared with the 2012 survey, although the proportion is similar to that recorded in 2008.
3.8 Associations
* caution - small sample Netherlands: BNA Benchmark Research 2014 n/a = respondent did not answer this part of the question
3 - 43The Architectural Profession in Europe 2014

Mirza & Nacey Reserach LtdSouthdown HouseFord Lane, FordArundelWest SussexBN18 0DEUnited Kingdom
Telephone: +44 1243 555302email: [email protected]
MIRZA & NACEY RESEARCH
Registered office: Southdown House, Ford Lane, Ford, Arundel, West Sussex BN18 0DE. Registered in England and Wales. Company No. 04618115
TABLE 3-11Practices submitting competitive tenders, last 12 months, analysed by country
3.10 Competitive TendersIn a new question this year, thirty six per cent of responding Principals say their practice has submitted a competitive tender in the last 12 months. More (28 per cent of all practices) have submitted a competitive tender to a public sector client, than to a private sector one (19 per cent). Countries with the highest submission of public sector tenders include Switzerland, Finland and France (plus other countries with small sample sizes). Practices in Finland, Croatia and Greece submit more competitive tenders to private sector clients than elsewhere. Countries where practices are least likely to submit competitive tenders include Portugal, Italy, Turkey and Germany.
per cent practices submitted 1+ tender
1+ tender to public sector
1+ tender to private
sectorAustria 53 46 27Belgium 43 33 27Bulgaria* 38 32 17Croatia 57 43 47Czech Republic* n/a n/a n/aDenmark 49 44 27Estonia* 93 64 93Finland 70 54 57France 62 54 27Germany 31 25 13Greece 45 16 42Ireland 53 44 38Italy 26 22 9Latvia* 61 56 28Luxembourg 36 30 16Malta* 40 40 16Netherlands* 80 65 40Portugal 22 13 16Romania 33 24 18Slovakia 57 39 39Slovenia* 50 44 28Spain 40 28 22Sweden 52 41 35Switzerland 70 63 38Turkey 30 17 23United Kingdom 48 32 362014 EUROPE-26 36 28 192012 EUROPE-25 n/a n/a n/a2010 EUROPE-23 n/a n/a n/a2008 EUROPE-17 n/a n/a n/a
On average, architectural practices each submitted 5.4 competitive tenders in the last 12 months. This average includes practices which submitted no tenders so therefore the average number of tenders submitted by practices who submitted at least one tender, rises to 15. Half of all competitive tenders submitted were for a Pre-Qualification questionnaire or Expression of Interest (for either public or private sector clients).
CHART 3-11Practices submitting competitive tenders
CHART 3-12Average number of competitive tenders submitted
submitted tenders
did not submit any tenders
average number tenders submitted,last 12 months
0 1 2
private sector
public sector
private sector
public sector
private sector
public sector Pre-qualification questionnaire/expression of interest
Post-qualification competitive dialogue/tender
Design competition/contest
* caution - small sample Netherlands: BNA Benchmark Research 2014
3 - 44The Architectural Profession in Europe 2014

Mirza & Nacey Reserach LtdSouthdown HouseFord Lane, FordArundelWest SussexBN18 0DEUnited Kingdom
Telephone: +44 1243 555302email: [email protected]
MIRZA & NACEY RESEARCH
Registered office: Southdown House, Ford Lane, Ford, Arundel, West Sussex BN18 0DE. Registered in England and Wales. Company No. 04618115
TABLE 3-12Average number of competitive tenders submitted, last 12 months, analysed by country
average (mean) number of tenders made per practice
Pre-qualification questionnaire / expression
of interest
Post-qualification competitive dialogue /
tender
Design competition / contest ALL tenders
public sector private sector public sector private sector public sector private sectorAustria 1.0 0.3 0.2 0.2 1.6 0.8 4.1Belgium 1.7 2.3 0.4 1.1 1.3 0.3 7.0Bulgaria* 0.3 0.2 2.6 0.0 0.3 0.2 3.6Croatia 3.2 4.4 0.1 0.7 0.4 0.3 9.1Czech Republic* 0.9 5.7 2.3 5.4 0.8 0.0 15.1Denmark 10.3 2.7 2.7 0.9 3.0 0.6 20.1Estonia* 7.4 5.3 3.9 13.1 1.1 0.6 31.5Finland 5.2 1.3 2.7 5.0 0.8 0.4 15.4France 10.8 1.8 3.2 0.8 3.8 0.4 20.8Germany 0.6 0.1 0.3 0.1 0.8 0.2 2.0Greece 0.1 2.4 0.1 6.0 0.1 0.3 9.1Ireland 3.6 1.7 1.7 1.7 0.4 0.2 9.3Italy 0.9 0.2 0.3 0.1 0.7 0.2 2.4Latvia* 2.5 2.3 0.9 0.7 1.1 0.3 7.7Luxembourg 0.9 0.3 0.1 0.1 0.7 0.3 2.4Malta* 1.1 0.2 1.0 0.1 0.3 0.0 2.7Netherlands* 2.4 1.5 1.0 2.3 0.6 0.2 7.0Portugal 0.2 0.5 0.1 0.3 0.2 0.3 1.6Romania 0.8 0.3 0.9 0.4 0.8 0.2 3.5Slovakia 1.3 2.0 0.9 0.6 0.6 0.5 5.9Slovenia* 5.4 3.9 0.6 1.1 0.4 0.3 11.7Spain 0.8 1.2 0.6 0.8 0.6 0.3 4.4Sweden 4.2 3.0 0.7 1.0 0.6 0.4 10.0Switzerland 2.9 1.1 0.4 0.5 2.9 1.0 8.8Turkey 1.0 1.9 0.4 0.7 0.1 0.2 4.3United Kingdom 2.5 1.8 1.1 2.9 0.5 0.3 9.02014 EUROPE-26 1.7 1.0 0.7 0.8 0.9 0.2 5.42012 EUROPE-25 n/a n/a n/a n/a n/a n/a n/a2010 EUROPE-23 n/a n/a n/a n/a n/a n/a n/a2008 EUROPE-17 n/a n/a n/a n/a n/a n/a n/a
* caution - small sample Netherlands: BNA Benchmark Research 20142008/10/12 question was not asked in previous surveys
3 - 45The Architectural Profession in Europe 2014

Mirza & Nacey Reserach LtdSouthdown HouseFord Lane, FordArundelWest SussexBN18 0DEUnited Kingdom
Telephone: +44 1243 555302email: [email protected]
MIRZA & NACEY RESEARCH
Registered office: Southdown House, Ford Lane, Ford, Arundel, West Sussex BN18 0DE. Registered in England and Wales. Company No. 04618115
TABLE 3-13Architectural practices who offer certification services, analysed by country
per cent of practices who offer service
type of certification offeredbuilding energy rating health & safety accessibility fire safety contractors’ all risk
Austria 36 6 18 21 9Belgium 36 18 18 26 11Bulgaria* 29 29 36 55 0Croatia 56 8 20 20 0Czech Republic* 33 0 n/a n/a n/aDenmark 31 21 27 29 20Estonia* 33 13 0 0 0Finland 9 18 37 29 0France 20 9 42 28 11Germany 23 11 10 19 0Greece 64 40 36 58 100Ireland 22 48 64 67 0Italy 61 33 41 41 3Latvia* 18 18 25 33 n/aLuxembourg 61 10 8 25 n/aMalta* 53 0 40 0 100Netherlands* 80 85 80 10 5Portugal 12 16 47 36 15Romania 33 28 31 46 17Slovakia 41 6 11 41 0Slovenia* 45 31 0 25 n/aSpain 89 51 75 62 0Sweden 14 13 50 9 8Switzerland 16 2 8 11 0Turkey 51 35 32 57 38United Kingdom 5 9 4 0 02014 EUROPE-26 42 24 33 35 102012 EUROPE-25 n/a n/a n/a n/a n/a2010 EUROPE-23 n/a n/a n/a n/a n/a2008 EUROPE-17 n/a n/a n/a n/a n/a
3.11 Certification Work
per cent practice offering certification service0 10 20 30 40 50
contractors’all risk
fire safety
accessibility
health & safety
building energyrating
In a new question for 2014, respondents stated whether their practice offers any of a variety of certification services. Most common is the building energy rating certificate, which is offered by 42 per cent of practices. This is offered by more than 60 per cent of practices in Spain, Greece and Italy. About one third of practices offer fire safety certification (35 per cent of all, including over 50 per cent in Ireland, Spain, Turkey and Greece) and accessibility certification (33 per cent, offered by more than 50 per cent of practices in Spain, Ireland and Sweden). A quarter (24 per cent) of practices offer health and safety certification (highest levels in Spain and Ireland) while just 10 per cent offer a contractors’ all risk certificate (including all practices in Greece and 38 per cent of practices in Turkey). Very low levels of practices offer any of the five certification services in Switzerland and the United Kingdom.
CHART 3-13Certification services offered
* caution - small sample Netherlands: BNA Benchmark Research 2014
3 - 46The Architectural Profession in Europe 2014