architects council of europe · mirza & nacey reserach td southdown ouse ford ane, ford arundel...
TRANSCRIPT

Mirza & Nacey Reserach LtdSouthdown HouseFord Lane, FordArundelWest SussexBN18 0DEUnited Kingdom
Telephone: +44 1243 555302email: [email protected]
MIRZA & NACEY RESEARCH
Registered office: Southdown House, Ford Lane, Ford, Arundel, West Sussex BN18 0DE. Registered in England and Wales. Company No. 04618115
ARCHITECTS’COUNCIL OF EUROPE

Mirza & Nacey Reserach LtdSouthdown HouseFord Lane, FordArundelWest SussexBN18 0DEUnited Kingdom
Telephone: +44 1243 555302email: [email protected]
MIRZA & NACEY RESEARCH
Registered office: Southdown House, Ford Lane, Ford, Arundel, West Sussex BN18 0DE. Registered in England and Wales. Company No. 04618115
II
FINAL
January 2017© Mirza & Nacey Research Ltd
Research undertaken by:Mirza & Nacey Research LtdSouthdown HouseFord, ArundelWest SussexBN18 0DEUnited Kingdom
Tel: +44 1243 555302www.mirza-nacey.com
Research commissioned by:The Architects’ Council of Europe29 Rue Paul Emile JansonB-1050 Brusselswww. ace-cae.eu
Foreword 2Introduction and Summary 3Key statistics 4
1: ARCHITECTS IN EUROPE1.1 Numbers 91.2 Profile 111.3 Employment status 121.4 Field of employment 131.5 Years qualified 151.6 Age Profile 16
2: ARCHITECTURE – THE MARKET2.1 Construction market 192.2 Architectural market 232.3 Market by building 252.4 Market by client type 272.5 Market by service 282.6 Future prospects 29
3: ARCHITECTURE – THE PRACTICE3.1 Profile 323.2 Legal formation 343.3 Practice revenue 363.4 How practices charge 373.5 Hourly rates 38
The ArchITecTurAl ProfessIon In euroPe 2016conTenTs
Photo credits for front cover: Architect: Radionica arhitekture + Vanja IlićProject: Vučedol Culture MuseumPhoto: Miljenko Bernfest, Boris Cvjetanović, Darko Puharić Place: Vukovar, Croatia
1
2
3
4
I 3.6 Profits 403.7 Revenue from outside country 413.8 Associations 423.9 Branch offices 433.10 Design Competitions 443.11 Certification work 47
4: ARCHITECTS – THE INDIVIDUAL4.1 Earnings 494.2 Earnings by field of employment 514.3 Earnings by age 524.4 Earnings by gender 534.5 Working in another European country 544.6 Main concerns about working in another country 564.7 Retirement 574.8 Hours worked 594.9 CPD 604.10 Building to nearly zero energy standards 62
COUNTRY PROFILES 64
APPENDIXSurvey methodology & Notes 96
I - 1The ArchITecTurAl ProfessIon In euroPe 2016

Mirza & Nacey Reserach LtdSouthdown HouseFord Lane, FordArundelWest SussexBN18 0DEUnited Kingdom
Telephone: +44 1243 555302email: [email protected]
MIRZA & NACEY RESEARCH
Registered office: Southdown House, Ford Lane, Ford, Arundel, West Sussex BN18 0DE. Registered in England and Wales. Company No. 04618115
forewordThis fifth edition of the ACE Sector Study builds on data collected since the first edition of the Study in 2008 and is enriched with new data on Architectural Design Competitions. It is without doubt the most comprehensive and significant report on the state of the architectural profession in Europe. This latest version has seen an even greater participation than the previous editions – more than 27.000 respondents in 27 European countries, covering 94% of the profession – and the number of readers of the previous editions attest to the genuine interest of a broad audience in such a study.
Since its first edition, the ACE Sector Study has proved its worth and usefulness. By supporting and effectively guiding our policy positions with statistical evidence, it contributes to enhancing the credibility of ACE in its dealings with policy-makers at EU and national levels. Throughout the legislative process for modernising the Public Procurement and Professional Qualifications Directives, and more recently during the mutual evaluation of regulated professions and in the run-up to the publication of the Services Legislative Package, the Sector Study provided us and the EU institutions with precious data. Moreover, this publication allows ACE Member Organisations, researchers and media to draw insightful comparisons between the European countries and thus enables organisations to put national situations into a wider context. Its information is of vital relevance to professionals seeking to work outside their borders and whenever it is presented, this data draws much interest from the public. The study progressively allows us to track long-term trends and to better understand how the profession has been evolving since the economic
crisis. The ACE Sector Study has therefore become an essential reference tool for all those interested in better understanding the architectural profession and market.
The 2016 Study reveals numerous signs of recovery of the architectural market and positive perspectives for the Profession: the value of the architectural market has increased, the average revenue is higher for most sizes of practices, the number of independent architects has fallen, workloads for the next year are expected to increase. The positive average trends at European level must however not hide the fact that the situation is not the same throughout Europe. Growth is weaker in the south and not surprisingly, the predictions there are more pessimistic. One particular hiccup born out of political events is the concern that was manifested in the UK, so shortly after the Brexit vote.
These results emphasise the need to take strong and targeted actions at all governance levels in order to accelerate and consolidate the recovery of the sector, while ensuring safety and quality in the built environment. ACE contributes to raise policy-makers awareness at EU level about the challenges that the profession faces. In 2016, it released a suite of 8 policy statements that clearly set out the European architects’ position on a number of key issues affecting our profession. It underlines notably the importance of investing in education to deliver high quality graduates, of facilitating the provision of architectural services across Europe; of implementing public procurement rules based on quality selection criteria and of supporting the regeneration of our cities. Low energy design is still very low on the radar
of most practices, as the majority of clients do not deem it important and this is an issue that ACE is very much aware of, active as it is in Global Alliance and movements that are working to mitigate climate change.
I would like to thank all ACE Member Organisations sincerely for their support, as well as all Architects who have responded to our survey and made this new edition of the Sector Study possible.
Luciano LazzariACE President
I - 2The ArchITecTurAl ProfessIon In euroPe 2016

Mirza & Nacey Reserach LtdSouthdown HouseFord Lane, FordArundelWest SussexBN18 0DEUnited Kingdom
Telephone: +44 1243 555302email: [email protected]
MIRZA & NACEY RESEARCH
Registered office: Southdown House, Ford Lane, Ford, Arundel, West Sussex BN18 0DE. Registered in England and Wales. Company No. 04618115
More than 27 000 architects, from 27 different countries, participated in the 2016 ACE Sector Study. The number of countries participating is the highest ever, and the number of individual participants is only just short of the highest ever. Such a high participation level reflects massive interest in this survey and its findings. We are extremely grateful to the 27 000 individual architects who took the time to complete the survey questionnaire and provide the raw data upon which this report is based.
This year’s survey shows that architecture in Europe is a growing profession: an increasing number of people are becoming architects. The 2016 estimate is that there are 600 000 architects in Europe. This is 4 per cent higher than in 2014, and the number has been rising in every survey. Large numbers of young people are joining the profession in some Mediterranean countries, while growth this year has been particularly strong on the eastern and western edges of Europe - Turkey and the United Kingdom.
After the economic crisis which began in 2008, we can see an improving picture. Construction output is starting to edge up across Europe, the total value of the architectural market has increased, and architects’ performance measures show some growth since 2012. There is clearly some way to go until the profession’s health returns to its pre 2008
InTroducTIon And summArylevels, and in several countries earnings and revenues remain subdued. But for Europe’s architects as a whole, the various indicators are moving in a positive direction.
There are signs that the profession may be returning to something nearer normality, after the economic crisis. Average practice revenue is higher for most sizes, indeed for practices with between 2 and 30 staff, average revenue is the highest recorded in any of the ACE sector study surveys. Total revenue of the profession across Europe is estimated to be 12 per cent higher than in 2014. Standing now at 17 billion, this is the highest value since 2008.
There has been a big fall in the number of Independent Architects, in favour of partnerships and limited companies. The number of Independent Architects has fallen from 65 per cent in the 2012 and 2014 surveys to nearer 50 per cent - as in 2008 and 2010. Similarly, the number of Sole Principals is the lowest since 2010. These trends suggest architects are returning to more formal employment within practices, rather than practising alone.
This is confirmed in total practice numbers, which are down - more architects now work in larger practices, and fewer on their own or with one other. This is another sign of recovery from the recession. The reduction in the number
of Sole Principals has lifted their average earnings; Sole Principals’ earnings are now 23 per cent higher. Average earnings overall are 10 per cent higher; the first time average earnings have increased since the survey began in 2008.
There is evidence that architects are returning to their core service, building design, which now accounts for its highest share of revenue since 2010. Average hourly rates this year are the highest recorded in any of the years this survey has been running. Average rates for Principals are higher by 9 per cent, while for Architects average rates are up by 8 per cent.
Crucially, architects themselves see a positive future. While some of the financial indicators may have a little way to travel until they match pre 2008 levels, architects feel confident about their immediate future prospects.
For the first time since this survey began in 2008, architects in a majority of countries say they expect more work, on balance, in the coming year. Only two countries record negative ‘balance’ figures this year; Italy and the UK. There is also evidence that architects are investing in their own future; spending on CPD is substantially higher than in 2014, as is the number of hours spent undertaking CPD.
I - 3The ArchITecTurAl ProfessIon In euroPe 2016

Mirza & Nacey Reserach LtdSouthdown HouseFord Lane, FordArundelWest SussexBN18 0DEUnited Kingdom
Telephone: +44 1243 555302email: [email protected]
MIRZA & NACEY RESEARCH
Registered office: Southdown House, Ford Lane, Ford, Arundel, West Sussex BN18 0DE. Registered in England and Wales. Company No. 04618115
27member organisations
27000participants
survey covers
94% of profession
survey PArTIcIPATIon - 2016
0 4 8 12 16 20 24 28 32
2016
number of member organisations (total=32)
number of member organisations
participants non-participants
0 20 40 60 80 100
2016
per cent architects in Europe
number of member organisations
0 5000 10000 15000 20000 25000 300002008
2010
2012
2014
2016
number of participants
I - 4The ArchITecTurAl ProfessIon In euroPe 2016
Mirza & Nacey Reserach LtdSouthdown HouseFord Lane, FordArundelWest SussexBN18 0DEUnited Kingdom
Telephone: +44 1243 555302email: [email protected]
MIRZA & NACEY RESEARCH
Registered office: Southdown House, Ford Lane, Ford, Arundel, West Sussex BN18 0DE. Registered in England and Wales. Company No. 04618115
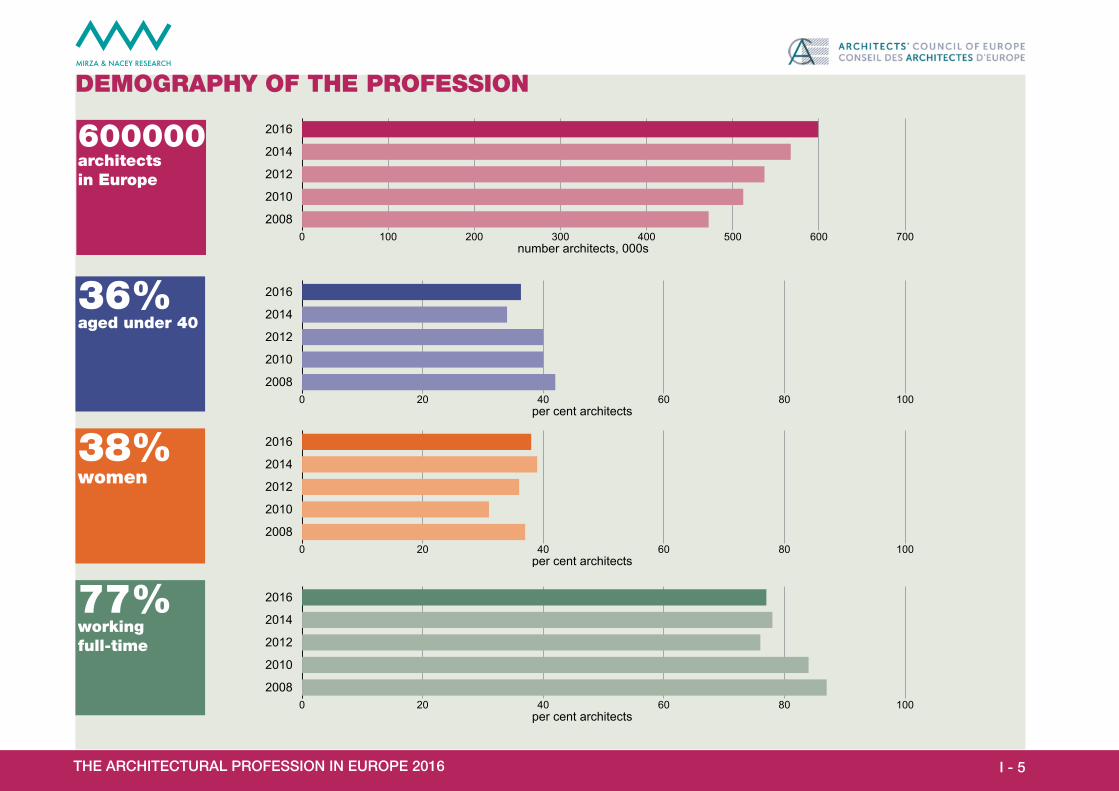
600000architectsin europe
36%aged under 40
38%women
77%working full-time
demogrAPhy of The ProfessIon
0 20 40 60 80 1002008
2010
2012
2014
2016
per cent architects
0 20 40 60 80 1002008
2010
2012
2014
2016
per cent architects
0 20 40 60 80 1002008
2010
2012
2014
2016
per cent architects
0 100 200 300 400 500 600 7002008
2010
2012
2014
2016
number architects, 000s
I - 5The ArchITecTurAl ProfessIon In euroPe 2016

Mirza & Nacey Reserach LtdSouthdown HouseFord Lane, FordArundelWest SussexBN18 0DEUnited Kingdom
Telephone: +44 1243 555302email: [email protected]
MIRZA & NACEY RESEARCH
Registered office: Southdown House, Ford Lane, Ford, Arundel, West Sussex BN18 0DE. Registered in England and Wales. Company No. 04618115
€1939bnconstruction output
€17 bnarchitectural market
55%architects’ work is private housing
77%expect rise or no change in workloads next year
The mArkeT
0 5 10 15 20 252008
2010
2012
2014
2016
€000 m
0 20 40 60 80 1002008
2010
2012
2014
2016
per cent practice revenue
0 20 40 60 80 1002008
2010
2012
2014
2016
per cent architects
0 500 1000 1500 2000 25002008
2010
2012
2014
2016
€000 m
I - 6The ArchITecTurAl ProfessIon In euroPe 2016

Mirza & Nacey Reserach LtdSouthdown HouseFord Lane, FordArundelWest SussexBN18 0DEUnited Kingdom
Telephone: +44 1243 555302email: [email protected]
MIRZA & NACEY RESEARCH
Registered office: Southdown House, Ford Lane, Ford, Arundel, West Sussex BN18 0DE. Registered in England and Wales. Company No. 04618115
72%of practices are one person practices
€32068average earnings (PPP)
€35679average earnings(PPP) - sole Principals
73%will work as an architect until retired
PrAcTIce, Income, work
0 5000 10000 15000 20000 25000 30000 350002008
2010
2012
2014
2016
€ adjusted for PPP
0 5000 10000 15000 20000 25000 30000 35000 400002008
2010
2012
2014
2016
€ adjusted for PPP
0 20 40 60 80 1002008
2010
2012
2014
2016
per cent architects
0 20 40 60 80 1002008
2010
2012
2014
2016
per cent architects
I - 7The ArchITecTurAl ProfessIon In euroPe 2016

Architect: NOMA arkitekter ASPhoto: Jean S LorentzenPlace: Norway, Vestfold Conty, island of Tjøme

Mirza & Nacey Reserach LtdSouthdown HouseFord Lane, FordArundelWest SussexBN18 0DEUnited Kingdom
Telephone: +44 1243 555302email: [email protected]
MIRZA & NACEY RESEARCH
Registered office: Southdown House, Ford Lane, Ford, Arundel, West Sussex BN18 0DE. Registered in England and Wales. Company No. 04618115
The estimated total number of architects in EUROPE-32 is approximately 600 000. A quarter of Europe’s architects can be found in just one country; Italy, which has 157 000 architects. Germany accounts for another sizable proportion of Europe’s architects (109 000).
Other countries with high numbers of architects are Spain (54 000), Turkey (50 000), the United Kingdom (37 000) and France (30 000). Analysed as a proportion of the population, the highest ‘densities’
1.1 The number of ArchITecTs In euroPeof architects - measured as the number of architects per 1 000 population - are in Italy (2.6 architects per 1 000 population), and Portugal (2.1 architects per 1 000 population). The overall density of architects across Europe is 1.0 architects per 1 000 population.
This year’s survey figure of 600 000 architects in Europe is 4 per cent higher than in the previous survey two years ago; which itself was 5 per cent higher than two years earlier. The estimated number of architects continues to climb, at a steady rate. This increase is
CHART 1-1ESTIMATED NUMBER OF ARCHITECTS 2016
CHART 1-2NUMBER OF ARCHITECTS PER 1000 POPULATION
explained by growing numbers of young architects entering the profession. The highest growth rates over the last two years (where data for both years is based on an identical source) is Turkey, where the number of architects is up by 12 per cent. The number in the UK has grown by 7 per cent over the two years 2014 to 2016.
number of architects, 000s
ACE COLOURFOR COUNTRIES
CHAPTER
0 20 40 60 80 100 120 140 160 Malta
Estonia Latvia
Luxembourg Cyprus
Lithuania Slovenia Slovakia Bulgaria Croatia Ireland Finland Norway
Hungary Austria
Sweden Switzerland
Romania Serbia
Czech Republic Denmark
Netherlands Poland
Belgium Greece
Portugal France
United Kingdom Turkey Spain
Germany Italy
Base: all 32 European countries
1 - 9The ArchITecTurAl ProfessIon In euroPe 2016

Mirza & Nacey Reserach LtdSouthdown HouseFord Lane, FordArundelWest SussexBN18 0DEUnited Kingdom
Telephone: +44 1243 555302email: [email protected]
MIRZA & NACEY RESEARCH
Registered office: Southdown House, Ford Lane, Ford, Arundel, West Sussex BN18 0DE. Registered in England and Wales. Company No. 04618115
TABLE 1-1ESTIMATED NUMBER OF ARCHITECTS IN EACH COUNTRY AND NUMBER OF ARCHITECTS PER 1000 POPULATION
Population source: Eurostat, population as at 1 January 2016, copyright (c) Eurostat
Number of Architects source: Mirza & Nacey estimates. The starting point was data compiled for the 2008 Sector Study which itself was based on the research publication produced by COAC - Architectural Practice Around the World research by the Col-legi d’Arquitectes de Catalunya (COAC), based on information supplied by national institutes and associations of architects of the individual countries. For the 2008 ACE report this data from COAC was updated using a mixture of primary and secondary research.
To update the figures in 2010, 2012, 2014 and 2016, we used a mixture of primary and secondary sources including Member Organisations’ websites and email contact with Member Organisations. Final figures are Mirza & Nacey best estimates based on these several different sources. All figures are ‘latest available’.
Note: some 2008 figures were substantially revised in 2010, which accounts for some of the increase between those two years.
number of architects population architects per 1000 populationAustria 5 200 8 700 471 0.6Belgium 15 100 11 289 853 1.3Bulgaria 2 000 7 153 784 0.3Croatia 2 200 4 190 669 0.5Cyprus 950 848 319 1.1Czech Republic 8 300 10 553 843 0.8Denmark 10 000 5 707 251 1.8Estonia 800 1 315 944 0.6Finland 3 500 5 487 308 0.6France 30 000 66 661 621 0.5Germany 109 200 82 162 000 1.3Greece 18 200 10 793 526 1.7Hungary 4 200 9 830 485 0.4Ireland 2 500 4 658 530 0.5Italy 157 000 60 665 551 2.6Latvia 900 1 968 957 0.5Lithuania 1 350 2 888 558 0.5Luxembourg 950 576 249 1.6Malta 650 434 403 1.5Netherlands 11 200 16 979 120 0.7Norway 3 740 5 213 985 0.7Poland 14 000 37 967 209 0.4Portugal 22 200 10 341 330 2.1Romania 7 600 19 759 968 0.4Serbia 8 000 7 076 372 1.1Slovakia 1 650 5 426 252 0.3Slovenia 1 350 2 064 188 0.7Spain 53 800 46 438 422 1.2Sweden 6 550 9 851 017 0.7Switzerland 7 300 8 325 194 0.9Turkey 50 000 78 741 053 0.6United Kingdom 36 700 65 341 183 0.6EUROPE - 32 - 2016 597 100 609 412 615 1.0EUROPE - 32 - 2014 578 800 565 981 316 1.0EUROPE - 32 - 2012 550 530 601 451 878 0.9EUROPE - 32 - 2010 525 700 595 082 893 0.9EUROPE - 32 - 2008 485 480 586 877 058 0.8
0
100
200
300
400
500
600
700
20162014201220102008to
tal n
umbe
r of a
rchi
tect
s, 0
00s
CHART 1-3CHANGE IN ESTIMATED NUMBER OF ARCHITECTS IN EUROPE-32, 2008-16
Base: all 32 European countriesBase: all 32 European countries
1 - 10The ArchITecTurAl ProfessIon In euroPe 2016

Mirza & Nacey Reserach LtdSouthdown HouseFord Lane, FordArundelWest SussexBN18 0DEUnited Kingdom
Telephone: +44 1243 555302email: [email protected]
MIRZA & NACEY RESEARCH
Registered office: Southdown House, Ford Lane, Ford, Arundel, West Sussex BN18 0DE. Registered in England and Wales. Company No. 04618115
per cent gender of architectsmale female
Austria 80 20Belgium 72 28Bulgaria 46 54Croatia 41 59Cyprus * 54 46Czech Republic * 64 36Denmark 54 46Estonia * 73 27Finland 47 53France 64 36Germany *** 66 34Hungary 72 28Ireland 68 32Italy 59 41Lithuania 50 50Luxembourg 74 26Malta * 64 36Netherlands 80 20Poland 54 46Portugal 55 45Romania * 77 23Slovakia 77 23Slovenia 48 52Spain 72 28Sweden 54 46Turkey 54 46United Kingdom 67 332016 EUROPE-27** 62 382014 EUROPE-26** 61 392012 EUR-25 ** 64 362010 EUR- 23 ** 69 312008 EUR-17** 63 37
1.2 ProfIle of ArchITecTsCHART 1-4MALE / FEMALE SPLIT, ALL RESPONDING ARCHITECTS
TABLE 1-2GENDER OF ARCHITECTS ANALYSED BY COUNTRY
* caution - small sample. *** Germany figures provided by BAK, sourced from BAK surveys 2015 and 2016** weighted to reflect the total architectural population in all participating countries; weighting process described in Appendix
A majority of the profession, 62 per cent, is male. Countries with the highest proportion of male architects are Austria, Slovakia and Romania. In four countries, Croatia, Bulgaria, Finland and Slovenia, there are more female architects than males. The Europe-27 figure is very similar to that in the 2014 survey, but both recent survey years record more female architects than in the period 2008 to 2012.
CHART 1-5PROPORTION OF WOMEN ARCHITECTS
female
male
1 - 11The ArchITecTurAl ProfessIon In euroPe 2016

Mirza & Nacey Reserach LtdSouthdown HouseFord Lane, FordArundelWest SussexBN18 0DEUnited Kingdom
Telephone: +44 1243 555302email: [email protected]
MIRZA & NACEY RESEARCH
Registered office: Southdown House, Ford Lane, Ford, Arundel, West Sussex BN18 0DE. Registered in England and Wales. Company No. 04618115
1.3 emPloymenT sTATus
retirednot
workingworkingpart-time
workingfull-time
CHART 1-6EMPLOYMENT STATUS OF ARCHITECTS
TABLE 1-3EMPLOYMENT STATUS OF ARCHITECTS ANALYSED BY COUNTRY
per cent working full-time working part-time not working retiredAustria 88 11 1 1Belgium 93 6 0 1Bulgaria 77 14 7 2Croatia 92 6 0 1Cyprus * 75 11 12 2Czech Republic * 59 24 0 17Denmark 81 10 5 4Estonia * 80 6 0 15Finland 89 8 2 0France 89 7 2 2Germany *** 82 17 1 0Hungary 66 14 3 18Ireland 86 10 3 1Italy 69 20 8 3Lithuania 87 9 1 2Luxembourg 91 9 0 0Malta * 82 16 2 0Netherlands 71 22 3 4Poland 82 12 6 0Portugal 80 9 9 1Romania * 92 3 0 5Slovakia 85 9 2 3Slovenia 86 3 5 6Spain 70 22 7 0Sweden 83 13 2 2Turkey 85 6 6 3United Kingdom 81 14 2 32016 EUROPE-27 *** 77 15 6 32014 EUROPE-26 *** 78 15 5 22012 EUROPE-25 76 15 6 22010 EUROPE-23 ** 84 11 4 12008 EUROPE-17** 87 9 3 2
* caution - small sample *** Germany figures are for Partners/Directors/Sole Principals only** The basis of calculating historical figures (2010 and 2008) has changed. Data is presented as reported and is no longer ‘adjusted’ . This is discussed in the Appendix.*** weighted to reflect the total architectural population in all participating countries. The weighting process is explained in the Appendix.
Just over three quarters of the profession is working full-time. This is very similar to the figure recorded in the 2014 and 2012 surveys, but lower than in 2010 or 2008.
In most countries, the proportion of architects working full-time is over 80 per cent - and over 90 per cent in Belgium, Croatia and Luxembourg. The overall full-time average is lowered by Italy (69 per cent full-time) and Spain (70 per cent).
These two countries, along with the Netherlands, have the highest proportions of architects working part-time (20 per cent or more). The highest proportions of architects not working are in Cyprus, Spain and Portugal; each with a reported unemployment rate of 7 per cent of more.
1 - 12The ArchITecTurAl ProfessIon In euroPe 2016

Mirza & Nacey Reserach LtdSouthdown HouseFord Lane, FordArundelWest SussexBN18 0DEUnited Kingdom
Telephone: +44 1243 555302email: [email protected]
MIRZA & NACEY RESEARCH
Registered office: Southdown House, Ford Lane, Ford, Arundel, West Sussex BN18 0DE. Registered in England and Wales. Company No. 04618115
1.4 fIeld of emPloymenTCHART 1-7FIELD OF EMPLOYMENT
other publiceducation
local authority/government
other private
freelance
agency
in house
salariedprivate practice
associate
partner/director
sole principal
The largest single field of employment is Sole Principals. Just over a quarter, 26 per cent, of architects describe themselves as a Sole Principal. The highest proportion of architects who are Sole Principals is in Austria. Fifteen per cent of architects are ‘freelance’, with the highest proportions being in France, the Czech Republic and Slovakia. Ten per cent are agency architects, including 58 per cent of architects in the Netherlands and 41 per cent in Spain.
Nearly one quarter of architects are employed in private practice, either as Associates (6 per cent) or private practice salaried staff (16 per cent). The proportions are highest in the UK and Turkey. Just 8 per cent of architects are Partners or Directors, but this proportion
CHART 1-8MAIN EMPLOYMENT FIELDS BY COUNTRY
0 20 40 60 80 100
other privatefreelanceprivate practice salariedpartner / directorsole principal
HungaryMalta
NetherlandsDenmarkPortugalFinland
LithuaniaSpain
SwedenEstoniaCroatiaTurkey
United KingdomSlovenia
LuxembourgBelgiumFranceIreland
GermanyCyprus
Czech RepublicRomaniaSlovakia
PolandBulgaria
ItalyAustria
per cent respondents
varies markedly between countries. More than 20 per cent of architects in several countries are Partners or Directors - Austria, Ireland, Croatia, Luxembourg and Romania.
About 7 per cent of architects in Europe are employed by central or local government, the highest levels being recorded in Sweden, Finland and Denmark.
The analysis by field of employment is generally very similar to previous years, although the 2016 survey has more architects working as agency or freelance staff than in previous surveys.
other public
local & central government
other private
freelance
private practice salaried
partner/director
sole principal
1 - 13The ArchITecTurAl ProfessIon In euroPe 2016

Mirza & Nacey Reserach LtdSouthdown HouseFord Lane, FordArundelWest SussexBN18 0DEUnited Kingdom
Telephone: +44 1243 555302email: [email protected]
MIRZA & NACEY RESEARCH
Registered office: Southdown House, Ford Lane, Ford, Arundel, West Sussex BN18 0DE. Registered in England and Wales. Company No. 04618115
per cent
sole
pr
inci
pal
partn
er
dire
ctor
asso
ciat
e
priv
ate
prac
tice
sala
ried
in-h
ouse
agen
cy
freel
ance
othe
r pr
ivat
e
loca
l au
thor
ity
cent
ral g
ovt
educ
atio
n
othe
r pub
lic
Austria 68 23 0 5 0 0 1 0 0 0 1 1Belgium 25 9 5 1 0 32 20 1 3 1 0 1Bulgaria 36 7 10 19 0 1 16 2 5 0 3 1Croatia 15 21 5 34 2 1 4 2 7 0 4 5Cyprus * 30 9 4 30 2 2 9 4 2 2 2 5Czech Republic * 31 5 5 10 0 0 37 5 2 0 5 0Denmark 11 10 2 31 1 4 2 10 17 2 6 4Estonia * 15 36 20 7 0 0 4 0 4 0 0 15Finland 12 9 3 35 0 1 1 3 24 1 3 8France 26 6 11 6 0 17 27 1 3 0 0 2Germany *** 27 10 < 33 > 12 0 4 0 < 14 >Hungary 5 1 11 8 1 35 11 4 11 2 1 11Ireland 26 22 9 23 0 0 3 2 7 2 2 2Italy 39 4 8 5 2 0 20 10 5 0 2 4Lithuania 14 3 2 20 0 36 15 0 6 0 4 1Luxembourg 22 39 13 1 1 15 8 0 0 0 0 0Malta * 9 5 2 39 0 2 5 5 2 16 9 7Netherlands 9 9 1 2 2 58 12 3 1 1 1 2Poland 35 11 3 26 0 1 12 5 7 0 1 1Portugal 11 10 3 30 1 0 18 3 16 1 3 3Romania * 33 26 5 8 0 15 0 0 8 0 0 5Slovakia 35 19 3 7 1 1 24 3 4 1 1 1Slovenia 20 17 5 14 4 11 19 3 3 3 1 2Spain 14 6 4 10 0 41 13 3 4 2 2 1Sweden 14 7 7 33 0 10 0 1 19 5 3 0Turkey 17 7 1 47 0 0 7 2 6 1 7 5United Kingdom 18 17 13 34 2 1 3 4 3 1 2 32016 EUROPE-27 ** 26 8 6 16 1 10 15 5 6 1 3 32014 EUROPE-26 ** 29 9 7 20 2 7 8 4 7 1 2 32012 EUROPE-25 ** 32 11 7 16 2 8 10 5 5 1 1 32010 EUROPE-23 ** 39 12 6 16 1 4 11 4 3 1 2 22008 EUROPE-17** 24 16 5 22 3 6 9 4 6 1 2 3
TABLE 1-4ARCHITECTS’ FIELD OF EMPLOYMENT BY COUNTRY
* caution - small sample ** weighted to reflect the total architectural population in all participating countries.*** Germany figures provided by BAK, sourced from BAK surveys 2015 and 2016. Some staff categories do not match precisely. Germany figures are not included in the EUROPE-27 total.
1 - 14The ArchITecTurAl ProfessIon In euroPe 2016

Mirza & Nacey Reserach LtdSouthdown HouseFord Lane, FordArundelWest SussexBN18 0DEUnited Kingdom
Telephone: +44 1243 555302email: [email protected]
MIRZA & NACEY RESEARCH
Registered office: Southdown House, Ford Lane, Ford, Arundel, West Sussex BN18 0DE. Registered in England and Wales. Company No. 04618115
1.5 yeArs QuAlIfIed As An ArchITecT
per cent number of years qualified as an architect1 2 3 to 5 6 to 9 10 to 14 15 to 19 20 to 24 25 +
Austria 3 4 9 10 16 20 14 24Belgium 1 0 10 12 13 11 11 42Bulgaria 4 6 11 12 16 7 8 35Croatia 0 0 12 13 19 11 13 32Cyprus * 10 7 24 10 8 7 15 19Czech Republic * 0 0 7 25 22 8 5 32Denmark 6 5 8 11 10 13 12 36Estonia * 9 0 0 4 27 2 4 55Finland 2 1 8 11 13 16 11 38France 4 3 8 15 15 13 9 33Germany *** 0 0 6 13 16 17 15 32Hungary 1 0 4 5 10 13 11 55Ireland 1 1 4 8 14 19 16 37Italy 2 3 9 13 19 16 13 26Lithuania 0 2 0 7 31 4 9 47Luxembourg 0 0 5 6 18 26 13 33Malta * 4 4 20 4 16 18 7 27Netherlands 4 5 10 14 15 11 11 31Poland 10 12 15 17 14 8 8 19Portugal 5 5 14 14 18 17 10 17Romania * 0 0 5 8 31 13 3 41Slovakia 1 0 4 9 22 18 13 33Slovenia 0 0 5 16 12 16 20 31Spain 3 8 13 13 26 14 5 18Sweden 1 2 10 11 13 14 9 42Turkey 12 12 17 13 10 8 7 22United Kingdom 4 6 10 12 10 9 10 382016 EUR-27 ** 3 4 10 13 19 14 10 272014 EUR-26 ** 3 3 9 15 19 14 12 272012 EUR-25 ** 3 4 12 16 19 11 11 242010 EUR-23 ** 3 5 16 14 12 9 12 282008 EUR-17** 4 3 11 17 17 12 13 23
25+
20-24
15-1910-14
6-9
3-521
CHART 1-9NUMBER OF YEARS ARCHITECTS HAVE BEEN qUALIFIED
A little more than a quarter of architects have been qualified for 25 years or more; another quarter have been qualified for between 15 and 24 years. At the other end of the profession, half of Europe’s architects have been qualified for fewer than 15 years.
Highest levels of the least experienced architects are recorded in Turkey, Malta, Poland and Cyprus. The highest proportion of the most experienced architects are found in Hungary, Estonia and Lithuania.
TABLE 1-5NUMBER OF YEARS qUALIFIED AS AN ARCHITECT, ANALYSED BY COUNTRY
* caution - small sample *** Germany figures provided by BAK, sourced from BAK surveys 2015 and 2016** weighted to reflect the total architectural population in all participating countries.
delete Germany
1 - 15The ArchITecTurAl ProfessIon In euroPe 2016

Mirza & Nacey Reserach LtdSouthdown HouseFord Lane, FordArundelWest SussexBN18 0DEUnited Kingdom
Telephone: +44 1243 555302email: [email protected]
MIRZA & NACEY RESEARCH
Registered office: Southdown House, Ford Lane, Ford, Arundel, West Sussex BN18 0DE. Registered in England and Wales. Company No. 04618115
1.6 Age ProfIle of ArchITecTs
CHART 1-10AGE PROFILE OF ARCHITECTS
Thirty six per cent of Europe’s architects are aged under 40, and half are aged under 45. The age profile rises steeply through the younger ages, peaking at age 35 to 44. The distribution then drops off, more gradually. Countries with high proportions of younger architects include Turkey, Poland, Cyprus, Malta, Portugal and Spain. This year’s age profile is very similar to that in previous surveys.
The age profile for women is younger than it is for men; female architects’ age peaks at age 40 to 44; male architects ten years later, at 50 to 54.
CHART 1-11PROPORTION OF ARCHITECTS AGED UNDER 40
per c
ent a
rchi
tect
s
age0
5
10
15
20
65+60-6455-5950-5445-4940-4435-3930-34<30
1 - 16The ArchITecTurAl ProfessIon In euroPe 2016

Mirza & Nacey Reserach LtdSouthdown HouseFord Lane, FordArundelWest SussexBN18 0DEUnited Kingdom
Telephone: +44 1243 555302email: [email protected]
MIRZA & NACEY RESEARCH
Registered office: Southdown House, Ford Lane, Ford, Arundel, West Sussex BN18 0DE. Registered in England and Wales. Company No. 04618115
per cent age of architects<30 30-34 35-39 40-44 45-49 50-54 55-59 60-64 65+
Austria 2 2 10 19 17 18 12 11 9Belgium 9 15 12 12 12 12 13 10 6Bulgaria 12 22 11 5 9 12 10 12 8Croatia 7 14 19 11 9 17 12 7 5Cyprus * 31 19 8 7 7 14 5 7 3Czech Republic * 0 32 20 10 5 5 7 3 17Denmark 7 11 10 13 12 11 13 12 11Estonia * 2 15 15 2 4 4 22 4 35Finland 5 11 9 11 14 16 13 19 3France 6 14 14 12 11 12 11 12 8Germany *** 1 9 13 15 16 18 14 9 5Hungary 4 6 15 7 11 10 13 17 17Ireland 2 8 16 19 12 13 10 12 7Italy 5 11 12 16 17 13 11 8 6Lithuania 3 23 12 8 7 13 24 6 4Luxembourg 0 6 8 31 15 8 20 7 5Malta * 24 16 18 9 4 9 11 4 4Netherlands 10 11 18 13 10 9 7 13 9Poland 34 18 14 6 7 7 5 5 6Portugal 15 17 21 16 11 8 7 3 2Romania * 0 5 28 18 8 5 3 18 15Slovakia 3 13 17 18 12 5 13 13 7Slovenia 3 9 12 19 19 18 8 5 8Spain 13 17 20 19 12 7 8 3 3Sweden 3 9 13 11 10 13 13 16 11Turkey 42 15 9 9 7 5 7 4 4United Kingdom 7 17 13 9 10 11 10 9 142016 EUR-27 ** 8 13 15 15 13 11 10 8 62014 EUR-26 ** 7 12 15 16 13 13 11 7 62012 EUR-25 ** 9 15 16 14 13 12 10 6 42010 EUR-23 ** 10 15 15 10 12 12 12 8 42008 EUR-17** 9 14 19 13 13 14 10 5 2
TABLE 1-6AGE OF ARCHITECTS ANALYSED BY COUNTRY
* caution - small sample *** Germany figures provided by BAK, sourced from BAK surveys 2015 and 2016.** weighted to reflect the total architectural population in all participating countries.
CHART 1-12POPULATION PYRAMID - ANALYSIS OF ARCHITECTS BY AGE AND GENDER
0 15 20 25
25-29
30-34
35-39
40-44
45-49
50-54
55-59
60-64
65+
per cent males
051015202530
0510152025 0 5 10 15 20 25
25-29
30-34
35-39
40-44
45-49
50-54
55-59
60-64
65+
per cent females
1 - 17The ArchITecTurAl ProfessIon In euroPe 2016

Architect: Aries LtdProject: Pine Beach Elo ReortPhoto: Tamas BujnovszekyPlace: Pakoštane, Croatia

Mirza & Nacey Reserach LtdSouthdown HouseFord Lane, FordArundelWest SussexBN18 0DEUnited Kingdom
Telephone: +44 1243 555302email: [email protected]
MIRZA & NACEY RESEARCH
Registered office: Southdown House, Ford Lane, Ford, Arundel, West Sussex BN18 0DE. Registered in England and Wales. Company No. 04618115
2.1 The consTrucTIon mArkeT In euroPeCHART 2-1ESTIMATED SIzE OF CONSTRUCTION MARKET, EUROPE, 2016
The total value of the European construction market (‘EUROPE - 32’) is estimated to be worth €1 939 billion in 2016. This includes civil engineering and infrastructure work.
As in previous years, four countries - the UK, France, Germany and Italy - account for more than half of Europe’s total construction output. Significant volumes of construction work are also recorded in Spain and the Netherlands. When measured per head of the general population, highest values per head are recorded in Luxembourg, Norway and Switzerland.
0 50 100 150 200 250 300 350Malta
SerbiaCyprusEstonia
LithuaniaLatvia
SloveniaCroatia
BulgariaLuxembourg
HungarySlovakiaGreece
PortugalCzech Republic
IrelandRomania
TurkeyFinland
DenmarkAustriaPolandNorwaySweden
SwitzerlandBelgium
NetherlandsSpain
ItalyGermany
FranceUnited Kingdom
€ 000 million, current prices
Base: all 32 European countriesSource: Mirza & Nacey estimates based on data sourced from Eurostat, Turkstat and Statistical Office of the Republic of Serbia updated using the most recent Eurostat Construction Output Production Indices.
2 - 19The ArchITecTurAl ProfessIon In euroPe 2016

Mirza & Nacey Reserach LtdSouthdown HouseFord Lane, FordArundelWest SussexBN18 0DEUnited Kingdom
Telephone: +44 1243 555302email: [email protected]
MIRZA & NACEY RESEARCH
Registered office: Southdown House, Ford Lane, Ford, Arundel, West Sussex BN18 0DE. Registered in England and Wales. Company No. 04618115
TABLE 2-1SIzE OF CONSTRUCTION MARKET MILLIONS OF EUROS CURRENT PRICES
Source of all data except Turkey and Serbia: Eurostat, National Accounts (NACE 64) - aggregates at current prices. Copyright © Eurostat. All Rights Reserved.
* Data for 2015 (and, in some cases, 2014): Mirza & Nacey estimates derived from the most recent Eurostat Construction Output Production Indices.
** Data for 2016: Mirza & Nacey estimates based on most recent Eurostat Construction Output Production Indices.
(1) Source: Derived from raw data sourced from Statistical Office of the Republic of Serbia. Raw data converted to Euros using conversion rates as at 30.06 each year.
(2) Source: Derived from raw data sourced from TurkStat, the Turkish Statistical Institute. Raw data (not reproduced here) is Copyright © TURKSTAT. Raw data converted from Turkish Lira to Euros using conversion rates as at 30.06 each year.
Construction output includes civil engineering and infrastructure work.
€ million 2006 2007 2008 2009 2010 2011 2012 2013 2014 2015 est * 2016 est **
Austria 37 042 40 603 45 137 43 928 43 654 44 931 46 814 47 257 48 248 48 527 46 745 Belgium 49 307 53 227 58 141 58 062 59 531 66 014 65 947 65 293 68 071 67 793 75 711 Bulgaria 6 363 8 851 11 767 10 397 7 966 7 828 7 764 6 603 7 790 8 003 7 067 Croatia 8 284 8 969 10 425 8 837 6 856 6 410 5 906 5 556 5 914 5 910 6 207 Cyprus 3 903 4 661 5 280 4 152 3 930 3 374 2 786 2 041 1 832 1 835 2 056 Czech Republic 26 523 32 020 36 672 32 024 33 084 32 512 28 949 26 880 26 125 28 460 23 658 Denmark 31 083 32 167 32 470 27 244 25 679 27 394 27 622 27 634 28 270 28 677 31 242 Estonia 3 031 3 780 3 548 2 285 2 025 2 658 3 084 3 178 3 085 2 923 2 768 Finland 25 752 29 703 31 819 27 570 27 998 30 130 30 303 29 728 28 794 29 216 30 558 France 247 409 270 093 283 736 264 335 264 969 279 230 279 221 282 417 275 235 267 244 282 377 Germany 199 117 207 877 221 117 221 003 231 376 251 671 260 057 264 450 274 340 278 365 279 619 Greece 43 009 41 191 34 799 31 780 20 959 16 868 14 960 12 731 11 395 10 866 12 926 Hungary 11 195 11 214 11 880 10 286 9 153 8 663 7 938 8 797 9 788 10 114 7 559 Ireland 47 720 49 642 41 004 16 526 12 096 10 877 14 816 16 949 19 236 20 738 24 200 Italy 261 318 274 065 277 718 257 869 253 789 255 297 229 554 212 194 199 657 199 335 202 126 Latvia 4 919 7 195 7 883 4 456 3 589 4 505 4 835 5 149 5 427 5 364 3 491 Lithuania 4 125 5 778 6 353 3 070 2 754 3 408 3 333 3 782 4 482 4 204 3 479 Luxembourg 4 186 4 868 5 135 4 998 4 859 5 379 5 210 5 416 6 173 6 694 7 284 Malta 716 724 780 781 793 828 842 857 878 1 018 1 043 Netherlands 83 751 91 580 98 935 96 326 87 521 91 131 83 931 79 002 80 232 85 041 100 870 Norway 34 054 41 319 43 746 37 109 40 974 47 973 57 008 57 100 56 496 57 316 61 934 Poland 46 309 59 062 73 104 62 183 77 413 84 485 79 460 75 085 76 333 77 218 61 170 Portugal 33 376 33 510 33 674 30 992 30 333 27 104 20 763 18 284 16 878 16 893 16 342 Romania 16 401 24 548 32 861 26 896 31 491 30 894 30 276 28 193 23 563 31 086 30 014 Serbia (1) n/a n/a n/a n/a n/a 1 953 1 974 1 668 1 744 2 029 1 945 Slovakia 9 019 10 579 14 213 13 918 13 351 13 755 12 775 11 959 12 444 14 636 12 418 Slovenia 6 793 8 733 9 830 8 240 7 084 6 101 5 654 5 285 5 535 5 554 4 339 Spain 364 805 371 031 328 204 281 543 213 668 176 656 143 848 124 258 122 981 124 457 131 177 Sweden 36 720 41 164 40 263 33 516 39 956 43 729 44 906 45 418 46 639 52 717 63 559 Switzerland 36 542 36 152 39 328 42 081 48 034 57 474 60 352 60 878 63 391 72 159 70 218 Turkey (2) 18 184 23 315 23 572 16 958 23 120 24 752 27 160 27 753 27 495 28 737 30 221 United Kingdom 298 934 327 698 282 052 220 015 235 603 241 393 265 030 264 260 295 094 305 900 305 069
EUROPE - 32(€ 000 million) 2 000 2 155 2 145 1 899 1 864 1 905 1 873 1 826 1 854 1 899 1 939
FUTURE YEARS - ENSURE THIS TABLE IS CONSISTENT WITH TABLES IN THE COUNTRY PROFILES - HISTORIC DATA NEEDS TO BE UPDATED
2 - 20The ArchITecTurAl ProfessIon In euroPe 2016

Mirza & Nacey Reserach LtdSouthdown HouseFord Lane, FordArundelWest SussexBN18 0DEUnited Kingdom
Telephone: +44 1243 555302email: [email protected]
MIRZA & NACEY RESEARCH
Registered office: Southdown House, Ford Lane, Ford, Arundel, West Sussex BN18 0DE. Registered in England and Wales. Company No. 04618115
CHART 2-3CHANGES IN CONSTRUCTION OUTPUT, 2014 TO 2016
CHART 2-2CHANGE IN CONSTRUCTION OUTPUT IN EUROPE-32, 2006 TO 2016
Base for both map above and chart left: all 32 European countriesSource: Mirza & Nacey estimates based on data sourced from Eurostat, Turkstat and Statistical Office of the Republic of Serbia updated using the most recent Eurostat Construction Output Production Indices.
Construction output in Europe-32 has started to rise, very gradually, in the last four years. Whilst still a way short of the 2007-08 peak values, construction output is trending up. The rise between 2014 and 2016 is 5 per cent. The map, chart 2-3, shows a striking pattern of little or no change between 2014 and 2016 in several central European countries notably France, Germany and Italy; growth in countries on the northern, western and southern periphery of Europe; and falls in much of Eastern Europe. There are exceptions; construction output in Portugal continues to fall while Romania bucks the trend in the east to record rising values.
€ 00
0 m
illio
n, c
urre
nt p
rices
0
500
1000
1500
2000
2500
1615141312111009080706
2 - 21The ArchITecTurAl ProfessIon In euroPe 2016

Mirza & Nacey Reserach LtdSouthdown HouseFord Lane, FordArundelWest SussexBN18 0DEUnited Kingdom
Telephone: +44 1243 555302email: [email protected]
MIRZA & NACEY RESEARCH
Registered office: Southdown House, Ford Lane, Ford, Arundel, West Sussex BN18 0DE. Registered in England and Wales. Company No. 04618115
construction output (estimated € million)
population (number as at 01.01.2016)
construction output per head of population (€)
architects (estimated number)
Austria 46 745 8 700 471 5 373 5 200 Belgium 75 711 11 289 853 6 706 15 100 Bulgaria 7 067 7 153 784 988 2 000 Croatia 6 207 4 190 669 1 481 2 200 Cyprus 2 056 848 319 2 424 950 Czech Republic 23 658 10 553 843 2 242 8 300 Denmark 31 242 5 707 251 5 474 10 000 Estonia 2 768 1 315 944 2 104 800 Finland 30 558 5 487 308 5 569 3 500 France 282 377 66 661 621 4 236 30 000 Germany 279 619 82 162 000 3 403 109 200 Greece 12 926 10 793 526 1 198 18 200 Hungary 7 559 9 830 485 769 4 200 Ireland 24 200 4 658 530 5 195 2 500 Italy 202 126 60 665 551 3 332 157 000 Latvia 3 491 1 968 957 1 773 900 Lithuania 3 479 2 888 558 1 204 1 350 Luxembourg 7 284 576 249 12 641 950 Malta 1 043 434 403 2 401 650 Netherlands 100 870 16 979 120 5 941 11 200 Norway 61 934 5 213 985 11 878 3 740 Poland 61 170 37 967 209 1 611 14 000 Portugal 16 342 10 341 330 1 580 22 200 Romania 30 014 19 759 968 1 519 7 600 Serbia 1 945 7 076 372 275 8 000 Slovakia 12 418 5 426 252 2 288 1 650 Slovenia 4 339 2 064 188 2 102 1 350 Spain 131 177 46 438 422 2 825 53 800 Sweden 63 559 9 851 017 6 452 6 550 Switzerland 70 218 8 325 194 8 434 7 300 Turkey 30 221 78 741 053 384 50 000 United Kingdom 305 069 65 341 183 4 669 36 700
EUROPE - 32 - 2016 1 939 393 609 412 615 3 182 598 700
TABLE 2-2ESTIMATED SIzE OF CONSTRUCTION MARKET, 2016 BY COUNTRY, AND COMPARATIVE VALUES
Source: Construction output and population data - Eurostat Copyright © Eurostat. All Rights Reserved. Data for Serbia was sourced from Statistical Office of the Republic of Serbia. Data for Turkey derived from raw data from Turkstat. In both cases data has been converted to Euros using historical exchange rates as at mid year. Data for 2016 are Mirza & Nacey estimates based on most recent Eurostat Construction Output Production Indices. The total for EUROPE-32 is Mirza & Nacey estimate.
Construction output includes civil engineering and infrastructure work.
2 - 22The ArchITecTurAl ProfessIon In euroPe 2016
Mirza & Nacey Reserach LtdSouthdown HouseFord Lane, FordArundelWest SussexBN18 0DEUnited Kingdom
Telephone: +44 1243 555302email: [email protected]
MIRZA & NACEY RESEARCH
Registered office: Southdown House, Ford Lane, Ford, Arundel, West Sussex BN18 0DE. Registered in England and Wales. Company No. 04618115
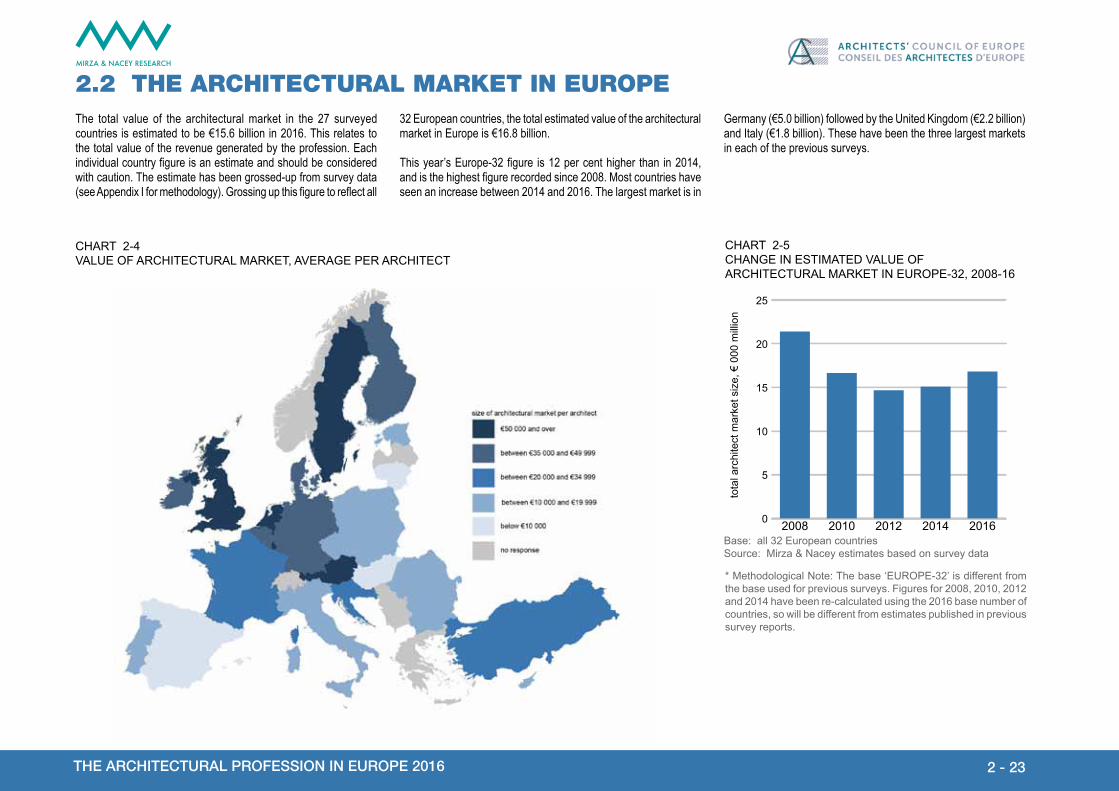
2.2 The ArchITecTurAl mArkeT In euroPe
CHART 2-4VALUE OF ARCHITECTURAL MARKET, AVERAGE PER ARCHITECT
The total value of the architectural market in the 27 surveyed countries is estimated to be €15.6 billion in 2016. This relates to the total value of the revenue generated by the profession. Each individual country figure is an estimate and should be considered with caution. The estimate has been grossed-up from survey data (see Appendix I for methodology). Grossing up this figure to reflect all
CHART 2-5CHANGE IN ESTIMATED VALUE OF ARCHITECTURAL MARKET IN EUROPE-32, 2008-16
0
5
10
15
20
25
20162014201220102008
tota
l arc
hite
ct m
arke
t siz
e, €
000
mill
ion
32 European countries, the total estimated value of the architectural market in Europe is €16.8 billion.
This year’s Europe-32 figure is 12 per cent higher than in 2014, and is the highest figure recorded since 2008. Most countries have seen an increase between 2014 and 2016. The largest market is in
Germany (€5.0 billion) followed by the United Kingdom (€2.2 billion) and Italy (€1.8 billion). These have been the three largest markets in each of the previous surveys.
Base: all 32 European countriesSource: Mirza & Nacey estimates based on survey data
* Methodological Note: The base ‘EUROPE-32’ is different from the base used for previous surveys. Figures for 2008, 2010, 2012 and 2014 have been re-calculated using the 2016 base number of countries, so will be different from estimates published in previous survey reports.
2 - 23The ArchITecTurAl ProfessIon In euroPe 2016

Mirza & Nacey Reserach LtdSouthdown HouseFord Lane, FordArundelWest SussexBN18 0DEUnited Kingdom
Telephone: +44 1243 555302email: [email protected]
MIRZA & NACEY RESEARCH
Registered office: Southdown House, Ford Lane, Ford, Arundel, West Sussex BN18 0DE. Registered in England and Wales. Company No. 04618115
CHART 2-6ESTIMATED VALUE OF ARCHITECTURAL MARKET
market size
(€000s)
value per architect
(€)
value per 1000
population (€)
architectural market as per cent
construction
2014 market
size (€000s)
2012 market
size (€000s)
2010 market
size (€000s)
2008 market
size (€000s)
Austria 279 307 53 713 32 103 0.6 281 241 262 774 256 292 296 789Belgium 610 346 40 420 54 062 0.8 436 306 529 292 556 280 327 108Bulgaria 36 905 18 452 5 159 0.5 20 358 26 792 46 116 n/aCroatia 54 841 24 928 13 086 0.9 44 798 50 235 64 290 n/aCyprus * 17 859 18 799 21 053 0.9 n/a n/a n/a n/aCzech Republic * 92 210 11 110 8 737 0.4 139 458 153 433 73 045 n/aDenmark 482 321 48 232 84 510 1.5 392 062 447 607 308 697 356 228Estonia * 14 396 17 995 10 940 0.5 16 330 29 277 12 667 27 524Finland 178 017 50 862 32 442 0.6 133 689 161 704 117 456 42 580France 984 215 32 807 14 764 0.3 907 837 1 254 376 1 301 699 1 103 778Germany 5 015 212 45 927 61 041 1.8 5 047 349 4 192 657 4 094 601 3 988 103Hungary 33 267 7 921 3 384 0.4 n/a 60,566 n/a n/aIreland 110 600 44 240 23 741 0.5 90 682 112 102 172 362 408 855Italy 1 758 087 11 198 28 980 0.9 1 916 761 2 775 280 2 708 910 n/aLithuania 10 641 7 882 3 684 0.3 n/a 9,676 11,455 n/aLuxembourg 68 308 71 903 118 538 0.9 49 361 38 264 n/a 31 828Malta * 9 659 14 860 22 234 0.9 13 050 15 565 n/a 13 320Netherlands 939 867 83 917 55 354 0.9 910 000 807 000 976 000 902 000Poland 212 481 15 177 5 596 0.3 n/a 210,575 258,803 n/aPortugal 276 051 12 435 26 694 1.7 176 636 261 110 n/a n/aRomania * 76 954 10 126 3 894 0.3 79 471 90 111 63 551 112 659Slovakia 22 058 13 368 4 065 0.2 15 211 n/a 41 000 n/aSlovenia 35 700 26 440 17 295 0.8 24 874 42 110 10 359 40 501Spain 461 124 8 571 9 930 0.4 332 999 336 420 n/a n/aSweden 470 484 71 830 47 760 0.7 347 110 330 785 356 300 145 073Turkey 1 182 989 23 660 15 024 3.9 888 440 856 591 960 371 726 778United Kingdom 2 169 202 59 106 33 198 0.7 1 978 835 2 006 403 1 955 929 2 800 0422016 EUROPE-27 15 603 101 27 300 26 651 0.9
2014 EUROPE-26 14 340 253 26 109 27 176 0.9 14 340 2532012 EUROPE-25 14 424 668 27 770 25 870 1.0 14 424 6682010 EUROPE-23 14 636 411 33 253 28 716 1.1 14 636 4112008 EUROPE-17 11 616 874 45 405 31 017 1.1 11 616 874
‘Market size’ refers to the architectural market as measured as the sum of the revenue earned by private architectural practices in each country. Data refers to 2015/16. The market size has been estimated, see Appendix for an explanation of the methodology.* caution - small sample
TABLE 2-3ESTIMATED SIzE OF ARCHITECTURAL MARKET 2016, BY COUNTRY, AND COMPARATIVE VALUES
0 500 1000 1500 2000 2500 3000 3500 4000 4500 5000 5500
Malta
Lithuania
Estonia
Cyprus
Slovakia
Hungary
Slovenia
Bulgaria
Croatia
Luxembourg
Romania
Czech Republic
Ireland
Finland
Poland
Portugal
Austria
Spain
Sweden
Denmark
Belgium
Netherlands
France
Turkey
Italy
United Kingdom
Germany
€ million
2 - 24The ArchITecTurAl ProfessIon In euroPe 2016
Mirza & Nacey Reserach LtdSouthdown HouseFord Lane, FordArundelWest SussexBN18 0DEUnited Kingdom
Telephone: +44 1243 555302email: [email protected]
MIRZA & NACEY RESEARCH
Registered office: Southdown House, Ford Lane, Ford, Arundel, West Sussex BN18 0DE. Registered in England and Wales. Company No. 04618115
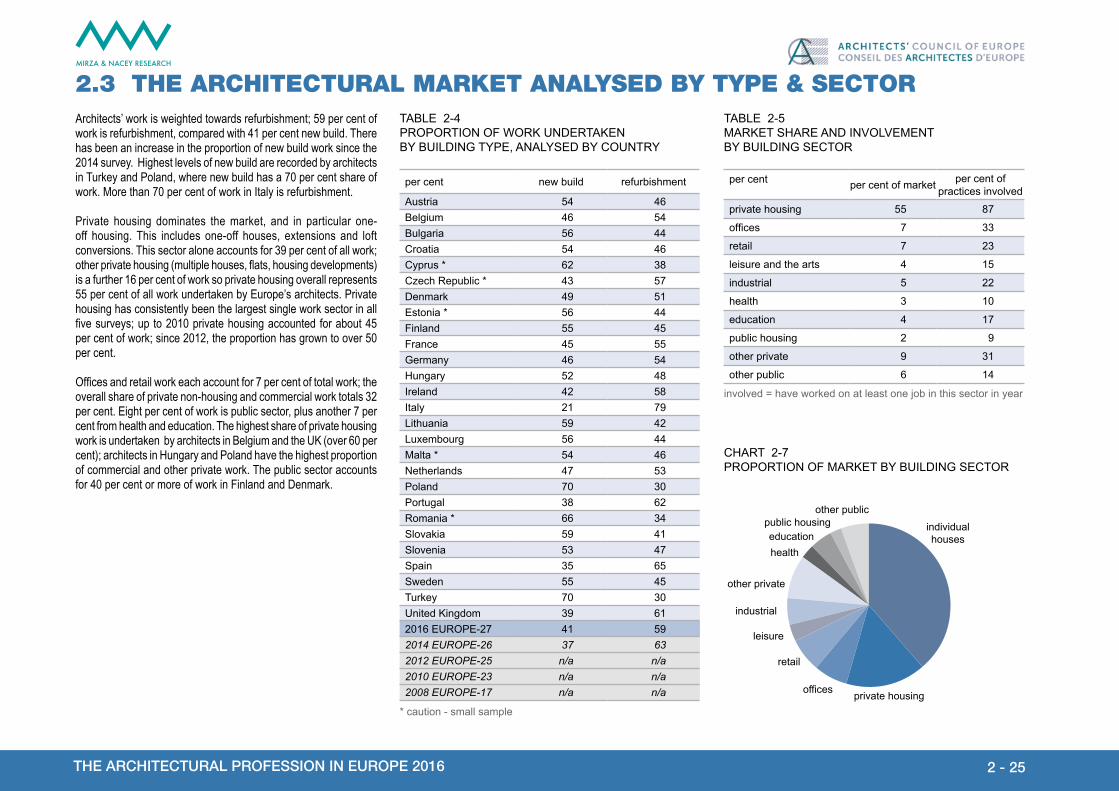
2.3 The ArchITecTurAl mArkeT AnAlysed by TyPe & secTor
per cent per cent of market per cent of practices involved
private housing 55 87
offices 7 33
retail 7 23
leisure and the arts 4 15
industrial 5 22
health 3 10
education 4 17
public housing 2 9
other private 9 31
other public 6 14
other publicpublic housingeducationhealth
other private
industrial
leisure
retail
offices private housing
individualhouses
Architects’ work is weighted towards refurbishment; 59 per cent of work is refurbishment, compared with 41 per cent new build. There has been an increase in the proportion of new build work since the 2014 survey. Highest levels of new build are recorded by architects in Turkey and Poland, where new build has a 70 per cent share of work. More than 70 per cent of work in Italy is refurbishment.
Private housing dominates the market, and in particular one-off housing. This includes one-off houses, extensions and loft conversions. This sector alone accounts for 39 per cent of all work; other private housing (multiple houses, flats, housing developments) is a further 16 per cent of work so private housing overall represents 55 per cent of all work undertaken by Europe’s architects. Private housing has consistently been the largest single work sector in all five surveys; up to 2010 private housing accounted for about 45 per cent of work; since 2012, the proportion has grown to over 50 per cent.
Offices and retail work each account for 7 per cent of total work; the overall share of private non-housing and commercial work totals 32 per cent. Eight per cent of work is public sector, plus another 7 per cent from health and education. The highest share of private housing work is undertaken by architects in Belgium and the UK (over 60 per cent); architects in Hungary and Poland have the highest proportion of commercial and other private work. The public sector accounts for 40 per cent or more of work in Finland and Denmark.
TABLE 2-4PROPORTION OF WORK UNDERTAKEN BY BUILDING TYPE, ANALYSED BY COUNTRY
CHART 2-7PROPORTION OF MARKET BY BUILDING SECTOR
per cent new build refurbishment
Austria 54 46Belgium 46 54Bulgaria 56 44Croatia 54 46Cyprus * 62 38Czech Republic * 43 57Denmark 49 51Estonia * 56 44Finland 55 45France 45 55Germany 46 54Hungary 52 48Ireland 42 58Italy 21 79Lithuania 59 42Luxembourg 56 44Malta * 54 46Netherlands 47 53Poland 70 30Portugal 38 62Romania * 66 34Slovakia 59 41Slovenia 53 47Spain 35 65Sweden 55 45Turkey 70 30United Kingdom 39 612016 EUROPE-27 41 592014 EUROPE-26 37 632012 EUROPE-25 n/a n/a2010 EUROPE-23 n/a n/a2008 EUROPE-17 n/a n/a
TABLE 2-5MARKET SHARE AND INVOLVEMENT BY BUILDING SECTOR
* caution - small sample
involved = have worked on at least one job in this sector in year
2 - 25The ArchITecTurAl ProfessIon In euroPe 2016

Mirza & Nacey Reserach LtdSouthdown HouseFord Lane, FordArundelWest SussexBN18 0DEUnited Kingdom
Telephone: +44 1243 555302email: [email protected]
MIRZA & NACEY RESEARCH
Registered office: Southdown House, Ford Lane, Ford, Arundel, West Sussex BN18 0DE. Registered in England and Wales. Company No. 04618115
CHART 2-8 PROPORTION OF WORK UNDERTAKEN IN EACH MAIN BUILDING SECTOR, RANKED IN ORDER OF HIGHEST PRIVATE HOUSING WORK per cent
indi
vidu
al
hous
es,
exte
nsio
ns,
loft
conv
ersi
ons
priv
ate
hous
ing
offic
es
reta
il
leis
ure
indu
stria
l
heal
th
educ
atio
n
publ
ic h
ousi
ng
othe
r priv
ate
othe
r pub
lic
TOTA
L
Austria 30 13 7 4 3 5 5 7 13 5 8 100Belgium 54 13 4 4 1 5 3 4 5 3 4 100Bulgaria 37 18 5 7 2 13 1 2 4 4 6 100Croatia 36 17 5 2 5 5 2 6 1 10 13 100Cyprus * 42 4 4 1 8 7 3 6 0 19 7 100Czech Republic * 49 10 5 2 3 7 6 3 1 4 10 100Denmark 16 8 14 3 7 4 7 12 7 8 12 100Estonia * 40 9 7 2 6 10 0 8 1 7 10 100Finland 20 12 7 4 4 2 8 9 11 7 16 100France 36 14 7 5 4 4 5 6 6 5 9 100Germany 32 21 10 3 5 7 3 7 2 9 0 100Hungary 26 11 6 6 8 16 1 7 0 8 11 100Ireland 46 8 7 8 4 3 6 7 1 8 3 100Italy 42 16 5 8 2 4 1 2 1 12 8 100Lithuania 35 12 10 4 4 9 2 2 2 11 8 100Luxembourg 37 14 11 4 2 3 2 9 5 7 8 100Malta * 38 10 26 8 0 2 0 1 0 5 10 100Netherlands 38 10 3 3 4 6 5 8 6 7 12 100Poland 15 22 10 5 3 13 7 3 3 13 6 100Portugal 45 11 4 12 5 6 2 3 1 7 4 100Romania * 32 11 12 9 3 10 6 6 3 4 5 100Slovakia 37 10 10 5 4 6 3 4 8 5 7 100Slovenia 44 6 16 2 3 4 3 8 1 3 10 100Spain 46 14 5 12 2 2 2 3 1 9 5 100Sweden 15 10 13 6 7 4 4 9 8 11 13 100Turkey 37 18 7 11 3 6 2 3 2 5 6 100United Kingdom 52 13 4 4 5 2 4 6 2 5 3 1002016 EUROPE-27 39 16 7 7 4 5 3 4 2 9 6 1002014 EUROPE-26 40 13 6 6 3 6 3 5 3 7 9 1002012 EUROPE-25 42 9 6 6 3 5 2 4 3 9 11 1002010 EUROPE-23 30 14 8 5 4 6 4 6 6 7 10 1002008 EUROPE-17 31 14 10 5 3 8 4 6 4 7 10 100
TABLE 2-6PROPORTION OF WORK UNDERTAKEN BY BUILDING SECTOR, ANALYSED BY COUNTRY
* caution - small sample
per cent total market0 20 40 60 80 100
publiccommercial &other private
privatehousing
Denmark
Sweden
Finland
Poland
Hungary
Austria
Romania
Cyprus
Slovakia
Malta
Netherlands
Lithuania
Estonia
France
Slovenia
Luxembourg
Croatia
Germany
Ireland
Bulgaria
Turkey
Portugal
Italy
Czech Republic
Spain
United Kingdom
Belgium
2 - 26The ArchITecTurAl ProfessIon In euroPe 2016

Mirza & Nacey Reserach LtdSouthdown HouseFord Lane, FordArundelWest SussexBN18 0DEUnited Kingdom
Telephone: +44 1243 555302email: [email protected]
MIRZA & NACEY RESEARCH
Registered office: Southdown House, Ford Lane, Ford, Arundel, West Sussex BN18 0DE. Registered in England and Wales. Company No. 04618115
per cent
indi
vidu
als
deve
lope
r
limite
d co
mpa
ny o
r co
rpor
atio
n (P
LC)
cent
ral
gove
rnm
ent
loca
l go
vern
men
t
othe
r pub
lic
othe
r pr
ivat
e
TOTA
L
Austria 44 10 16 14 8 3 6 100Belgium 62 13 6 2 7 7 3 100Bulgaria 42 19 16 2 11 5 5 100Croatia 46 1 27 2 17 4 2 100Cyprus * 56 20 9 2 4 8 1 100Czech Republic* 64 3 8 2 8 12 3 100Denmark 25 10 16 11 18 11 10 100Estonia * 53 10 7 4 21 2 4 100Finland 23 16 17 5 16 20 3 100France 45 10 10 1 11 12 9 100Germany 52 8 16 4 11 0 8 100Hungary 36 10 20 2 16 7 1 100Ireland 52 11 15 5 4 6 7 100Italy 59 8 13 1 5 6 8 100Lithuania 52 11 19 4 7 3 5 100Luxembourg 46 20 5 9 9 8 4 100Malta * 39 30 19 6 0 6 0 100Netherlands 46 15 4 3 8 11 13 100Poland 16 29 29 1 18 6 1 100Portugal 50 14 19 1 5 4 6 100Romania * 50 13 17 4 8 5 3 100Slovakia 45 18 17 3 11 2 4 100Slovenia 57 4 17 7 9 4 1 100Spain 64 7 12 1 7 4 5 100Sweden 17 15 29 9 13 13 4 100Turkey 41 13 27 4 3 5 5 100United Kingdom 50 17 11 3 3 11 6 1002016 EUR-27 52 10 15 3 8 6 7 1002014 EUR-26 50 8 18 4 8 6 6 1002012 EUR-25 45 11 19 2 8 8 6 1002010 EUR-23 41 12 18 4 10 9 6 1002008 EUR-17 47 10 14 6 9 7 7 100
2.4 The ArchITecTurAl mArkeT AnAlysed by TyPe of clIenT
CHART 2-9PROPORTION OF MARKET BY CLIENT TYPE
others
other public
local authority
government
limited company orcorporation
developer
privateindividual
Just over half of architects’ work is for Individual clients, a proportion which has been increasing steadily since 2010. Public sector clients account for 17 per cent of work, similar to the level recorded in the last three surveys but lower than in 2008 and 2010. Fifteen per cent of clients are limited companies or PLCs, while 10 per cent of work is generated by developers.
TABLE 2-8PROPORTION OF WORK UNDERTAKEN FOR DIFFERENT CLIENTS, ANALYSED BY COUNTRY
* caution - small sample
per cent per cent of market per cent of practices involved
individuals 52 87
developer 10 33
limited company / PLC 15 23
central government 3 15
local government 8 22
other public 6 10
other private 7 17
TABLE 2-7MARKET SHARE AND INVOLVEMENT BY CLIENT TYPE
involved = have worked for at least one of these clients in year
2 - 27The ArchITecTurAl ProfessIon In euroPe 2016
Mirza & Nacey Reserach LtdSouthdown HouseFord Lane, FordArundelWest SussexBN18 0DEUnited Kingdom
Telephone: +44 1243 555302email: [email protected]
MIRZA & NACEY RESEARCH
Registered office: Southdown House, Ford Lane, Ford, Arundel, West Sussex BN18 0DE. Registered in England and Wales. Company No. 04618115
per cent
build
ing
desi
gn
land
scap
e de
sign
inte
rior
desi
gn
feas
ibili
ty
stud
ies
proj
ect
man
agem
ent
plan
ning
certi
ficat
ion
prop
erty
va
luat
ion
othe
r se
rvic
e
TOTA
L
Austria 73 1 6 5 3 2 4 1 5 100Belgium 75 1 7 4 5 2 1 1 6 100Bulgaria 70 1 9 5 4 6 0 1 3 100Croatia 59 4 10 0 5 9 6 1 6 100Cyprus * 52 2 11 3 4 2 10 1 14 100Czech Republic * 71 8 8 0 7 1 0 0 5 100Denmark 47 5 8 2 10 8 3 2 15 100Estonia * 82 1 3 1 1 6 2 0 3 100Finland 67 2 6 3 3 9 0 0 8 100France 70 1 8 8 5 2 0 0 6 100Germany 86 1 4 0 1 2 2 1 4 100Hungary 49 1 3 1 6 3 22 2 14 100Ireland 67 3 6 5 6 1 4 0 9 100Italy 41 3 19 4 6 3 5 5 14 100Lithuania 57 5 15 2 8 6 0 0 5 100Luxembourg 71 1 5 5 7 7 1 1 3 100Malta * 45 2 7 1 15 0 3 17 10 100Netherlands 60 2 12 6 6 3 0 0 10 100Poland 74 0 8 1 2 9 0 0 4 100Portugal 53 1 14 4 6 7 5 2 7 100Romania * 66 1 6 7 4 12 0 0 4 100Slovakia 59 6 14 3 6 8 0 0 4 100Slovenia 56 3 13 10 9 6 1 0 2 100Spain 59 1 5 2 3 4 9 4 13 100Sweden 67 2 8 5 4 10 1 0 4 100Turkey 63 3 14 2 8 3 1 1 6 100United Kingdom 69 2 6 8 2 3 2 0 8 1002016 EUR-27 62 2 11 3 4 3 3 2 9 1002014 EUR-26 57 3 11 4 5 4 4 2 11 1002012 EUR-25 50 2 14 6 7 6 n/a n/a 16 1002010 EUR-23 69 2 8 4 6 7 n/a n/a 4 1002008 EUR-17 66 3 9 3 5 4 n/a n/a 9 100
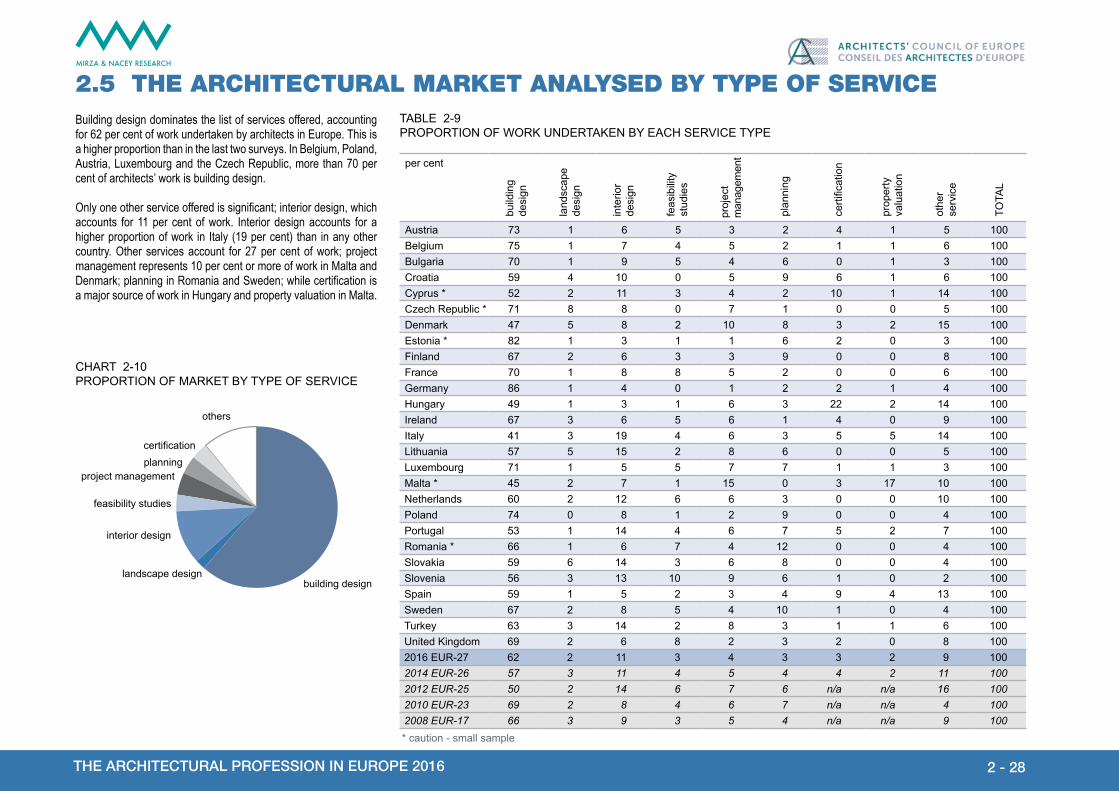
2.5 The ArchITecTurAl mArkeT AnAlysed by TyPe of servIce
CHART 2-10PROPORTION OF MARKET BY TYPE OF SERVICE
others
certificationplanning
project management
feasibility studies
interior design
landscape designbuilding design
Building design dominates the list of services offered, accounting for 62 per cent of work undertaken by architects in Europe. This is a higher proportion than in the last two surveys. In Belgium, Poland, Austria, Luxembourg and the Czech Republic, more than 70 per cent of architects’ work is building design.
Only one other service offered is significant; interior design, which accounts for 11 per cent of work. Interior design accounts for a higher proportion of work in Italy (19 per cent) than in any other country. Other services account for 27 per cent of work; project management represents 10 per cent or more of work in Malta and Denmark; planning in Romania and Sweden; while certification is a major source of work in Hungary and property valuation in Malta.
TABLE 2-9PROPORTION OF WORK UNDERTAKEN BY EACH SERVICE TYPE
* caution - small sample
2 - 28The ArchITecTurAl ProfessIon In euroPe 2016

Mirza & Nacey Reserach LtdSouthdown HouseFord Lane, FordArundelWest SussexBN18 0DEUnited Kingdom
Telephone: +44 1243 555302email: [email protected]
MIRZA & NACEY RESEARCH
Registered office: Southdown House, Ford Lane, Ford, Arundel, West Sussex BN18 0DE. Registered in England and Wales. Company No. 04618115
2.6 fuTure ProsPecTsThe mood amongst architects is distinctly more positive than it has been in any of the previous surveys. The ‘balance’ figure of +8 represents the difference between the proportion of architects who expect an increase in their workloads and the proportion who expect workloads to fall. The relatively modest balance figure - albeit the highest since the survey began in 2008 - disguises the fact that
CHART 2-12WORKLOAD PREDICTIONS FOR 2017
CHART 2-11CHANGE IN WORKLOAD PREDICTIONS (BALANCE FIGURE).ALL SURVEY COUNTRIES, 2008-16 SURVEYS (workload predictions made in survey year for the following year)
-15
-10
-5
0
5
10
15
20162014201220102008
‘bal
ance
’ fig
ure
18 out of 27 countries record positive ‘balance’ figures of +15 or more. Furthermore, only two countries record a negative ‘balance’ figure this year.
Those two negative countries are Italy (‘balance’ figure of -13) and the UK (-5). The negative prospects for the UK probably
reflect uncertainty in the lead up to Brexit. Neighbouring Ireland, by contrast, reports the highest positive ‘balance’ figure, of +59. Ireland’s’ balance figure is well ahead of that in any other country; the next highest balance figures are in the mid thirties, reported by architects in Malta, Romania and Slovakia, followed by a balance of around +30 in Sweden and the Netherlands.
The ‘balance’ statistic is calculated by subtracting the per cent of respondents who predict workloads will fall, from those who predict a rise
2 - 29The ArchITecTurAl ProfessIon In euroPe 2016

Mirza & Nacey Reserach LtdSouthdown HouseFord Lane, FordArundelWest SussexBN18 0DEUnited Kingdom
Telephone: +44 1243 555302email: [email protected]
MIRZA & NACEY RESEARCH
Registered office: Southdown House, Ford Lane, Ford, Arundel, West Sussex BN18 0DE. Registered in England and Wales. Company No. 04618115
per cent per cent of Principals who expect their practice workloads to change over the coming 12 months
balance**
up no change downAustria 26 49 25 +1Belgium 30 52 18 +12Bulgaria 35 51 14 +22Croatia 37 50 13 +23Cyprus * 24 59 18 +6Czech Republic * 19 63 19 0Denmark 38 49 13 +24Estonia * 35 39 26 +9Finland 36 55 10 +26France 34 43 23 +10Germany 32 51 16 +16Hungary 43 43 14 +29Ireland 65 28 7 +59Italy 20 46 33 -13Lithuania 29 58 13 +16Luxembourg 27 61 12 +16Malta * 36 64 0 +36Netherlands 41 48 11 +30Poland 25 68 7 +18Portugal 38 41 21 +16Romania * 46 42 12 +35Slovakia 42 51 7 +35Slovenia 36 43 21 +14Spain 39 46 15 +23Sweden 42 48 10 +32Turkey 41 32 27 +15United Kingdom 27 41 32 -52016 EUROPE-27 31 46 23 +82014 EUROPE-26 28 47 25 +32012 EUROPE-25 21 43 35 -142010 EUROPE-23 24 44 32 -82008 EUROPE-17 28 45 28 0
TABLE 2-10FUTURE WORKLOAD PROSPECTS FOR 2017, ANALYSED BY COUNTRY
CHART 2-13FUTURE WORKLOAD PROSPECTS FOR 2017, ANALYSED BY SIzE OF PRACTICE
* caution - small sample ** The ‘balance’ statistic is calculated by subtracting the per cent of respondents who predict workloads will fall, from those who predict a rise
per cent respondents0 20 40 60 80 100
decrease
no change
increase
over 50 staff
31 to 50 staff
11 to 30 staff
6 to 10 staff
3 to 5 staff
2 staff
1 staff
decreaseno changeincrease
2 - 30The ArchITecTurAl ProfessIon In euroPe 2016

Architect: Vojko PavcicProject: Cultural and Administration CentrePhoto: Miran KambicPlace: Sv. Jurij ob Ščavnici, Slovenia

Mirza & Nacey Reserach LtdSouthdown HouseFord Lane, FordArundelWest SussexBN18 0DEUnited Kingdom
Telephone: +44 1243 555302email: [email protected]
MIRZA & NACEY RESEARCH
Registered office: Southdown House, Ford Lane, Ford, Arundel, West Sussex BN18 0DE. Registered in England and Wales. Company No. 04618115
CHART 3-2AVERAGE SIzE OF ARCHITECTURAL PRACTICES
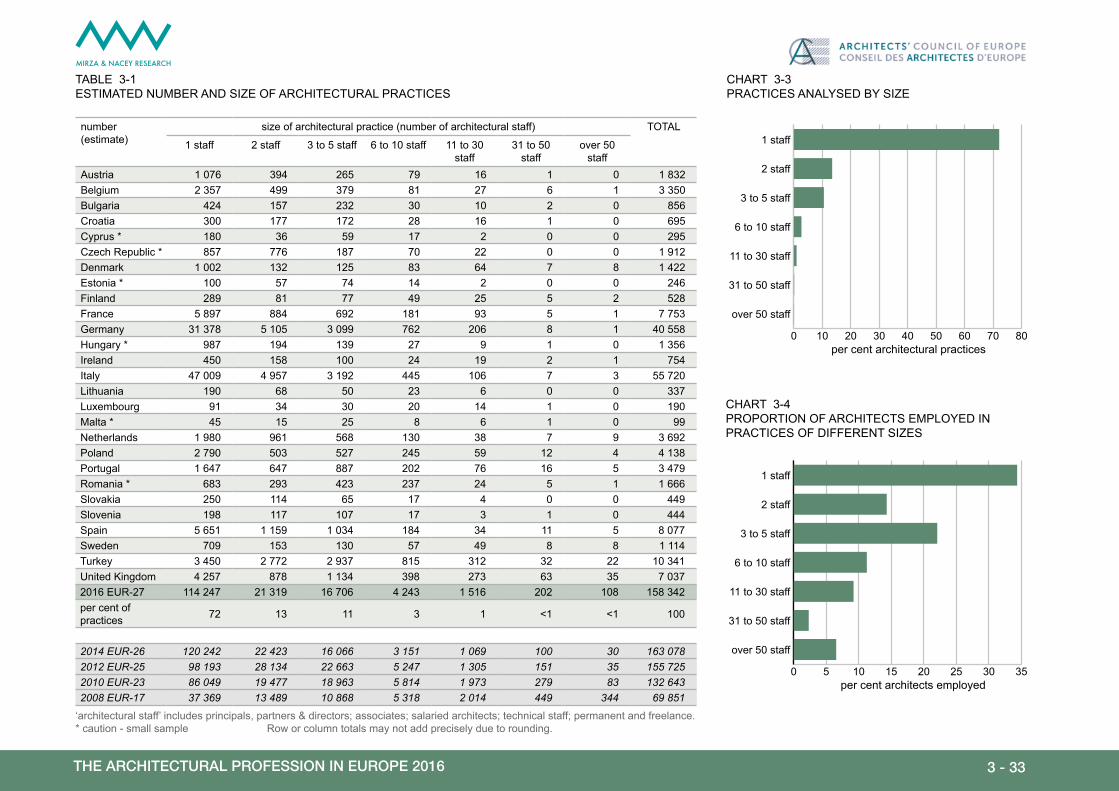
3.1 ProfIle of ArchITecTurAl PrAcTIcesThe number of private architectural practices in EUROPE-27 is estimated to be 158 300. This figure has been estimated by creating a model and then inserting data from the survey. The model is described in Appendix I. Grossing-up this figure to reflect all 32 European countries produces an estimate of 170 000 private architectural practices in Europe, a little lower than the 2014 estimate. Nearly three quarters of all architectural practices in Europe comprise one person. However, this year there appears to have been a change in the number of architects employed in
* Methodological Note: The base ‘EUROPE-32’ is different from the base used for previous surveys. Figures for 2008, 2010, 2012 and 2014 have been re-calculated using the 2016 base number of countries, so will be different from estimates published in previous survey reports.
0
50
100
150
200
20162014201220102008
tota
l num
ber o
f arc
hite
ctur
al p
ract
ices
, 000
s
large practices. More respondents in three countries in particular - Sweden, Denmark, Finland - are working in large practices than previously.
This has lead to a reduction in the number of one and two person practices in these countries. A small reduction in one and two person practices is evident across much of Europe, resulting in a net drop in the total number of practices between 2014 and 2016. The number of practices is higher in only two countries; Spain and Turkey.
CHART 3-1CHANGE IN ESTIMATED NUMBER OF PRACTICES IN EUROPE-32, 2008-16
The information in this section is based on the questionnaires completed by Principals. These include Sole Principals, Freelancers, and Partners & Directors in Private Practice.
3 - 32The ArchITecTurAl ProfessIon In euroPe 2016
Mirza & Nacey Reserach LtdSouthdown HouseFord Lane, FordArundelWest SussexBN18 0DEUnited Kingdom
Telephone: +44 1243 555302email: [email protected]
MIRZA & NACEY RESEARCH
Registered office: Southdown House, Ford Lane, Ford, Arundel, West Sussex BN18 0DE. Registered in England and Wales. Company No. 04618115
TABLE 3-1ESTIMATED NUMBER AND SIzE OF ARCHITECTURAL PRACTICES
per cent architects employed0 5 10 15 20 25 30 35
over 50 staff
31 to 50 staff
11 to 30 staff
6 to 10 staff
3 to 5 staff
2 staff
1 staff
per cent architectural practices0 10 20 30 40 50 60 70 80
over 50 staff
31 to 50 staff
11 to 30 staff
6 to 10 staff
3 to 5 staff
2 staff
1 staffnumber (estimate)
size of architectural practice (number of architectural staff) TOTAL
1 staff 2 staff 3 to 5 staff 6 to 10 staff 11 to 30 staff
31 to 50 staff
over 50 staff
Austria 1 076 394 265 79 16 1 0 1 832 Belgium 2 357 499 379 81 27 6 1 3 350 Bulgaria 424 157 232 30 10 2 0 856 Croatia 300 177 172 28 16 1 0 695 Cyprus * 180 36 59 17 2 0 0 295 Czech Republic * 857 776 187 70 22 0 0 1 912 Denmark 1 002 132 125 83 64 7 8 1 422 Estonia * 100 57 74 14 2 0 0 246 Finland 289 81 77 49 25 5 2 528 France 5 897 884 692 181 93 5 1 7 753 Germany 31 378 5 105 3 099 762 206 8 1 40 558 Hungary * 987 194 139 27 9 1 0 1 356 Ireland 450 158 100 24 19 2 1 754 Italy 47 009 4 957 3 192 445 106 7 3 55 720 Lithuania 190 68 50 23 6 0 0 337 Luxembourg 91 34 30 20 14 1 0 190 Malta * 45 15 25 8 6 1 0 99 Netherlands 1 980 961 568 130 38 7 9 3 692 Poland 2 790 503 527 245 59 12 4 4 138 Portugal 1 647 647 887 202 76 16 5 3 479 Romania * 683 293 423 237 24 5 1 1 666 Slovakia 250 114 65 17 4 0 0 449 Slovenia 198 117 107 17 3 1 0 444 Spain 5 651 1 159 1 034 184 34 11 5 8 077 Sweden 709 153 130 57 49 8 8 1 114 Turkey 3 450 2 772 2 937 815 312 32 22 10 341 United Kingdom 4 257 878 1 134 398 273 63 35 7 037 2016 EUR-27 114 247 21 319 16 706 4 243 1 516 202 108 158 342 per cent of practices 72 13 11 3 1 <1 <1 100
2014 EUR-26 120 242 22 423 16 066 3 151 1 069 100 30 163 0782012 EUR-25 98 193 28 134 22 663 5 247 1 305 151 35 155 725 2010 EUR-23 86 049 19 477 18 963 5 814 1 973 279 83 132 643 2008 EUR-17 37 369 13 489 10 868 5 318 2 014 449 344 69 851
CHART 3-3PRACTICES ANALYSED BY SIzE
CHART 3-4PROPORTION OF ARCHITECTS EMPLOYED IN PRACTICES OF DIFFERENT SIzES
‘architectural staff’ includes principals, partners & directors; associates; salaried architects; technical staff; permanent and freelance.* caution - small sample Row or column totals may not add precisely due to rounding.
3 - 33The ArchITecTurAl ProfessIon In euroPe 2016

Mirza & Nacey Reserach LtdSouthdown HouseFord Lane, FordArundelWest SussexBN18 0DEUnited Kingdom
Telephone: +44 1243 555302email: [email protected]
MIRZA & NACEY RESEARCH
Registered office: Southdown House, Ford Lane, Ford, Arundel, West Sussex BN18 0DE. Registered in England and Wales. Company No. 04618115
CHART 3-5PROPORTION OF ARCHITECTURAL PRACTICES THAT ARE LIMITED COMPANIES / PLCS / CORPORATIONS
As in previous surveys, the majority of architects in Europe establish themselves as an ‘independent architect’. But it is only just a majority, at 52 per cent, having fallen from 65 per cent in 2014. Whilst some of this fall may be due to architects leaving self-employment to join larger practices, it may also indicate a trend towards establishing architectural practices as limited companies. Compared with the 2014 survey, the proportion of Independent Architects has dropped markedly in France, Italy, Ireland, Spain and Turkey.
The proportion of practices which are established as limited companies is this year 36 per cent, higher than the 21 per cent in 2014 and 2012 and, indeed, a higher figure than recorded in any of the previous surveys. More than two thirds of practices are limited companies in Turkey, Croatia and Slovakia.
The highest proportion of partnerships is in the Netherlands and Denmark; while few architects establish themselves as PLCs or Economic Interest Groupings except in Finland, where 62 per cent of practices are PLCs.
3.2 legAl formATIon of PrAcTIces
3 - 34The ArchITecTurAl ProfessIon In euroPe 2016

Mirza & Nacey Reserach LtdSouthdown HouseFord Lane, FordArundelWest SussexBN18 0DEUnited Kingdom
Telephone: +44 1243 555302email: [email protected]
MIRZA & NACEY RESEARCH
Registered office: Southdown House, Ford Lane, Ford, Arundel, West Sussex BN18 0DE. Registered in England and Wales. Company No. 04618115
TABLE 3-2LEGAL FORMATION OF ARCHITECTURAL PRACTICES - BASED ON TYPE OF PRACTICE IN WHICH PRINCIPALS WORK
per centindependent
architect partnership limited company
PLC (public limited
company) / corporation
economic interest group
Austria 63 6 29 1 0Belgium 52 6 41 1 0Bulgaria 32 0 60 3 4Croatia 17 3 70 7 2Cyprus * 59 18 24 0 0Czech Republic * 76 10 14 0 0Denmark 44 32 15 9 0Estonia * 39 26 32 3 0Finland 31 4 2 62 1France 68 2 25 5 1Germany 73 19 8 0 0Hungary * n/a n/a n/a n/a n/aIreland 32 2 61 2 4Italy 49 7 43 1 0Lithuania 91 6 3 0 1Luxembourg 63 10 22 4 0Malta * 29 4 49 18 0Netherlands 50 40 10 0 0Poland 62 17 20 1 0Portugal 52 28 21 0 0Romania * 52 4 40 3 1Slovakia 27 4 69 0 0Slovenia 46 9 42 3 0Spain 41 0 59 0 0Sweden 62 9 22 1 7Turkey 18 3 76 3 0United Kingdom 45 6 43 6 02016 EUROPE-27 52 10 36 2 02014 EUROPE-26 65 9 21 4 12012 EUROPE-25 67 9 21 2 12010 EUROPE-23 51 10 31 5 22008 EUROPE-17 52 18 22 4 3
CHART 3-6TYPE OF ARCHITECTURAL BUSINESSES
Economic Interest Grouping
Public Limited Company/Corporation
Limited Liability Company
Partnership Independent Architect
* caution - small sample
3 - 35The ArchITecTurAl ProfessIon In euroPe 2016

Mirza & Nacey Reserach LtdSouthdown HouseFord Lane, FordArundelWest SussexBN18 0DEUnited Kingdom
Telephone: +44 1243 555302email: [email protected]
MIRZA & NACEY RESEARCH
Registered office: Southdown House, Ford Lane, Ford, Arundel, West Sussex BN18 0DE. Registered in England and Wales. Company No. 04618115
3.3 PrAcTIce revenueTABLE 3-3AVERAGE REVENUE PER PRACTICE ANALYSED BY COUNTRY AND PRACTICE SIzE
€ average (mean) revenue: size of practice (number of architectural staff)1 2 3 to 5 6 to 10 11 to 30 31 to 50 51+
Austria 64 931 122 690 259 625 696 923 1 556 944 n/a 22 724 000Belgium 70 030 365 053 265 779 675 677 2 014 147 n/a n/aBulgaria 7 169 39 276 79 550 n/a n/a n/a n/aCroatia 20 453 110 403 99 362 141 135 349 467 n/a n/aCyprus * n/a n/a n/a 150 000 n/a n/a n/aCzech Republic * n/a n/a n/a n/a n/a n/a n/aDenmark 67 608 160 743 286 320 1 004 374 1 172 362 n/a 17 296 761Estonia * 2 033 n/a 83 452 280 000 n/a n/a n/aFinland 67 990 173 545 299 902 701 972 5 890 917 n/a n/aFrance 51 794 120 936 273 541 837 225 1 730 730 n/a n/aGermany 73 151 154 763 317 064 654 293 1 859 251 6 738 211 8 804 135Hungary * 12 167 32 253 73 507 n/a n/a n/a n/aIreland 45 718 121 967 220 213 503 143 1 161 262 n/a n/aItaly 24 082 49 171 74 765 164 400 490 301 n/a 6 125 429Lithuania 12 978 26 566 20 500 178 349 n/a n/a n/aLuxembourg 73 401 138 750 329 636 443 100 2 291 812 3 845 000 n/aMalta * n/a n/a n/a n/a n/a n/a n/aNetherlands 44 910 134 649 263 782 520 133 2 236 667 n/a n/aPoland 10 896 19 624 n/a 199 662 136 911 1 049 654 n/aPortugal 16 596 46 334 100 451 207 800 500 000 n/a n/aRomania * 12 858 n/a 58 854 81 265 n/a n/a n/aSlovakia 18 567 45 100 57 310 202 667 n/a n/a n/aSlovenia 67 542 62 595 101 938 115 800 n/a n/a n/aSpain 18 199 29 855 69 213 286 250 n/a n/a n/aSweden 89 271 204 343 331 595 908 062 1 744 453 3 333 135 20 507 536Turkey 19 216 33 645 131 921 220 272 n/a n/a n/aUnited Kingdom 48 104 110 601 264 201 657 411 1 473 206 7 668 339 5 342 0452016 EUR-27 48 025 117 358 218 397 551 141 1 758 965 5 710 433 12 133 6892014 EUR-26 40 646 87 651 169 450 520 474 1 743 964 9 309 970 15 570 1152012 EUR-25 41 755 78 648 166 607 437 493 1 397 166 3 626 922 16 538 3012010 EUR-23 48 295 93 826 192 685 463 320 1 167 050 3 471 360 10 613 8012008 EUR-17 59 389 117 827 201 693 498 563 1 282 563 3 156 907 4 563 556
Figures are averages (means) and refer to the 12 months ending 01 May 2016, or the year 2015/16 or latest accounting year. Figures are unadjusted for PPP.The minimum number of responses to give a reliable answer is 10. But for smaller countries we have extended this to 5 and in very exceptional cases to 4. Where there are fewer than four responses, or where the figure varies excessively from the mean, we mark the data as n/a.
Average practice revenue rises fairly evenly with practice size. A two person practice generates a little more than double the revenue of a one person practice; and a 6 to 10 sized practice records average revenue of a little more than twice that of a 3 to 5 person practice. Less data is available for the largest practice sizes due to small sample sizes in individual countries.
Compared with the previous survey, average practice revenue has increased in all size groups up to 30 staff. Some of the rises are large; average revenue is 18 per cent higher for 1 person practices, 34 per cent higher for two persons, 29 per cent higher for a practice with 3 to 5 staff, and 6 per cent higher for a 6 to 10 sized practice. The average practice revenue is just 1 per cent higher for the next size up, while averages for practices with over 30 staff are lower than in 2014 although the averages for larger practices are only indicative as the staff intervals are large and there can be a very wide variation in the revenues reported.
* caution - small sample
3 - 36The ArchITecTurAl ProfessIon In euroPe 2016

Mirza & Nacey Reserach LtdSouthdown HouseFord Lane, FordArundelWest SussexBN18 0DEUnited Kingdom
Telephone: +44 1243 555302email: [email protected]
MIRZA & NACEY RESEARCH
Registered office: Southdown House, Ford Lane, Ford, Arundel, West Sussex BN18 0DE. Registered in England and Wales. Company No. 04618115
per cent current jobs method of calculating charge
per cent of contract value lump sum hourly charge no charge agreed (effectively “at risk”)
Austria 54 23 21 1Belgium 56 24 18 1Bulgaria 35 38 13 14Croatia 27 51 14 9Cyprus * 46 36 10 9Czech Republic * 32 53 14 1Denmark 32 31 34 4Estonia * 30 38 30 3Finland 7 51 41 1France 67 25 7 1Germany 60 16 20 4Hungary * 55 26 10 10Ireland 35 49 14 3Italy 39 44 7 9Lithuania 45 35 14 6Luxembourg 74 13 11 2Malta * 32 31 33 4Netherlands 18 50 29 3Poland 26 29 33 13Portugal 39 40 9 11Romania * 54 26 10 9Slovakia 50 28 17 5Slovenia 39 32 23 7Spain 56 30 6 8Sweden 7 33 57 3Turkey 40 42 6 12United Kingdom 28 44 26 22016 EUROPE-27 45 34 14 72014 EUROPE-26 47 32 14 72012 EUROPE-25 43 36 12 92010 EUROPE-23 49 29 18 52008 EUROPE-17 56 23 16 6
TABLE 3-4HOW CHARGES ARE CALCULATED
Forty five per cent of architects’ jobs are charged for based on a percentage of the contract value. Architects in France and Luxembourg are most likely to use this method; those in Finland and Sweden least likely.
One third of jobs, 34 per cent, are charged for on a lump sum basis - including at least half of jobs in Finland, Netherlands, Croatia and the Czech Republic.
An hourly charge is the method used on 14 per cent of jobs, including more than 40 per cent in Sweden and Finland.
Countries with the highest proportion of jobs for which no charge has been agreed include Bulgaria, Poland, Portugal, and Turkey.
3.4 how PrAcTIces chArge for TheIr servIces
* caution - small sample
3 - 37The ArchITecTurAl ProfessIon In euroPe 2016

Mirza & Nacey Reserach LtdSouthdown HouseFord Lane, FordArundelWest SussexBN18 0DEUnited Kingdom
Telephone: +44 1243 555302email: [email protected]
MIRZA & NACEY RESEARCH
Registered office: Southdown House, Ford Lane, Ford, Arundel, West Sussex BN18 0DE. Registered in England and Wales. Company No. 04618115
3.5 hourly chArge-ouT rATes
Data is expressed in Euros but each country’s figure has been adjusted using an index of Purchasing Power Parity (PPP). This index takes account of price level differences across countries. We have used an index sourced from Eurostat, whose Comparative Price Level Indices assess the price level of each country in the comparison of European countries. Each country’s average hourly rates figure is divided by one hundredth of the country’s index value to create the PPP adjusted figure.
€ average (median) hourly charge-out rates adjusted to take account of Purchasing Power Parities (PPP), Euros
principals architects technologistsAustria 90 79 62Belgium 67 57 45Bulgaria 55 44 22Croatia n/a n/a n/aCyprus * 57 29 20Czech Republic * 23 15 9Denmark 83 75 59Estonia * 40 27 7Finland 71 58 48France 76 71 57Germany 75 65 48Hungary * 50 39 22Ireland 73 61 45Italy 40 30 25Lithuania n/a n/a n/aLuxembourg 94 72 50Malta * 93 50 30Netherlands 82 78 60Poland 29 n/a 12Portugal 37 28 25Romania * 10 17 4Slovakia 30 23 15Slovenia 43 31 19Spain 33 28 22Sweden 85 76 67Turkey 26 13 8United Kingdom 73 63 492016 EUROPE-27 70 57 452014 EUROPE-26 64 53 432012 EUROPE-25 54 44 292010 EUROPE-23 66 56 432008 EUROPE-17 62 50 39
Average hourly rates refer to the average charged to clients for an hour of the architect’s work, before tax.
In table 3-5, the data has been adjusted to take account of different price levels between the countries, using a Purchasing Power Parity (PPP) index. Unadjusted figures are given in table 3-6.
The PPP hourly charge-out rates (table 3-5) are generally highest in Luxembourg, Austria, Sweden and the Netherlands. Lowest hourly rates are recorded in Romania, Turkey and Poland.
Average rates have increased since the 2014 survey; rates for Principals are now €70 per hour, 9 per cent higher than in 2014; average rates for architects are 8 per cent higher while for technologists the average is 2 per cent higher than in 2014. Average PPP hourly rates this year are higher than in any of the years this survey has been running.
TABLE 3-5AVERAGE HOURLY CHARGE-OUT RATES ADJUSTED TO TAKE ACCOUNT OF PURCHASING POWER PARITY (PPP)
* caution - small sample
3 - 38The ArchITecTurAl ProfessIon In euroPe 2016

Mirza & Nacey Reserach LtdSouthdown HouseFord Lane, FordArundelWest SussexBN18 0DEUnited Kingdom
Telephone: +44 1243 555302email: [email protected]
MIRZA & NACEY RESEARCH
Registered office: Southdown House, Ford Lane, Ford, Arundel, West Sussex BN18 0DE. Registered in England and Wales. Company No. 04618115
€ average (median) hourly charge-out ratesprincipals architects technologists
Austria 96 84 65Belgium 74 62 48Bulgaria 26 20 10Croatia n/a n/a n/aCyprus * 50 25 18Czech Republic * 15 9 6Denmark 114 104 81Estonia * 30 20 5Finland 85 70 58France 80 80 60Germany 75 65 48Hungary * 26 22 13Ireland 90 75 55Italy 40 30 25Lithuania n/a n/a n/aLuxembourg 112 86 60Malta * 75 40 24Netherlands 90 85 65Poland 16 n/a 7Portugal 30 25 20Romania * 5 9 2Slovakia 20 15 10Slovenia 34 25 15Spain 30 25 20Sweden 103 92 82Turkey 16 8 5United Kingdom 96 83 642016 EUROPE-27 75 60 462014 EUROPE-26 67 55 452012 EUROPE-25 55 43 302010 EUROPE-23 75 63 502008 EUROPE-17 63 50 40
CHART 3-7AVERAGE HOURLY CHARGE-OUT RATES FOR PRINCIPALS, ADJUSTED FOR PURCHASING POWER PARITY (PPP)
TABLE 3-6AVERAGE HOURLY CHARGE-OUT RATES, UNADJUSTED
average rate € adjusted for PPP0 20 40 60 80 100
Lithuania
Croatia
Romania
Czech
Turkey
Poland
Slovakia
Spain
Portugal
Italy
Estonia
Slovenia
Hungary
Bulgaria
Cyprus
Belgium
Finland
United Kingdom
Ireland
Germany
France
Netherlands
Denmark
Sweden
Austria
Malta
Luxembourg
n/an/a
* caution - small sample
3 - 39The ArchITecTurAl ProfessIon In euroPe 2016
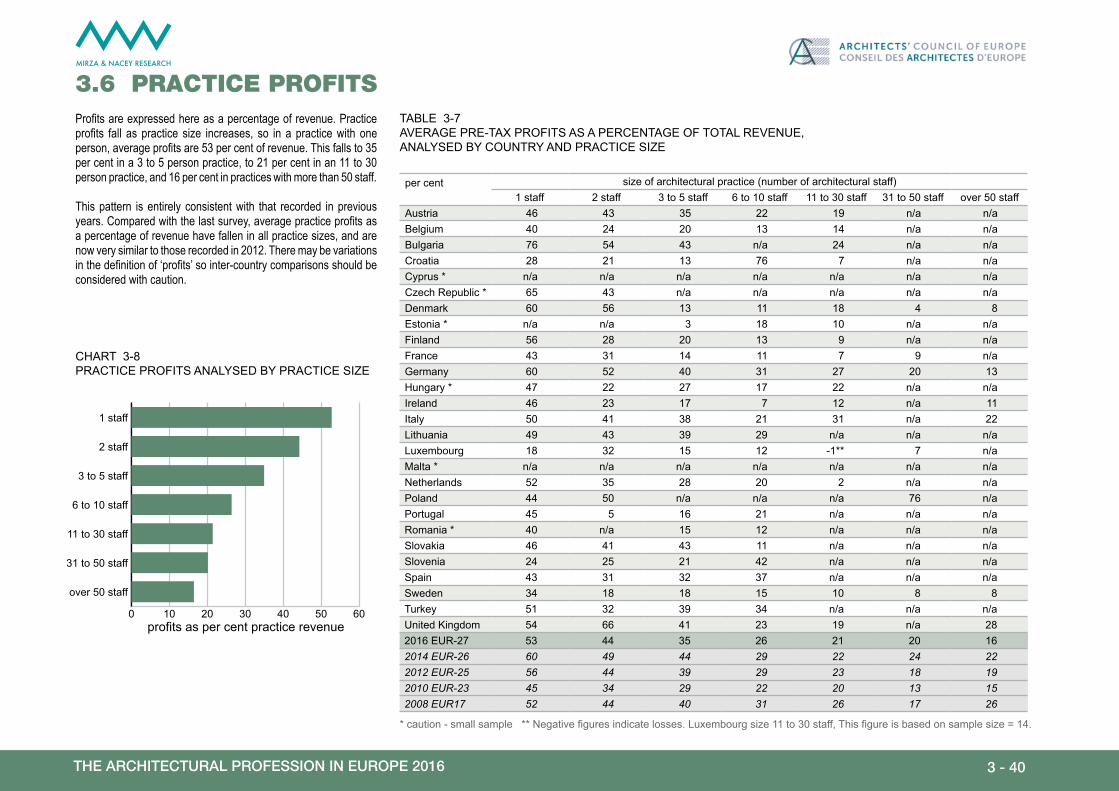
Mirza & Nacey Reserach LtdSouthdown HouseFord Lane, FordArundelWest SussexBN18 0DEUnited Kingdom
Telephone: +44 1243 555302email: [email protected]
MIRZA & NACEY RESEARCH
Registered office: Southdown House, Ford Lane, Ford, Arundel, West Sussex BN18 0DE. Registered in England and Wales. Company No. 04618115
3.6 PrAcTIce ProfITsProfits are expressed here as a percentage of revenue. Practice profits fall as practice size increases, so in a practice with one person, average profits are 53 per cent of revenue. This falls to 35 per cent in a 3 to 5 person practice, to 21 per cent in an 11 to 30 person practice, and 16 per cent in practices with more than 50 staff.
This pattern is entirely consistent with that recorded in previous years. Compared with the last survey, average practice profits as a percentage of revenue have fallen in all practice sizes, and are now very similar to those recorded in 2012. There may be variations in the definition of ‘profits’ so inter-country comparisons should be considered with caution.
CHART 3-8PRACTICE PROFITS ANALYSED BY PRACTICE SIzE
TABLE 3-7AVERAGE PRE-TAX PROFITS AS A PERCENTAGE OF TOTAL REVENUE, ANALYSED BY COUNTRY AND PRACTICE SIzE
per cent size of architectural practice (number of architectural staff)1 staff 2 staff 3 to 5 staff 6 to 10 staff 11 to 30 staff 31 to 50 staff over 50 staff
Austria 46 43 35 22 19 n/a n/aBelgium 40 24 20 13 14 n/a n/aBulgaria 76 54 43 n/a 24 n/a n/aCroatia 28 21 13 76 7 n/a n/aCyprus * n/a n/a n/a n/a n/a n/a n/aCzech Republic * 65 43 n/a n/a n/a n/a n/aDenmark 60 56 13 11 18 4 8Estonia * n/a n/a 3 18 10 n/a n/aFinland 56 28 20 13 9 n/a n/aFrance 43 31 14 11 7 9 n/aGermany 60 52 40 31 27 20 13Hungary * 47 22 27 17 22 n/a n/aIreland 46 23 17 7 12 n/a 11Italy 50 41 38 21 31 n/a 22Lithuania 49 43 39 29 n/a n/a n/aLuxembourg 18 32 15 12 -1** 7 n/aMalta * n/a n/a n/a n/a n/a n/a n/aNetherlands 52 35 28 20 2 n/a n/aPoland 44 50 n/a n/a n/a 76 n/aPortugal 45 5 16 21 n/a n/a n/aRomania * 40 n/a 15 12 n/a n/a n/aSlovakia 46 41 43 11 n/a n/a n/aSlovenia 24 25 21 42 n/a n/a n/aSpain 43 31 32 37 n/a n/a n/aSweden 34 18 18 15 10 8 8Turkey 51 32 39 34 n/a n/a n/aUnited Kingdom 54 66 41 23 19 n/a 282016 EUR-27 53 44 35 26 21 20 162014 EUR-26 60 49 44 29 22 24 222012 EUR-25 56 44 39 29 23 18 192010 EUR-23 45 34 29 22 20 13 152008 EUR17 52 44 40 31 26 17 26
profits as per cent practice revenue0 10 20 30 40 50 60
over 50 staff
31 to 50 staff
11 to 30 staff
6 to 10 staff
3 to 5 staff
2 staff
1 staff
* caution - small sample ** Negative figures indicate losses. Luxembourg size 11 to 30 staff, This figure is based on sample size = 14.
3 - 40The ArchITecTurAl ProfessIon In euroPe 2016

Mirza & Nacey Reserach LtdSouthdown HouseFord Lane, FordArundelWest SussexBN18 0DEUnited Kingdom
Telephone: +44 1243 555302email: [email protected]
MIRZA & NACEY RESEARCH
Registered office: Southdown House, Ford Lane, Ford, Arundel, West Sussex BN18 0DE. Registered in England and Wales. Company No. 04618115
TABLE 3-8PROPORTION OF PRACTICE REVENUE DERIVED FROM OUTSIDE THE COUNTRY, ANALYSED BY COUNTRY
per cent revenue derived from outside the country
revenue from rest of Europe revenue from outside Europe TOTAL
Austria 6.8 2.4 9.2Belgium 4.1 0.8 4.9Bulgaria 4.5 13.5 18.0Croatia 5.5 5.3 10.8Cyprus * 2.4 11.4 13.8Czech Republic * 8.7 1.0 9.7Denmark 10.1 4.9 15.0Estonia * 5.2 0.0 5.2Finland 3.3 1.3 4.6France 3.4 1.7 5.1Germany 1.2 0.6 1.8Hungary * 13.3 1.0 14.4Ireland 7.3 3.1 10.4Italy 2.6 1.6 4.3Lithuania 7.0 7.0 14.0Luxembourg 13.7 2.3 16.0Malta * 0.0 0.0 0.0Netherlands 7.1 3.7 10.8Poland 7.4 0.1 7.5Portugal 7.0 11.5 18.6Romania * 9.5 4.8 14.3Slovakia 9.0 0.3 9.4Slovenia 5.6 1.7 7.3Spain 1.3 2.1 3.4Sweden 2.2 1.7 4.0Turkey 4.1 12.5 16.6United Kingdom 7.0 4.2 11.32016 EUROPE-27 2.7 1.6 4.32014 EUROPE-26 3.7 2.7 6.42012 EUROPE-25 n/a n/a 5.62010 EUROPE-23 n/a n/a 7.72008 EUROPE-17 n/a n/a 6.0
Some 4 per cent of practice revenue is generated from work undertaken outside the country in which the architectural practice is based. The highest proportion is generated by architects in Portugal, Bulgaria and Turkey (17 per cent or more). The overall figure of 4 per cent is lower than that recorded in any of the previous four surveys.
About 63 per cent of revenue from outside the practice’s own country comes from work in another European country. This is similar to the 2014 result. The highest proportion of total practice revenue derived from outside Europe is recorded by architects in Bulgaria, Turkey, Portugal and Cyprus - over 10 per cent of total practice revenue in these countries comes from work outside Europe.
rest of Worldrest of Europe
work from own country
work from outside own country
3.7 revenue from ouTsIde own counTry
CHART 3-9SOURCE OF REVENUE
* caution - small sample
3 - 41The ArchITecTurAl ProfessIon In euroPe 2016

Mirza & Nacey Reserach LtdSouthdown HouseFord Lane, FordArundelWest SussexBN18 0DEUnited Kingdom
Telephone: +44 1243 555302email: [email protected]
MIRZA & NACEY RESEARCH
Registered office: Southdown House, Ford Lane, Ford, Arundel, West Sussex BN18 0DE. Registered in England and Wales. Company No. 04618115
3.8 AssocIATIons
per cent no formal association
have a formal association
with architect / practice in same country
with architect / practice in another country both
Austria 89 8 2 1Belgium 83 15 1 1Bulgaria 80 20 0 0Croatia 40 48 1 11Cyprus * 82 12 6 0Czech Republic * 88 13 0 0Denmark 75 17 7 1Estonia * 51 27 0 22Finland 39 55 1 5France 86 12 1 1Germany 78 19 1 1Hungary* 87 11 0 2Ireland 81 14 4 1Italy 77 21 1 1Lithuania 65 33 2 0Luxembourg 80 14 3 3Malta * 73 27 0 0Netherlands* 70 22 4 4Poland 45 55 0 0Portugal 85 10 4 1Romania * 69 31 0 0Slovakia 68 29 1 1Slovenia 62 33 3 2Spain 94 4 1 1Sweden 82 12 3 2Turkey 87 8 2 2United Kingdom 78 12 7 32016 EUROPE-27 80 17 2 12014 EUROPE-26 84 14 2 12012 EUROPE-25 79 18 2 12010 EUROPE-23 82 15 2 22008 EUROPE-17 85 12 3 n/a
TABLE 3-9PROPORTION OF PRACTICES WHO HAVE A FORMAL ASSOCIATION WITH ANOTHER PRACTICE
CHART 3-10 PROPORTION OF PRACTICES WHO HAVE A FORMAL ASSOCIATION WITH ANOTHER PRACTICE
per cent practices0 20 40 60 80 100
both same & otherother countrysame country
Spain
Austria
Czech Republic
Turkey
Hungary
France
Portugal
Belgium
Cyprus
Sweden
Ireland
Luxembourg
Bulgaria
United Kingdom
Germany
Italy
Denmark
Malta
Netherlands
Romania
Slovakia
Lithuania
Slovenia
Estonia
Poland
Croatia
Finland
* caution - small sample
3 - 42The ArchITecTurAl ProfessIon In euroPe 2016

Mirza & Nacey Reserach LtdSouthdown HouseFord Lane, FordArundelWest SussexBN18 0DEUnited Kingdom
Telephone: +44 1243 555302email: [email protected]
MIRZA & NACEY RESEARCH
Registered office: Southdown House, Ford Lane, Ford, Arundel, West Sussex BN18 0DE. Registered in England and Wales. Company No. 04618115
3.9 brAnch offIces
per cent work in branch office for those who work in branch, head office is located in...
same country as where branch office is located
same country as where architect is established
Austria 3 92 97Belgium 4 97 99Bulgaria 4 95 91Croatia 6 93 96Cyprus * 0 100 67Czech Republic * 7 84 100Denmark 18 86 90Estonia * 4 87 90Finland 7 62 75France 3 97 94Germany 1 77 77Hungary * 5 89 96Ireland 9 83 86Italy 4 98 98Lithuania 9 90 90Luxembourg 4 83 82Malta * 8 86 100Netherlands 11 98 87Poland 7 98 98Portugal 10 81 84Romania * 11 100 100Slovakia 11 82 77Slovenia 3 89 89Spain 3 70 65Sweden 13 91 100Turkey 18 90 91United Kingdom 16 87 862016 EUROPE-27 6 95 952014 EUROPE-26 6 96 962012 EUROPE-25 6 90 912010 EUROPE-23 12 89 982008 EUROPE-17 9 71 93
Working in a branch or subsidiary office provides information as to how many offices an architectural practice might have. Overall, few architects (6 per cent) work in a branch office. This proportion is highest - more than 15 per cent - in Turkey, Denmark and the United Kingdom. Lowest proportions are recorded by architects in Germany, Cyprus, Slovenia and Spain. For those architects who work in a branch office, the head office is nearly always located in the same country as the branch office and the same country as where the architect is established (95 per cent for both).
TABLE 3-10PROPORTION OF ARCHITECTS WORKING IN BRANCH OFFICE AND LOCATION OF BRANCH OFFICE’S HEAD OFFICE
Twenty per cent of architects have an association with another practice. For most of these, it is an association with another practice in the same country. Just 3 per cent of architects have an association with another practice in a different country.
More architects in Finland, Croatia, Poland and Estonia have an association with another practice, either in the same country or elsewhere. Twenty two per cent of architects in Estonia have an association with a practice in another country, the highest figure reported.
3.8 AssocIATIons
* caution - small sample
3 - 43The ArchITecTurAl ProfessIon In euroPe 2016

Mirza & Nacey Reserach LtdSouthdown HouseFord Lane, FordArundelWest SussexBN18 0DEUnited Kingdom
Telephone: +44 1243 555302email: [email protected]
MIRZA & NACEY RESEARCH
Registered office: Southdown House, Ford Lane, Ford, Arundel, West Sussex BN18 0DE. Registered in England and Wales. Company No. 04618115
3.10 ArchITecTurAl desIgn comPeTITIonsIn a new question for this year’s survey, 20 per cent of Principals said that their practice had entered one or more Architectural Design Competitions in the 12 months to May 2016. About three quarters of these competitions were for public sector jobs, and one quarter for private sector work. Slightly more architects (36 per cent) entered open competitions than competitions with a pre-selection procedure (28 per cent) or an invited competition (24 per cent).
These respondents said they had been successful in 36 per cent of Architectural Design Competitions. The success rate is 48 per cent for private sector Competitions, and 31 per cent for public sector. The highest success rates are recorded for invited competitions, at 51 per cent. Architectural Design Competitions with a pre-selection procedure resulted in a success rate of 31 per cent, while success at an open competition was 27 per cent. In all cases, architects gained higher success rates for private sector Architectural Design Competitions than for public sector ones.
Responding architects said their practice spent an average €12,600 participating in Architectural Design Competitions during the past 12 months. The resulting fee revenue from successful competitions far exceeded this investment; an average of €114 000 per practice - nine times this investment. These averages are for all practices who entered at least one Architectural Design Competition - regardless of whether or not they were successful.
CHART 3-12ARCHITECTURAL DESIGN COMPETITIONS ENTERED LAST 12 MONTHS - SUCCESS RATES
0 20 40 60 80 100
public
private
othercompetition
invitedcompetition
pre-selectionprocedure
opencompetition
per cent each type of Architectural Design Competition entered, last 12 months
private publicsuccessful bids:all bids:
private public
portugal: “public procurement bids”Italy: “tenders for new work”NL: “how mny designs submitted...”HU: “Call for proposals”
did not enter an Architectural Design
Competition
entered an Architectural Design
Competition
CHART 3-11PRACTICES ENTERING ARCHITECTURAL DESIGN COMPETITIONS, LAST 12 MONTHS
othercompetition
invitedcompetition
pre-selection procedure
opencompetition
CHART 3-13ARCHITECTURAL DESIGN COMPETITIONS ENTERED - TYPE OF COMPETITION
per cent practices participating in Architectural Design Competitions
last 12 monthsAustria 51Belgium 30Bulgaria 17Croatia 11Cyprus * 15Czech Republic * 14Denmark 24Estonia * 53Finland 36France 36Germany 19Hungary * 7Ireland 30Italy 17Lithuania 12Luxembourg 39Malta * 9Netherlands 22Poland 61Portugal 21Romania * 27Slovakia 32Slovenia 29Spain 30Sweden 12Turkey 14United Kingdom 242016 EUROPE-27 202014 EUROPE-26 n/a2012 EUROPE-25 n/a2010 EUROPE-23 n/a2008 EUROPE-17 n/a
TABLE 3-11ARCHITECTURAL DESIGN COMPETITION PARTICIPATION RATES
3 - 44The ArchITecTurAl ProfessIon In euroPe 2016

Mirza & Nacey Reserach LtdSouthdown HouseFord Lane, FordArundelWest SussexBN18 0DEUnited Kingdom
Telephone: +44 1243 555302email: [email protected]
MIRZA & NACEY RESEARCH
Registered office: Southdown House, Ford Lane, Ford, Arundel, West Sussex BN18 0DE. Registered in England and Wales. Company No. 04618115
TABLE 3-12TYPE OF ARCHITECTURAL DESIGN COMPETITION ENTERED, LAST 12 MONTHS, ANALYSED BY COUNTRY
per cent Architectural Design Competitions entered last 12 months
open competition
competition with
pre-selection procedure
invited competition
other competition ALL ALL public ALL private
Austria 30 20 31 19 100 74 26Belgium 47 32 16 5 100 80 20Bulgaria 66 8 25 1 100 69 31Croatia 22 1 50 27 100 62 38Cyprus * 26 28 31 15 100 62 38Czech Republic * 51 12 37 0 100 100 0Denmark 3 73 17 7 100 81 19Estonia * 80 1 16 2 100 80 20Finland 31 38 23 8 100 64 36France 32 50 9 9 100 86 14Germany 24 31 33 12 100 74 26Hungary * 9 3 88 0 100 95 5Ireland 29 13 34 24 100 33 67Italy 53 18 13 16 100 79 21Lithuania 59 9 12 21 100 59 41Luxembourg 37 33 15 14 100 63 37Malta * 100 0 0 0 100 100 0Netherlands 22 40 34 4 100 61 39Poland 46 10 39 5 100 50 50Portugal 40 11 45 4 100 42 58Romania * 13 13 48 26 100 77 23Slovakia 40 11 33 17 100 51 49Slovenia 27 6 62 5 100 71 29Spain 40 17 29 14 100 58 42Sweden 15 27 35 24 100 53 47Turkey 60 12 18 11 100 77 23United Kingdom 16 39 41 5 100 36 642016 EUROPE-27 36 28 24 12 100 73 272014 EUROPE-26 n/a n/a n/a n/a n/a 82 182012 EUROPE-25 n/a n/a n/a n/a n/a n/a n/a2010 EUROPE-23 n/a n/a n/a n/a n/a n/a n/a2008 EUROPE-17 n/a n/a n/a n/a n/a n/a n/a
* caution - small sample 2008/10/12 question was not asked in previous surveys. Some data is available for 2014 although question asked was worded differently.
per cent Architectural Design Competitions entered last 12 months
success rate - public
success rate - private
Austria 25 40Belgium 38 39Bulgaria 83 36Croatia 64 74Cyprus * 48 62Czech Republic * 56 n/aDenmark 37 14Estonia * 62 80Finland 37 71France 21 45Germany 35 48Hungary * 88 50Ireland 27 71Italy 25 41Lithuania 42 42Luxembourg 30 59Malta * 0 n/aNetherlands 45 61Poland 30 38Portugal 41 58Romania * 88 60Slovakia 33 29Slovenia 43 61Spain 24 61Sweden 41 54Turkey 24 67United Kingdom 44 472016 EUROPE-27 31 482014 EUROPE-26 n/a n/a2012 EUROPE-25 n/a n/a2010 EUROPE-23 n/a n/a2008 EUROPE-17 n/a n/a
* caution - small sample
TABLE 3-13ARCHITECTURAL DESIGN COMPETITION SUCCESS RATES
3 - 45The ArchITecTurAl ProfessIon In euroPe 2016

Mirza & Nacey Reserach LtdSouthdown HouseFord Lane, FordArundelWest SussexBN18 0DEUnited Kingdom
Telephone: +44 1243 555302email: [email protected]
MIRZA & NACEY RESEARCH
Registered office: Southdown House, Ford Lane, Ford, Arundel, West Sussex BN18 0DE. Registered in England and Wales. Company No. 04618115
TABLE 3-14INVESTMENT AND REWARDS: PARTICIPATION IN ARCHITECTURAL DESIGN COMPETITIONS, LAST 12 MONTHS, ANALYSED BY COUNTRY
average (mean) per practice
all Architectural Design Competitions entered last 12 months Architectural Design Competition prize money
number of hours spent participating in Architectural Design
Competitions
average total financial cost** per practice of
participating €
average fee revenue per practice from successful
Architectural Design Competitions €
average build cost per practice of won
projects € million
receive prize money -per cent of ALL practices which were successful at Architectural Design
Competitions
average prize money (excluding zero) €
Austria 695 32 067 70 321 12.3 23 11 568Belgium 686 29 676 144 895 8.5 8 8 684Bulgaria 184 2 887 13 109 0.7 5 6 514Croatia 162 2 095 1 907 0.9 36 12 837Cyprus * 760 5 091 17 500 1.7 10 2 500Czech Republic * n/a n/a 2 772 n/a n/a n/aDenmark 904 90 799 198 040 27.4 15 23 678Estonia * 507 10 347 43 379 3.7 44 17 759Finland 388 39 620 65 775 106.4 22 21 833France 372 20 647 193 691 7.6 12 40 295Germany 705 33 721 198 801 13.0 61 21 998Hungary * 101 5 318 34 061 9.6 19 7 432Ireland 111 6 550 98 300 7.0 1 2 500Italy 93 1 224 11 821 1.3 7 4 347Lithuania 143 2 055 14 589 0.7 31 1 778Luxembourg 551 29 224 464 677 242.0 27 12 556Malta * n/a n/a n/a n/a n/a n/aNetherlands 169 10 572 44 314 7.7 12 14 319Poland 544 4 209 4 798 7.2 41 3 195Portugal 449 12 069 33 635 7.4 20 23 517Romania * n/a n/a n/a n/a n/a n/aSlovakia 254 3 109 12 687 14.7 12 5 231Slovenia 222 2 959 1 833 8.2 20 4 880Spain 118 1 467 11 230 6.5 6 25 281Sweden 946 68 585 407 844 60.0 9 78 388Turkey 197 1 492 3 210 1.3 11 12 927United Kingdom 98 7 182 144 508 28.7 1 1852016 EUROPE-27 424 12 624 113 822 11.6 17 13 1102014 EUROPE-26 n/a n/a n/a n/a n/a n/a2012 EUROPE-25 n/a n/a n/a n/a n/a n/a2010 EUROPE-23 n/a n/a n/a n/a n/a n/a2008 EUROPE-17 n/a n/a n/a n/a n/a n/a
* caution - small sample 2008/10/12/14 question was not asked in previous surveys.** includes staff costs
3 - 46The ArchITecTurAl ProfessIon In euroPe 2016

Mirza & Nacey Reserach LtdSouthdown HouseFord Lane, FordArundelWest SussexBN18 0DEUnited Kingdom
Telephone: +44 1243 555302email: [email protected]
MIRZA & NACEY RESEARCH
Registered office: Southdown House, Ford Lane, Ford, Arundel, West Sussex BN18 0DE. Registered in England and Wales. Company No. 04618115
TABLE 3-15ARCHITECTURAL PRACTICES WHO OFFER CERTIFICATION SERVICES, ANALYSED BY COUNTRY
per cent of practices who offer service
type of certification offeredbuilding energy rating health & safety fire safety
Austria 29 6 13Belgium 25 13 10Bulgaria 29 25 35Croatia 35 9 13Cyprus * 59 43 25Czech Republic * 10 0 19Denmark 22 15 17Estonia * 31 44 45Finland 10 13 9France 14 11 14Germany n/a n/a n/aHungary 41 16 27Ireland 11 47 46Italy 58 32 24Lithuania 14 12 15Luxembourg 57 3 8Malta * 36 11 0Netherlands 27 14 17Poland 51 17 24Portugal 10 14 36Romania * 35 29 54Slovakia 33 15 27Slovenia 14 2 7Spain 93 56 63Sweden 13 20 10Turkey 38 25 25United Kingdom 8 7 42016 EUROPE-27 44 26 262014 EUROPE-26 42 24 352012 EUROPE-25 n/a n/a n/a2010 EUROPE-23 n/a n/a n/a2008 EUROPE-17 n/a n/a n/a
3.11 cerTIfIcATIon work
per cent practices offering certification service0 10 20 30 40 50
fire safety
health & safety
building energyrating
A substantial proportion of practices, 44 per cent, offer building energy rating certification. About a quarter, 26 per cent, offer health & safety or fire safety certifications. Nearly all architects in Spain offer building energy rating certification; other countries where high proportions are recorded include Cyprus, Italy and Poland. The highest offering of health & safety certification is by architects in Spain, Ireland, Estonia and Cyprus; while more architects in Spain, again, than elsewhere offer fire safety certification.
Compared with the 2014 survey, slightly more architects offer building energy rating certification and health & safety certification now than in the previous survey, but fewer offer fire safety certification.
CHART 3-14CERTIFICATION SERVICES OFFERED
* caution - small sample
3 - 47The ArchITecTurAl ProfessIon In euroPe 2016

Architect: Dekleva Gregoric ArchitectsProject: Compact Karst HousePhoto: James MarotiPlace: Vrhovlje, Slovenia

Mirza & Nacey Reserach LtdSouthdown HouseFord Lane, FordArundelWest SussexBN18 0DEUnited Kingdom
Telephone: +44 1243 555302email: [email protected]
MIRZA & NACEY RESEARCH
Registered office: Southdown House, Ford Lane, Ford, Arundel, West Sussex BN18 0DE. Registered in England and Wales. Company No. 04618115
4.1 eArnIngsAverage architects’ earnings are €32 068 (adjusted for PPP). This is 10 per cent higher than the 2014 survey figure, and is the first year in which average earnings have increased since this survey began, in 2008.
Average salaries are higher in most countries; the largest rises between 2014 and 2016 are recorded in Romania, the Czech
CHART 4-2RANGE OF AVERAGE EARNINGS (ALL FULL-TIME ARCHITECTS), ADJUSTED FOR PPP
CHART 4-1CHANGE IN ARCHITECTS’ AVERAGE EARNINGS (ALL SURVEY COUNTRIES), 2008-16
Republic, Slovenia and Luxembourg. Average salaries are lower in a handful of countries, with the largest falls recorded by architects in Bulgaria, the Netherlands and Spain.
0
5000
10000
15000
20000
25000
30000
35000
20162014201220102008
aver
age
earn
ings
€ a
djus
ted
for P
PP
The adjustment of average earnings for Purchasing Power Parity (PPP) takes account of differing price levels in the surveyed countries, adjusting each country’s average earnings figure by its PPP index. Earnings figures in the country pages are not adjusted.
4 - 49The ArchITecTurAl ProfessIon In euroPe 2016
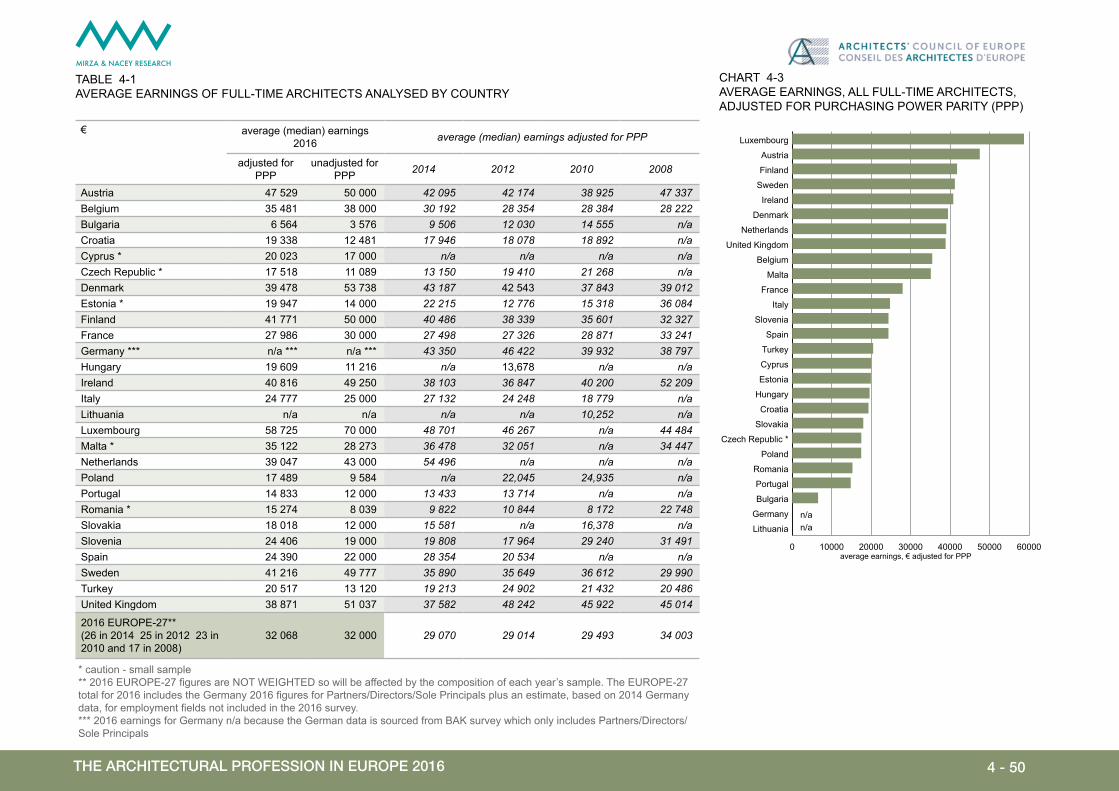
Mirza & Nacey Reserach LtdSouthdown HouseFord Lane, FordArundelWest SussexBN18 0DEUnited Kingdom
Telephone: +44 1243 555302email: [email protected]
MIRZA & NACEY RESEARCH
Registered office: Southdown House, Ford Lane, Ford, Arundel, West Sussex BN18 0DE. Registered in England and Wales. Company No. 04618115
€ average (median) earnings 2016 average (median) earnings adjusted for PPP
adjusted for PPP
unadjusted for PPP 2014 2012 2010 2008
Austria 47 529 50 000 42 095 42 174 38 925 47 337Belgium 35 481 38 000 30 192 28 354 28 384 28 222Bulgaria 6 564 3 576 9 506 12 030 14 555 n/aCroatia 19 338 12 481 17 946 18 078 18 892 n/aCyprus * 20 023 17 000 n/a n/a n/a n/aCzech Republic * 17 518 11 089 13 150 19 410 21 268 n/aDenmark 39 478 53 738 43 187 42 543 37 843 39 012Estonia * 19 947 14 000 22 215 12 776 15 318 36 084Finland 41 771 50 000 40 486 38 339 35 601 32 327France 27 986 30 000 27 498 27 326 28 871 33 241Germany *** n/a *** n/a *** 43 350 46 422 39 932 38 797Hungary 19 609 11 216 n/a 13,678 n/a n/aIreland 40 816 49 250 38 103 36 847 40 200 52 209Italy 24 777 25 000 27 132 24 248 18 779 n/aLithuania n/a n/a n/a n/a 10,252 n/aLuxembourg 58 725 70 000 48 701 46 267 n/a 44 484Malta * 35 122 28 273 36 478 32 051 n/a 34 447Netherlands 39 047 43 000 54 496 n/a n/a n/aPoland 17 489 9 584 n/a 22,045 24,935 n/aPortugal 14 833 12 000 13 433 13 714 n/a n/aRomania * 15 274 8 039 9 822 10 844 8 172 22 748Slovakia 18 018 12 000 15 581 n/a 16,378 n/aSlovenia 24 406 19 000 19 808 17 964 29 240 31 491Spain 24 390 22 000 28 354 20 534 n/a n/aSweden 41 216 49 777 35 890 35 649 36 612 29 990Turkey 20 517 13 120 19 213 24 902 21 432 20 486United Kingdom 38 871 51 037 37 582 48 242 45 922 45 014
2016 EUROPE-27** (26 in 2014 25 in 2012 23 in 2010 and 17 in 2008)
32 068 32 000 29 070 29 014 29 493 34 003
TABLE 4-1AVERAGE EARNINGS OF FULL-TIME ARCHITECTS ANALYSED BY COUNTRY
* caution - small sample ** 2016 EUROPE-27 figures are NOT WEIGHTED so will be affected by the composition of each year’s sample. The EUROPE-27 total for 2016 includes the Germany 2016 figures for Partners/Directors/Sole Principals plus an estimate, based on 2014 Germany data, for employment fields not included in the 2016 survey.*** 2016 earnings for Germany n/a because the German data is sourced from BAK survey which only includes Partners/Directors/Sole Principals
CHART 4-3AVERAGE EARNINGS, ALL FULL-TIME ARCHITECTS, ADJUSTED FOR PURCHASING POWER PARITY (PPP)
average earnings, € adjusted for PPP0 10000 20000 30000 40000 50000 60000
Lithuania
Germany
Bulgaria
Portugal
Romania
Poland
Czech Republic *
Slovakia
Croatia
Hungary
Estonia
Cyprus
Turkey
Spain
Slovenia
Italy
France
Malta
Belgium
United Kingdom
Netherlands
Denmark
Ireland
Sweden
Finland
Austria
Luxembourg
n/an/a
4 - 50The ArchITecTurAl ProfessIon In euroPe 2016

Mirza & Nacey Reserach LtdSouthdown HouseFord Lane, FordArundelWest SussexBN18 0DEUnited Kingdom
Telephone: +44 1243 555302email: [email protected]
MIRZA & NACEY RESEARCH
Registered office: Southdown House, Ford Lane, Ford, Arundel, West Sussex BN18 0DE. Registered in England and Wales. Company No. 04618115
4.2 eArnIngs by fIeld of emPloymenT
* caution - small sample ** Germany data from BAK survey which includes data for Partners/Directors/Sole Principals only. Some cells are therefore marked n/a. Germany IS included in the 2016 EUROPE-27 figure (includes 2016 data for Partners/Directors/Sole Principals plus an estimate, based on 2014 Germany data, for employment fields not included in the 2016 survey). Earnings data converted from local currencies to Euros, exchange rate as at 01.05.16 and then adjusted for PPP
TABLE 4-2AVERAGE EARNINGS ANALYSED BY COUNTRY AND FIELD OF EMPLOYMENT (ADJUSTED FOR PPP)
€ average (median) earnings adjusted for PPP
sole principal
partner/ director
ALL Prin-cipals
private practice salaried
freelance other private
ALL private
local / central gov’t
other public
ALL public
Austria 47 529 56 559 47 529 35 789 n/a n/a 47 529 n/a n/a n/a Belgium 37 348 44 818 42 017 46 685 30 187 32 680 37 348 38 282 44 282 38 282 Bulgaria 10 119 n/a 13 127 4 159 17 503 n/a 6 564 9 189 n/a 6 564 Croatia 15 890 15 267 15 291 19 391 n/a 23 003 18 321 19 949 27 033 26 463 Cyprus * 17 162 n/a 20 384 1 912 n/a n/a 15 775 n/a n/a n/a Czech Republic * 17 518 n/a 17 518 19 796 10 511 n/a 17 518 n/a n/a n/a Denmark 37 318 60 298 49 102 37 760 12 422 39 310 40 636 38 594 40 755 39 773 Estonia * n/a 42 553 42 553 19 947 n/a n/a 19 947 n/a n/a n/a Finland 45 530 61 821 50 961 38 012 n/a 46 700 41 249 41 896 44 110 42 356 France 23 719 35 579 23 719 37 951 22 770 24 668 28 463 37 713 32 875 34 837 Germany ** 56 052 65 264 58 347 n/a 39 090 n/a n/a n/a n/a n/a Hungary 22 410 n/a 28 013 19 049 n/a 16 808 18 769 20 169 16 808 19 609 Ireland 33 469 47 347 37 551 36 646 n/a 42 449 36 735 56 327 46 122 53 061 Italy 27 209 34 688 28 962 23 786 17 839 21 804 24 777 29 732 26 759 27 405 Lithuania n/a n/a n/a n/a n/a n/a n/a n/a n/a n/a Luxembourg 43 666 73 826 63 758 76 133 50 336 67 114 67 114 n/a n/a n/a Malta * n/a n/a n/a 26 460 n/a n/a 32 298 35 963 47 826 36 646 Netherlands 45 830 48 121 45 830 45 830 27 077 36 664 39 413 n/a 57 287 59 578 Poland 22 902 73 078 35 394 8 045 7 995 2 078 18 321 20 216 n/a 20 216 Portugal 16 341 17 800 17 305 11 867 13 597 16 378 13 943 19 468 25 884 22 250 Romania * 17 640 23 121 20 381 2 906 n/a n/a 15 489 n/a n/a n/a Slovakia 22 072 16 216 19 219 19 520 13 101 n/a 20 420 n/a n/a 16 937 Slovenia 25 031 25 031 25 031 18 773 18 773 17 522 22 528 n/a n/a 27 034 Spain 16 630 27 716 17 738 26 608 23 282 22 173 22 173 57 650 45 455 53 215 Sweden 43 904 62 720 52 326 40 320 n/a 38 707 41 037 41 485 46 448 41 996 Turkey 46 164 30 776 41 034 16 003 21 004 9 233 18 465 24 621 22 928 23 082 United Kingdom 25 752 48 588 38 871 38 871 n/a 35 955 38 871 38 540 57 143 46 645 2016 EUR-27 35 679 49 640 39 643 29 732 19 822 27 750 34 277 34 563 29 732 33 3792014 EUR-26 29 070 38 760 31 977 28 571 19 380 29 636 29 070 31 159 31 372 31 2242012 EUR-25 29 098 39 767 29 098 28 167 19 399 29 098 28 487 32 004 29 098 30 8072010 EUR-23 30 144 40 000 33 364 27 556 25 416 32 517 29 852 34 223 27 556 31 9572008 EUR-17 37 895 43 605 38 952 30 182 29 070 43 605 34 597 33 915 26 964 32 131
CHART 4-4EARNINGS BY FIELD OF EMPLOYMENT (ADJUSTED FOR PPP)
aver
age
earn
ings
€' a
djus
ted
for P
PP
other
publi
c
local
autho
rity/
gove
rnmen
t
other
priva
te
freela
nce
salar
ied
priva
te pr
actic
e
partn
er/di
recto
r
sole
princ
ipal
010000
20000
30000
40000
50000
other publiclocal authority /government
other privatefreelancesalariedprivate practice
partner/directorsole principal
4 - 51The ArchITecTurAl ProfessIon In euroPe 2016

Mirza & Nacey Reserach LtdSouthdown HouseFord Lane, FordArundelWest SussexBN18 0DEUnited Kingdom
Telephone: +44 1243 555302email: [email protected]
MIRZA & NACEY RESEARCH
Registered office: Southdown House, Ford Lane, Ford, Arundel, West Sussex BN18 0DE. Registered in England and Wales. Company No. 04618115
4.3 eArnIngs by Age
CHART 4-5AVERAGE EARNINGS BY AGE (ADJUSTED FOR PPP)
€ 2016* 2014 EUROPE-26
MEDIAN
2012 EUROPE-25
MEDIAN
2010 EUROPE-23
MEDIAN
2008 EUROPE-17
MEDIANlower quartile MEDIAN upper quartile
<30 7 136 16 848 27 197 14 241 14 549 15 615 17 041
30-34 12 099 22 995 34 012 14 763 19 399 24 550 29 214
35-39 14 866 26 759 40 814 30 189 24 902 30 075 34 677
40-44 17 505 29 732 48 980 32 704 29 098 33 364 38 760
45-49 19 822 36 022 57 259 38 611 33 800 33 364 39 729
50-54 23 031 40 634 66 540 44 025 36 081 34 317 42 391
55-59 23 524 42 440 71 581 44 824 38 797 35 119 43 647
60-64 23 935 42 751 70 940 48 264 41 370 40 875 41 890
65+ 28 537 39 374 56 230 29 151 37 354 36 095 n/a
TABLE 4-3AVERAGE EARNINGS ANALYSED BY AGE (ADJUSTED FOR PPP)
aver
age
earn
ings
€ a
djus
ted
for P
PP
65 an
d ove
r
60-6
455
-59
50-5
445
-49
40-4
435
-39
30-3
4
unde
r 30
0
10000
20000
30000
40000
50000
65 and over60-6455-5950-5445-4940-4435-3930-34under 30
This year, Partners and Directors earn 39 per cent more than the next highest paid employment group, Sole Principals. Average earnings for both groups have increased markedly since 2014; Sole Principals’ average earnings are 23 per cent higher; while that for Partners and Directors is up by 28 per cent.
Average salaries of private practice salaried staff are 4 per cent higher while freelancers’ earnings are higher by 2 per cent. But average salaries for architects working in ‘other’ private areas are lower in 2016 than in the 2014 survey.
Average salaries of local or central government architects have increased by 11 per cent, but those in other parts of the public sector report a fall in salaries, which are 5 per cent lower. Architects’ average earnings rise in line with age. The increases between each five year age group are fairly even up to age 50. Peak earnings are achieved at age 55 to 64.
In all cases, figures quoted are based on data which has been adjusted for PPP.
* 2016 figures include Germany 2016 figures for Partners/Directors/Sole Principals plus an estimate, based on 2014 Germany data, for employment fields not included in the 2016 survey.
4 - 52The ArchITecTurAl ProfessIon In euroPe 2016
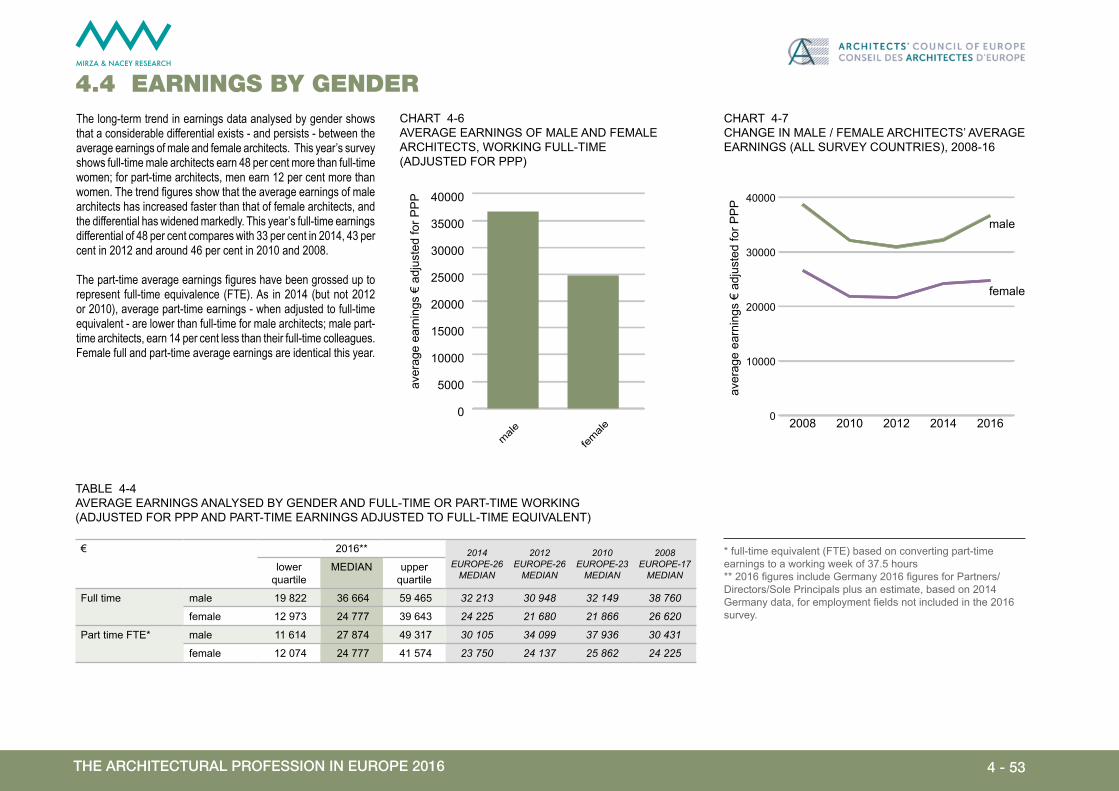
Mirza & Nacey Reserach LtdSouthdown HouseFord Lane, FordArundelWest SussexBN18 0DEUnited Kingdom
Telephone: +44 1243 555302email: [email protected]
MIRZA & NACEY RESEARCH
Registered office: Southdown House, Ford Lane, Ford, Arundel, West Sussex BN18 0DE. Registered in England and Wales. Company No. 04618115
4.4 eArnIngs by gender
* full-time equivalent (FTE) based on converting part-time earnings to a working week of 37.5 hours** 2016 figures include Germany 2016 figures for Partners/Directors/Sole Principals plus an estimate, based on 2014 Germany data, for employment fields not included in the 2016 survey.
€ 2016** 2014 EUROPE-26
MEDIAN
2012 EUROPE-26
MEDIAN
2010 EUROPE-23
MEDIAN
2008 EUROPE-17
MEDIANlower
quartileMEDIAN upper
quartile
Full time male 19 822 36 664 59 465 32 213 30 948 32 149 38 760
female 12 973 24 777 39 643 24 225 21 680 21 866 26 620
Part time FTE* male 11 614 27 874 49 317 30 105 34 099 37 936 30 431
female 12 074 24 777 41 574 23 750 24 137 25 862 24 225
TABLE 4-4AVERAGE EARNINGS ANALYSED BY GENDER AND FULL-TIME OR PART-TIME WORKING (ADJUSTED FOR PPP AND PART-TIME EARNINGS ADJUSTED TO FULL-TIME EqUIVALENT)
The long-term trend in earnings data analysed by gender shows that a considerable differential exists - and persists - between the average earnings of male and female architects. This year’s survey shows full-time male architects earn 48 per cent more than full-time women; for part-time architects, men earn 12 per cent more than women. The trend figures show that the average earnings of male architects has increased faster than that of female architects, and the differential has widened markedly. This year’s full-time earnings differential of 48 per cent compares with 33 per cent in 2014, 43 per cent in 2012 and around 46 per cent in 2010 and 2008.
The part-time average earnings figures have been grossed up to represent full-time equivalence (FTE). As in 2014 (but not 2012 or 2010), average part-time earnings - when adjusted to full-time equivalent - are lower than full-time for male architects; male part-time architects, earn 14 per cent less than their full-time colleagues. Female full and part-time average earnings are identical this year.
0
5000
10000
15000
20000
25000
30000
35000
40000
aver
age
earn
ings
€ a
djus
ted
for P
PP
female
male
CHART 4-6AVERAGE EARNINGS OF MALE AND FEMALE ARCHITECTS, WORKING FULL-TIME (ADJUSTED FOR PPP)
CHART 4-7CHANGE IN MALE / FEMALE ARCHITECTS’ AVERAGE EARNINGS (ALL SURVEY COUNTRIES), 2008-16
0
10000
20000
30000
40000
20162014201220102008
aver
age
earn
ings
€ a
djus
ted
for P
PP
male
female
4 - 53The ArchITecTurAl ProfessIon In euroPe 2016

Mirza & Nacey Reserach LtdSouthdown HouseFord Lane, FordArundelWest SussexBN18 0DEUnited Kingdom
Telephone: +44 1243 555302email: [email protected]
MIRZA & NACEY RESEARCH
Registered office: Southdown House, Ford Lane, Ford, Arundel, West Sussex BN18 0DE. Registered in England and Wales. Company No. 04618115
per cent / numberarchitects who have worked in another
European country in last 12 months (%)
of whom: average (mean) number of countries working in for...
have seriously considered working in another country, last 12 months (%)
architects part/wholly educated in different country from the one in which principally
established (%)short periods
(up to16 weeks)
longer periods (>16 weeks) or on-going work
Austria 13 1.2 1.6 22 22Belgium 9 3.3 0.4 15 22Bulgaria 9 1.0 0.4 28 20Croatia 4 0.8 0.6 31 31Cyprus * 7 1.7 1.0 53 76Czech Republic * 7 0.3 0.5 23 41Denmark 6 1.0 0.7 20 31Estonia * 2 3.0 0.0 33 16Finland 1 1.0 0.8 14 26France 4 1.8 1.4 15 25Germany *** 5 1.3 1.3 n/a 14Hungary 7 1.4 1.1 21 11Ireland 12 1.2 0.8 21 35Italy 4 1.0 0.8 42 12Lithuania 4 2.2 0.8 7 16Luxembourg 37 0.9 0.8 33 87Malta * 0 0.0 0.0 16 33Netherlands 14 1.5 1.2 18 21Poland 3 0.0 0.0 45 17Portugal 5 0.9 0.7 38 25Romania * 5 1.0 0.0 21 15Slovakia 9 1.5 0.7 23 18Slovenia 15 1.2 0.8 44 25Spain 4 1.0 0.7 42 19Sweden 4 1.0 0.7 28 37Turkey 2 4.4 3.0 51 16United Kingdom 8 1.8 1.1 25 282016 EUROPE-27** 5 1.3 1.0 36 182014 EUROPE-26** 5 1.3 1.0 35 182012 EUROPE-25** n/a n/a n/a 35 n/a2010 EUROPE-23 n/a n/a n/a n/a n/a2008 EUROPE-17 n/a n/a n/a n/a n/a
TABLE 4-5PROPORTION OF ARCHITECTS WHO HAVE WORKED IN ANOTHER EUROPEAN COUNTRY, LAST 12 MONTHS
Five per cent of architect respondents have worked in another European country in the last 12 months. This is the same proportion as in the last survey. The 2016 figure includes more than 10 per cent of architects in Luxembourg, Slovenia, Austria, the Netherlands and Ireland. On average, architects who have worked in another European country in the last year have worked in just one other country. The figure of 5 per cent of architects who have worked in another European country compares with 36 per cent who have seriously considered working in another country in the past year. At least 40 per cent of architects in Cyprus, Turkey, Poland, Slovenia, Spain and Italy have seriously considered this. By comparing the country in which respondents are established with that where their current office is we can estimate the level of architects working in another country. This figure is 2.2 per cent, almost identical to the 2014 figure (table 4-6).
Eighteen per cent of respondents studied in a different European country from the one in which they are now principally established. This is the same proportion as in the 2014 survey. The highest proportion is recorded by architects in Luxembourg (87 per cent) and in Cyprus (76 per cent).
4.5 workIng In AnoTher euroPeAn counTry
* caution - small sample *** Germany figures are for Partners/Directors/Sole Principals onlyn/a = question not asked** total figure is a weighted average and takes account of the number of architects in each participating country
4 - 54The ArchITecTurAl ProfessIon In euroPe 2016

Mirza & Nacey Reserach LtdSouthdown HouseFord Lane, FordArundelWest SussexBN18 0DEUnited Kingdom
Telephone: +44 1243 555302email: [email protected]
MIRZA & NACEY RESEARCH
Registered office: Southdown House, Ford Lane, Ford, Arundel, West Sussex BN18 0DE. Registered in England and Wales. Company No. 04618115
CHART 4-8ARCHITECTS WHO WERE AT LEAST PARTLY EDUCATED IN ANOTHER EUROPEAN COUNTRY, COMPARED WITH ARCHITECTS WHO HAVE SERIOUSLY CONSIDERED WORKED IN ANOTHER EUROPEAN COUNTRY
per cent architects0 20 40 60 80 100
Hungary
Italy
Germany
Romania
Lithuania
Estonia
Turkey
Poland
Slovakia
Spain
Bulgaria
Netherlands
Austria
Belgium
France
Portugal
Slovenia
Finland
United Kingdom
Denmark
Croatia
Malta
Ireland
Sweden
Czech Republic
Cyprus
Luxembourg
seriously considered working in another European country in the last 12 months
part or all of architectural education undertaken in another European country
** total figure is a weighted average and takes account of the number of architects in each participating country
per cent architects working / resident in different country from
the one in which principally established (%)
2016 EUROPE-27 2.22014 EUROPE-26 2.32012 EUROPE-25** 2.92010 EUROPE-23** 3.42008 EUROPE-17** 7.0
TABLE 4-6PROPORTION OF ARCHITECTS WORKING IN A DIFFERENT COUNTRY FROM WHERE PRINCIPALLY ESTABLISHED
4 - 55The ArchITecTurAl ProfessIon In euroPe 2016

Mirza & Nacey Reserach LtdSouthdown HouseFord Lane, FordArundelWest SussexBN18 0DEUnited Kingdom
Telephone: +44 1243 555302email: [email protected]
MIRZA & NACEY RESEARCH
Registered office: Southdown House, Ford Lane, Ford, Arundel, West Sussex BN18 0DE. Registered in England and Wales. Company No. 04618115
4.6 mAIn concerns AbouT workIng In AnoTher counTry
per centunable to find work
insufficient language
skills
insufficient knowledge of planning / building
regulations
architectural qualification
issues
practical, relocation
or personal issues
knowledge of local market
knowledge of local fee
scales / tariffs
PII cover for work in other
European countries
Austria 11 21 46 7 41 36 13 12Belgium 9 22 50 8 45 43 14 13Bulgaria 33 28 46 14 39 37 18 14Croatia 12 26 43 12 56 29 11 8Cyprus * 29 22 33 9 48 38 17 12Czech Republic * 5 43 61 16 45 16 14 14Denmark 13 27 52 15 72 35 22 7Estonia * 15 23 39 5 53 22 12 9Finland 17 39 45 10 47 48 20 15France 17 39 45 10 47 48 20 15Germany *** 40 30 42 25 34 30 17 22Hungary 8 37 36 12 36 24 7 1Ireland 20 40 45 8 46 30 15 14Italy 12 41 30 8 68 24 6 6Lithuania 17 23 27 11 18 27 11 9Luxembourg 13 6 21 7 28 28 9 8Malta * 18 16 51 13 60 40 18 16Netherlands 11 16 37 11 33 32 6 11Poland 23 44 63 17 33 29 14 15Portugal 23 23 25 8 54 19 8 5Romania * 24 21 32 32 53 29 5 8Slovakia 19 37 41 14 28 43 20 11Slovenia 37 20 57 15 39 32 13 19Spain 38 47 48 19 25 34 13 12Sweden 7 9 16 6 36 12 4 3Turkey 46 42 32 33 27 26 12 6United Kingdom 22 45 43 10 42 30 14 132016 EUROPE-27 25 36 38 16 46 29 12 112014 EUROPE-26 18 38 37 11 47 26 11 102012 EUROPE-25 19 39 35 11 66 n/a n/a n/a2010 EUROPE-23 n/a n/a n/a n/a n/a n/a n/a n/a2008 EUROPE-17 n/a n/a n/a n/a n/a n/a n/a n/a
Nearly half of respondents think that practical, relocation or personal issues are the main concerns about working in another country. Other significant concerns are not having sufficient knowledge of planning or building regulations and having insufficient language skills. The proportion of respondents who mention each of these top three concerns is very similar to the last survey. However, more architects report two other concerns than did in the 2014 survey; the proportion who are held back by a lack of knowledge of the local market has increased, while many more say they are unable to find work in another country this year. If we compare architects who have worked in another country with those who have not, practical and language concerns are significantly less important amongst those who have already worked in another country.
TABLE 4-7MAIN CONCERNS ABOUT WORKING IN ANOTHER COUNTRY CITED BY RESPONDING ARCHITECTS
per cent architects 0 10 20 30 40 50
PII insurance
fee scale knowledge
qualification
unable to find work
market knowledge
language
building regulations knowledge
relocation / personal
CHART 4-9MAIN CONCERNS - WORKING IN ANOTHER COUNTRY
* caution - small sample *** Germany figures are for Partners/Directors/Sole Principals only2012/10/08 n/a = question was not asked
4 - 56The ArchITecTurAl ProfessIon In euroPe 2016

Mirza & Nacey Reserach LtdSouthdown HouseFord Lane, FordArundelWest SussexBN18 0DEUnited Kingdom
Telephone: +44 1243 555302email: [email protected]
MIRZA & NACEY RESEARCH
Registered office: Southdown House, Ford Lane, Ford, Arundel, West Sussex BN18 0DE. Registered in England and Wales. Company No. 04618115
4.7 reTIremenTTABLE 4-8AGE AT WHICH ARCHITECTS EXPECT TO RETIRE, ANALYSED BY COUNTRY
CHART 4-10AGE AT WHICH ARCHITECTS EXPECT TO RETIRE
per cent under 50 50-54 55-59 60-64 65-69 70-74 75-79 80-84 85 or over never
Austria 1 0 0 6 36 33 9 2 1 12Belgium 0 0 3 20 48 15 3 1 1 9Bulgaria 1 1 3 25 28 12 6 3 4 17Croatia 0 1 3 22 41 8 4 1 1 20Cyprus * 0 2 0 19 46 14 2 4 0 14Czech Republic * 0 0 0 20 27 14 5 0 2 32Denmark 0 0 0 8 52 26 7 1 0 5Estonia * 0 0 9 6 26 13 11 15 0 20Finland 0 0 0 22 57 8 2 0 2 7France 0 0 2 21 42 16 4 2 2 11Germany n/a n/a n/a n/a n/a n/a n/a n/a n/a n/aHungary 0 0 3 24 33 12 8 1 2 16Ireland 0 0 2 10 41 25 6 2 1 14Italy 0 0 1 13 32 21 8 2 1 22Lithuania 0 0 4 25 42 12 4 1 2 10Luxembourg 0 0 5 33 33 14 1 2 0 11Malta * 0 2 9 29 40 9 7 0 0 4Netherlands 0 0 0 7 49 23 4 2 1 11Poland 1 2 2 9 25 16 6 5 3 32Portugal 0 1 2 13 41 10 4 2 2 26Romania * 0 5 0 22 32 8 3 5 8 16Slovakia 2 0 2 21 31 15 8 2 2 19Slovenia 0 1 2 15 39 10 7 2 1 22Spain 1 0 0 8 44 21 3 1 1 20Sweden 0 0 1 12 62 16 4 1 0 3Turkey 9 15 18 21 14 5 1 1 1 16United Kingdom 0 1 2 12 39 25 6 2 1 112016 EUR-27 1 2 3 14 35 18 6 2 1 182014 EUR-26 1 1 2 15 38 15 6 2 1 192012 EUR-25 1 1 2 14 34 16 6 2 2 232010 EUR-23 2 3 5 20 37 13 4 1 1 142008 EUR-17 3 4 7 20 39 11 3 1 1 12
* caution - small sample
0
5
10
15
20
25
30
35
40
Never
85 or over
80-84
75-79
70-74
65-69
60-64
55-59
50-54
under 50
per c
ent r
espo
nden
ts
never
85 or over80-84
75-7970-74
65-6960-64
55-5950-54
under 50
The peak age for retirement is expected to be at age 65 to 69; 35 per cent of architects say they expect to retire at this age. Fourteen per cent expect to retire at age 60 to 64, but just 6 per cent expect to retire at an age younger than 60. Eighteen per cent will not retire before they are aged 70; another 9 per cent will not retire until beyond 75. Eighteen per cent will ‘never’ retire.
4 - 57The ArchITecTurAl ProfessIon In euroPe 2016

Mirza & Nacey Reserach LtdSouthdown HouseFord Lane, FordArundelWest SussexBN18 0DEUnited Kingdom
Telephone: +44 1243 555302email: [email protected]
MIRZA & NACEY RESEARCH
Registered office: Southdown House, Ford Lane, Ford, Arundel, West Sussex BN18 0DE. Registered in England and Wales. Company No. 04618115
definitely noprobably no
not sure
probably yes
definitelyyes
TABLE 4-9WHETHER ARCHITECTS WILL CONTINUE TO PRACTICE THEIR PROFESSION UNTIL THEY RETIRE
CHART 4-11LIKELIHOOD OF CONTINUING TO WORK AS AN ARCHITECT UNTIL RETIREMENT
per cent definitely yes probably yes not sure probably no definitely noAustria 51 41 6 2 0Belgium 28 43 22 4 2Bulgaria 57 25 16 0 1Croatia 45 40 11 3 1Cyprus * 38 45 16 2 0Czech Republic * 36 45 18 0 0Denmark 46 41 9 3 1Estonia * 45 53 2 0 0Finland 38 50 9 2 0France 28 42 22 6 2Germany n/a n/a n/a n/a n/aHungary 54 30 14 2 0Ireland 40 43 14 3 1Italy 29 35 24 8 3Lithuania 51 34 13 2 1Luxembourg 50 45 5 0 0Malta * 13 62 22 2 0Netherlands 33 46 15 3 2Poland 52 36 7 3 2Portugal 39 31 21 7 2Romania * 78 14 8 0 0Slovakia 46 39 12 2 1Slovenia 56 20 19 3 2Spain 39 32 20 8 1Sweden 48 39 9 3 1Turkey 40 39 16 4 1United Kingdom 37 46 11 4 22016 EUROPE-27 36 37 19 6 22014 EUROPE-26 36 38 18 6 22012 EUROPE-25 35 39 18 6 22010 EUROPE-23 41 43 12 3 12008 EUROPE-17 39 42 13 4 2
The likelihood of respondents continuing to work as an architect until they retire remains virtually unchanged from the last survey. Thirty six per cent will “definitely” continue to work as an architect, 37 per cent will “probably” continue to work.
Nineteen per cent are not sure, while just 6 per cent say they will “probably not” continue to practice as an architect but just 2 per cent say “definitely not”. The highest proportions of architects responding “probably not” or “definitely not” are from Italy, Portugal and Spain.
* caution - small sample
4 - 58The ArchITecTurAl ProfessIon In euroPe 2016

Mirza & Nacey Reserach LtdSouthdown HouseFord Lane, FordArundelWest SussexBN18 0DEUnited Kingdom
Telephone: +44 1243 555302email: [email protected]
MIRZA & NACEY RESEARCH
Registered office: Southdown House, Ford Lane, Ford, Arundel, West Sussex BN18 0DE. Registered in England and Wales. Company No. 04618115
4.8 hours worked
number of hours difference between contracted and worked hours
per week
sole principal n/a
partner/director n/a
private practice salaried 4.8
freelance 6.8
other private 5.4
local / central government 3.3
other public 4.6
2016 EUROPE-27 5.0 *
2014 EUROPE-26 3.7
2012 EUROPE-25 3.92010 EUROPE-23 3.52008 EUROPE-17 4.9
Sole Principals and Partners & Directors report longer working hours than salaried architects in private practice, who in turn report longer hours than those in the public sector. Partners/Directors work on average 49 hours per week, and Sole Principals 47 hours. Salaried architects in private practice work, on average, 43 hours per week. The average working week in the public sector is 40 hours.
A working week in excess of 50 hours is reported by Sole Principals in Germany, Malta, Belgium, Austria, Cyprus, and Slovakia; and by Partners & Directors in Czech Republic, Lithuania, Malta and Germany. Private practice salaried staff in Belgium also average over 50 hours per week.
TABLE 4-11AVERAGE (MEAN) NUMBER OF HOURS WORKED PER WEEK, ANALYSED BY COUNTRY AND FIELD OF EMPLOYMENT
TABLE 4-10DIFFERENCE BETWEEN AVERAGE HOURS CONTRACTED TO WORK AND AVERAGE HOURS WORKED
hours / weeksole principal partner/
director
private practice salaried
freelance other private local / central government other public
Austria 50.1 49.5 44.4 46.5 n/a 35.0 n/aBelgium 50.4 49.6 50.4 46.1 48.1 40.1 43.3Bulgaria 46.8 47.9 45.3 47.5 39.3 49.3 28.3Croatia 43.5 46.9 42.7 47.5 41.0 41.5 45.5Cyprus * 50.2 48.0 39.9 50.0 40.0 38.0 39.3Czech Republic * 49.9 55.0 46.7 42.0 n/a 38.0 n/aDenmark 44.1 46.3 39.1 46.0 40.4 37.2 38.2Estonia * 48.0 44.0 47.2 n/a n/a 40.0 40.0Finland 44.6 45.5 39.2 50.0 41.3 39.3 40.2France 48.1 44.6 43.3 46.3 46.5 41.0 41.8Germany *** 51.7 51.6 41.7 47.7 48.9 40.4 n/aHungary 48.0 40.0 41.5 45.0 47.4 40.9 38.3Ireland 46.5 47.0 42.8 46.3 43.8 41.2 43.3Italy 41.6 44.4 42.2 43.3 42.8 39.7 38.9Lithuania 45.4 53.8 40.1 52.4 45.1 39.8 40.0Luxembourg 40.3 45.8 44.7 39.6 36.2 n/a n/aMalta * 51.7 60.0 45.8 55.0 45.0 44.7 45.0Netherlands 47.3 48.7 42.8 41.6 45.3 39.0 41.7Poland 47.0 46.0 45.9 46.9 41.8 47.5 40.0Portugal 42.2 42.9 43.6 43.0 45.4 38.1 40.8Romania * 47.6 47.1 44.8 n/a 45.3 40.0 49.0Slovakia 50.1 46.6 45.3 49.1 44.8 43.0 45.0Slovenia 38.9 47.8 42.7 42.1 41.4 43.0 43.3Spain 47.0 46.8 42.1 41.6 42.8 47.5 45.3Sweden 45.5 44.1 41.2 35.0 42.9 41.7 46.1Turkey 47.6 46.3 49.7 44.0 52.9 40.3 40.4United Kingdom 42.4 43.6 43.3 44.4 42.9 40.6 40.22016 EUROPE-27 47.2 48.8 43.1 44.5 44.0 40.0 40.02014 EUROPE-26 44.5 45.3 43.9 42.9 44.0 40.3 41.02012 EUROPE-25 45.3 46.1 43.2 40.2 43.1 38.1 38.92010 EUROPE-23 46.2 45.8 41.2 43.9 44.8 38.3 38.42008 EUROPE-17 51.0 50.1 46.0 47.0 46.6 42.2 43.3
* caution - small sample *** Germany figures provided by BAK, sourced from BAK surveys 2015 and 2016.
* ALL figure no longer includes Partners/Directors/Sole Principals
4 - 59The ArchITecTurAl ProfessIon In euroPe 2016

Mirza & Nacey Reserach LtdSouthdown HouseFord Lane, FordArundelWest SussexBN18 0DEUnited Kingdom
Telephone: +44 1243 555302email: [email protected]
MIRZA & NACEY RESEARCH
Registered office: Southdown House, Ford Lane, Ford, Arundel, West Sussex BN18 0DE. Registered in England and Wales. Company No. 04618115
4.9 conTInuIng ProfessIonAl develoPmenT (cPd)The number of hours of CPD undertaken per year by architects is higher this year (average of 24 hours) compared with the 2014 survey (20 hours). Both figures are below the average number of hours recorded in 2012. The average number of hours of CPD undertaken varies considerably between countries, ranging from zero (Turkey, France, Czech Republic) to 100 (Bulgaria). Half the countries surveyed report averages of between 15 and 35 hours per year.
The personal expenditure on CPD activities also varies considerably. The average spend is €300, but in Austria and Denmark the spend is €1000 or more. Personal expenditure on CPD is higher than in the 2014 survey but the same as in 2012; in 2014 several countries reported zero spend while this year none report zero.
Partners and Directors report the highest average number of hours spent undertaking CPD; and they also report the highest personal spend on CPD of any of the main employment groups.
average (median) number hours CPD per year
average (median) personal expenditure on CPD, € per year
Austria 30 1000Belgium 20 500Bulgaria 100 524Croatia 10 163Cyprus * 16 111Czech Republic * 0 n/aDenmark 20 1343Estonia * 20 800Finland 10 500France 0 n/aGermany *** 30 n/aHungary 50 160Ireland 40 500Italy 25 250Lithuania 10 150Luxembourg 16 800Malta * 5 120Netherlands 24 500Poland 24 500Portugal 8 246Romania * 10 400Slovakia 10 558Slovenia 35 325Spain 18 450Sweden 20 869Turkey 0 n/aUnited Kingdom 35 2552016 EUROPE-27 24 3002014 EUROPE-26 20 1502012 EUROPE-25 38 3002010 EUROPE-23** n/a n/a2008 EUROPE-17** n/a n/a
TABLE 4-12CPD HOURS AND SPEND, ANALYSED BY COUNTRY
* caution small sample ** question was not asked in 2008 or 2010*** Germany figures are for Partners/Directors/Sole Principals only
4 - 60The ArchITecTurAl ProfessIon In euroPe 2016
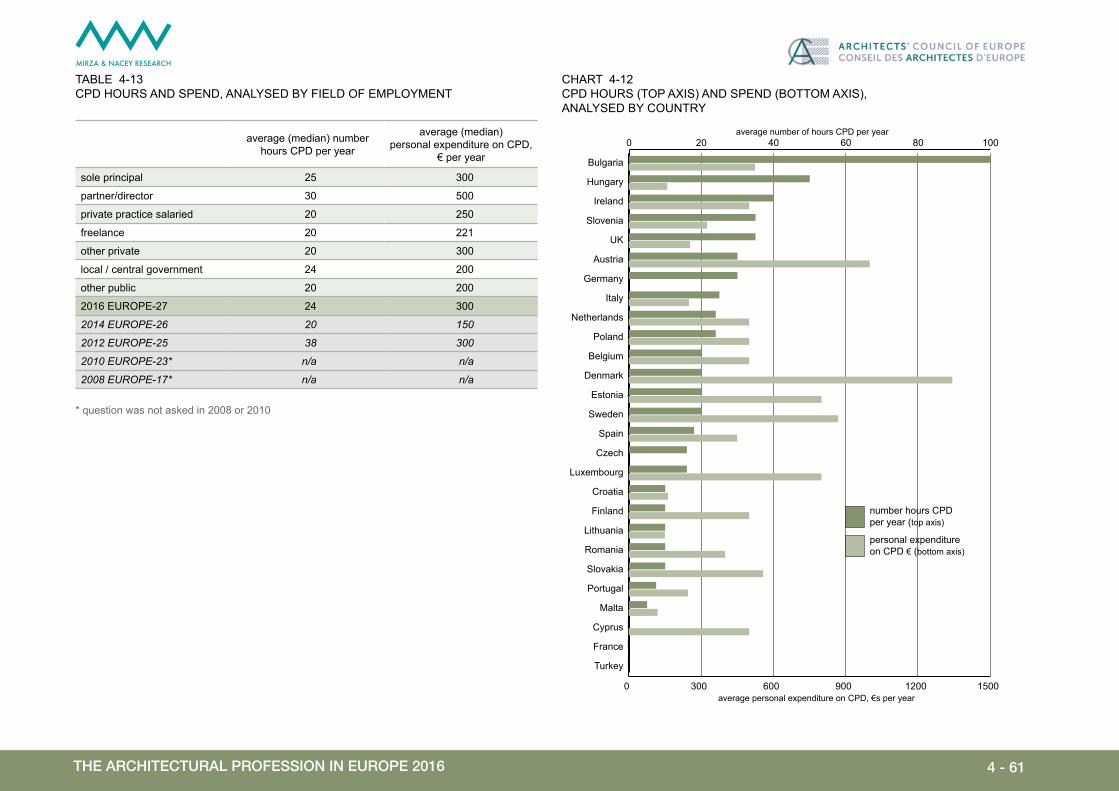
Mirza & Nacey Reserach LtdSouthdown HouseFord Lane, FordArundelWest SussexBN18 0DEUnited Kingdom
Telephone: +44 1243 555302email: [email protected]
MIRZA & NACEY RESEARCH
Registered office: Southdown House, Ford Lane, Ford, Arundel, West Sussex BN18 0DE. Registered in England and Wales. Company No. 04618115
0 20 40 60 80 100
Turkey
France
Cyprus
Malta
Portugal
Slovakia
Romania
Lithuania
Finland
Croatia
Luxembourg
Czech
Spain
Sweden
Estonia
Denmark
Belgium
Poland
Netherlands
Italy
Germany
Austria
UK
Slovenia
Ireland
Hungary
Bulgaria
0 300 600 900 1200 1500average personal expenditure on CPD, €s per year
personal expenditureon CPD € (bottom axis)
number hours CPD per year (top axis)
average number of hours CPD per yearaverage (median) number hours CPD per year
average (median) personal expenditure on CPD,
€ per year
sole principal 25 300
partner/director 30 500
private practice salaried 20 250
freelance 20 221
other private 20 300
local / central government 24 200
other public 20 200
2016 EUROPE-27 24 300
2014 EUROPE-26 20 150
2012 EUROPE-25 38 300
2010 EUROPE-23* n/a n/a
2008 EUROPE-17* n/a n/a
CHART 4-12CPD HOURS (TOP AXIS) AND SPEND (BOTTOM AXIS), ANALYSED BY COUNTRY
TABLE 4-13CPD HOURS AND SPEND, ANALYSED BY FIELD OF EMPLOYMENT
* question was not asked in 2008 or 2010
4 - 61The ArchITecTurAl ProfessIon In euroPe 2016

Mirza & Nacey Reserach LtdSouthdown HouseFord Lane, FordArundelWest SussexBN18 0DEUnited Kingdom
Telephone: +44 1243 555302email: [email protected]
MIRZA & NACEY RESEARCH
Registered office: Southdown House, Ford Lane, Ford, Arundel, West Sussex BN18 0DE. Registered in England and Wales. Company No. 04618115
4.10 buIldIng To neArly Zero energy sTAndArds
Architects report that they are being asked less frequently to build to Nearly Zero Energy standards now than in previous years. In 2016, 11 per cent of respondents are being asked by their clients to build to Nearly Zero Energy standards more than 50 per cent of the time, or always. This proportion of 11 per cent compares with 14 per cent in 2014 and 12 per cent in the previous two surveys. Similarly, the proportion of respondents who are being asked to build to Nearly Zero Energy standards “less than 10 per cent of the time” is now 65 per cent, compared with no more than 59 per cent in the previous three surveys. Countries with the highest proportion of architects saying that they are being asked to build to Nearly Zero Energy standards are Austria, and Luxembourg plus other countries with small sample sizes.
per cent respondents less than 10% of the time
between 10% and 25% of the time
between 26% and 50% of the time
more than 50% of the time always
Austria 32 15 17 29 8Belgium 58 18 12 10 3Bulgaria 62 19 13 5 1Croatia 69 13 8 7 3Cyprus * 43 16 10 16 16Czech Republic * 76 15 2 2 5Denmark 56 13 11 14 6Estonia * 43 21 13 23 0Finland 64 13 10 9 3France 60 16 10 9 5Germany ** n/a n/a n/a n/a n/aHungary * n/a n/a n/a n/a n/aIreland 70 14 7 7 3Italy 57 17 13 9 5Lithuania 32 22 19 13 14Luxembourg 27 20 11 30 12Malta * 63 23 5 7 2Netherlands 55 21 14 8 2Poland 84 13 2 0 1Portugal 66 14 10 7 3Romania * 71 13 13 3 0Slovakia 59 22 12 7 0Slovenia 69 10 10 11 1Spain 75 7 4 7 6Sweden 82 10 5 2 2Turkey 72 10 7 5 5United Kingdom 76 10 9 3 22016 EUROPE-27 65 14 10 7 42014 EUROPE-26 59 15 12 10 42012 EUROPE-25 53 20 14 9 32010 EUROPE-23 58 15 15 8 42008 EUROPE-17 n/a n/a n/a n/a n/a
TABLE 4-14HOW OFTEN ARCHITECTS ARE BEING ASKED TO BUILD TO NEARLY zERO ENERGY STANDARDS, ANALYSED BY COUNTRY
* caution - small sample ** no data because question was not asked 2008 - question was not asked in 2008
CHART 4-13HOW OFTEN ARCHITECTS ARE CURRENTLY BEING ASKED TO BUILD TO NEARLY zERO ENERGY STANDARDS
always
between 51 and99% of the time
between 26 and50% of the time
between 10 and25% of the time
less than 10%of the time
4 - 62The ArchITecTurAl ProfessIon In euroPe 2016
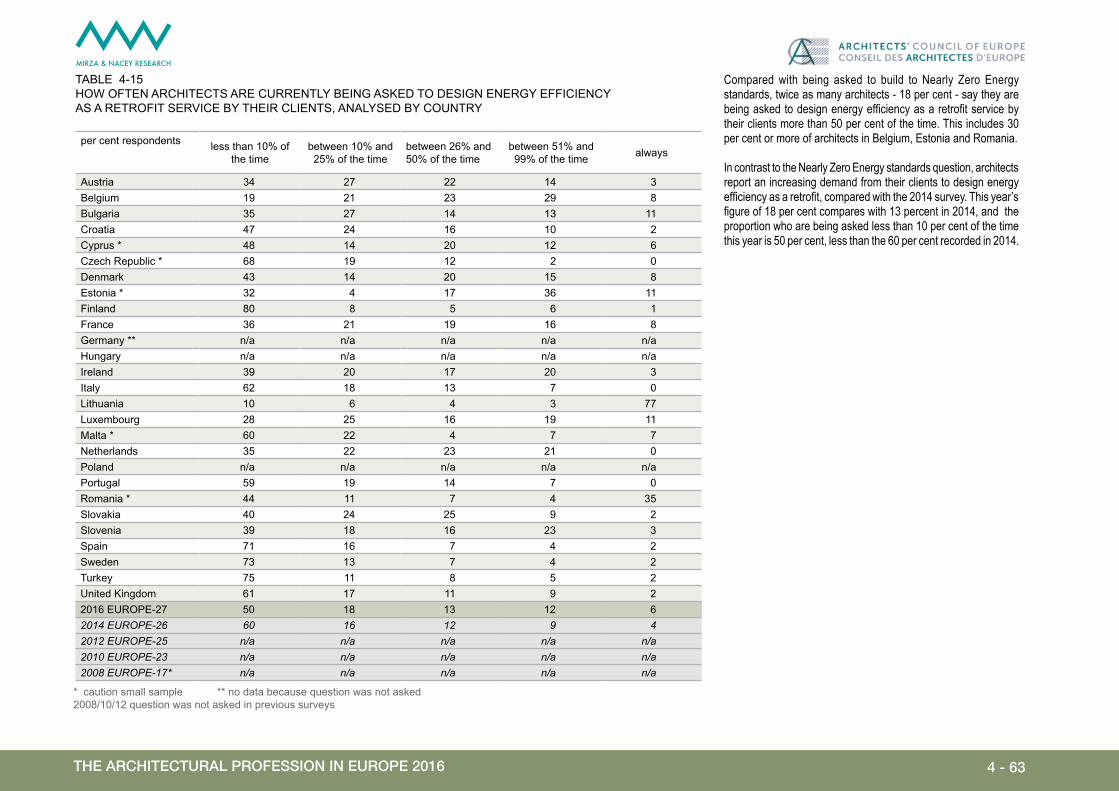
Mirza & Nacey Reserach LtdSouthdown HouseFord Lane, FordArundelWest SussexBN18 0DEUnited Kingdom
Telephone: +44 1243 555302email: [email protected]
MIRZA & NACEY RESEARCH
Registered office: Southdown House, Ford Lane, Ford, Arundel, West Sussex BN18 0DE. Registered in England and Wales. Company No. 04618115
per cent respondents less than 10% of the time
between 10% and 25% of the time
between 26% and 50% of the time
between 51% and 99% of the time always
Austria 34 27 22 14 3Belgium 19 21 23 29 8Bulgaria 35 27 14 13 11Croatia 47 24 16 10 2Cyprus * 48 14 20 12 6Czech Republic * 68 19 12 2 0Denmark 43 14 20 15 8Estonia * 32 4 17 36 11Finland 80 8 5 6 1France 36 21 19 16 8Germany ** n/a n/a n/a n/a n/aHungary n/a n/a n/a n/a n/aIreland 39 20 17 20 3Italy 62 18 13 7 0Lithuania 10 6 4 3 77Luxembourg 28 25 16 19 11Malta * 60 22 4 7 7Netherlands 35 22 23 21 0Poland n/a n/a n/a n/a n/aPortugal 59 19 14 7 0Romania * 44 11 7 4 35Slovakia 40 24 25 9 2Slovenia 39 18 16 23 3Spain 71 16 7 4 2Sweden 73 13 7 4 2Turkey 75 11 8 5 2United Kingdom 61 17 11 9 22016 EUROPE-27 50 18 13 12 62014 EUROPE-26 60 16 12 9 42012 EUROPE-25 n/a n/a n/a n/a n/a2010 EUROPE-23 n/a n/a n/a n/a n/a2008 EUROPE-17* n/a n/a n/a n/a n/a
TABLE 4-15HOW OFTEN ARCHITECTS ARE CURRENTLY BEING ASKED TO DESIGN ENERGY EFFICIENCY AS A RETROFIT SERVICE BY THEIR CLIENTS, ANALYSED BY COUNTRY
* caution small sample ** no data because question was not asked 2008/10/12 question was not asked in previous surveys
Compared with being asked to build to Nearly Zero Energy standards, twice as many architects - 18 per cent - say they are being asked to design energy efficiency as a retrofit service by their clients more than 50 per cent of the time. This includes 30 per cent or more of architects in Belgium, Estonia and Romania.
In contrast to the Nearly Zero Energy standards question, architects report an increasing demand from their clients to design energy efficiency as a retrofit, compared with the 2014 survey. This year’s figure of 18 per cent compares with 13 percent in 2014, and the proportion who are being asked less than 10 per cent of the time this year is 50 per cent, less than the 60 per cent recorded in 2014.
4 - 63The ArchITecTurAl ProfessIon In euroPe 2016
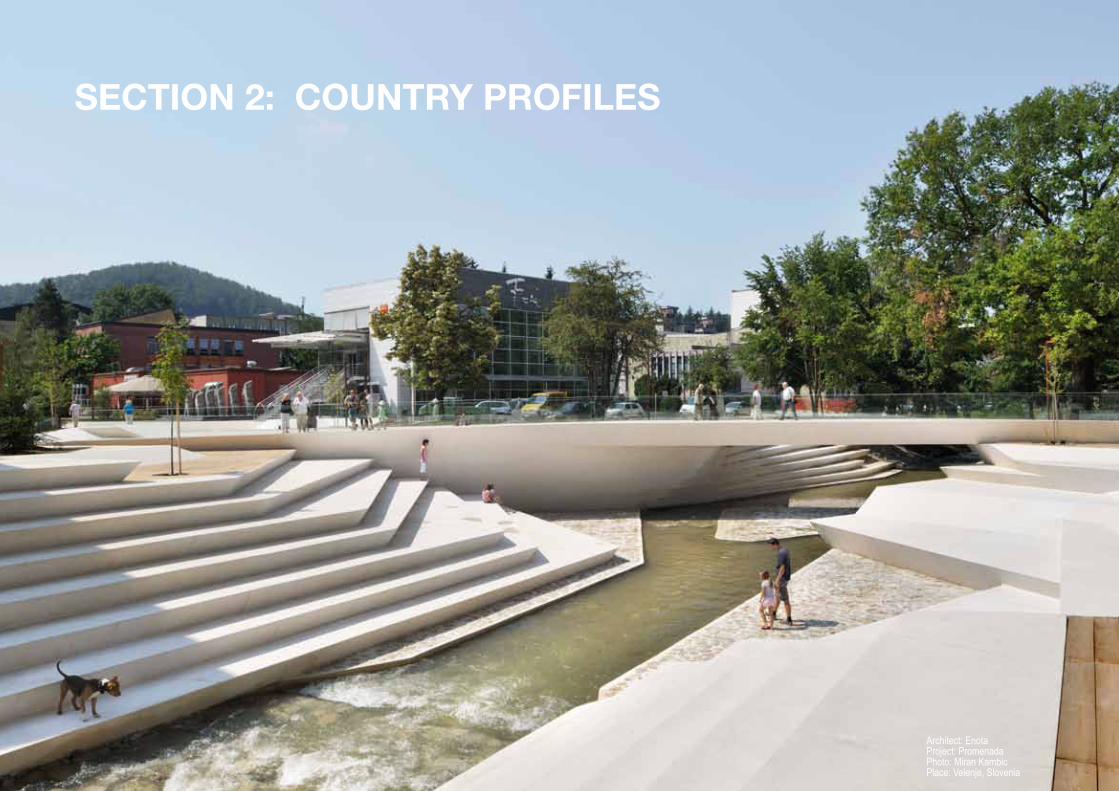
Architect: EnotaProject: PromenadaPhoto: Miran KambicPlace: Velenje, Slovenia

Mirza & Nacey Reserach LtdSouthdown HouseFord Lane, FordArundelWest SussexBN18 0DEUnited Kingdom
Telephone: +44 1243 555302email: [email protected]
MIRZA & NACEY RESEARCH
Registered office: Southdown House, Ford Lane, Ford, Arundel, West Sussex BN18 0DE. Registered in England and Wales. Company No. 04618115
page:
Austria 66Belgium 67Bulgaria 68Croatia 69Cyprus 70Czech Republic 71Denmark 72Estonia 73Finland 74France 75Germany 76Greece 77Hungary 78Ireland 79Italy 80Latvia 81Lithuania 82Luxembourg 83Malta 84Netherlands 85Poland 86Portugal 87Romania 88Slovakia 89Slovenia 90Spain 91Sweden 92Switzerland 93Turkey 94United Kingdom 95
Section 2 Contents
secTIon 2 - 65The ArchITecTurAl ProfessIon In euroPe 2016 / lA ProfessIon d’ArchITecTe en euroPe 2016

Mirza & Nacey Reserach LtdSouthdown HouseFord Lane, FordArundelWest SussexBN18 0DEUnited Kingdom
Telephone: +44 1243 555302email: [email protected]
MIRZA & NACEY RESEARCH
Registered office: Southdown House, Ford Lane, Ford, Arundel, West Sussex BN18 0DE. Registered in England and Wales. Company No. 04618115
Social & Economic Social & Economiqueconstruction / GDP previous year construction / PIB année précédente
Architectural Profession Profession d’architecte
Architectural Market Marché de l’architecture
Field of Employment Domaine d’activité
Aust
ria
2008 2010 2012 2014 2016
Population 8 331 930 8 375 290 8 443 018 8 507 786 8 700 471
GDP PIB € m 283 085 279 607 300 712 313 067 339 896
GDP/PIB head/habitant € 33 976 33 385 35 617 36 798 39 066
Construction € m 37 131 35 830 39 574 47 832 46 745
2008 2010 2012 2014 2016
Architects Architectes 3 800 4 500 4 600 4 600 5 200
% Male Homme 85 84 82 82 80
% Female Femme 15 16 18 18 20
% <40 years <40 ans 24 17 18 20 14
Practices Bureaux 1 773 1 476 1 640 1 842 1 832
2008 2010 2012 2014 2016
Market Marché (€ m) 297 256 263 281 279
Average revenue per practice (€) : Revenu moyen par bureaux d’architecture (€) :
2 persons personnes 198 915 148 967 107 774 140 842 122 690 6 - 10 persons personnes 457 591 614 141 643 469 625 091 696 923
per cent pourcentage
2008 2010 2012 2014 2016
Sole Principals Dirigeant unique 66 65 64 72 68
Partners & Directors Associé dirigeant 30 22 25 24 23
Private practice Salaried Salarié – Secteur privé 3 5 5 2 5
Private in-house L’industrie / commerce 0 1 0 0 0
Freelance Indépendant 0 2 2 2 1
Other Private Autres – Secteur privé 1 2 2 0 0
Local / central government Collectivité locale / gouvernement 0 1 1 0 0
Other Public Autre – secteur public 0 2 0 0 2
Trends 2008-16 Tendances 2008-16
Earnings Revenus
Response Réponse
2008 2010 2012 2014 2016
Participants Répondants 160 672 583 250 392
Accuracy of results 95% confidence Précision des résultats: 95% confiance +/-8 +/-4 +/-4 +/- 6 +/- 4.8
0
1000
2000
3000
4000
5000
6000
7000
201620142012201020080
100
200
300
400
500
600
700
num
ber a
rchi
tect
s/pr
actic
es n
ombr
e d’
arch
itect
es/b
urea
ux
total market size taille totale du m
arché €m
architects (left axis) architectes (axe de gauche) practices (left axis) bureaux (axe de gauche) market (right axis) marché (axe de droite)
Autric
he
* Earnings values are unadjusted for PPP * Revenu moyen NON ajusté par PPA
Average earnings €* Revenu moyen en € *
2008 2010 2012 2014 2016
Sole Principals Dirigeant unique 50 000 40 000 43 000 45 000 50 000
Partners & Directors Associé dirigeant 40 000 42 000 46 300 52 200 59 000
Private practice Salaried Salarié – Secteur privé n/a 40 000 39 000 43 900 37 650
Private in-house L’industrie / commerce n/a 40 000 42 000 n/a n/a
Freelance Indépendant n/a 52 500 65 000 31 500 n/a
Other Private Autres – Secteur privé n/a n/a 105 000 n/a n/a
Local / central government Collectivité locale / gouvernement n/a n/a 45 000 n/a n/a
Other Public Autre – secteur public 48 000 42 000 45 000 n/a n/a
secTIon 2 - 66The ArchITecTurAl ProfessIon In euroPe 2016 / lA ProfessIon d’ArchITecTe en euroPe 2016

Mirza & Nacey Reserach LtdSouthdown HouseFord Lane, FordArundelWest SussexBN18 0DEUnited Kingdom
Telephone: +44 1243 555302email: [email protected]
MIRZA & NACEY RESEARCH
Registered office: Southdown House, Ford Lane, Ford, Arundel, West Sussex BN18 0DE. Registered in England and Wales. Company No. 04618115
Social & Economic Social & Economiqueconstruction / GDP previous year construction / PIB année précédente
Architectural Profession Profession d’architecte
Architectural Market Marché de l’architecture
Field of Employment Domaine d’activité
belg
ium 2008 2010 2012 2014 2016
Population 10 666 866 10 827 000 11 041 266 11 203 992 11 289 853
GDP PIB € m 345 006 349 122 369 836 382 692 409 407
GDP/PIB head/habitant € 32 344 32 246 33 496 34 157 36 263
Construction € m 56 278 53 699 56 135 66 969 75 711
2008 2010 2012 2014 2016
Architects Architectes 11 500 13 000 13 200 15 000 15 100
% Male Homme 76 76 72 73 72
% Female Femme 24 24 28 27 28
% <40 years <40 ans 54 45 54 45 36
Practices Bureaux 3 894 4 167 3 709 3 677 3 350
2008 2010 2012 2014 2016
Market Marché (€ m) 327 556 529 436 610
Average revenue per practice (€) : Revenu moyen par bureaux d’architecture (€) :
2 persons personnes 88 979 116 434 78 786 114 414 365 053 6 - 10 persons personnes 171 167 613 153 439 862 575 696 675 677
Trends 2008-16 Tendances 2008-16
Earnings Revenus
Response Réponse
2008 2010 2012 2014 2016
Participants Répondants 318 756 446 815 496
Accuracy of results 95% confidence Précision des résultats: 95% confiance +/-5 +/-3 +/-4.6 +/- 3.3 +/- 4.3
0
5000
10000
15000
20000
25000
201620142012201020080
200
400
600
800
1000
num
ber a
rchi
tect
s/pr
actic
es n
ombr
e d’
arch
itect
es/b
urea
ux
total market size taille totale du m
arché €m
architects (left axis) architectes (axe de gauche) practices (left axis) bureaux (axe de gauche) market (right axis) marché (axe de droite)
belg
ique
* Earnings values are unadjusted for PPP * Revenu moyen NON ajusté par PPA
per cent pourcentage
2008 2010 2012 2014 2016
Sole Principals Dirigeant unique 21 21 15 26 25
Partners & Directors Associé dirigeant 12 11 8 11 9
Private practice Salaried Salarié – Secteur privé 8 7 7 11 6
Private in-house L’industrie / commerce 0 0 0 0 0
Freelance Indépendant 22 25 30 22 20
Other Private Autres – Secteur privé 28 29 33 24 33
Local / central government Collectivité locale / gouvernement 6 2 3 2 4
Other Public Autre – secteur public 3 4 4 3 1
Average earnings €* Revenu moyen en € *
2008 2010 2012 2014 2016
Sole Principals Dirigeant unique 30 600 30 000 45 000 35 000 40 000
Partners & Directors Associé dirigeant 24 000 45 000 45 000 45 000 47 400
Private practice Salaried Salarié – Secteur privé 24 000 40 000 47 500 36 000 50 000
Private in-house L’industrie / commerce 30 000 30 000 29 850 n/a n/a
Freelance Indépendant 31 000 30 000 30 000 28 000 32 330
Other Private Autres – Secteur privé 28 500 41 891 41 250 30 000 35 000
Local / central government Collectivité locale / gouvernement n/a 45 000 35 000 32 000 41 000
Other Public Autre – secteur public 30 000 32 330 31 700 40 900 40 852
secTIon 2 - 67The ArchITecTurAl ProfessIon In euroPe 2016 / lA ProfessIon d’ArchITecTe en euroPe 2016

Mirza & Nacey Reserach LtdSouthdown HouseFord Lane, FordArundelWest SussexBN18 0DEUnited Kingdom
Telephone: +44 1243 555302email: [email protected]
MIRZA & NACEY RESEARCH
Registered office: Southdown House, Ford Lane, Ford, Arundel, West Sussex BN18 0DE. Registered in England and Wales. Company No. 04618115
Social & Economic Social & Economiqueconstruction / GDP previous year construction / PIB année précédente
Architectural Profession Profession d’architecte
Architectural Market Marché de l’architecture
Field of Employment Domaine d’activité
bulg
ari
a2008 2010 2012 2014 2016
Population 7 640 238 7 563 710 7 327 224 7 245 677 7 153 784
GDP PIB € m 35 431 35 558 38 483 39 940 45 287
GDP/PIB head/habitant € 4 637 4 701 5 252 5 512 6 330
Construction € m 6 562 3 258 4 859 6 608 7 067
2008 2010 2012 2014 2016
Architects Architectes n/a 2 200* 2 200* 2 100* 2 000
% Male Homme n/a 50 45 47 46
% Female Femme n/a 50 55 53 54
% <40 years <40 ans n/a 45 41 46 45
Practices Bureaux n/a 763 930 962 856
2008 2010 2012 2014 2016
Market Marché (€ m) n/a 46 27 20 37
Average revenue per practice (€) : Revenu moyen par bureaux d’architecture (€) :
2 persons personnes n/a 52 452 17 783 30 893 39 276 6 - 10 persons personnes n/a 92 183 76 255 38 343 n/a
Trends 2008-16 Tendances 2008-16
Earnings Revenus
Response Réponse
2008 2010 2012 2014 2016
Participants Répondants n/a 141 283 83 147
Accuracy of results 95% confidence Précision des résultats: 95% confiance n/a +/-8 +/-5.5 +/- 10.6 +/- 7.9
0
1000
2000
3000
4000
5000
201620142012201020080
20
40
60
80
100
num
ber a
rchi
tect
s/pr
actic
es n
ombr
e d’
arch
itect
es/b
urea
ux
total market size taille totale du m
arché €m
architects (left axis) architectes (axe de gauche) practices (left axis) bureaux (axe de gauche) market (right axis) marché (axe de droite)
bulg
arie
* Earnings values are unadjusted for PPP * Revenu moyen NON ajusté par PPA
per cent pourcentage
2008 2010 2012 2014 2016
Sole Principals Dirigeant unique n/a 33 36 24 36
Partners & Directors Associé dirigeant n/a 9 10 12 7
Private practice Salaried Salarié – Secteur privé n/a 37 36 43 29
Private in-house L’industrie / commerce n/a 0 1 0 0
Freelance Indépendant n/a 15 8 6 16
Other Private Autres – Secteur privé n/a 3 1 4 3
Local / central government Collectivité locale / gouvernement n/a 1 5 12 5
Other Public Autre – secteur public n/a 1 5 0 4
Average earnings €* Revenu moyen en € *
2008 2010 2012 2014 2016
Sole Principals Dirigeant unique n/a 7 671 12 271 10 225 5 427
Partners & Directors Associé dirigeant n/a 20 455 14 000 3 476 n/a
Private practice Salaried Salarié – Secteur privé n/a 6 204 4 908 3 460 1 942
Private in-house L’industrie / commerce n/a 5 881 6 135 n/a n/a
Freelance Indépendant n/a n/a 4 602 7 669 6 130
Other Private Autres – Secteur privé n/a n/a 2 045 n/a n/a
Local / central government Collectivité locale / gouvernement n/a n/a 2 211 5 317 4 291
Other Public Autre – secteur public n/a 7 671 6 135 n/a n/a
* revised * révisé
secTIon 2 - 68The ArchITecTurAl ProfessIon In euroPe 2016 / lA ProfessIon d’ArchITecTe en euroPe 2016

Mirza & Nacey Reserach LtdSouthdown HouseFord Lane, FordArundelWest SussexBN18 0DEUnited Kingdom
Telephone: +44 1243 555302email: [email protected]
MIRZA & NACEY RESEARCH
Registered office: Southdown House, Ford Lane, Ford, Arundel, West Sussex BN18 0DE. Registered in England and Wales. Company No. 04618115
Social & Economic Social & Economiqueconstruction / GDP previous year construction / PIB année précédente
Architectural Profession Profession d’architecte
Architectural Market Marché de l’architecture
Field of Employment Domaine d’activité
cro
ati
a2008 2010 2012 2014 2016
Population 4 435 383 4 425 747 4 398 150 4 246 700 4 190 669
GDP PIB € m 47 365 45 779 44 892 43 128 43 847
GDP/PIB head/habitant € 10 679 10 344 10 207 10 156 10 463
Construction € m n/a n/a n/a n/a 6 207
2008 2010 2012 2014 2016
Architects Architectes n/a 2 200 2 250 2 200 2 200
% Male Homme n/a 44 45 47 41
% Female Femme n/a 56 55 53 59
% <40 years <40 ans n/a 31 31 44 40
Practices Bureaux n/a 605 835 778 695
2008 2010 2012 2014 2016
Market Marché (€ m) n/a 64 50 45 55
Average revenue per practice (€) : Revenu moyen par bureaux d’architecture (€) :
2 persons personnes n/a 66 379 74 660 51 000 110 403 6 - 10 persons personnes n/a 218 190 160 050 157 775 141 135
Trends 2008-16 Tendances 2008-16
Earnings Revenus
Response Réponse
2008 2010 2012 2014 2016
Participants Répondants n/a 404 423 93 318
Accuracy of results 95% confidence Précision des résultats: 95% confiance n/a +/-4 +/-4.3 +/- 9.9 +/- 5.1
0
500
1000
1500
2000
2500
3000
3500
4000
201620142012201020080
50
100
150
200
250
300
350
400
num
ber a
rchi
tect
s/pr
actic
es n
ombr
e d’
arch
itect
es/b
urea
ux
total market size taille totale du m
arché €m
architects (left axis) architectes (axe de gauche) practices (left axis) bureaux (axe de gauche) market (right axis) marché (axe de droite)
cro
atie
* Earnings values are unadjusted for PPP * Revenu moyen NON ajusté par PPA
per cent pourcentage
2008 2010 2012 2014 2016
Sole Principals Dirigeant unique n/a 24 25 25 15
Partners & Directors Associé dirigeant n/a 19 21 21 21
Private practice Salaried Salarié – Secteur privé n/a 39 36 42 39
Private in-house L’industrie / commerce n/a 2 0 0 2
Freelance Indépendant n/a 5 3 1 4
Other Private Autres – Secteur privé n/a 2 2 2 3
Local / central government Collectivité locale / gouvernement n/a 4 4 5 7
Other Public Autre – secteur public n/a 4 8 4 9
Average earnings €* Revenu moyen en € *
2008 2010 2012 2014 2016
Sole Principals Dirigeant unique n/a 13 746 12 087 15 777 10 392
Partners & Directors Associé dirigeant n/a 14 090 11 594 12 293 9 985
Private practice Salaried Salarié – Secteur privé n/a 16 152 14 675 11 044 12 498
Private in-house L’industrie / commerce n/a 15 464 10 940 n/a 19 304
Freelance Indépendant n/a 15 121 16 010 n/a n/a
Other Private Autres – Secteur privé n/a 15 945 14 142 n/a 15 044
Local / central government Collectivité locale / gouvernement n/a 15 670 19 212 14 507 13 047
Other Public Autre – secteur public n/a 14 433 13 341 n/a 17 680
secTIon 2 - 69The ArchITecTurAl ProfessIon In euroPe 2016 / lA ProfessIon d’ArchITecTe en euroPe 2016

Mirza & Nacey Reserach LtdSouthdown HouseFord Lane, FordArundelWest SussexBN18 0DEUnited Kingdom
Telephone: +44 1243 555302email: [email protected]
MIRZA & NACEY RESEARCH
Registered office: Southdown House, Ford Lane, Ford, Arundel, West Sussex BN18 0DE. Registered in England and Wales. Company No. 04618115
Social & Economic Social & Economiqueconstruction / GDP previous year construction / PIB année précédente
Architectural Profession Profession d’architecte
Architectural Market Marché de l’architecture
Field of Employment Domaine d’activitéc
ypru
s2008 2010 2012 2014 2016
Population 776 333 819 140 862 011 858 000 848 319
GDP PIB € m 19 006 19 300 19 467 17 567 17 637
GDP/PIB head/habitant € 24 482 23 561 22 583 20 474 20 791
Construction € m 5 280 3 930 2 786 1 832 2 056
2008 2010 2012 2014 2016
Architects Architectes 430 600 900 950 950
% Male Homme n/a n/a n/a n/a 54
% Female Femme n/a n/a n/a n/a 46
% <40 years <40 ans n/a n/a n/a n/a 58
Practices Bureaux n/a n/a n/a n/a 295
2008 2010 2012 2014 2016
Market Marché (€ m) n/a n/a n/a n/a 18
Average revenue per practice (€) : Revenu moyen par bureaux d’architecture (€) :
2 persons personnes n/a n/a n/a n/a n/a 6 - 10 persons personnes n/a n/a n/a n/a 150 000
Trends 2008-16 Tendances 2008-16
Earnings Revenus
Response Réponse
2008 2010 2012 2014 2016
Participants Répondants n/a n/a n/a n/a 59
Accuracy of results 95% confidence Précision des résultats: 95% confiance n/a n/a n/a n/a +/- 12.4
chyp
re
* Earnings values are unadjusted for PPP * Revenu moyen NON ajusté par PPA
per cent pourcentage
2008 2010 2012 2014 2016
Sole Principals Dirigeant unique n/a n/a n/a n/a 30
Partners & Directors Associé dirigeant n/a n/a n/a n/a 9
Private practice Salaried Salarié – Secteur privé n/a n/a n/a n/a 34
Private in-house L’industrie / commerce n/a n/a n/a n/a 2
Freelance Indépendant n/a n/a n/a n/a 9
Other Private Autres – Secteur privé n/a n/a n/a n/a 6
Local / central government Collectivité locale / gouvernement n/a n/a n/a n/a 4
Other Public Autre – secteur public n/a n/a n/a n/a 7
Average earnings €* Revenu moyen en € *
2008 2010 2012 2014 2016
Sole Principals Dirigeant unique n/a n/a n/a n/a 15 000
Partners & Directors Associé dirigeant n/a n/a n/a n/a n/a
Private practice Salaried Salarié – Secteur privé n/a n/a n/a n/a 1 900
Private in-house L’industrie / commerce n/a n/a n/a n/a n/a
Freelance Indépendant n/a n/a n/a n/a n/a
Other Private Autres – Secteur privé n/a n/a n/a n/a n/a
Local / central government Collectivité locale / gouvernement n/a n/a n/a n/a n/a
Other Public Autre – secteur public n/a n/a n/a n/a n/a
0
300
600
900
1200
1500
201620142012201020080
5
10
15
20
25
num
ber a
rchi
tect
s/pr
actic
es n
ombr
e d’
arch
itect
es/b
urea
ux
total market size taille totale du m
arché €m
architects (left axis) architectes (axe de gauche) practices (left axis) bureaux (axe de gauche) market (right axis) marché (axe de droite)
n/an/a
secTIon 2 - 70The ArchITecTurAl ProfessIon In euroPe 2016 / lA ProfessIon d’ArchITecTe en euroPe 2016

Mirza & Nacey Reserach LtdSouthdown HouseFord Lane, FordArundelWest SussexBN18 0DEUnited Kingdom
Telephone: +44 1243 555302email: [email protected]
MIRZA & NACEY RESEARCH
Registered office: Southdown House, Ford Lane, Ford, Arundel, West Sussex BN18 0DE. Registered in England and Wales. Company No. 04618115
Social & Economic Social & Economiqueconstruction / GDP previous year construction / PIB année précédente
Architectural Profession Profession d’architecte
Architectural Market Marché de l’architecture
Field of Employment Domaine d’activité
cze
ch r
epublic
2008 2010 2012 2014 2016
Population 10 381 130 10 506 813 10 504 203 10 512 419 10 553 843
GDP PIB € m 147 879 145 955 154 913 149 491 166 964
GDP/PIB head/habitant € 14 245 13 891 14 748 14 220 15 820
Construction € m 34 510 28 987 27 124 27 514 23 658
2008 2010 2012 2014 2016
Architects Architectes 3 000 3 300 8 000* 8 200 8 300
% Male Homme n/a 70 68 62 64
% Female Femme n/a 30 32 38 36
% <40 years <40 ans n/a 25 29 46 52
Practices Bureaux n/a 756 2 031 2 138 1 912
2008 2010 2012 2014 2016
Market Marché (€ m) n/a 73 153 139 92
Average revenue per practice (€) : Revenu moyen par bureaux d’architecture (€) :
2 persons personnes n/a 48 487 57 967 n/a n/a 6 - 10 persons personnes n/a 380 286 259 958 n/a n/a
Trends 2008-16 Tendances 2008-16
Earnings Revenus
Response Réponse
2008 2010 2012 2014 2016
Participants Répondants n/a 488 446 13 59
Accuracy of results 95% confidence Précision des résultats: 95% confiance n/a +/-4 +/-4.3 +/- 27.2 +/- 12.7
0
2000
4000
6000
8000
10000
12000
14000
16000
201620142012201020080
100
200
300
400
500
600
700
num
ber a
rchi
tect
s/pr
actic
es n
ombr
e d’
arch
itect
es/b
urea
ux
total market size taille totale du m
arché €m
architects (left axis) architectes (axe de gauche) practices (left axis) bureaux (axe de gauche) market (right axis) marché (axe de droite)
rép Tc
hèque
* 2012 data revised
* Earnings values are unadjusted for PPP * Revenu moyen NON ajusté par PPA
per cent pourcentage
2008 2010 2012 2014 2016
Sole Principals Dirigeant unique n/a 32 30 8 31
Partners & Directors Associé dirigeant n/a 9 8 17 5
Private practice Salaried Salarié – Secteur privé n/a 21 30 42 15
Private in-house L’industrie / commerce n/a 0 0 0 0
Freelance Indépendant n/a 31 27 17 37
Other Private Autres – Secteur privé n/a 1 1 8 5
Local / central government Collectivité locale / gouvernement n/a 4 3 0 2
Other Public Autre – secteur public n/a 3 1 8 5
Average earnings €* Revenu moyen en € *
2008 2010 2012 2014 2016
Sole Principals Dirigeant unique n/a 14 570 18 107 n/a 11 089
Partners & Directors Associé dirigeant n/a 19 427 26 154 n/a n/a
Private practice Salaried Salarié – Secteur privé n/a 15 271 14 485 4,915 12 531
Private in-house L’industrie / commerce n/a 14 165 13 294 n/a n/a
Freelance Indépendant n/a n/a 12 011 n/a 6 653
Other Private Autres – Secteur privé n/a 16 998 14 485 n/a n/a
Local / central government Collectivité locale / gouvernement n/a 14 570 14 888 n/a n/a
Other Public Autre – secteur public n/a 15 015 14 888 n/a n/a
secTIon 2 - 71The ArchITecTurAl ProfessIon In euroPe 2016 / lA ProfessIon d’ArchITecTe en euroPe 2016

Mirza & Nacey Reserach LtdSouthdown HouseFord Lane, FordArundelWest SussexBN18 0DEUnited Kingdom
Telephone: +44 1243 555302email: [email protected]
MIRZA & NACEY RESEARCH
Registered office: Southdown House, Ford Lane, Ford, Arundel, West Sussex BN18 0DE. Registered in England and Wales. Company No. 04618115
Social & Economic Social & Economiqueconstruction / GDP previous year construction / PIB année précédente
Architectural Profession Profession d’architecte
Architectural Market Marché de l’architecture
Field of Employment Domaine d’activité
denm
ark 2008 2010 2012 2014 2016
Population 5 475 791 5 534 738 5 580 516 5 627 235 5 707 251
GDP PIB € m 233 482 228 371 239 245 248 975 266 179
GDP/PIB head/habitant € 42 639 41 261 42 871 44 245 46 639
Construction € m 30 510 20 518 24 924 25 364 31 242
2008 2010 2012 2014 2016
Architects Architectes 7 000 7 000 9 800* 10 000 10 000
% Male Homme 51 56 56 50 54
% Female Femme 49 44 44 50 46
% <40 years <40 ans 40 33 27 26 28
Practices Bureaux 727 762 1 782 1 759 1 422
2008 2010 2012 2014 2016
Market Marché (€ m) 356 309 448 392 482
Average revenue per practice (€) : Revenu moyen par bureaux d’architecture (€) :
2 persons personnes 291 700 129 768 160 624 151 768 160 743 6 - 10 persons personnes 566 330 1 138 352 771 921 n/a 1 004 374
Trends 2008-16 Tendances 2008-16
Earnings Revenus
Response Réponse
2008 2010 2012 2014 2016
Participants Répondants 159 454 743 529 459
Accuracy of results 95% confidence Précision des résultats: 95% confiance +/-8 +/-4 +/-3.4 +/- 4.1 +/- 4.5
0
2000
4000
6000
8000
10000
12000
14000
16000
201620142012201020080
100
200
300
400
500
600
700
800
num
ber a
rchi
tect
s/pr
actic
es n
ombr
e d’
arch
itect
es/b
urea
ux
total market size taille totale du m
arché €m
architects (left axis) architectes (axe de gauche) practices (left axis) bureaux (axe de gauche) market (right axis) marché (axe de droite)
danem
ark
* 2012 data revised
* Earnings values are unadjusted for PPP * Revenu moyen NON ajusté par PPA
per cent pourcentage
2008 2010 2012 2014 2016
Sole Principals Dirigeant unique 11 12 12 8 11
Partners & Directors Associé dirigeant 7 16 13 9 10
Private practice Salaried Salarié – Secteur privé 32 26 29 34 33
Private in-house L’industrie / commerce 4 2 2 2 1
Freelance Indépendant 2 3 1 1 2
Other Private Autres – Secteur privé 10 7 8 5 14
Local / central government Collectivité locale / gouvernement 24 23 25 26 19
Other Public Autre – secteur public 10 12 10 15 10
Average earnings €* Revenu moyen en € *
2008 2010 2012 2014 2016
Sole Principals Dirigeant unique 67 150 60 449 62 513 53 590 51 051
Partners & Directors Associé dirigeant 53 720 67 165 69 907 80 385 84 502
Private practice Salaried Salarié – Secteur privé 53 720 48 359 60 496 53 858 50 782
Private in-house L’industrie / commerce n/a 19 478 30 961 n/a n/a
Freelance Indépendant 46 736 13 433 64 664 93 783 21 600
Other Private Autres – Secteur privé 53 720 54 538 53 774 62 762 50 651
Local / central government Collectivité locale / gouvernement 30 218 56 419 63 050 56 270 52 797
Other Public Autre – secteur public 53 720 54 721 60 496 64 308 55 753
secTIon 2 - 72The ArchITecTurAl ProfessIon In euroPe 2016 / lA ProfessIon d’ArchITecTe en euroPe 2016

Mirza & Nacey Reserach LtdSouthdown HouseFord Lane, FordArundelWest SussexBN18 0DEUnited Kingdom
Telephone: +44 1243 555302email: [email protected]
MIRZA & NACEY RESEARCH
Registered office: Southdown House, Ford Lane, Ford, Arundel, West Sussex BN18 0DE. Registered in England and Wales. Company No. 04618115
Social & Economic Social & Economiqueconstruction / GDP previous year construction / PIB année précédente
Architectural Profession Profession d’architecte
Architectural Market Marché de l’architecture
Field of Employment Domaine d’activité
est
onia 2008 2010 2012 2014 2016
Population 1 340 935 1 340 127 1 339 662 1 315 819 1 315 944
GDP PIB € m 16 107 13 846 15 951 18 613 20 252
GDP/PIB head/habitant € 12 012 10 332 11 907 14 146 15 389
Construction € m 3 322 1 843 2 572 3 208 2 768
2008 2010 2012 2014 2016
Architects Architectes 700 600 600 800 800
% Male Homme 84 67 69 85 73
% Female Femme 16 33 31 15 27
% <40 years <40 ans 36 29 12 30 32
Practices Bureaux 190 145 172 252 246
2008 2010 2012 2014 2016
Market Marché (€ m) 28 13 29 16 14
Average revenue per practice (€) : Revenu moyen par bureaux d’architecture (€) :
2 persons personnes n/a n/a 57,574 31 250 n/a 6 - 10 persons personnes 322 500 n/a 116 288 221 324 280 000
Trends 2008-16 Tendances 2008-16
Earnings Revenus
Response Réponse
2008 2010 2012 2014 2016
Participants Répondants 25 33 51 20 55
Accuracy of results 95% confidence Précision des résultats: 95% confiance +/-19 +/-17 +/-13.1 +/- 21.7 +/- 12.8
0
300
600
900
1200
1500
201620142012201020080
30
60
90
120
150
num
ber a
rchi
tect
s/pr
actic
es n
ombr
e d’
arch
itect
es/b
urea
ux
total market size taille totale du m
arché €m
architects (left axis) architectes (axe de gauche) practices (left axis) bureaux (axe de gauche) market (right axis) marché (axe de droite)
esto
nie
* Earnings values are unadjusted for PPP * Revenu moyen NON ajusté par PPA
per cent pourcentage
2008 2010 2012 2014 2016
Sole Principals Dirigeant unique 16 28 26 35 15
Partners & Directors Associé dirigeant 56 9 21 29 36
Private practice Salaried Salarié – Secteur privé 20 41 47 35 27
Private in-house L’industrie / commerce 0 0 0 0 0
Freelance Indépendant 4 6 5 0 4
Other Private Autres – Secteur privé 4 3 0 0 0
Local / central government Collectivité locale / gouvernement 0 9 2 0 4
Other Public Autre – secteur public 0 3 0 0 15
Average earnings €* Revenu moyen en € *
2008 2010 2012 2014 2016
Sole Principals Dirigeant unique 41 280 n/a 7 200 35 500 n/a
Partners & Directors Associé dirigeant 25 800 n/a 20 000 13 000 22 000
Private practice Salaried Salarié – Secteur privé n/a 11 504 13 500 17 750 15 000
Private in-house L’industrie / commerce n/a n/a 10 000 n/a n/a
Freelance Indépendant n/a 15 786 n/a n/a n/a
Other Private Autres – Secteur privé n/a n/a n/a n/a n/a
Local / central government Collectivité locale / gouvernement n/a n/a n/a n/a n/a
Other Public Autre – secteur public 25 800 11 504 10 080 n/a n/a
secTIon 2 - 73The ArchITecTurAl ProfessIon In euroPe 2016 / lA ProfessIon d’ArchITecTe en euroPe 2016

Mirza & Nacey Reserach LtdSouthdown HouseFord Lane, FordArundelWest SussexBN18 0DEUnited Kingdom
Telephone: +44 1243 555302email: [email protected]
MIRZA & NACEY RESEARCH
Registered office: Southdown House, Ford Lane, Ford, Arundel, West Sussex BN18 0DE. Registered in England and Wales. Company No. 04618115
Social & Economic Social & Economiqueconstruction / GDP previous year construction / PIB année précédente
Architectural Profession Profession d’architecte
Architectural Market Marché de l’architecture
Field of Employment Domaine d’activité
fin
land
2008 2010 2012 2014 2016
Population 5 300 484 5 351 427 5 401 267 5 451 270 5 487 308
GDP PIB € m 184 649 176 132 189 368 193 443 209 149
GDP/PIB head/habitant € 34 836 32 913 35 060 35 486 38 115
Construction € m 32 229 32 298 33 922 30 292 30 558
2008 2010 2012 2014 2016
Architects Architectes 3 600 3 050 3 250 3 300 3 500
% Male Homme 50 56 54 53 47
% Female Femme 50 44 46 47 53
% <40 years <40 ans 32 26 27 20 25
Practices Bureaux 355 363 661 717 528
2008 2010 2012 2014 2016
Market Marché (€ m) 43 117 162 134 178
Average revenue per practice (€) : Revenu moyen par bureaux d’architecture (€) :
2 persons personnes 70 000 164 423 131 209 155 000 173 545 6 - 10 persons personnes 350 000 501 783 629 257 1 082 500 701 972
Trends 2008-16 Tendances 2008-16
Earnings Revenus
Response Réponse
2008 2010 2012 2014 2016
Participants Répondants 203 560 384 411 418
Accuracy of results 95% confidence Précision des résultats: 95% confiance +/-7 +/-4 +/-4.7 +/- 4.5 +/- 4.5
0
2000
4000
6000
8000
10000
201620142012201020080
100
200
300
400
500
num
ber a
rchi
tect
s/pr
actic
es n
ombr
e d’
arch
itect
es/b
urea
ux
total market size taille totale du m
arché €m
architects (left axis) architectes (axe de gauche) practices (left axis) bureaux (axe de gauche) market (right axis) marché (axe de droite)
fin
lande
* Earnings values are unadjusted for PPP * Revenu moyen NON ajusté par PPA
per cent pourcentage
2008 2010 2012 2014 2016
Sole Principals Dirigeant unique 12 15 13 15 12
Partners & Directors Associé dirigeant 12 14 11 5 9
Private practice Salaried Salarié – Secteur privé 31 29 40 39 38
Private in-house L’industrie / commerce 1 1 1 1 0
Freelance Indépendant 2 2 0 1 1
Other Private Autres – Secteur privé 8 3 3 5 4
Local / central government Collectivité locale / gouvernement 25 26 21 26 25
Other Public Autre – secteur public 8 11 11 9 11
Average earnings €* Revenu moyen en € *
2008 2010 2012 2014 2016
Sole Principals Dirigeant unique 35 000 45 000 50 000 49 500 54 500
Partners & Directors Associé dirigeant 49 250 52 000 70 000 80 000 74 000
Private practice Salaried Salarié – Secteur privé 36 000 42 500 42 500 45 500 45 750
Private in-house L’industrie / commerce n/a 25 000 n/a n/a n/a
Freelance Indépendant 36 500 44 000 36 600 n/a n/a
Other Private Autres – Secteur privé 45 000 47 000 49 000 50 250 55 900
Local / central government Collectivité locale / gouvernement 42 500 46 250 52 000 50 750 50 000
Other Public Autre – secteur public 39 600 45 000 48 000 53 000 54 000
secTIon 2 - 74The ArchITecTurAl ProfessIon In euroPe 2016 / lA ProfessIon d’ArchITecTe en euroPe 2016

Mirza & Nacey Reserach LtdSouthdown HouseFord Lane, FordArundelWest SussexBN18 0DEUnited Kingdom
Telephone: +44 1243 555302email: [email protected]
MIRZA & NACEY RESEARCH
Registered office: Southdown House, Ford Lane, Ford, Arundel, West Sussex BN18 0DE. Registered in England and Wales. Company No. 04618115
Social & Economic Social & Economiqueconstruction / GDP previous year construction / PIB année précédente
Architectural Profession Profession d’architecte
Architectural Market Marché de l’architecture
Field of Employment Domaine d’activité
fra
nce
2008 2010 2012 2014 2016
Population 63 753 140 64 713 762 65 397 912 65 856 609 66 661 621
GDP PIB € m 1 948 511 1 946 564 1 996 583 2 059 852 2 181 064
GDP/PIB head/habitant € 30 563 30 080 30 530 31 278 32 718
Construction € m 262 849 245 485 241 930 271 139 282 377
2008 2010 2012 2014 2016
Architects Architectes 29 400 29 700 29 900 29 800 30 000
% Male Homme 44 73 67 62 64
% Female Femme 56 27 33 38 36
% <40 years <40 ans 47 29 30 24 34
Practices Bureaux 8 157 7 891 7 968 8 302 7 753
2008 2010 2012 2014 2016
Market Marché (€ m) 1 104 1 302 1 254 908 984
Average revenue per practice (€) : Revenu moyen par bureaux d’architecture (€) :
2 persons personnes 138 158 196 787 169 294 177 150 120 936 6 - 10 persons personnes 698 573 774 945 883 467 812 891 837 225
Trends 2008-16 Tendances 2008-16
Earnings Revenus
Response Réponse
2008 2010 2012 2014 2016
Participants Répondants 142 1 202 957 690 1 018
Accuracy of results 95% confidence Précision des résultats: 95% confiance +/-8 +/-2 +/- 3.1 +/- 3.7 +/- 3.0
0
10000
20000
30000
40000
50000
201620142012201020080
500
1000
1500
2000
2500
num
ber a
rchi
tect
s/pr
actic
es n
ombr
e d’
arch
itect
es/b
urea
ux
total market size taille totale du m
arché €m
architects (left axis) architectes (axe de gauche) practices (left axis) bureaux (axe de gauche) market (right axis) marché (axe de droite)
fra
nce
* Earnings values are unadjusted for PPP * Revenu moyen NON ajusté par PPA
per cent pourcentage
2008 2010 2012 2014 2016
Sole Principals Dirigeant unique 23 28 26 29 26
Partners & Directors Associé dirigeant 5 5 5 6 6
Private practice Salaried Salarié – Secteur privé 18 16 17 20 17
Private in-house L’industrie / commerce 1 0 0 1 0
Freelance Indépendant 25 21 20 19 27
Other Private Autres – Secteur privé 24 23 26 20 18
Local / central government Collectivité locale / gouvernement 2 2 3 2 3
Other Public Autre – secteur public 4 4 4 3 2
Average earnings €* Revenu moyen en € *
2008 2010 2012 2014 2016
Sole Principals Dirigeant unique 29 000 30 000 30 000 30 000 25 000
Partners & Directors Associé dirigeant 42 000 33 000 42 000 45 000 39 022
Private practice Salaried Salarié – Secteur privé 46 800 39 000 38 000 30 000 41 432
Private in-house L’industrie / commerce 35 000 28 000 25 000 n/a n/a
Freelance Indépendant 37 200 32 250 32 500 22 474 24 000
Other Private Autres – Secteur privé n/a 41 400 37 200 30 500 26 000
Local / central government Collectivité locale / gouvernement n/a 36 600 47 714 40 500 41 500
Other Public Autre – secteur public 36 000 33 000 30 250 42 030 34 650
secTIon 2 - 75The ArchITecTurAl ProfessIon In euroPe 2016 / lA ProfessIon d’ArchITecTe en euroPe 2016

Mirza & Nacey Reserach LtdSouthdown HouseFord Lane, FordArundelWest SussexBN18 0DEUnited Kingdom
Telephone: +44 1243 555302email: [email protected]
MIRZA & NACEY RESEARCH
Registered office: Southdown House, Ford Lane, Ford, Arundel, West Sussex BN18 0DE. Registered in England and Wales. Company No. 04618115
Social & Economic Social & Economiqueconstruction / GDP previous year construction / PIB année précédente
Architectural Profession Profession d’architecte
Architectural Market Marché de l’architecture
Field of Employment Domaine d’activité
germ
any
2008 2010 2012 2014 2016
Population 82 221 808 81 802 257 81 843 743 80 780 000 82 162 000
GDP PIB € m 2 481 200 2 432 382 2 592 600 2 737 600 3 032 820
GDP/PIB head/habitant € 30 177 29 735 31 677 33 890 36 913
Construction € m 217 350 225 973 247 633 250 337 279 619
2008 2010 2012 2014 2016
Architects Architectes 95 000 100 500 101 600 107 200 109 200
% Male Homme 71 79 64 57 66*
% Female Femme 29 21 36 43 34*
% <40 years <40 ans 31 14 35 41 23*
Practices Bureaux 32 311 35 021 37 026 41 117 40 558
2008 2010 2012 2014 2016
Market Marché (€ m) 3 988 4 095 4 193 5 047 5 015
Average revenue per practice (€) : Revenu moyen par bureaux d’architecture (€) :
2 persons personnes 88 458 86 449 94 088 114 326 154 763 6 - 10 persons personnes 406 027 633 444 440 416 623 935 654 293
Trends 2008-16 Tendances 2008-16
Earnings Revenus
Response Réponse
2008 2010 2012 2014 2016
Participants Répondants 3 460 393 840 1 392 6 029
Accuracy of results 95% confidence Précision des résultats: 95% confiance +/-2 +/-5 +/- 3.4 +/- 2.6 +/- 1.2
0
20000
40000
60000
80000
100000
120000
140000
160000
180000
200000
201620142012201020080
1000
2000
3000
4000
5000
6000
7000
8000
9000
10000
num
ber a
rchi
tect
s/pr
actic
es n
ombr
e d’
arch
itect
es/b
urea
ux
total market size taille totale du m
arché €m
architects (left axis) architectes (axe de gauche) practices (left axis) bureaux (axe de gauche) market (right axis) marché (axe de droite)
Alle
magne
* Earnings values are unadjusted for PPP * Revenu moyen NON ajusté par PPA
per cent pourcentage
2008 2010 2012 2014 2016
Sole Principals Dirigeant unique 40 62 32 20 27*
Partners & Directors Associé dirigeant 14 10 14 8 10*
Private practice Salaried Salarié – Secteur privé 20 14 26 40 33*
Private in-house L’industrie / commerce 5 3 7 8 12*
Freelance Indépendant 3 3 4 1 4*
Other Private Autres – Secteur privé 7 2 6 6 n/a
Local / central government Collectivité locale / gouvernement 7 2 8 12
14*Other Public Autre – secteur public 4 2 4 4
Average earnings €* Revenu moyen en € *
2008 2010 2012 2014 2016
Sole Principals Dirigeant unique 40 000 43 500 50 000 55 000 55 940
Partners & Directors Associé dirigeant 46 300 50 000 60 000 70 660 65 100
Private practice Salaried Salarié – Secteur privé 36 000 34 290 37 200 36 000 n/a
Private in-house L’industrie / commerce 35 000 25 000 40 000 n/a n/a
Freelance Indépendant 48 000 50 000 54 500 67 000 39 012
Other Private Autres – Secteur privé 45 000 42 976 50 000 58 500 n/a
Local / central government Collectivité locale / gouvernement 50 500 48 100 50 000 53 000 n/a
Other Public Autre – secteur public 40 000 42 488 48 000 55 000 n/a
* 2016 - source: BAK survey * 2016 - source: enquête BAK
* 2016 - source: BAK survey * 2016 - source: enquête BAK
secTIon 2 - 76The ArchITecTurAl ProfessIon In euroPe 2016 / lA ProfessIon d’ArchITecTe en euroPe 2016

Mirza & Nacey Reserach LtdSouthdown HouseFord Lane, FordArundelWest SussexBN18 0DEUnited Kingdom
Telephone: +44 1243 555302email: [email protected]
MIRZA & NACEY RESEARCH
Registered office: Southdown House, Ford Lane, Ford, Arundel, West Sussex BN18 0DE. Registered in England and Wales. Company No. 04618115
Social & Economic Social & Economiqueconstruction / GDP previous year construction / PIB année précédente
Architectural Profession Profession d’architecte
Architectural Market Marché de l’architecture
Field of Employment Domaine d’activité
gre
ece
2008 2010 2012 2014 2016
Population 11 214 992 11 295 002 11 290 785 10 992 589 10 793 526
GDP PIB € m 235 679 232 767 215 088 182 054 175 697
GDP/PIB head/habitant € 21 015 20 608 19 050 16 562 16 278
Construction € m 26 689 19 573 12 110 10 927 12 926
2008 2010 2012 2014 2016
Architects Architectes 15 000 15 800 16 400 17 600 18 200
% Male Homme 48 43 41 42 n/a
% Female Femme 52 57 59 58 n/a
% <40 years <40 ans 53 52 56 50 n/a
Practices Bureaux 3 821 3 818 5 219 5 661 n/a
2008 2010 2012 2014 2016
Market Marché (€ m) 294 289 171 103 n/a
Average revenue per practice (€) : Revenu moyen par bureaux d’architecture (€) :
2 persons personnes 33 612 50 720 33 861 18 929 n/a6 - 10 persons personnes 284 625 190 067 71 500 55 643 n/a
Trends 2008-16 Tendances 2008-16
Earnings Revenus
Response Réponse
2008 2010 2012 2014 2016
Participants Répondants 394 314 490 344 n/a
Accuracy of results 95% confidence Précision des résultats: 95% confiance +/-5 +/-6 +/- 4.4 +/- 5.2 n/a
0
5000
10000
15000
20000
25000
201620142012201020080
100
200
300
400
500
num
ber a
rchi
tect
s/pr
actic
es n
ombr
e d’
arch
itect
es/b
urea
ux
total market size taille totale du m
arché €m
architects (left axis) architectes (axe de gauche) practices (left axis) bureaux (axe de gauche) market (right axis) marché (axe de droite)
grè
ce
* Earnings values are unadjusted for PPP * Revenu moyen NON ajusté par PPA
per cent pourcentage
2008 2010 2012 2014 2016
Sole Principals Dirigeant unique 14 49 56 51 n/a
Partners & Directors Associé dirigeant 15 5 6 6 n/a
Private practice Salaried Salarié – Secteur privé 19 17 14 16 n/a
Private in-house L’industrie / commerce 1 0 0 1 n/a
Freelance Indépendant 23 9 6 9 n/a
Other Private Autres – Secteur privé 7 3 3 2 n/a
Local / central government Collectivité locale / gouvernement 8 10 7 8 n/a
Other Public Autre – secteur public 14 7 8 8 n/a
Average earnings €* Revenu moyen en € *
2008 2010 2012 2014 2016
Sole Principals Dirigeant unique 30 000 30 000 20 000 12 000 n/a
Partners & Directors Associé dirigeant 30 000 42 500 22 500 30 000 n/a
Private practice Salaried Salarié – Secteur privé 18 000 14 700 13 200 13 200 n/a
Private in-house L’industrie / commerce 20 000 13 100 10 000 n/a n/a
Freelance Indépendant 22 500 n/a 13 200 10 000 n/a
Other Private Autres – Secteur privé 21 500 20 000 19 000 13 500 n/a
Local / central government Collectivité locale / gouvernement 30 083 20 000 20 000 21 600 n/a
Other Public Autre – secteur public 24 000 20 000 18 000 19 320 n/a
secTIon 2 - 77The ArchITecTurAl ProfessIon In euroPe 2016 / lA ProfessIon d’ArchITecTe en euroPe 2016
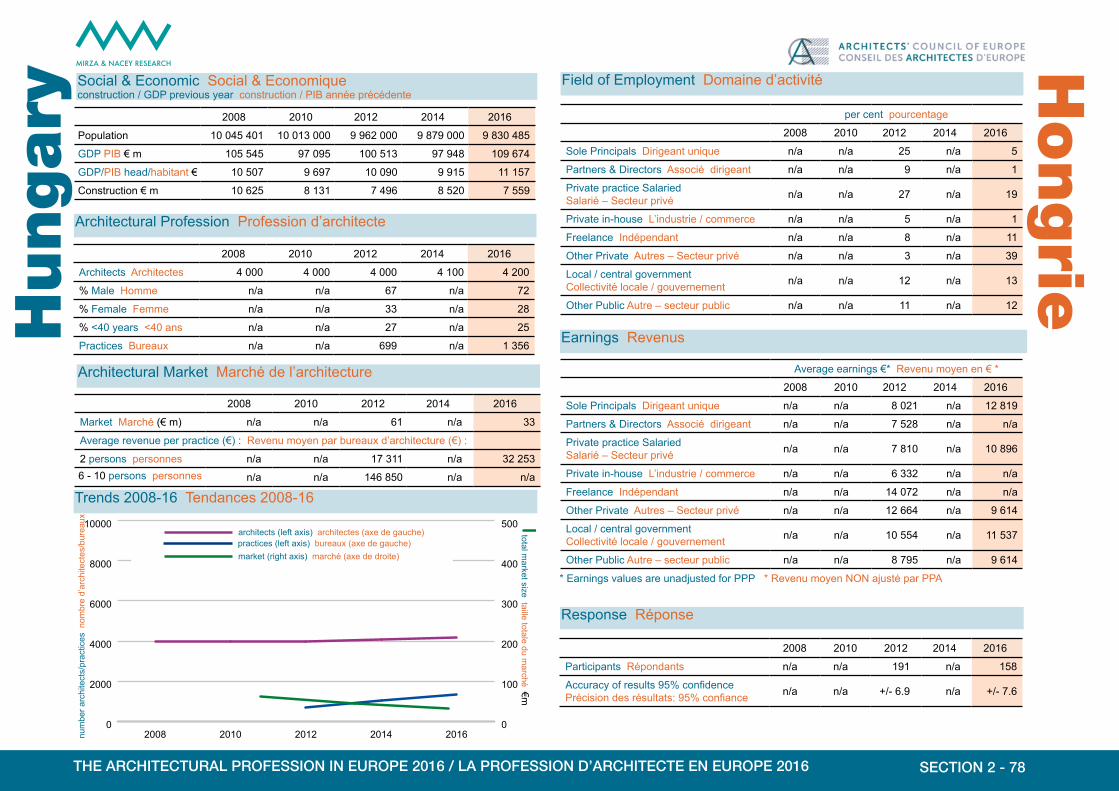
Mirza & Nacey Reserach LtdSouthdown HouseFord Lane, FordArundelWest SussexBN18 0DEUnited Kingdom
Telephone: +44 1243 555302email: [email protected]
MIRZA & NACEY RESEARCH
Registered office: Southdown House, Ford Lane, Ford, Arundel, West Sussex BN18 0DE. Registered in England and Wales. Company No. 04618115
Social & Economic Social & Economiqueconstruction / GDP previous year construction / PIB année précédente
Architectural Profession Profession d’architecte
Architectural Market Marché de l’architecture
Field of Employment Domaine d’activité
hungary 2008 2010 2012 2014 2016
Population 10 045 401 10 013 000 9 962 000 9 879 000 9 830 485
GDP PIB € m 105 545 97 095 100 513 97 948 109 674
GDP/PIB head/habitant € 10 507 9 697 10 090 9 915 11 157
Construction € m 10 625 8 131 7 496 8 520 7 559
2008 2010 2012 2014 2016
Architects Architectes 4 000 4 000 4 000 4 100 4 200
% Male Homme n/a n/a 67 n/a 72
% Female Femme n/a n/a 33 n/a 28
% <40 years <40 ans n/a n/a 27 n/a 25
Practices Bureaux n/a n/a 699 n/a 1 356
2008 2010 2012 2014 2016
Market Marché (€ m) n/a n/a 61 n/a 33
Average revenue per practice (€) : Revenu moyen par bureaux d’architecture (€) :
2 persons personnes n/a n/a 17 311 n/a 32 253 6 - 10 persons personnes n/a n/a 146 850 n/a n/a
Trends 2008-16 Tendances 2008-16
Earnings Revenus
Response Réponse
2008 2010 2012 2014 2016
Participants Répondants n/a n/a 191 n/a 158
Accuracy of results 95% confidence Précision des résultats: 95% confiance n/a n/a +/- 6.9 n/a +/- 7.6
0
2000
4000
6000
8000
10000
20162014201220102008num
ber a
rchi
tect
s/pr
actic
es n
ombr
e d’
arch
itect
es/b
urea
ux
total market size taille totale du m
arché €m
architects (left axis) architectes (axe de gauche) practices (left axis) bureaux (axe de gauche) market (right axis) marché (axe de droite)
0
100
200
300
400
500
hongrie
* Earnings values are unadjusted for PPP * Revenu moyen NON ajusté par PPA
per cent pourcentage
2008 2010 2012 2014 2016
Sole Principals Dirigeant unique n/a n/a 25 n/a 5
Partners & Directors Associé dirigeant n/a n/a 9 n/a 1
Private practice Salaried Salarié – Secteur privé n/a n/a 27 n/a 19
Private in-house L’industrie / commerce n/a n/a 5 n/a 1
Freelance Indépendant n/a n/a 8 n/a 11
Other Private Autres – Secteur privé n/a n/a 3 n/a 39
Local / central government Collectivité locale / gouvernement n/a n/a 12 n/a 13
Other Public Autre – secteur public n/a n/a 11 n/a 12
Average earnings €* Revenu moyen en € *
2008 2010 2012 2014 2016
Sole Principals Dirigeant unique n/a n/a 8 021 n/a 12 819
Partners & Directors Associé dirigeant n/a n/a 7 528 n/a n/a
Private practice Salaried Salarié – Secteur privé n/a n/a 7 810 n/a 10 896
Private in-house L’industrie / commerce n/a n/a 6 332 n/a n/a
Freelance Indépendant n/a n/a 14 072 n/a n/a
Other Private Autres – Secteur privé n/a n/a 12 664 n/a 9 614
Local / central government Collectivité locale / gouvernement n/a n/a 10 554 n/a 11 537
Other Public Autre – secteur public n/a n/a 8 795 n/a 9 614
secTIon 2 - 78The ArchITecTurAl ProfessIon In euroPe 2016 / lA ProfessIon d’ArchITecTe en euroPe 2016

Mirza & Nacey Reserach LtdSouthdown HouseFord Lane, FordArundelWest SussexBN18 0DEUnited Kingdom
Telephone: +44 1243 555302email: [email protected]
MIRZA & NACEY RESEARCH
Registered office: Southdown House, Ford Lane, Ford, Arundel, West Sussex BN18 0DE. Registered in England and Wales. Company No. 04618115
Social & Economic Social & Economiqueconstruction / GDP previous year construction / PIB année précédente
Architectural Profession Profession d’architecte
Architectural Market Marché de l’architecture
Field of Employment Domaine d’activité
Irela
nd
2008 2010 2012 2014 2016
Population 4 419 859 4 455 780 4 495 351 4 604 029 4 658 530
GDP PIB € m 179 989 155 491 156 438 164 050 255 815
GDP/PIB head/habitant € 40 723 34 896 34 800 35 632 54 913
Construction € m 30 889 14 250 11 662 10 301 24 200
2008 2010 2012 2014 2016
Architects Architectes 3 500 2 600 2 600 2 600 2 500
% Male Homme 77 70 69 71 68
% Female Femme 23 30 31 29 32
% <40 years <40 ans 56 42 36 19 26
Practices Bureaux 694 824 1 027 752 754
2008 2010 2012 2014 2016
Market Marché (€ m) 409 172 112 91 111
Average revenue per practice (€) : Revenu moyen par bureaux d’architecture (€) :
2 persons personnes 146 294 116 390 101 324 85 367 121 967 6 - 10 persons personnes 498 453 718 106 501 000 554 417 503 143
Trends 2008-16 Tendances 2008-16
Earnings Revenus
Response Réponse
2008 2010 2012 2014 2016
Participants Répondants 147 547 361 267 322
Accuracy of results 95% confidence Précision des résultats: 95% confiance +/-8 +/-4 +/- 4.8 +/- 5.7 +/- 5.1
0
1000
2000
3000
4000
5000
6000
7000
201620142012201020080
100
200
300
400
500
600
700
num
ber a
rchi
tect
s/pr
actic
es n
ombr
e d’
arch
itect
es/b
urea
ux
total market size taille totale du m
arché €m
architects (left axis) architectes (axe de gauche) practices (left axis) bureaux (axe de gauche) market (right axis) marché (axe de droite)
Irlande
* Earnings values are unadjusted for PPP * Revenu moyen NON ajusté par PPA
per cent pourcentage
2008 2010 2012 2014 2016
Sole Principals Dirigeant unique 16 26 26 26 26
Partners & Directors Associé dirigeant 23 28 26 27 22
Private practice Salaried Salarié – Secteur privé 40 26 26 25 32
Private in-house L’industrie / commerce 1 1 0 0 0
Freelance Indépendant 2 3 2 2 3
Other Private Autres – Secteur privé 4 2 4 0 2
Local / central government Collectivité locale / gouvernement 8 9 9 13 9
Other Public Autre – secteur public 4 6 6 3 4
Average earnings €* Revenu moyen en € *
2008 2010 2012 2014 2016
Sole Principals Dirigeant unique 75 000 40 000 25 000 35 000 40 000
Partners & Directors Associé dirigeant 80 000 55 000 45 000 45 000 58 000
Private practice Salaried Salarié – Secteur privé 60 000 45 000 42 000 43 000 44 343
Private in-house L’industrie / commerce n/a 23 500 31 000 n/a n/a
Freelance Indépendant 72 500 66 500 55 194 22 500 n/a
Other Private Autres – Secteur privé 70 000 72 000 76 000 n/a 52 000
Local / central government Collectivité locale / gouvernement 60 000 74 000 71 000 67 550 69 000
Other Public Autre – secteur public 65 000 50 250 43 000 70 000 56 500
secTIon 2 - 79The ArchITecTurAl ProfessIon In euroPe 2016 / lA ProfessIon d’ArchITecTe en euroPe 2016

Mirza & Nacey Reserach LtdSouthdown HouseFord Lane, FordArundelWest SussexBN18 0DEUnited Kingdom
Telephone: +44 1243 555302email: [email protected]
MIRZA & NACEY RESEARCH
Registered office: Southdown House, Ford Lane, Ford, Arundel, West Sussex BN18 0DE. Registered in England and Wales. Company No. 04618115
Social & Economic Social & Economiqueconstruction / GDP previous year construction / PIB année précédente
Architectural Profession Profession d’architecte
Architectural Market Marché de l’architecture
Field of Employment Domaine d’activité
Italy 2008 2010 2012 2014 2016
Population 59 618 114 60 340 328 60 850 782 60 782 668 60 665 551
GDP PIB € m 1 567 851 1 553 350 1 580 220 1 560 024 1 642 444
GDP/PIB head/habitant € 26 298 25 743 25 969 25 666 27 074
Construction € m 204 401 185 616 180 233 184 111 202 126
2008 2010 2012 2014 2016
Architects Architectes n/a 145 000 147 000 153 000 157 000
% Male Homme n/a 70 63 62 59
% Female Femme n/a 30 37 38 41
% <40 years <40 ans n/a 58 34 23 28
Practices Bureaux n/a 53 081 58 397 56 284 55 720
2008 2010 2012 2014 2016
Market Marché (€ m) n/a 2 709 2 775 1 917 1 758
Average revenue per practice (€) : Revenu moyen par bureaux d’architecture (€) :
2 persons personnes n/a 52 108 60 380 50 006 49 171 6 - 10 persons personnes n/a 470 573 253 669 208 189 164 400
Trends 2008-16 Tendances 2008-16
Earnings Revenus
Response Réponse
2008 2010 2012 2014 2016
Participants Répondants n/a 124 14 004 8 167 12 568
Accuracy of results 95% confidence Précision des résultats: 95% confiance n/a +/-9 +/- 0.8 +/- 1.1 +/- 0.8
0
40000
80000
120000
160000
200000
240000
201620142012201020080
1000
2000
3000
4000
5000
6000
num
ber a
rchi
tect
s/pr
actic
es n
ombr
e d’
arch
itect
es/b
urea
ux
total market size taille totale du m
arché €m
architects (left axis) architectes (axe de gauche) practices (left axis) bureaux (axe de gauche) market (right axis) marché (axe de droite)
Italie
* Earnings values are unadjusted for PPP * Revenu moyen NON ajusté par PPA
per cent pourcentage
2008 2010 2012 2014 2016
Sole Principals Dirigeant unique n/a 39 46 47 39
Partners & Directors Associé dirigeant n/a 10 6 6 4
Private practice Salaried Salarié – Secteur privé n/a 20 17 15 13
Private in-house L’industrie / commerce n/a 1 2 2 2
Freelance Indépendant n/a 16 13 13 20
Other Private Autres – Secteur privé n/a 9 9 8 10
Local / central government Collectivité locale / gouvernement n/a 3 4 5 5
Other Public Autre – secteur public n/a 2 4 4 6
Average earnings €* Revenu moyen en € *
2008 2010 2012 2014 2016
Sole Principals Dirigeant unique n/a 20 000 27 000 30 000 27 500
Partners & Directors Associé dirigeant n/a 27 900 34 500 36 000 35 000
Private practice Salaried Salarié – Secteur privé n/a 15 750 24 000 27 778 24 000
Private in-house L’industrie / commerce n/a 15 000 20 000 n/a 25 000
Freelance Indépendant n/a 22 000 25 000 20 000 18 000
Other Private Autres – Secteur privé n/a 30 000 30 000 26 000 22 000
Local / central government Collectivité locale / gouvernement n/a n/a 28 000 30 000 30 000
Other Public Autre – secteur public n/a 20 000 25 000 26 000 27 000
secTIon 2 - 80The ArchITecTurAl ProfessIon In euroPe 2016 / lA ProfessIon d’ArchITecTe en euroPe 2016

Mirza & Nacey Reserach LtdSouthdown HouseFord Lane, FordArundelWest SussexBN18 0DEUnited Kingdom
Telephone: +44 1243 555302email: [email protected]
MIRZA & NACEY RESEARCH
Registered office: Southdown House, Ford Lane, Ford, Arundel, West Sussex BN18 0DE. Registered in England and Wales. Company No. 04618115
Social & Economic Social & Economiqueconstruction / GDP previous year construction / PIB année précédente
Architectural Profession Profession d’architecte
Architectural Market Marché de l’architecture
Field of Employment Domaine d’activité
latv
ia 2008 2010 2012 2014 2016
Population 2 270 894 2 248 374 2 042 371 2 001 468 1 968 957
GDP PIB € m 23 037 16 693 21 338 23 372 24 349
GDP/PIB head/habitant € 10 145 7 425 10 447 11 677 12 366
Construction € m 7 241 3 737 3 705 5 481 3 491
2008 2010 2012 2014 2016
Architects Architectes 700 900 900 900 900
% Male Homme n/a n/a n/a 42 n/a
% Female Femme n/a n/a n/a 58 n/a
% <40 years <40 ans n/a n/a n/a 29 n/a
Practices Bureaux n/a n/a n/a 245 n/a
2008 2010 2012 2014 2016
Market Marché (€ m) n/a n/a n/a 23 n/a
Average revenue per practice (€) : Revenu moyen par bureaux d’architecture (€) :
2 persons personnes n/a n/a n/a n/a n/a6 - 10 persons personnes n/a n/a n/a 678 886 n/a
Trends 2008-16 Tendances 2008-16
Earnings Revenus
Response Réponse
2008 2010 2012 2014 2016
Participants Répondants n/a 5 n/a 36 n/a
Accuracy of results 95% confidence Précision des résultats: 95% confiance n/a +/-44 n/a +/- 16.0 n/a
0
500
1000
1500
2000
2500
20162014201220102008num
ber a
rchi
tect
s/pr
actic
es n
ombr
e d’
arch
itect
es/b
urea
ux
total market size taille totale du m
arché €m
architects (left axis) architectes (axe de gauche) practices (left axis) bureaux (axe de gauche) market (right axis) marché (axe de droite)
0
200
400
600
800
1000
n/an/a
letto
nie
* Earnings values are unadjusted for PPP * Revenu moyen NON ajusté par PPA
per cent pourcentage
2008 2010 2012 2014 2016
Sole Principals Dirigeant unique n/a n/a n/a 15 n/a
Partners & Directors Associé dirigeant n/a n/a n/a 31 n/a
Private practice Salaried Salarié – Secteur privé n/a n/a n/a 31 n/a
Private in-house L’industrie / commerce n/a n/a n/a 0 n/a
Freelance Indépendant n/a n/a n/a 0 n/a
Other Private Autres – Secteur privé n/a n/a n/a 12 n/a
Local / central government Collectivité locale / gouvernement n/a n/a n/a 12 n/a
Other Public Autre – secteur public n/a n/a n/a 0 n/a
Average earnings €* Revenu moyen en € *
2008 2010 2012 2014 2016
Sole Principals Dirigeant unique n/a n/a n/a 19 200 n/a
Partners & Directors Associé dirigeant n/a n/a n/a 4 275 n/a
Private practice Salaried Salarié – Secteur privé n/a n/a n/a 3 350 n/a
Private in-house L’industrie / commerce n/a n/a n/a n/a n/a
Freelance Indépendant n/a n/a n/a n/a n/a
Other Private Autres – Secteur privé n/a n/a n/a 6 000 n/a
Local / central government Collectivité locale / gouvernement n/a n/a n/a 1 060 n/a
Other Public Autre – secteur public n/a n/a n/a n/a n/a
secTIon 2 - 81The ArchITecTurAl ProfessIon In euroPe 2016 / lA ProfessIon d’ArchITecTe en euroPe 2016

Mirza & Nacey Reserach LtdSouthdown HouseFord Lane, FordArundelWest SussexBN18 0DEUnited Kingdom
Telephone: +44 1243 555302email: [email protected]
MIRZA & NACEY RESEARCH
Registered office: Southdown House, Ford Lane, Ford, Arundel, West Sussex BN18 0DE. Registered in England and Wales. Company No. 04618115
Social & Economic Social & Economiqueconstruction / GDP previous year construction / PIB année précédente
Architectural Profession Profession d’architecte
Architectural Market Marché de l’architecture
Field of Employment Domaine d’activité
lit
huania 2008 2010 2012 2014 2016
Population 3 366 357 3 329 039 3 199 771 2 943 472 2 888 558
GDP PIB € m 32 288 25 820 30 705 34 631 37 331
GDP/PIB head/habitant € 9 591 7 756 9 596 11 765 12 924
Construction € m 5 904 3 203 3 378 3 733 3 479
2008 2010 2012 2014 2016
Architects Architectes n/a 1 500 1 500 1 350 1 350
% Male Homme n/a 68 86 n/a 50
% Female Femme n/a 32 14 n/a 50
% <40 years <40 ans n/a 36 37 n/a 38
Practices Bureaux n/a 282 422 n/a 337
2008 2010 2012 2014 2016
Market Marché (€ m) n/a 11 10 n/a 11
Average revenue per practice (€) : Revenu moyen par bureaux d’architecture (€) :
2 persons personnes n/a 29 148 n/a n/a 26 566 6 - 10 persons personnes n/a 82 324 n/a n/a 178 349
Trends 2008-16 Tendances 2008-16
Earnings Revenus
Response Réponse
2008 2010 2012 2014 2016
Participants Répondants n/a 26 22 n/a 143
Accuracy of results 95% confidence Précision des résultats: 95% confiance n/a +/-19 +/- 20.7 n/a +/- 7.8
0
500
1000
1500
2000
2500
201620142012201020080
10
20
30
40
50
num
ber a
rchi
tect
s/pr
actic
es n
ombr
e d’
arch
itect
es/b
urea
ux
total market size taille totale du m
arché €m
architects (left axis) architectes (axe de gauche) practices (left axis) bureaux (axe de gauche) market (right axis) marché (axe de droite)
litu
anie
* Earnings values are unadjusted for PPP * Revenu moyen NON ajusté par PPA
per cent pourcentage
2008 2010 2012 2014 2016
Sole Principals Dirigeant unique n/a 28 24 n/a 14
Partners & Directors Associé dirigeant n/a 28 43 n/a 3
Private practice Salaried Salarié – Secteur privé n/a 20 19 n/a 22
Private in-house L’industrie / commerce n/a 4 0 n/a 0
Freelance Indépendant n/a 8 5 n/a 15
Other Private Autres – Secteur privé n/a 8 5 n/a 36
Local / central government Collectivité locale / gouvernement n/a 4 5 n/a 6
Other Public Autre – secteur public n/a 0 0 n/a 5
Average earnings €* Revenu moyen en € *
2008 2010 2012 2014 2016
Sole Principals Dirigeant unique n/a 8 689 n/a n/a n/a
Partners & Directors Associé dirigeant n/a n/a n/a n/a n/a
Private practice Salaried Salarié – Secteur privé n/a 5 792 n/a n/a n/a
Private in-house L’industrie / commerce n/a n/a n/a n/a n/a
Freelance Indépendant n/a n/a n/a n/a n/a
Other Private Autres – Secteur privé n/a n/a n/a n/a n/a
Local / central government Collectivité locale / gouvernement n/a n/a n/a n/a n/a
Other Public Autre – secteur public n/a 6 951 n/a n/a n/a
secTIon 2 - 82The ArchITecTurAl ProfessIon In euroPe 2016 / lA ProfessIon d’ArchITecTe en euroPe 2016

Mirza & Nacey Reserach LtdSouthdown HouseFord Lane, FordArundelWest SussexBN18 0DEUnited Kingdom
Telephone: +44 1243 555302email: [email protected]
MIRZA & NACEY RESEARCH
Registered office: Southdown House, Ford Lane, Ford, Arundel, West Sussex BN18 0DE. Registered in England and Wales. Company No. 04618115
Social & Economic Social & Economiqueconstruction / GDP previous year construction / PIB année précédente
Architectural Profession Profession d’architecte
Architectural Market Marché de l’architecture
Field of Employment Domaine d’activité
luxe
mbourg 2008 2010 2012 2014 2016
Population 483 799 502 066 524 853 549 680 576 249
GDP PIB € m 35 982 40 267 42 822 45 478 51 216
GDP/PIB head/habitant € 75 400 80 202 81 588 82 736 88 879
Construction € m 4 585 5 202 5 306 5 579 7 284
2008 2010 2012 2014 2016
Architects Architectes 600 600 680 900 950
% Male Homme 69 n/a 72 75 74
% Female Femme 31 n/a 28 25 26
% <40 years <40 ans 39 0 38 22 14
Practices Bureaux 194 n/a 166 244 190
2008 2010 2012 2014 2016
Market Marché (€ m) 32 n/a 38 49 68
Average revenue per practice (€) : Revenu moyen par bureaux d’architecture (€) :
2 persons personnes n/a n/a 154 000 231 165 138 750 6 - 10 persons personnes 605 778 n/a 683 115 486 532 443 100
Trends 2008-16 Tendances 2008-16
Earnings Revenus
Response Réponse
2008 2010 2012 2014 2016
Participants Répondants 75 n/a 89 130 86
Accuracy of results 95% confidence Précision des résultats: 95% confiance +/- 11 n/a +/- 9.7 +/- 8.0 +/- 10.1
0
200
400
600
800
1000
1200
1400
201620142012201020080
10
20
30
40
50
60
70
num
ber a
rchi
tect
s/pr
actic
es n
ombr
e d’
arch
itect
es/b
urea
ux
total market size taille totale du m
arché €m
architects (left axis) architectes (axe de gauche) practices (left axis) bureaux (axe de gauche) market (right axis) marché (axe de droite)
luxe
mbourg
* Earnings values are unadjusted for PPP * Revenu moyen NON ajusté par PPA
per cent pourcentage
2008 2010 2012 2014 2016
Sole Principals Dirigeant unique 31 n/a 39 34 22
Partners & Directors Associé dirigeant 14 n/a 24 28 39
Private practice Salaried Salarié – Secteur privé 15 n/a 10 19 14
Private in-house L’industrie / commerce 1 n/a 0 0 1
Freelance Indépendant 16 n/a 9 9 8
Other Private Autres – Secteur privé 16 n/a 19 9 15
Local / central government Collectivité locale / gouvernement 5 n/a 0 0 0
Other Public Autre – secteur public 1 n/a 0 0 0
Average earnings €* Revenu moyen en € *
2008 2010 2012 2014 2016
Sole Principals Dirigeant unique 57 000 n/a 56 000 56 000 52 050
Partners & Directors Associé dirigeant 45 000 n/a 75 000 70 000 88 000
Private practice Salaried Salarié – Secteur privé 90 000 n/a 82 000 48 000 90 750
Private in-house L’industrie / commerce n/a n/a 31 000 n/a n/a
Freelance Indépendant 50 000 n/a 50 000 57 000 60 000
Other Private Autres – Secteur privé n/a n/a n/a 60 000 80 000
Local / central government Collectivité locale / gouvernement n/a n/a n/a n/a n/a
Other Public Autre – secteur public 50 000 n/a 56 400 n/a n/a
secTIon 2 - 83The ArchITecTurAl ProfessIon In euroPe 2016 / lA ProfessIon d’ArchITecTe en euroPe 2016

Mirza & Nacey Reserach LtdSouthdown HouseFord Lane, FordArundelWest SussexBN18 0DEUnited Kingdom
Telephone: +44 1243 555302email: [email protected]
MIRZA & NACEY RESEARCH
Registered office: Southdown House, Ford Lane, Ford, Arundel, West Sussex BN18 0DE. Registered in England and Wales. Company No. 04618115
Social & Economic Social & Economiqueconstruction / GDP previous year construction / PIB année précédente
Architectural Profession Profession d’architecte
Architectural Market Marché de l’architecture
Field of Employment Domaine d’activité
malt
a2008 2010 2012 2014 2016
Population 410 584 414 372 420 085 425 384 434 403
GDP PIB € m 5 377 6 235 6 499 7 263 8 788
GDP/PIB head/habitant € 13 100 15 046 15 471 17 073 20 231
Construction € m 415 503 501 744 1 043
2008 2010 2012 2014 2016
Architects Architectes 500 650 650 650 650
% Male Homme 81 n/a 76 73 64
% Female Femme 19 n/a 24 27 36
% <40 years <40 ans 53 0 56 52 58
Practices Bureaux 83 n/a 146 130 99
2008 2010 2012 2014 2016
Market Marché (€ m) 13 n/a 16 13 10
Average revenue per practice (€) : Revenu moyen par bureaux d’architecture (€) :
2 persons personnes 83 375 n/a 86 125 24 500 n/a 6 - 10 persons personnes 236 250 n/a n/a 375 000 n/a
Trends 2008-16 Tendances 2008-16
Earnings Revenus
Response Réponse
2008 2010 2012 2014 2016
Participants Répondants 95 n/a 41 74 45
Accuracy of results 95% confidence Précision des résultats: 95% confiance +/- 9 n/a +/- 14.8 +/- 10.7 +/- 14.1
0
200
400
600
800
1000
1200
201620142012201020080
10
20
30
40
50
60
num
ber a
rchi
tect
s/pr
actic
es n
ombr
e d’
arch
itect
es/b
urea
ux
total market size taille totale du m
arché €m
architects (left axis) architectes (axe de gauche) practices (left axis) bureaux (axe de gauche) market (right axis) marché (axe de droite)
malte
* Earnings values are unadjusted for PPP * Revenu moyen NON ajusté par PPA
per cent pourcentage
2008 2010 2012 2014 2016
Sole Principals Dirigeant unique 9 n/a 18 17 9
Partners & Directors Associé dirigeant 15 n/a 16 5 5
Private practice Salaried Salarié – Secteur privé 35 n/a 29 35 41
Private in-house L’industrie / commerce 1 n/a 0 6 0
Freelance Indépendant 12 n/a 3 6 5
Other Private Autres – Secteur privé 5 n/a 11 6 7
Local / central government Collectivité locale / gouvernement 18 n/a 8 19 18
Other Public Autre – secteur public 5 n/a 16 5 16
Average earnings €* Revenu moyen en € *
2008 2010 2012 2014 2016
Sole Principals Dirigeant unique 51 000 n/a 25 000 25 000 n/a
Partners & Directors Associé dirigeant 42 000 n/a 45 000 57 500 n/a
Private practice Salaried Salarié – Secteur privé 20 000 n/a 25 000 21 750 21 300
Private in-house L’industrie / commerce 25 000 n/a 50 000 n/a n/a
Freelance Indépendant n/a n/a 45 000 40 843 n/a
Other Private Autres – Secteur privé n/a n/a 25 000 32 500 n/a
Local / central government Collectivité locale / gouvernement n/a n/a 21 300 30 000 28 950
Other Public Autre – secteur public 25 250 n/a 25 000 40 000 38 500
secTIon 2 - 84The ArchITecTurAl ProfessIon In euroPe 2016 / lA ProfessIon d’ArchITecTe en euroPe 2016

Mirza & Nacey Reserach LtdSouthdown HouseFord Lane, FordArundelWest SussexBN18 0DEUnited Kingdom
Telephone: +44 1243 555302email: [email protected]
MIRZA & NACEY RESEARCH
Registered office: Southdown House, Ford Lane, Ford, Arundel, West Sussex BN18 0DE. Registered in England and Wales. Company No. 04618115
Social & Economic Social & Economiqueconstruction / GDP previous year construction / PIB année précédente
Architectural Profession Profession d’architecte
Architectural Market Marché de l’architecture
Field of Employment Domaine d’activité
neth
erl
ands
2008 2010 2012 2014 2016
Population 16 404 282 16 577 612 16 730 348 16 829 289 16 979 120
GDP PIB € m 596 226 585 318 606 111 602 658 676 531
GDP/PIB head/habitant € 36 346 35 308 36 228 35 810 39 845
Construction € m 85 665 75 162 76 913 70 385 100 870
2008 2010 2012* 2014* 2016
Architects Architectes 9,100 9,900 10 700 10 900 11 200
% Male Homme 86 81 79 79 80
% Female Femme 14 19 21 21 20
% <40 years <40 ans 32 32 35 35 39
Practices Bureaux 3,304 3,255 n/a 3 714 3 692
2008 2010 2012* 2014* 2016
Market Marché (€ m) 902 976 807 910 940
Average revenue per practice (€) : Revenu moyen par bureaux d’architecture (€) :
2 persons personnes 103 714 228 532 85 000 105 000 134 649 6 - 10 persons personnes 325 909 835 500 550 000 560 000 520 133
Trends 2008-16 Tendances 2008-16
Earnings Revenus
Response Réponse
2008 2010 2012 2014 2016
Participants Répondants 118 214 n/a 10 482
Accuracy of results 95% confidence Précision des résultats: 95% confiance +/-9 +/-7 n/a +/- 31.0 +/- 4.4
0
2000
4000
6000
8000
10000
12000
14000
16000
201620142012201020080
200
400
600
800
1000
1200
1400
1600
num
ber a
rchi
tect
s/pr
actic
es n
ombr
e d’
arch
itect
es/b
urea
ux
total market size taille totale du m
arché €m
architects (left axis) architectes (axe de gauche) practices (left axis) bureaux (axe de gauche) market (right axis) marché (axe de droite)
Pays-b
as
* Earnings values are unadjusted for PPP * Revenu moyen NON ajusté par PPA
* 2012 / 2014: BNA Annual Benchmark Research
2012/14: BNA Annual Benchmark Research 2012 151 / 2016 135 Participants Répondants
* 2012 / 2014: BNA Annual Benchmark Research
* 2012 / 2014: BNA Annual Benchmark Research
* 2012 / 2014: BNA Annual Benchmark Research
per cent pourcentage
2008 2010 2012* 2014* 2016
Sole Principals Dirigeant unique 31 20 20 20 9
Partners & Directors Associé dirigeant 45 21 20 18 9
Private practice Salaried Salarié – Secteur privé 14 8 10 10 3
Private in-house L’industrie / commerce 3 0 2 2 2
Freelance Indépendant 3 7 40 45 12
Other Private Autres – Secteur privé 0 41 5 2 61
Local / central government Collectivité locale / gouvernement 2 0 1 1 2
Other Public Autre – secteur public 3 3 2 2 3
Average earnings €* Revenu moyen en € *
2008 2010 2012* 2014* 2016
Sole Principals Dirigeant unique 45 144 45 000 41 000 40 000 50 000
Partners & Directors Associé dirigeant 103 500 71 000 70 000 70 000 56 850
Private practice Salaried Salarié – Secteur privé 42 000 60 000 41 000 40 000 47 500
Private in-house L’industrie / commerce n/a 50 000 50 000 50 000 49 000
Freelance Indépendant n/a 64 500 47 000 47 500 29 500
Other Private Autres – Secteur privé n/a n/a 44 000 45 000 40 000
Local / central government Collectivité locale / gouvernement n/a 83 000 46 000 45 000 n/a
Other Public Autre – secteur public 54 000 55 000 55 000 55 000 62 500
secTIon 2 - 85The ArchITecTurAl ProfessIon In euroPe 2016 / lA ProfessIon d’ArchITecTe en euroPe 2016

Mirza & Nacey Reserach LtdSouthdown HouseFord Lane, FordArundelWest SussexBN18 0DEUnited Kingdom
Telephone: +44 1243 555302email: [email protected]
MIRZA & NACEY RESEARCH
Registered office: Southdown House, Ford Lane, Ford, Arundel, West Sussex BN18 0DE. Registered in England and Wales. Company No. 04618115
Social & Economic Social & Economiqueconstruction / GDP previous year construction / PIB année précédente
Architectural Profession Profession d’architecte
Architectural Market Marché de l’architecture
Field of Employment Domaine d’activité
Pola
nd
2008 2010 2012 2014 2016
Population 38 115 641 38 167 329 38 208 618 n/a 37 967 209
GDP PIB € m 363 154 353 306 370 014 n/a 427 737
GDP/PIB head/habitant € 9 528 9 257 9 684 n/a 11 266
Construction € m 68 672 61 695 68 723 n/a 61 170
2008 2010 2012 2014 2016
Architects Architectes 13 500 13 500 13 700 n/a 14 000
% Male Homme n/a 54 55 n/a 54
% Female Femme n/a 46 45 n/a 46
% <40 years <40 ans n/a 54 51 n/a 66
Practices Bureaux n/a 4 330 4 423 n/a 4 138
2008 2010 2012 2014 2016
Market Marché (€ m) n/a 259 211 n/a 212
Average revenue per practice (€) : Revenu moyen par bureaux d’architecture (€) :
2 persons personnes n/a 35 645 24 566 n/a 19 624 6 - 10 persons personnes n/a 208 280 132 438 n/a 199 662
Trends 2008-16 Tendances 2008-16
Earnings Revenus
Response Réponse
2008 2010 2012 2014 2016
Participants Répondants n/a 704 560 n/a 201
Accuracy of results 95% confidence Précision des résultats: 95% confiance n/a +/-4 +/- 4.1 n/a +/- 6.9
Polo
gne
* Earnings values are unadjusted for PPP * Revenu moyen NON ajusté par PPA
per cent pourcentage
2008 2010 2012 2014 2016
Sole Principals Dirigeant unique n/a 45 41 n/a 35
Partners & Directors Associé dirigeant n/a 13 14 n/a 11
Private practice Salaried Salarié – Secteur privé n/a 26 27 n/a 29
Private in-house L’industrie / commerce n/a 1 2 n/a 0
Freelance Indépendant n/a 5 5 n/a 12
Other Private Autres – Secteur privé n/a 5 3 n/a 6
Local / central government Collectivité locale / gouvernement n/a 4 5 n/a 7
Other Public Autre – secteur public n/a 1 2 n/a 2
Average earnings €* Revenu moyen en € *
2008 2010 2012 2014 2016
Sole Principals Dirigeant unique n/a 13 604 14 453 n/a 12 208
Partners & Directors Associé dirigeant n/a 22 674 23 487 n/a 40 047
Private practice Salaried Salarié – Secteur privé n/a 12 697 11 804 n/a 4 929
Private in-house L’industrie / commerce n/a n/a
Freelance Indépendant n/a 14 864 9 154 n/a 4 381
Other Private Autres – Secteur privé n/a 21 414 19 223 n/a 799
Local / central government Collectivité locale / gouvernement n/a 13 730 8 672 n/a 11 078
Other Public Autre – secteur public n/a 8 818 1 349 n/a n/a
0
3000
6000
9000
12000
15000
18000
21000
201620142012201020080
50
100
150
200
250
300
350
num
ber a
rchi
tect
s/pr
actic
es n
ombr
e d’
arch
itect
es/b
urea
ux
total market size taille totale du m
arché €m
architects (left axis) architectes (axe de gauche) practices (left axis) bureaux (axe de gauche) market (right axis) marché (axe de droite)
secTIon 2 - 86The ArchITecTurAl ProfessIon In euroPe 2016 / lA ProfessIon d’ArchITecTe en euroPe 2016

Mirza & Nacey Reserach LtdSouthdown HouseFord Lane, FordArundelWest SussexBN18 0DEUnited Kingdom
Telephone: +44 1243 555302email: [email protected]
MIRZA & NACEY RESEARCH
Registered office: Southdown House, Ford Lane, Ford, Arundel, West Sussex BN18 0DE. Registered in England and Wales. Company No. 04618115
Social & Economic Social & Economiqueconstruction / GDP previous year construction / PIB année précédente
Architectural Profession Profession d’architecte
Architectural Market Marché de l’architecture
Field of Employment Domaine d’activité
Port
ugal
2008 2010 2012 2014 2016
Population 10 617 575 10 637 713 10 541 840 10 427 301 10 341 330
GDP PIB € m 171 983 172 670 170 907 165 690 179 540
GDP/PIB head/habitant € 16 198 16 232 16 212 15 890 17 361
Construction € m 29 541 25 246 22 671 18 710 16 342
2008 2010 2012 2014 2016
Architects Architectes 16 300 13 000 17 100 21 200 22 200
% Male Homme n/a n/a 56 57 55
% Female Femme n/a n/a 44 43 45
% <40 years <40 ans n/a n/a 73 68 53
Practices Bureaux n/a n/a 3 226 4 462 3 479
2008 2010 2012 2014 2016
Market Marché (€ m) n/a n/a 261 177 276
Average revenue per practice (€) : Revenu moyen par bureaux d’architecture (€) :
2 persons personnes n/a n/a 35 078 38 123 46 334 6 - 10 persons personnes n/a n/a 508 499 223 173 207 800
Trends 2008-16 Tendances 2008-16
Earnings Revenus
Response Réponse
2008 2010 2012 2014 2016
Participants Répondants n/a n/a 1 678 1 836 718
Accuracy of results 95% confidence Précision des résultats: 95% confiance n/a n/a +/- 2.2 +/- 2.2 +/- 3.6
0
5000
10000
15000
20000
25000
30000
35000
201620142012201020080
100
200
300
400
500
600
700
num
ber a
rchi
tect
s/pr
actic
es n
ombr
e d’
arch
itect
es/b
urea
ux
total market size taille totale du m
arché €m
architects (left axis) architectes (axe de gauche) practices (left axis) bureaux (axe de gauche) market (right axis) marché (axe de droite)
Portu
gal
* Earnings values are unadjusted for PPP * Revenu moyen NON ajusté par PPA
per cent pourcentage
2008 2010 2012 2014 2016
Sole Principals Dirigeant unique n/a n/a 11 9 11
Partners & Directors Associé dirigeant n/a n/a 12 10 10
Private practice Salaried Salarié – Secteur privé n/a n/a 35 37 33
Private in-house L’industrie / commerce n/a n/a 1 2 1
Freelance Indépendant n/a n/a 15 13 18
Other Private Autres – Secteur privé n/a n/a 6 4 3
Local / central government Collectivité locale / gouvernement n/a n/a 13 21 17
Other Public Autre – secteur public n/a n/a 7 5 6
Average earnings €* Revenu moyen en € *
2008 2010 2012 2014 2016
Sole Principals Dirigeant unique n/a n/a 13 000 12 835 14 000
Partners & Directors Associé dirigeant n/a n/a 14 300 14 125 14 400
Private practice Salaried Salarié – Secteur privé n/a n/a 10 600 9 500 9 600
Private in-house L’industrie / commerce n/a n/a 10 850 n/a n/a
Freelance Indépendant n/a n/a 11 900 10 833 11 000
Other Private Autres – Secteur privé n/a n/a 15 521 11 000 12 250
Local / central government Collectivité locale / gouvernement n/a n/a 18 150 16 820 16 407
Other Public Autre – secteur public n/a n/a 12 000 16 400 20 940
secTIon 2 - 87The ArchITecTurAl ProfessIon In euroPe 2016 / lA ProfessIon d’ArchITecTe en euroPe 2016
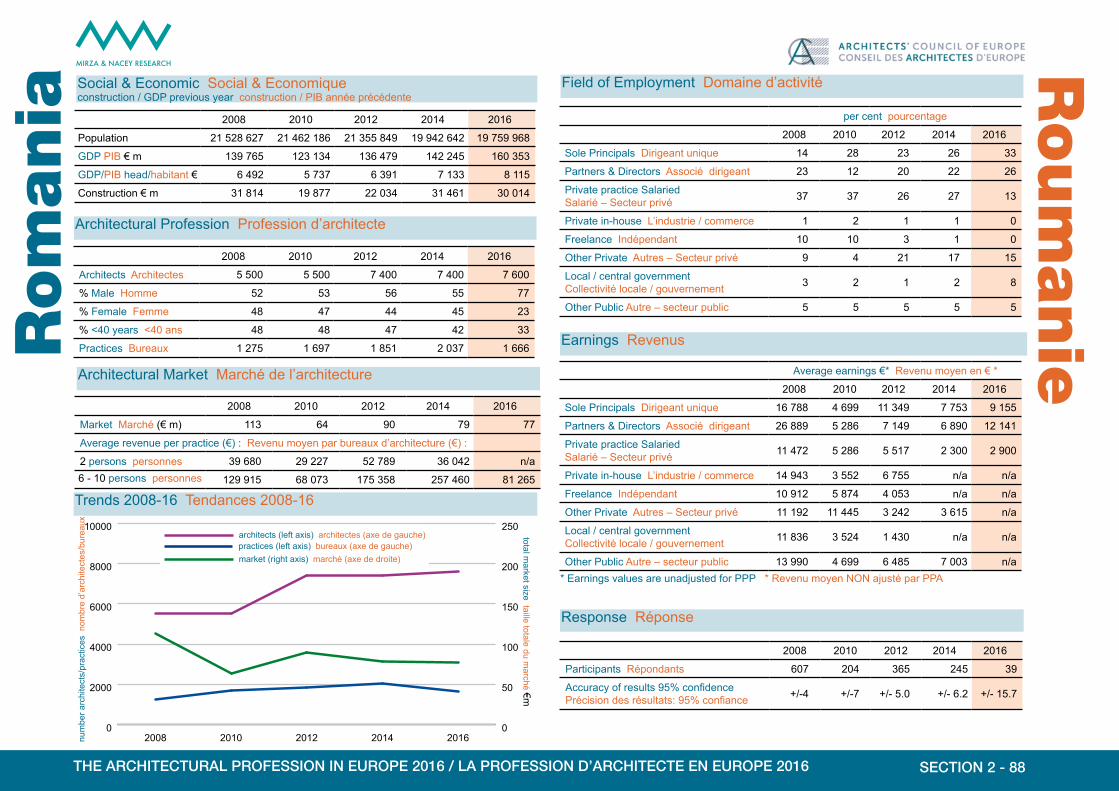
Mirza & Nacey Reserach LtdSouthdown HouseFord Lane, FordArundelWest SussexBN18 0DEUnited Kingdom
Telephone: +44 1243 555302email: [email protected]
MIRZA & NACEY RESEARCH
Registered office: Southdown House, Ford Lane, Ford, Arundel, West Sussex BN18 0DE. Registered in England and Wales. Company No. 04618115
Social & Economic Social & Economiqueconstruction / GDP previous year construction / PIB année précédente
Architectural Profession Profession d’architecte
Architectural Market Marché de l’architecture
Field of Employment Domaine d’activité
rom
ania 2008 2010 2012 2014 2016
Population 21 528 627 21 462 186 21 355 849 19 942 642 19 759 968
GDP PIB € m 139 765 123 134 136 479 142 245 160 353
GDP/PIB head/habitant € 6 492 5 737 6 391 7 133 8 115
Construction € m 31 814 19 877 22 034 31 461 30 014
2008 2010 2012 2014 2016
Architects Architectes 5 500 5 500 7 400 7 400 7 600
% Male Homme 52 53 56 55 77
% Female Femme 48 47 44 45 23
% <40 years <40 ans 48 48 47 42 33
Practices Bureaux 1 275 1 697 1 851 2 037 1 666
2008 2010 2012 2014 2016
Market Marché (€ m) 113 64 90 79 77
Average revenue per practice (€) : Revenu moyen par bureaux d’architecture (€) :
2 persons personnes 39 680 29 227 52 789 36 042 n/a 6 - 10 persons personnes 129 915 68 073 175 358 257 460 81 265
Trends 2008-16 Tendances 2008-16
Earnings Revenus
Response Réponse
2008 2010 2012 2014 2016
Participants Répondants 607 204 365 245 39
Accuracy of results 95% confidence Précision des résultats: 95% confiance +/-4 +/-7 +/- 5.0 +/- 6.2 +/- 15.7
0
2000
4000
6000
8000
10000
201620142012201020080
50
100
150
200
250
num
ber a
rchi
tect
s/pr
actic
es n
ombr
e d’
arch
itect
es/b
urea
ux
total market size taille totale du m
arché €m
architects (left axis) architectes (axe de gauche) practices (left axis) bureaux (axe de gauche) market (right axis) marché (axe de droite)
roum
anie
* Earnings values are unadjusted for PPP * Revenu moyen NON ajusté par PPA
per cent pourcentage
2008 2010 2012 2014 2016
Sole Principals Dirigeant unique 14 28 23 26 33
Partners & Directors Associé dirigeant 23 12 20 22 26
Private practice Salaried Salarié – Secteur privé 37 37 26 27 13
Private in-house L’industrie / commerce 1 2 1 1 0
Freelance Indépendant 10 10 3 1 0
Other Private Autres – Secteur privé 9 4 21 17 15
Local / central government Collectivité locale / gouvernement 3 2 1 2 8
Other Public Autre – secteur public 5 5 5 5 5
Average earnings €* Revenu moyen en € *
2008 2010 2012 2014 2016
Sole Principals Dirigeant unique 16 788 4 699 11 349 7 753 9 155
Partners & Directors Associé dirigeant 26 889 5 286 7 149 6 890 12 141
Private practice Salaried Salarié – Secteur privé 11 472 5 286 5 517 2 300 2 900
Private in-house L’industrie / commerce 14 943 3 552 6 755 n/a n/a
Freelance Indépendant 10 912 5 874 4 053 n/a n/a
Other Private Autres – Secteur privé 11 192 11 445 3 242 3 615 n/a
Local / central government Collectivité locale / gouvernement 11 836 3 524 1 430 n/a n/a
Other Public Autre – secteur public 13 990 4 699 6 485 7 003 n/a
secTIon 2 - 88The ArchITecTurAl ProfessIon In euroPe 2016 / lA ProfessIon d’ArchITecTe en euroPe 2016

Mirza & Nacey Reserach LtdSouthdown HouseFord Lane, FordArundelWest SussexBN18 0DEUnited Kingdom
Telephone: +44 1243 555302email: [email protected]
MIRZA & NACEY RESEARCH
Registered office: Southdown House, Ford Lane, Ford, Arundel, West Sussex BN18 0DE. Registered in England and Wales. Company No. 04618115
Social & Economic Social & Economiqueconstruction / GDP previous year construction / PIB année précédente
Architectural Profession Profession d’architecte
Architectural Market Marché de l’architecture
Field of Employment Domaine d’activité
slo
vakia 2008 2010 2012 2014 2016
Population 5 400 998 5 424 925 5 404 322 5 415 949 5 426 252
GDP PIB € m 64 572 65 592 71 730 72 134 78 686
GDP/PIB head/habitant € 11 956 12 091 13 273 13 319 14 501
Construction € m 14 149 13 335 12 761 12 343 12 418
2008 2010 2012 2014 2016
Architects Architectes 1 300 1 600 1 600 1 750 1 650
% Male Homme n/a 85 n/a 79 77
% Female Femme n/a 15 n/a 21 23
% <40 years <40 ans n/a 27 n/a 28 33
Practices Bureaux n/a 294 n/a 487 449
2008 2010 2012 2014 2016
Market Marché (€ m) n/a 41 n/a 15 22
Average revenue per practice (€) : Revenu moyen par bureaux d’architecture (€) :
2 persons personnes n/a n/a n/a 23 254 45 100 6 - 10 persons personnes n/a n/a n/a 41 577 202 667
Trends 2008-16 Tendances 2008-16
Earnings Revenus
Response Réponse
2008 2010 2012 2014 2016
Participants Répondants n/a 34 n/a 416 143
Accuracy of results 95% confidence Précision des résultats: 95% confiance n/a +/-17 n/a +/- 4.2 +/- 7.8
0
1000
2000
3000
4000
5000
201620142012201020080
50
100
150
200
250
num
ber a
rchi
tect
s/pr
actic
es n
ombr
e d’
arch
itect
es/b
urea
ux
total market size taille totale du m
arché €m
architects (left axis) architectes (axe de gauche) practices (left axis) bureaux (axe de gauche) market (right axis) marché (axe de droite)
slo
vaquie
* Earnings values are unadjusted for PPP * Revenu moyen NON ajusté par PPA
Average earnings €* Revenu moyen en € *
2008 2010 2012 2014 2016
Sole Principals Dirigeant unique n/a 15 000 n/a 10 000 14 700
Partners & Directors Associé dirigeant n/a 38 000 n/a 11 500 10 800
Private practice Salaried Salarié – Secteur privé n/a 13 650 n/a 13 000 13 000
Private in-house L’industrie / commerce n/a 13 000 n/a n/a n/a
Freelance Indépendant n/a n/a n/a 9 928 8 725
Other Private Autres – Secteur privé n/a n/a n/a 21 500 n/a
Local / central government Collectivité locale / gouvernement n/a n/a n/a 12 657 n/a
Other Public Autre – secteur public n/a 16 378 n/a 10 000 n/a
per cent pourcentage
2008 2010 2012 2014 2016
Sole Principals Dirigeant unique n/a 31 n/a 38 35
Partners & Directors Associé dirigeant n/a 13 n/a 10 19
Private practice Salaried Salarié – Secteur privé n/a 22 n/a 17 10
Private in-house L’industrie / commerce n/a 0 n/a 0 1
Freelance Indépendant n/a 22 n/a 26 24
Other Private Autres – Secteur privé n/a 3 n/a 4 4
Local / central government Collectivité locale / gouvernement n/a 3 n/a 3 5
Other Public Autre – secteur public n/a 6 n/a 3 2
secTIon 2 - 89The ArchITecTurAl ProfessIon In euroPe 2016 / lA ProfessIon d’ArchITecTe en euroPe 2016

Mirza & Nacey Reserach LtdSouthdown HouseFord Lane, FordArundelWest SussexBN18 0DEUnited Kingdom
Telephone: +44 1243 555302email: [email protected]
MIRZA & NACEY RESEARCH
Registered office: Southdown House, Ford Lane, Ford, Arundel, West Sussex BN18 0DE. Registered in England and Wales. Company No. 04618115
Social & Economic Social & Economiqueconstruction / GDP previous year construction / PIB année précédente
Architectural Profession Profession d’architecte
Architectural Market Marché de l’architecture
Field of Employment Domaine d’activité
slo
venia 2008 2010 2012 2014 2016
Population 2 025 866 2 046 976 2 055 496 2 061 085 2 064 188
GDP PIB € m 37 305 35 800 36 172 35 275 38 570
GDP/PIB head/habitant € 18 414 17 489 17 598 17 115 18 685
Construction € m 9 428 6 585 4 864 5 522 4 339
2008 2010 2012 2014 2016
Architects Architectes 1 200 1 250 1 250 1 300 1 350
% Male Homme 54 50 57 44 48
% Female Femme 46 50 43 56 52
% <40 years <40 ans 52 43 33 33 24
Practices Bureaux 288 186 417 578 444
2008 2010 2012 2014 2016
Market Marché (€ m) 41 10 42 25 36
Average revenue per practice (€) : Revenu moyen par bureaux d’architecture (€) :
2 persons personnes 51,220 n/a n/a 29 050 62 595 6 - 10 persons personnes 342,832 n/a n/a n/a 115 800
Trends 2008-16 Tendances 2008-16
Earnings Revenus
Response Réponse
2008 2010 2012 2014 2016
Participants Répondants 96 43 37 53 111
Accuracy of results 95% confidence Précision des résultats: 95% confiance +/-10 +/-15 +/- 15.9 +/- 13.2 +/- 9.0
0
500
1000
1500
2000
2500
201620142012201020080
20
40
60
80
100
num
ber a
rchi
tect
s/pr
actic
es n
ombr
e d’
arch
itect
es/b
urea
ux
total market size taille totale du m
arché €m
architects (left axis) architectes (axe de gauche) practices (left axis) bureaux (axe de gauche) market (right axis) marché (axe de droite)
slo
vénie
* Earnings values are unadjusted for PPP * Revenu moyen NON ajusté par PPA
per cent pourcentage
2008 2010 2012 2014 2016
Sole Principals Dirigeant unique 18 21 34 30 20
Partners & Directors Associé dirigeant 13 24 19 33 17
Private practice Salaried Salarié – Secteur privé 33 36 25 13 19
Private in-house L’industrie / commerce 2 0 0 0 4
Freelance Indépendant 18 10 13 20 19
Other Private Autres – Secteur privé 7 2 3 0 14
Local / central government Collectivité locale / gouvernement 5 5 3 3 6
Other Public Autre – secteur public 3 2 3 3 3
Average earnings €* Revenu moyen en € *
2008 2010 2012 2014 2016
Sole Principals Dirigeant unique 33 000 24 000 20 500 24 000 20 000
Partners & Directors Associé dirigeant 26 000 17 000 33 000 14 400 20 000
Private practice Salaried Salarié – Secteur privé 16 500 30 000 4 493 13 200 15 000
Private in-house L’industrie / commerce 12 000 7 550 7 750 n/a n/a
Freelance Indépendant 15 600 n/a 22 000 20 000 12 830
Other Private Autres – Secteur privé 17 000 n/a 13 500 n/a 14 000
Local / central government Collectivité locale / gouvernement n/a n/a 1 200 n/a n/a
Other Public Autre – secteur public 24 500 25 000 15 000 n/a n/a
secTIon 2 - 90The ArchITecTurAl ProfessIon In euroPe 2016 / lA ProfessIon d’ArchITecTe en euroPe 2016

Mirza & Nacey Reserach LtdSouthdown HouseFord Lane, FordArundelWest SussexBN18 0DEUnited Kingdom
Telephone: +44 1243 555302email: [email protected]
MIRZA & NACEY RESEARCH
Registered office: Southdown House, Ford Lane, Ford, Arundel, West Sussex BN18 0DE. Registered in England and Wales. Company No. 04618115
Social & Economic Social & Economiqueconstruction / GDP previous year construction / PIB année précédente
Architectural Profession Profession d’architecte
Architectural Market Marché de l’architecture
Field of Employment Domaine d’activité
spain 2008 2010 2012 2014 2016
Population 45 283 259 45 989 016 46 196 277 46 507 760 46 438 422
GDP PIB € m 1 087 788 1 048 883 1 063 355 1 022 988 1 075 639
GDP/PIB head/habitant € 24 022 22 807 23 018 21 996 23 163
Construction € m 270 999 191 820 156 525 162 642 131 177
2008 2010 2012 2014 2016
Architects Architectes 45 000 50 000 51 000 51 700 53 800
% Male Homme n/a n/a 75 71 72
% Female Femme n/a n/a 25 29 28
% <40 years <40 ans n/a n/a 56 41 50
Practices Bureaux n/a n/a 8 153 7 742 8 077
2008 2010 2012 2014 2016
Market Marché (€ m) n/a n/a 336 333 461
Average revenue per practice (€) : Revenu moyen par bureaux d’architecture (€) :
2 persons personnes n/a n/a 58 452 42 864 29 855 6 - 10 persons personnes n/a n/a 193 125 153 339 286 250
Trends 2008-16 Tendances 2008-16
Earnings Revenus
Response Réponse
2008 2010 2012 2014 2016
Participants Répondants n/a n/a 184 645 383
Accuracy of results 95% confidence Précision des résultats: 95% confiance n/a n/a +/- 7.2 +/- 3.8 +/- 5.0
0
10000
20000
30000
40000
50000
60000
70000
201620142012201020080
100
200
300
400
500
600
700
num
ber a
rchi
tect
s/pr
actic
es n
ombr
e d’
arch
itect
es/b
urea
ux
total market size taille totale du m
arché €m
architects (left axis) architectes (axe de gauche) practices (left axis) bureaux (axe de gauche) market (right axis) marché (axe de droite)
esp
agne
* Earnings values are unadjusted for PPP * Revenu moyen NON ajusté par PPA
per cent pourcentage
2008 2010 2012 2014 2016
Sole Principals Dirigeant unique n/a n/a 21 17 14
Partners & Directors Associé dirigeant n/a n/a 11 7 6
Private practice Salaried Salarié – Secteur privé n/a n/a 5 11 14
Private in-house L’industrie / commerce n/a n/a 0 0 0
Freelance Indépendant n/a n/a 14 12 13
Other Private Autres – Secteur privé n/a n/a 48 40 44
Local / central government Collectivité locale / gouvernement n/a n/a 1 7 6
Other Public Autre – secteur public n/a n/a 1 6 3
Average earnings €* Revenu moyen en € *
2008 2010 2012 2014 2016
Sole Principals Dirigeant unique n/a n/a 30 250 30 000 15 000
Partners & Directors Associé dirigeant n/a n/a 18 000 25 000 25 000
Private practice Salaried Salarié – Secteur privé n/a n/a 16 000 30 000 24 000
Private in-house L’industrie / commerce n/a n/a 15 000 n/a n/a
Freelance Indépendant n/a n/a 26 400 20 000 21 000
Other Private Autres – Secteur privé n/a n/a 20 000 25 000 20 500
Local / central government Collectivité locale / gouvernement n/a n/a 4 200 40 304 52 000
Other Public Autre – secteur public n/a n/a 20 000 36 000 41 000
secTIon 2 - 91The ArchITecTurAl ProfessIon In euroPe 2016 / lA ProfessIon d’ArchITecTe en euroPe 2016

Mirza & Nacey Reserach LtdSouthdown HouseFord Lane, FordArundelWest SussexBN18 0DEUnited Kingdom
Telephone: +44 1243 555302email: [email protected]
MIRZA & NACEY RESEARCH
Registered office: Southdown House, Ford Lane, Ford, Arundel, West Sussex BN18 0DE. Registered in England and Wales. Company No. 04618115
Social & Economic Social & Economiqueconstruction / GDP previous year construction / PIB année précédente
Architectural Profession Profession d’architecte
Architectural Market Marché de l’architecture
Field of Employment Domaine d’activité
sw
eden
2008 2010 2012 2014 2016
Population 9 182 927 9 340 682 9 482 855 9 644 864 9 851 017
GDP PIB € m 334 227 339 215 387 886 420 849 446 946
GDP/PIB head/habitant € 36 397 36 316 40 904 43 635 45 371
Construction € m 38 237 38 269 38 608 43 152 63 559
2008 2010 2012 2014 2016
Architects Architectes 5 400 5 600 5 800 6 150 6 550
% Male Homme 49 51 49 49 54
% Female Femme 51 49 51 51 46
% <40 years <40 ans 41 31 32 34 25
Practices Bureaux 631 1 067 1 207 1 504 1 114
2008 2010 2012 2014 2016
Market Marché (€ m) 145 356 331 347 470
Average revenue per practice (€) : Revenu moyen par bureaux d’architecture (€) :
2 persons personnes 257 250 170 469 196 857 333 424 204 343 6 - 10 persons personnes 304 719 640 615 700 687 670 488 908 062
Trends 2008-16 Tendances 2008-16
Earnings Revenus
Response Réponse
2008 2010 2012 2014 2016
Participants Répondants 1 188 1 200 1 523 853 661
Accuracy of results 95% confidence Précision des résultats: 95% confiance +/-5 +/-3 +/- 2.2 +/- 3.1 +/- 3.6
0
2000
4000
6000
8000
10000
201620142012201020080
200
400
600
800
1000
num
ber a
rchi
tect
s/pr
actic
es n
ombr
e d’
arch
itect
es/b
urea
ux
total market size taille totale du m
arché €m
architects (left axis) architectes (axe de gauche) practices (left axis) bureaux (axe de gauche) market (right axis) marché (axe de droite)
suède
* Earnings values are unadjusted for PPP * Revenu moyen NON ajusté par PPA
per cent pourcentage
2008 2010 2012 2014 2016
Sole Principals Dirigeant unique 8 9 12 29 14
Partners & Directors Associé dirigeant 10 14 6 17 7
Private practice Salaried Salarié – Secteur privé 35 42 39 32 40
Private in-house L’industrie / commerce 1 2 1 1 0
Freelance Indépendant 6 3 0 1 0
Other Private Autres – Secteur privé 6 3 16 4 11
Local / central government Collectivité locale / gouvernement 25 20 23 14 24
Other Public Autre – secteur public 9 7 3 2 3
Average earnings €* Revenu moyen en € *
2008 2010 2012 2014 2016
Sole Principals Dirigeant unique 38 376 38 659 51 710 54 903 53 255
Partners & Directors Associé dirigeant 44 772 53 693 59 620 69 323 76 079
Private practice Salaried Salarié – Secteur privé 34 347 38 562 44 974 45 254 48 908
Private in-house L’industrie / commerce 31 980 35 437 73 119 n/a n/a
Freelance Indépendant 5 010 37 220 44 884 n/a n/a
Other Private Autres – Secteur privé 34 538 38 122 44 783 55 835 46 952
Local / central government Collectivité locale / gouvernement 43 706 46 412 49 496 61 048 50 321
Other Public Autre – secteur public 35 178 39 174 45 559 55 458 56 342
secTIon 2 - 92The ArchITecTurAl ProfessIon In euroPe 2016 / lA ProfessIon d’ArchITecTe en euroPe 2016

Mirza & Nacey Reserach LtdSouthdown HouseFord Lane, FordArundelWest SussexBN18 0DEUnited Kingdom
Telephone: +44 1243 555302email: [email protected]
MIRZA & NACEY RESEARCH
Registered office: Southdown House, Ford Lane, Ford, Arundel, West Sussex BN18 0DE. Registered in England and Wales. Company No. 04618115
Social & Economic Social & Economiqueconstruction / GDP previous year construction / PIB année précédente
Architectural Profession Profession d’architecte
Architectural Market Marché de l’architecture
Field of Employment Domaine d’activité
sw
itze
rland
2008 2010 2012 2014 2016
Population 7 701 856 7 785 806 7 954 662 8 136 689 8 325 194
GDP PIB € m 329 214 367 134 474 689 489 673 604 510
GDP/PIB head/habitant € 42 745 47 154 59 674 60 181 72 612
Construction € m 37 950 46 326 n/a 47 311 70 218
2008 2010 2012 2014 2016
Architects Architectes 5 300 5 300 5 400 7 200 7 300
% Male Homme n/a n/a n/a 73 n/a
% Female Femme n/a n/a n/a 28 n/a
% <40 years <40 ans n/a n/a n/a 33 n/a
Practices Bureaux n/a n/a n/a 1 629 n/a
2008 2010 2012 2014 2016
Market Marché (€ m) n/a n/a n/a 624 n/a
Average revenue per practice (€) : Revenu moyen par bureaux d’architecture (€) :
2 persons personnes n/a n/a n/a 187 577 n/a6 - 10 persons personnes n/a n/a n/a 962 959 n/a
Trends 2008-16 Tendances 2008-16
Earnings Revenus
Response Réponse
2008 2010 2012 2014 2016
Participants Répondants n/a n/a n/a 200 n/a
Accuracy of results 95% confidence Précision des résultats: 95% confiance n/a n/a n/a +/- 6.8 n/a
0
2000
4000
6000
8000
10000
12000
14000
16000
20162014201220102008num
ber a
rchi
tect
s/pr
actic
es n
ombr
e d’
arch
itect
es/b
urea
ux
total market size taille totale du m
arché €m
architects (left axis) architectes (axe de gauche) practices (left axis) bureaux (axe de gauche) market (right axis) marché (axe de droite)
0
n/an/a
200
400
600
800
1000
1200
1400
1600
suisse
* Earnings values are unadjusted for PPP * Revenu moyen NON ajusté par PPA
per cent pourcentage
2008 2010 2012 2014 2016
Sole Principals Dirigeant unique n/a n/a n/a 22 n/a
Partners & Directors Associé dirigeant n/a n/a n/a 37 n/a
Private practice Salaried Salarié – Secteur privé n/a n/a n/a 21 n/a
Private in-house L’industrie / commerce n/a n/a n/a 1 n/a
Freelance Indépendant n/a n/a n/a 3 n/a
Other Private Autres – Secteur privé n/a n/a n/a 11 n/a
Local / central government Collectivité locale / gouvernement n/a n/a n/a 5 n/a
Other Public Autre – secteur public n/a n/a n/a 2 n/a
Average earnings €* Revenu moyen en € *
2008 2010 2012 2014 2016
Sole Principals Dirigeant unique n/a n/a n/a 90 175 n/a
Partners & Directors Associé dirigeant n/a n/a n/a 98 373 n/a
Private practice Salaried Salarié – Secteur privé n/a n/a n/a 69 271 n/a
Private in-house L’industrie / commerce n/a n/a n/a n/a n/a
Freelance Indépendant n/a n/a n/a 59 024 n/a
Other Private Autres – Secteur privé n/a n/a n/a 90 175 n/a
Local / central government Collectivité locale / gouvernement n/a n/a n/a 111 489 n/a
Other Public Autre – secteur public n/a n/a n/a n/a n/a
secTIon 2 - 93The ArchITecTurAl ProfessIon In euroPe 2016 / lA ProfessIon d’ArchITecTe en euroPe 2016

Mirza & Nacey Reserach LtdSouthdown HouseFord Lane, FordArundelWest SussexBN18 0DEUnited Kingdom
Telephone: +44 1243 555302email: [email protected]
MIRZA & NACEY RESEARCH
Registered office: Southdown House, Ford Lane, Ford, Arundel, West Sussex BN18 0DE. Registered in England and Wales. Company No. 04618115
Social & Economic Social & Economiqueconstruction / GDP previous year construction / PIB année précédente
Architectural Profession Profession d’architecte
Architectural Market Marché de l’architecture
Field of Employment Domaine d’activité
Turk
ey
2008 2010 2012 2014 2016
Population 70 586 256 72 561 312 74 724 269 76 667 864 78 741 053
GDP PIB € m 498 602 533 121 555 249 617 794 653 315
GDP/PIB head/habitant € 7 064 7 347 7 431 8 058 8 297
Construction € m 23 572 n/a 22 365 27 499 30 221
2008 2010 2012 2014 2016
Architects Architectes 32 300 37 200 40 600 44 700 50 000
% Male Homme 53 55 55 52 54
% Female Femme 47 45 45 48 46
% <40 years <40 ans 61 64 57 62 66
Practices Bureaux 6 497 5 836 7 232 9 231 10 341
2008 2010 2012 2014 2016
Market Marché (€ m) 727 960 857 888 1 183
Average revenue per practice (€) : Revenu moyen par bureaux d’architecture (€) :
2 persons personnes 38 556 40 837 47 648 31 548 33 645 6 - 10 persons personnes 154 042 388 736 225 491 339 257 220 272
Trends 2008-16 Tendances 2008-16
Earnings Revenus
Response Réponse
2008 2010 2012 2014 2016
Participants Répondants 1 594 1 332 910 605 694
Accuracy of results 95% confidence Précision des résultats: 95% confiance +/-2 +/-3 +/- 3.2 +/- 4.0 +/- 3.7
0
10000
20000
30000
40000
50000
60000
70000
201620142012201020080
200
400
600
800
1000
1200
1400
num
ber a
rchi
tect
s/pr
actic
es n
ombr
e d’
arch
itect
es/b
urea
ux
total market size taille totale du m
arché €m
architects (left axis) architectes (axe de gauche) practices (left axis) bureaux (axe de gauche) market (right axis) marché (axe de droite)
Turq
uie
* Earnings values are unadjusted for PPP * Revenu moyen NON ajusté par PPA
per cent pourcentage
2008 2010 2012 2014 2016
Sole Principals Dirigeant unique 10 19 22 19 17
Partners & Directors Associé dirigeant 20 10 9 9 7
Private practice Salaried Salarié – Secteur privé 35 41 42 50 48
Private in-house L’industrie / commerce 1 1 0 0 0
Freelance Indépendant 13 10 7 5 7
Other Private Autres – Secteur privé 4 3 2 1 2
Local / central government Collectivité locale / gouvernement 7 5 6 7 7
Other Public Autre – secteur public 11 12 11 10 12
Average earnings €* Revenu moyen en € *
2008 2010 2012 2014 2016
Sole Principals Dirigeant unique 26 366 30 909 28 012 26 040 29 675
Partners & Directors Associé dirigeant 26 366 18 545 25 857 34 263 18 742
Private practice Salaried Salarié – Secteur privé 13 988 12 363 11 205 8 806 10 496
Private in-house L’industrie / commerce 17 577 17 669 14 760 n/a n/a
Freelance Indépendant 11 952 15 222 14 652 13 534 12 791
Other Private Autres – Secteur privé 14 062 12 363 15 514 12 335 5 623
Local / central government Collectivité locale / gouvernement 10 546 12 363 13 446 14 802 14 994
Other Public Autre – secteur public 14 648 14 424 15 514 11 478 14 057
secTIon 2 - 94The ArchITecTurAl ProfessIon In euroPe 2016 / lA ProfessIon d’ArchITecTe en euroPe 2016
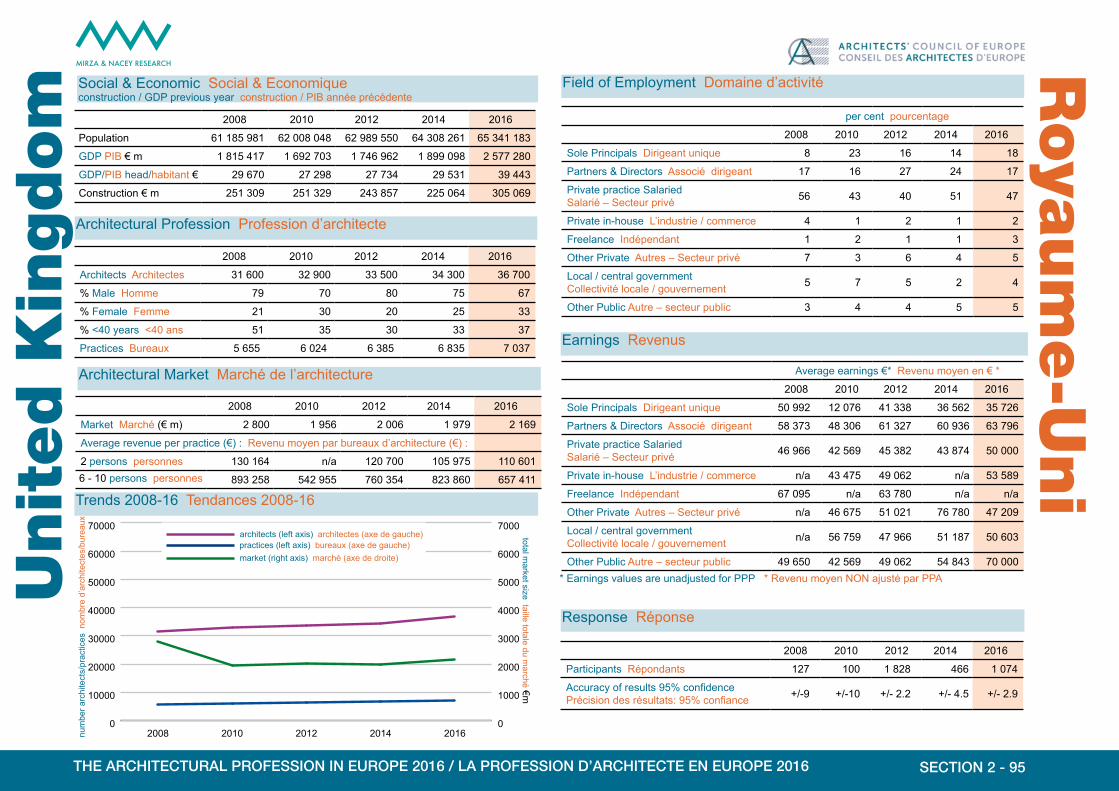
Mirza & Nacey Reserach LtdSouthdown HouseFord Lane, FordArundelWest SussexBN18 0DEUnited Kingdom
Telephone: +44 1243 555302email: [email protected]
MIRZA & NACEY RESEARCH
Registered office: Southdown House, Ford Lane, Ford, Arundel, West Sussex BN18 0DE. Registered in England and Wales. Company No. 04618115
Social & Economic Social & Economiqueconstruction / GDP previous year construction / PIB année précédente
Architectural Profession Profession d’architecte
Architectural Market Marché de l’architecture
Field of Employment Domaine d’activité
unit
ed k
ingdom 2008 2010 2012 2014 2016
Population 61 185 981 62 008 048 62 989 550 64 308 261 65 341 183
GDP PIB € m 1 815 417 1 692 703 1 746 962 1 899 098 2 577 280
GDP/PIB head/habitant € 29 670 27 298 27 734 29 531 39 443
Construction € m 251 309 251 329 243 857 225 064 305 069
2008 2010 2012 2014 2016
Architects Architectes 31 600 32 900 33 500 34 300 36 700
% Male Homme 79 70 80 75 67
% Female Femme 21 30 20 25 33
% <40 years <40 ans 51 35 30 33 37
Practices Bureaux 5 655 6 024 6 385 6 835 7 037
2008 2010 2012 2014 2016
Market Marché (€ m) 2 800 1 956 2 006 1 979 2 169
Average revenue per practice (€) : Revenu moyen par bureaux d’architecture (€) :
2 persons personnes 130 164 n/a 120 700 105 975 110 601 6 - 10 persons personnes 893 258 542 955 760 354 823 860 657 411
Trends 2008-16 Tendances 2008-16
Earnings Revenus
Response Réponse
2008 2010 2012 2014 2016
Participants Répondants 127 100 1 828 466 1 074
Accuracy of results 95% confidence Précision des résultats: 95% confiance +/-9 +/-10 +/- 2.2 +/- 4.5 +/- 2.9
0
10000
20000
30000
40000
50000
60000
70000
201620142012201020080
1000
2000
3000
4000
5000
6000
7000
num
ber a
rchi
tect
s/pr
actic
es n
ombr
e d’
arch
itect
es/b
urea
ux
total market size taille totale du m
arché €m
architects (left axis) architectes (axe de gauche) practices (left axis) bureaux (axe de gauche) market (right axis) marché (axe de droite)
roya
um
e-u
ni
* Earnings values are unadjusted for PPP * Revenu moyen NON ajusté par PPA
per cent pourcentage
2008 2010 2012 2014 2016
Sole Principals Dirigeant unique 8 23 16 14 18
Partners & Directors Associé dirigeant 17 16 27 24 17
Private practice Salaried Salarié – Secteur privé 56 43 40 51 47
Private in-house L’industrie / commerce 4 1 2 1 2
Freelance Indépendant 1 2 1 1 3
Other Private Autres – Secteur privé 7 3 6 4 5
Local / central government Collectivité locale / gouvernement 5 7 5 2 4
Other Public Autre – secteur public 3 4 4 5 5
Average earnings €* Revenu moyen en € *
2008 2010 2012 2014 2016
Sole Principals Dirigeant unique 50 992 12 076 41 338 36 562 35 726
Partners & Directors Associé dirigeant 58 373 48 306 61 327 60 936 63 796
Private practice Salaried Salarié – Secteur privé 46 966 42 569 45 382 43 874 50 000
Private in-house L’industrie / commerce n/a 43 475 49 062 n/a 53 589
Freelance Indépendant 67 095 n/a 63 780 n/a n/a
Other Private Autres – Secteur privé n/a 46 675 51 021 76 780 47 209
Local / central government Collectivité locale / gouvernement n/a 56 759 47 966 51 187 50 603
Other Public Autre – secteur public 49 650 42 569 49 062 54 843 70 000
secTIon 2 - 95The ArchITecTurAl ProfessIon In euroPe 2016 / lA ProfessIon d’ArchITecTe en euroPe 2016

Mirza & Nacey Reserach LtdSouthdown HouseFord Lane, FordArundelWest SussexBN18 0DEUnited Kingdom
Telephone: +44 1243 555302email: [email protected]
MIRZA & NACEY RESEARCH
Registered office: Southdown House, Ford Lane, Ford, Arundel, West Sussex BN18 0DE. Registered in England and Wales. Company No. 04618115
Appendix
I - 96The ArchITecTurAl ProfessIon In euroPe 2016

Mirza & Nacey Reserach LtdSouthdown HouseFord Lane, FordArundelWest SussexBN18 0DEUnited Kingdom
Telephone: +44 1243 555302email: [email protected]
MIRZA & NACEY RESEARCH
Registered office: Southdown House, Ford Lane, Ford, Arundel, West Sussex BN18 0DE. Registered in England and Wales. Company No. 04618115
A1 survey meThodology
respondents to Architects’ survey
respondents to Principals’ survey
total number of replies
total contacted by email
response rate % *
Austria 0 392 392 3 200 12.3Belgium 75 421 496 5 500 9.0Bulgaria 0 147 147 3 500 4.2Croatia 0 318 318 2 750 11.6Cyprus 5 54 59 n/a n/aCzech Republic 3 56 59 n/a n/aDenmark 333 126 459 5 829 7.9Estonia 0 55 55 280 19.6Finland 308 110 418 2 295 18.2France 303 715 1 018 20 828 4.9Germany 0 6 029 6 029 n/a n/aHungary 7 151 158 n/a n/aIreland 157 165 322 2 500 12.9Italy 6 689 5 879 12 568 117 600 10.7Lithuania 5 138 143 498 28.7Luxembourg 6 80 86 560 15.4Malta 34 11 45 857 5.3Netherlands 71 411 482 9 700 5.0Poland 139 62 201 n/a n/aPortugal 457 261 718 9 675 7.4Romania 13 26 39 800 4.9Slovakia 44 99 143 1 675 8.5Slovenia 38 73 111 1 255 8.8Spain 120 263 383 n/a n/aSweden 35 626 661 4 900 13.5Turkey 492 202 694 36 000 1.9
United Kingdom 658 416 1 074 n/a n/a
2016 EUROPE-27 9 992 17 286 27 278 230 202 11.8
TABLE A-1ON-LINE SURVEY RESPONSE
The 2016 Sector Study was commissioned by the Architects’ Council of Europe (ACE), the representative body for the architectural profession at European level, whose Members are the national representative and registration bodies of the profession in all EU Member States, Accession States, Norway and Switzerland. It repeats and updates the previous biennial Sector Studies, the first of which was in 2008. All 32 countries from which the ACE drew its membership at the time of the Study in 2016 were invited to participate and 27 countries took part.
It was with the direct cooperation of the Member Organisations of the ACE that it was possible to carry out the Study and the results obtained belong to them and to the ACE.
We are extremely grateful to the thousands of architects who participated in this survey. Most respondents completed all sections of the questionnaire, the huge number of respondents to this survey and the quality of the information provided ensures the results have statistical significance and allow us to build up a credible historical data series about the architectural profession in Europe.
* per cent response amongst those countries where total number contacted by email was known
I - 97The ArchITecTurAl ProfessIon In euroPe 2016
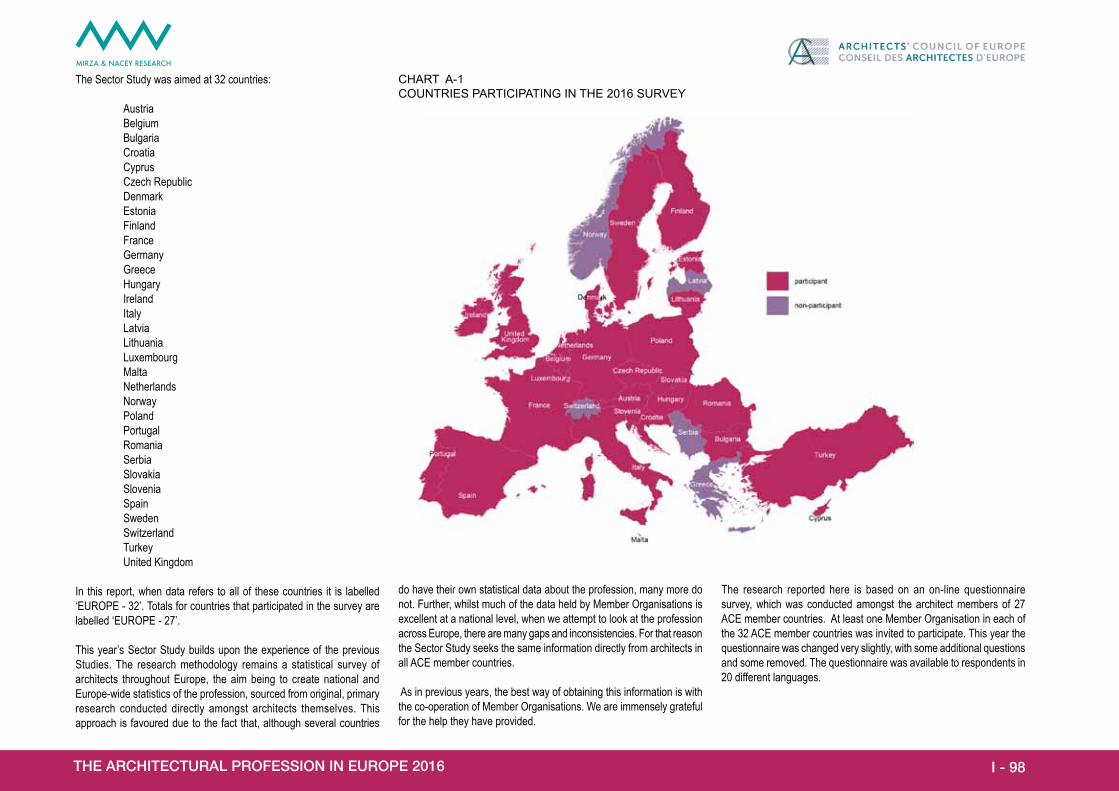
Mirza & Nacey Reserach LtdSouthdown HouseFord Lane, FordArundelWest SussexBN18 0DEUnited Kingdom
Telephone: +44 1243 555302email: [email protected]
MIRZA & NACEY RESEARCH
Registered office: Southdown House, Ford Lane, Ford, Arundel, West Sussex BN18 0DE. Registered in England and Wales. Company No. 04618115
The Sector Study was aimed at 32 countries:
Austria Belgium Bulgaria Croatia Cyprus Czech Republic Denmark Estonia Finland France Germany Greece Hungary Ireland Italy Latvia Lithuania Luxembourg Malta Netherlands Norway Poland Portugal Romania Serbia Slovakia Slovenia Spain Sweden Switzerland Turkey United Kingdom
In this report, when data refers to all of these countries it is labelled ‘EUROPE - 32’. Totals for countries that participated in the survey are labelled ‘EUROPE - 27’.
This year’s Sector Study builds upon the experience of the previous Studies. The research methodology remains a statistical survey of architects throughout Europe, the aim being to create national and Europe-wide statistics of the profession, sourced from original, primary research conducted directly amongst architects themselves. This approach is favoured due to the fact that, although several countries
CHART A-1COUNTRIES PARTICIPATING IN THE 2016 SURVEY
do have their own statistical data about the profession, many more do not. Further, whilst much of the data held by Member Organisations is excellent at a national level, when we attempt to look at the profession across Europe, there are many gaps and inconsistencies. For that reason the Sector Study seeks the same information directly from architects in all ACE member countries.
As in previous years, the best way of obtaining this information is with the co-operation of Member Organisations. We are immensely grateful for the help they have provided.
The research reported here is based on an on-line questionnaire survey, which was conducted amongst the architect members of 27 ACE member countries. At least one Member Organisation in each of the 32 ACE member countries was invited to participate. This year the questionnaire was changed very slightly, with some additional questions and some removed. The questionnaire was available to respondents in 20 different languages.
I - 98The ArchITecTurAl ProfessIon In euroPe 2016
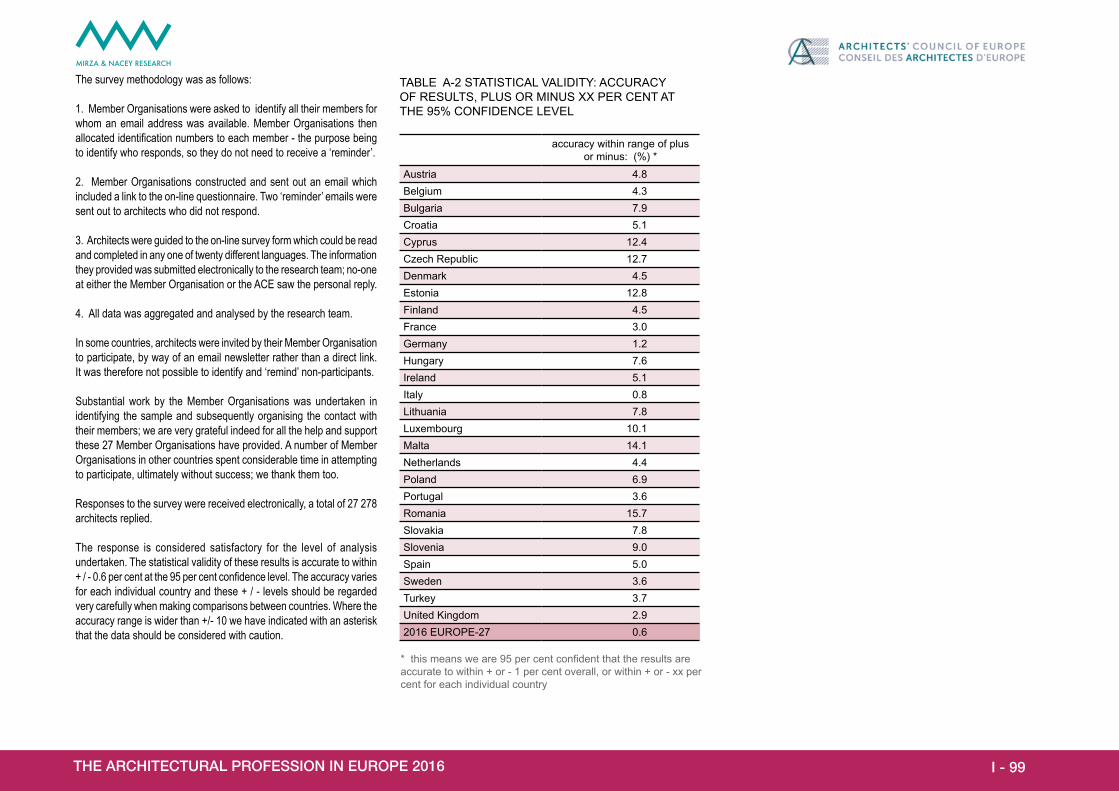
Mirza & Nacey Reserach LtdSouthdown HouseFord Lane, FordArundelWest SussexBN18 0DEUnited Kingdom
Telephone: +44 1243 555302email: [email protected]
MIRZA & NACEY RESEARCH
Registered office: Southdown House, Ford Lane, Ford, Arundel, West Sussex BN18 0DE. Registered in England and Wales. Company No. 04618115
The survey methodology was as follows:
1. Member Organisations were asked to identify all their members for whom an email address was available. Member Organisations then allocated identification numbers to each member - the purpose being to identify who responds, so they do not need to receive a ‘reminder’.
2. Member Organisations constructed and sent out an email which included a link to the on-line questionnaire. Two ‘reminder’ emails were sent out to architects who did not respond.
3. Architects were guided to the on-line survey form which could be read and completed in any one of twenty different languages. The information they provided was submitted electronically to the research team; no-one at either the Member Organisation or the ACE saw the personal reply.
4. All data was aggregated and analysed by the research team.
In some countries, architects were invited by their Member Organisation to participate, by way of an email newsletter rather than a direct link. It was therefore not possible to identify and ‘remind’ non-participants.
Substantial work by the Member Organisations was undertaken in identifying the sample and subsequently organising the contact with their members; we are very grateful indeed for all the help and support these 27 Member Organisations have provided. A number of Member Organisations in other countries spent considerable time in attempting to participate, ultimately without success; we thank them too.
Responses to the survey were received electronically, a total of 27 278 architects replied.
The response is considered satisfactory for the level of analysis undertaken. The statistical validity of these results is accurate to within + / - 0.6 per cent at the 95 per cent confidence level. The accuracy varies for each individual country and these + / - levels should be regarded very carefully when making comparisons between countries. Where the accuracy range is wider than +/- 10 we have indicated with an asterisk that the data should be considered with caution.
accuracy within range of plus or minus: (%) *
Austria 4.8Belgium 4.3Bulgaria 7.9Croatia 5.1Cyprus 12.4Czech Republic 12.7Denmark 4.5Estonia 12.8Finland 4.5France 3.0Germany 1.2Hungary 7.6Ireland 5.1Italy 0.8Lithuania 7.8Luxembourg 10.1Malta 14.1Netherlands 4.4Poland 6.9Portugal 3.6Romania 15.7Slovakia 7.8Slovenia 9.0Spain 5.0Sweden 3.6Turkey 3.7United Kingdom 2.92016 EUROPE-27 0.6
TABLE A-2 STATISTICAL VALIDITY: ACCURACY OF RESULTS, PLUS OR MINUS XX PER CENT AT THE 95% CONFIDENCE LEVEL
* this means we are 95 per cent confident that the results are accurate to within + or - 1 per cent overall, or within + or - xx per cent for each individual country
I - 99The ArchITecTurAl ProfessIon In euroPe 2016

Mirza & Nacey Reserach LtdSouthdown HouseFord Lane, FordArundelWest SussexBN18 0DEUnited Kingdom
Telephone: +44 1243 555302email: [email protected]
MIRZA & NACEY RESEARCH
Registered office: Southdown House, Ford Lane, Ford, Arundel, West Sussex BN18 0DE. Registered in England and Wales. Company No. 04618115
ArchitectsPersons who are recognised as Architects under the European Union Professional Qualifications Directive and professionally and academically qualified and generally registered / licensed / certified to practice architecture in the jurisdiction in which residing and who are responsible for advocating the fair and sustainable development, welfare, and cultural expression of society’s habitat in terms of space, forms and historical context.
Architectural studentsFull-time or part-time students following a recognised course of architectural studies leading to a qualification listed in Annexe V7 of the Qualifications Directive (2013/55/EC).
Architectural StaffComprises Principals, Partners & Directors; Associates: Architects; Technical staff.
Architectural PracticesThe form of structure through which architects practice the architectural profession. It includes sole principals, partnerships, and limited companies.
Sole PrincipalAn Architect, working independently, who provides a full range of architectural services to clients.
RevenueThe total income earned, through the provision of services, by an architectural practice in a tax year.
Not Economically ActiveNot engaged in the practice of architecture or any directly associated activity such as research or teaching. Includes architects who are retired and who are unemployed.
Freelance ArchitectAn architect who contracts his/her services to an architectural practice
A2 defInITIonsor organisation and does not accept commissions directly from clients.
Statistical DefinitionsConfidence LevelThe likelihood that the results are real and repeatable, and have not occurred randomly. If the Confidence Level is 50% then the results would be random. We select a Confidence Level of 95% which suggests if you repeat this exercise there is a 95% chance you will achieve similar results.
MeanA type of average, where individual data are added together and then divided by the number of pieces of data,
MedianA type of average calculated by placing all individual data in order of magnitude and selecting the middle value.
QuartileAn indication of the bottom or top quarter of the sample, calculated by placing all individual data in order of magnitude. The Lower Quartile is the value one quarter of the way up and the Upper Quartile is the value three quarters of the way up this list of data. We have marked countries where accuracy is greater than plus or minus 10 with an asterix, to denote caution when interpreting the findings. We generally avoid referring to these asterixed countries within the text commentary, although all countries are included in the charts and maps.
I - 100The ArchITecTurAl ProfessIon In euroPe 2016

Mirza & Nacey Reserach LtdSouthdown HouseFord Lane, FordArundelWest SussexBN18 0DEUnited Kingdom
Telephone: +44 1243 555302email: [email protected]
MIRZA & NACEY RESEARCH
Registered office: Southdown House, Ford Lane, Ford, Arundel, West Sussex BN18 0DE. Registered in England and Wales. Company No. 04618115
A3 meThodologIcAl noTes1. Method for weighting the ‘All’ figureThe ‘EUROPE-27’ figure in several profiling tables in chapter 1 is weighted to reflect the total architectural population in all countries surveyed.
For each country individually, we take the percentage breakdown from the on-line survey (e.g. per cent male and per cent female) and apply those proportions to the total number of architects in each country. This gives us the number of male architects and female architects in each country. These individual country male and female figures are then summed to provide the weighted total number (‘All’) of male architects and total number of female architects. Finally, the total number of males and females is expressed as a percentage of the total number of Architects.
2. Cautionary note: employment status It is possible there has been an under-reporting of retired architects. The raw survey data suggests 2 per cent of the profession is ‘retired’. Experience in undertaking a regular survey of architects in the UK suggests retired architects are less likely to participate in on-line surveys. Whilst the survey was conducted amongst all members of participating institutes, including retired people, it is likely that retired people may not have felt the survey was relevant to them and declined to participate. It is also conceivable that the demographics of email addressees held are such that fewer retired architects may have provided their email address to their institute in the first place, so any mailing based on email address alone may not have picked up sufficient numbers of retired architects. For these reasons we suspect the ‘not economically active’ figure is an under-estimate.
3. Description of the Model created to estimate the number of architectural practices.(i) identify the number of economically active architects in each country – see item 2(ii) estimate the number of economically active architects who are in private practice: source - survey results(iii) estimate the number of architects working in each private practice size group and country: source - survey results
(iv) calculate the average number of architects per practice by size group for each country: source - survey results(v) estimate the number of practices that each number of architects represents in each size group and country: source - survey resultse.g. if we have 300 architects working in the 3-5 size group for a given country and, from survey data, we know that, on average, 4 architects work in those practices we can estimate that there are 75 practices in this size group ie 300 architects working in practices comprising 4 architects gives us 75 practices.(vi) adding the number of practices in each size group gives the total number of practices per country
4. Description of method used to calculate size of architectural market(i) use the estimates of the number of practices in each size group (see note 4 above)(ii) multiply the number of practices by the average turnover for practices in that size group - repeat separately for each size group and each country(iii) each country’s market size is calculated by adding together the values for each size group(iv) very occasionally the data is refined with reference to previous years’ data
5. Minimum cell sizesThe minimum number of responses used in each ‘cell’ (a segment of a statistical table) is generally 10. For the smaller countries a minimum cell size of 5 is applied, and in exceptional cases this is extended to 4 where the variance is low.
I - 101The ArchITecTurAl ProfessIon In euroPe 2016