3d landscape recording and modeling of individual trees
TRANSCRIPT
3D Landscape Recording and Modeling of Individual Trees
Shafarina Wahyu Trisyanti, Deni Suwardhi*, Agung Budi Harto
Department of Geodesy and Geomatics Engineering, Faculty of Earth Sciences and Technology, Institut Teknologi Bandung, Bandung, Indonesia
1. Introduction
Urban mapping and planning are the important things for urban development, especially for the planner. The planner needs a model of existing environment to help represent the environment before and after planning process. Three-dimensional (3D) city model is a representation of an urban environment with a three-dimensional geometry of common urban objects and structures, with building as the most prominent feature (Biljecki et al. 2015). Currently, 3D city modeling is more focused on the representation of the building. Whereas the definition of “city” include the non-building structure, such as elevation, vegetation, and water bodies (Kolbe and Bacharach 2006). The thematic feature to be modeled in this research is vegetation. Vegetation was important to be modeled for some discipline because it can help for a visualization and analysis tools, especially for simulation of urban planning,
such as for urban greening, water conservation, and flood prevention. Besides that, the use of existing vegetation is also important in decision making and urban landscape planning because it connects important urban subjects and nature conservation strategies (Breuste 2004). This research only modeled the individual tree (solitary vegetation object in OGC CityGML, 2012) in the campus area of Institut Teknologi Bandung (ITB) Jatinangor, Bandung. The aim of this research are to map the existing vegetation and to model the individual trees in Level of Detail (LoD) 1, 2, and 3, that can be used for planner or landscape architecture. This research also provides the concept of 3D vegetation modeling in LoD 4. Based on the literature research, there are several methods that can be used for recording the vegetation, those are aerial mapping, terrestrial mapping, and hybrid (combining aerial and terrestrial). One of the research on tree mapping using aerial photography is Calculation of Tree Height and Canopy Crown from Drone Images Using Segmentation (Lim et al. 2015). The used data in that research are Digital Terrain
ABSTRACT
The 3D city/landscape model is digital representation of real environment that can be used for planner or landscape architecture in urban development planning. That model’s more focused on building, whereas vegetation model’s also needed for urban planning simulation. This research purposes are to map existing vegetation and to generate individual trees model in some level of details. The research area is campus of ITB Jatinangor and the used data are orthophoto and DSM from UAV-Photogrammetry technology. Manual segmentation, classification, and NDSM generation process can provide tree information (position, crown diameter, species, height)-as 3D vegetation modeling input. It’s also necessary to provide classification, information, detail level, and visualization of vegetation model according to landscape architecture analysis needs. This research results are 3D vegetation models in LoD 1-3 with differents information based on appearance, geometry, semantic, and topology aspects of CityGML. Models then tested qualitatively based on visualization and sun shadow analysis. For visualization, the used data only able to generate LoD 1 and 2 vegetation model and the minimum LoD required for sun shadow analysis is LoD 2. Terrestrial data, which provide the real form and size of each tree part, is needed to generate LoD 3 vegetation model.
ARTICLE INFO
Article history:Received February 10, 2017Received in revised form September 15, 2018Accepted February 2, 2019
KEYWORDS:classification, DSM, 3D model, nDSM, orthophoto, segmentation, vegetation
* Corresponding Author E-mail Address: [email protected]
Copyright ©2019 Institut Pertanian Bogor
Vol. 26 No. 4, October 2019 185-195DOI:10.4308/hjb.26.4.185
ISSN: 1978-3019EISSN: 2086-4094
H A Y AT IJournal of Biosciences

Model (DTM) already available, Digital Surface Model (DSM) and orthophoto from aerial photography using drone. In Lim et al. (2015), Normalized Digital Surface Model (nDSM) was generated and then combined with orthophoto for doing segmentation. The result of the segmentation is used to estimate the parameter of each tree (tree position, tree height, and crown diameter). One of the research on vegetation mapping using terrestrial method is Terrestrial Laser Scanning for Vegetation Sampling (Richardson et al. 2014). This research using Terrestrial Laser Scanner (TLS) at Starkey Experimental Forest and Range and obtain the point cloud. Then the precise measurements are made for the spatial configuration of vegetation based on vegetation density and patchiness. The disadvantages of vegetation mapping using TLS are not yet applicable in areas with high slope so that they can affect point density. The research for hybrid method is Forest Stand Inventory Based on Combined Aerial and Terrestrial Close-Range Photogrammetry (Mikita et al. 2016). The research using photogrammetry method produce photographs which are then processed into a dense cloud of ground and non-ground. With the dense cloud is then done automatic identification of tree position and automatic detection of tree height and diameter of the branch. In this research, the used method was aerial mapping using Unmanned Aircraft Vehicle (UAV)-Photogrammetry technology because the area is not too wide, it’s only about 47 hectare. The data that can be obtained from UAV-Photogrammetry are DSM and orthophoto. From the results of the mapping will be generated data which will then be modeled based on the visualization needs of each object, using City Geographic Markup Language (CityGML) as the exchange file for 3D city model. CityGML is an open data model and Extensible Markup Language (XML)-based format for the storage and exchange of virtual 3D city models (OGC Member 2012). One of the CityGML characteristics is multi-scale modeling, which distinguishes object’s level of detail. CityGML also defines classes and relationships for topographic objects that are related to the city or region model with regard to geometric, topology, semantics, and their properties.
2. Materials and Methods
2.1. DataThis research is mapping the vegetation in the
campus area of ITB-Jatinangor, which located at Jalan Let. Jend. Purn. Dr. (HC) Mashudi No. 1, Sayang,
Jatinangor, Kabupaten Sumedang, Jawa Barat. The area of research is about 47 hectare, stretches from north to south with the highest level of terrain is on the north side. Most of the area is still covered with vegetation, it has an arboretum and two lakes. Arboretum is an open space in ITB Jatinangor area, like a miniature of forest, planted at least 2,000 trees of various varieties (Nursyifa 2015). Arboretum area has a role as a means of genetic conservation, giving aesthetic value, shade, land Forestry Engineering lab for research programs, and as a condition of green open land area with 60% ratio from an area in accordance with master plan of ITB.
The used data for this research are generated by survey and mapping using Unmanned Aircraft Vehicle (UAV) Photogrammetry technology. The data acquisition was carried out in December 2016 by the team using fixed-wing UAV with Sony α6000 Mirrorless Digital Camera ILCE (Firdaus 2017). The process in the mapping using UAV Photogrammetry are determining the flight plan, control point planning, and aerial photo capturing. UAV generates images which are then processed using the Agisoft Photoscan software by performing image matching and bundle adjustment. The results are orthophoto and DSM with the horizontal resolution of 11.6 cm and the vertical resolution of 19.3 cm, shown in Figure 1. For 3D city modeling, this research was also using a 3D model for building and terrain campus area of ITB-Jatinangor from LoD 1-2. That 3D model of building and terrain was generated in research of Implementasi Citygml Menggunakan Produk UAV-Fotogrametri (Prameshwari 2017).
2.2. MethodsThe used methods for 3D recording and modeling
in this research shown in Figure 2.From the Figure 3, the first process in this research
is segmentation. Information about tree position and crown diameter were obtained by manual segmentation using orthophoto. Some operators doing manual digitation for individual trees by adding points of tree position and circle polygons for estimation of crown diameter. The result of this digitation is vector data for 3,050 individual trees on the campus of ITB-Jatinangor. The example for the segmentation results shown in Figure 3a.
To create the 3D model of vegetation, it is necessary to obtain also the height of each tree. The data from UAV-Photogrammetry obtained only DSM and orthophotos. Therefore, Digital Terrain Model (DTM) should be generated by filtering the DSM. The aim of filtering is to get the ground surface (bare earth) without any object on it. This process is using SAGA
186 Trisyanti SW et al.

HAYATI J Biosci 51Vol. 26 No. 2, March 2019
software with the slope-based method. The method described by Vosselman (2000) and is based on the assumption that a large height difference between two nearby cells is unlikely to be caused by a steep
slope in the terrain. Then normalized digital surface model (NDSM) was generated by subtracting DTM from DSM by the raster overlaying method.
After the tree position, crown diameter, and tree height were obtained, it should also be known about the type or species of each tree. In this research, the classification of vegetation species is using a manual method, by looking at orthophoto. Tree position and estimation of crown diameter already obtained by the segmentation process and were added to attributes table for tree objects. Then, the classification of trees is based on the appearance of the tree view from the top, i.e. the shape of the crown and the distribution of the trunk seen in the orthophoto. Each of the tree species was added to attributes table for tree objects to the column ‘jenis’, shown in Figure 3b.
After getting all the necessary data, then the modeling process begins. The first step in modeling process is making template model for each tree species. Vegetation objects were modeled using SketchUp software for LoD 1-3 and following the form of the real object, but in simple geometry. The model was saved as Collada file and then converted to CityGML file (.gml) using Feature Manipulation Engine (FME) Quick Translator software. In this research, the GML geometric primitive of models must be the MultiSurface, to be viewable using LandXplorer CityGML Viewer software. Second, adding the template of vegetation model into the 3D model for terrain and building of ITB-Jatinangor campus. To make the process easier, create a program in Matlab for adding the tree models into the terrain model according to coordinates of tree position. That program includes transformation matrix for each tree. CityGML data structure for vegetation model (LoD 1 and 2) based on OGC CityGML (2012) shown in Figure 4.
Vegetation model (LoD 1 and 2) on CityGML using concept of implicit geometry for space eficiency. Implicit geometry is a geometry object, where the shape is stored only once as a template that can be reused many times. Implicit geometry has reference point and a transformation matrix (scaling, rotation, local translation) for projecting the model. In CityGML, vegetation’s attributes for LoD 1 and 2 are class, function, species, height, trunk diameter, and crown diameter. Implicit geometry for vegetation has two important things, Geometry and Implicit Representation. Typically, the shape of the geometry is defined in a local coordinate system where the
80540000000 00
9232
40000
000
00
9232
40000
000
00
9232
80000
000
00
9232
80000
000
00
9233
20000
000
00
9233
20000
000
00
9233
60000
000
00
9233
60000
000
00
9233
80000
000
00
9233
80000
000
00
80540000000 00
80580000000 00
80580000000 00
80620000000 00
80620000000 00
80660000000 00
80660000000 00
000
100 200 400 600 800 1000Meters
706727747768789810830
(b)
0 100
80540000000 00
9232
40000
000
00
9232
40000
000
00
9232
80000
000
00
9232
80000
000
00
9233
20000
000
00
9233
20000
000
00
9233
60000
000
00
9233
60000
000
00
9233
80000
000
00
9233
80000
000
00
80540000000 00
80580000000 00
80580000000 00
80620000000 00
80620000000 00
80660000000 00
80660000000 00
200 400 600 800 1,000Meters
(a)
Figure 1. (a) Orthophoto and (b) DSM of ITB Jatinangor campus
HAYATI J Biosci 187Vol. 26 No. 4, October 2019

origin lies within or near to the object’s extent. Implicit representation of 3D object geometry represents the objects using absolute world coordinates (OGC Member 2012).
3. Results
3.1. Needs of Landscape Architecture3.1.1. Tree Classification
The classification of vegetation species refers to the classification of solitary vegetation objects in OGC CityGML (2012) and vegetation classification based on Wahyuni and Qomarun (2013). OGC CityGML only provides the code for the type of vegetation and the
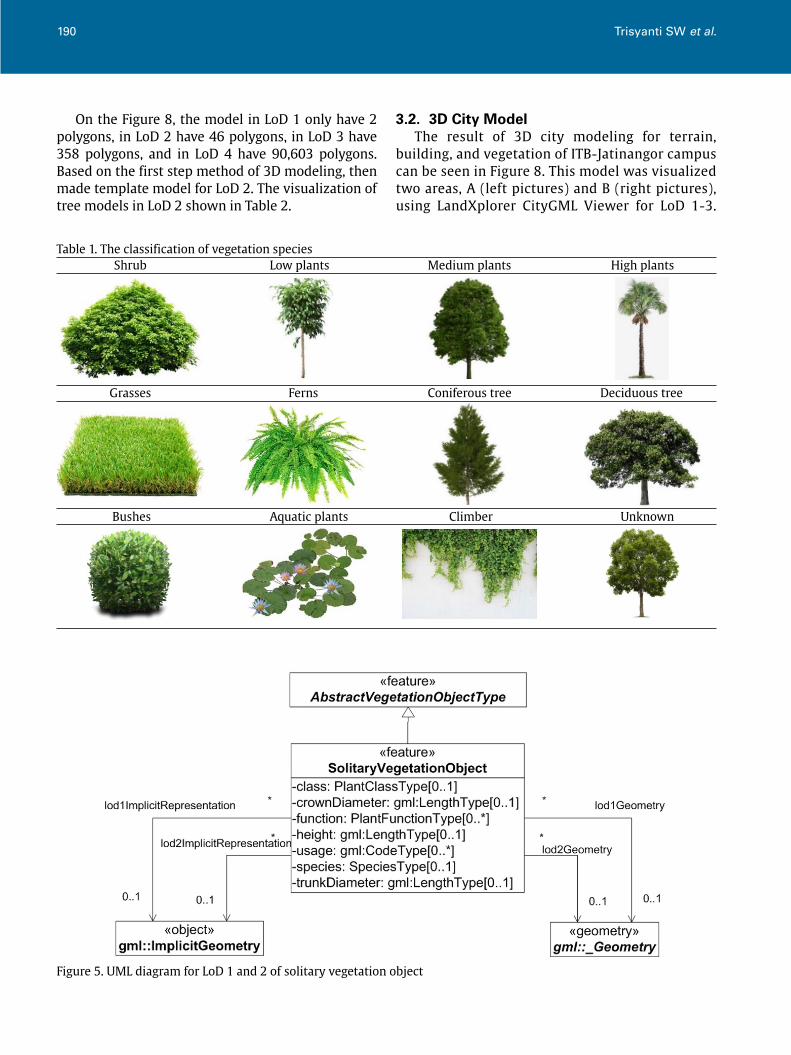
details of each type of vegetation are described in the vegetation classification according to Wahyuni and Qomarun. Then the analysis of those two types of classification are performed and can be seen in Appendix A. The classification of vegetation types made based on OGC CityGML and Wahyuni and Qomarun can be seen in Table 1. Vegetation can be classified into 12 species based on the height, the crown’s shape, the trunk’s shape, the function, and the habitat of vegetation.
3.1.2. InformationBased on the needs of architecture landscape to
mapping the existing object and planning, each level
Literature study
Manual segmentation
Tree position and crown diameter
3D City/landscape model
Needs for landscape architecture and urban planning
Fitting model (classification, information,
LoD, visualization)
DSM
_
nDSM
DTM
Orthophoto
Modeling
Classification
Tree heightTree species
Calculation height
Filtering
Figure 2. Research method
Figure 3. (a) Tree segmentation and (b) table attributes of tree for ITB Jatinangor
188 Trisyanti SW et al.

of detail has some difference of information needs. From the interview with a landscape architect, the different of each level of detail are based on the area to be mapped. The information for each level of detail based on the needs of architecture landscape is:
1. For master plan (>50 hectare), the information needed are the tree position and crown diameter.
2. For site plan (<50 hectare), the information needed are the tree position, crown diameter, and the tree height. The tree height is needed for dividing the small and big tree.
3. For planning the small area, such as a pedestrian or park, the information needed are the tree position, crown diameter, tree height, and tree species. For more detailed information, the height of tree parts are needed.
3.1.3. Level of DetailsLevel of details for 3D models of individual trees
are divided into:1. LoD 1. This level only gives appearance
information, because of it have only two polygons with texture. The geometry of this model was saved as ImplicitGeometry or Geometry in CityGML.
2. LoD 2. This level provides information about appearance and geometry. In this level, the form of the 3D model is following the real geometry of
an object, but in a simple form. The UML diagram for LoD 1 and LoD 2 can be seen in Figure 5.
3. LoD 3. In this level, the 3D model of the tree already has the semantic information, i.e. root, trunk, and crown. The semantic information is following the hierarchy level of the tree. The XML file for tree model in LoD 3 can be seen in Appendix B and the UML diagram in Figure 6.
4. LoD 4 (concept). The highest level gives all of the information aspects of the 3D model, there are appearance, geometry, semantic, and topology. The topological aspect of the model is a relationship between each part of the tree. The relation can be seen on UML diagram in Figure 7.
3.1.4. Visualization Visualization of vegetation models are different depend on the level of details. Example for the tree model in LoD 1-4 shown in Figure 8. For LoD 1, trees are modeled in two intersecting polygons 90°. Models in LoD 2 and 3 are made to follow the real tree geometry, but models in LoD 3 are more detail than models in LoD 2. It makes the models of LoD 3 have more polygons than LoD 2. And for the concept of LoD 4, it must have the closest geometry with the real objects. All of the tree parts must be visualized as same as the real objects.
Figure 4. CityGML data structure for vegetation model LoD 1 and 2 in XSD
HAYATI J Biosci 189Vol. 26 No. 4, October 2019
On the Figure 8, the model in LoD 1 only have 2 polygons, in LoD 2 have 46 polygons, in LoD 3 have 358 polygons, and in LoD 4 have 90,603 polygons. Based on the first step method of 3D modeling, then made template model for LoD 2. The visualization of tree models in LoD 2 shown in Table 2.
3.2. 3D City Model The result of 3D city modeling for terrain, building, and vegetation of ITB-Jatinangor campus can be seen in Figure 8. This model was visualized two areas, A (left pictures) and B (right pictures), using LandXplorer CityGML Viewer for LoD 1-3.
Figure 5. UML diagram for LoD 1 and 2 of solitary vegetation object
Shrub
Grasses
Bushes
Low plants
Ferns
Aquatic plants
Medium plants
Coniferous tree
Climber
High plants
Deciduous tree
Unknown
Table 1. The classification of vegetation species
190 Trisyanti SW et al.
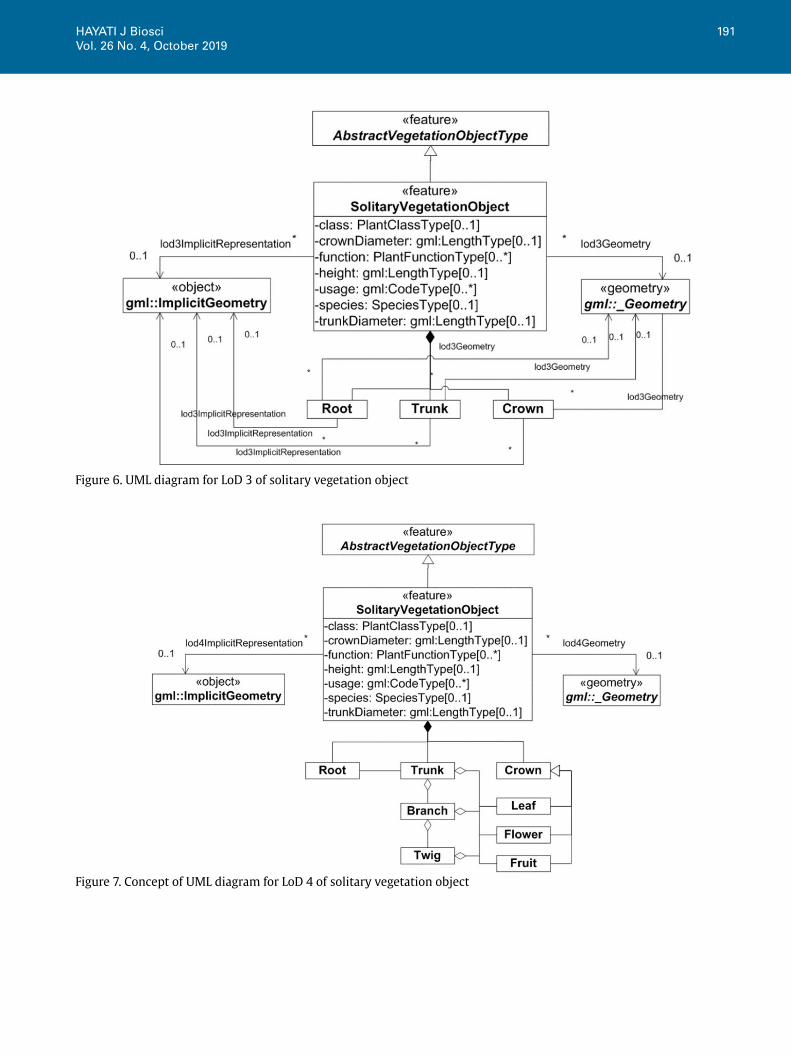
Figure 7. Concept of UML diagram for LoD 4 of solitary vegetation object
Figure 6. UML diagram for LoD 3 of solitary vegetation object
HAYATI J Biosci 191Vol. 26 No. 4, October 2019
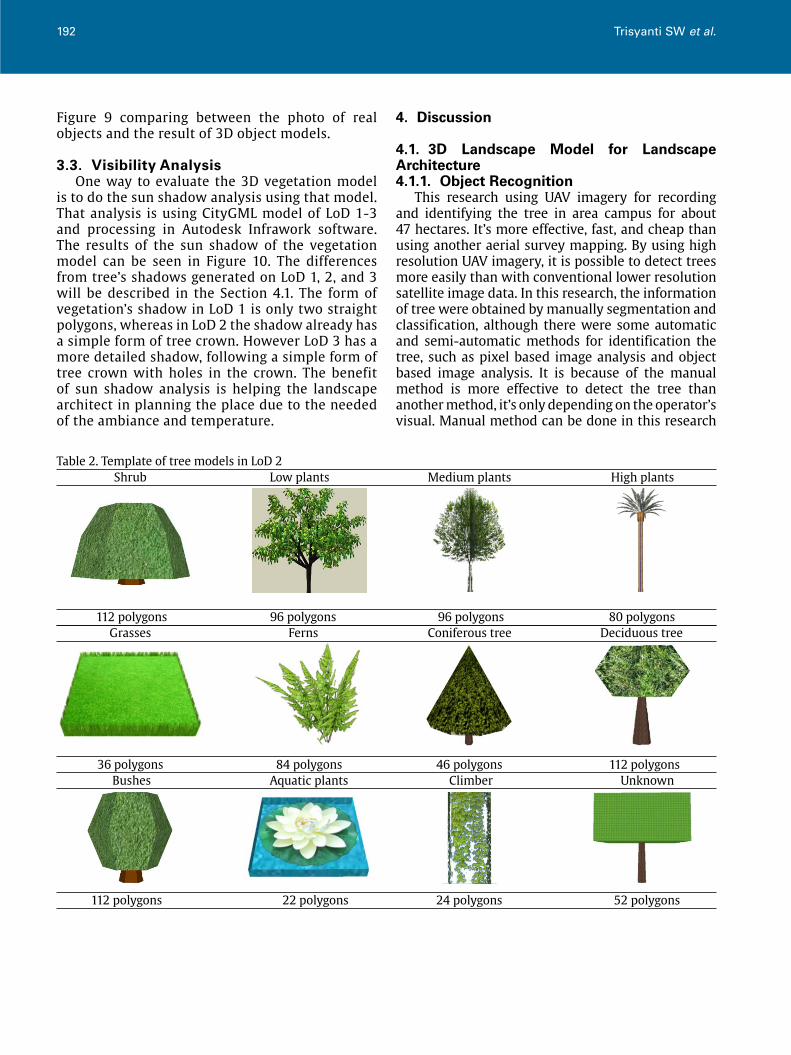
Figure 9 comparing between the photo of real objects and the result of 3D object models.
3.3. Visibility Analysis One way to evaluate the 3D vegetation model is to do the sun shadow analysis using that model. That analysis is using CityGML model of LoD 1-3 and processing in Autodesk Infrawork software. The results of the sun shadow of the vegetation model can be seen in Figure 10. The differences from tree’s shadows generated on LoD 1, 2, and 3 will be described in the Section 4.1. The form of vegetation’s shadow in LoD 1 is only two straight polygons, whereas in LoD 2 the shadow already has a simple form of tree crown. However LoD 3 has a more detailed shadow, following a simple form of tree crown with holes in the crown. The benefit of sun shadow analysis is helping the landscape architect in planning the place due to the needed of the ambiance and temperature.
4. Discussion
4.1. 3D Landscape Model for Landscape Architecture4.1.1. Object Recognition This research using UAV imagery for recording and identifying the tree in area campus for about 47 hectares. It’s more effective, fast, and cheap than using another aerial survey mapping. By using high resolution UAV imagery, it is possible to detect trees more easily than with conventional lower resolution satellite image data. In this research, the information of tree were obtained by manually segmentation and classification, although there were some automatic and semi-automatic methods for identification the tree, such as pixel based image analysis and object based image analysis. It is because of the manual method is more effective to detect the tree than another method, it’s only depending on the operator’s visual. Manual method can be done in this research
Shrub
Grasses112 polygons
Bushes36 polygons
112 polygons
Low plants
Ferns96 polygons
Aquatic plants84 polygons
22 polygons
Medium plants
Coniferous tree96 polygons
Climber46 polygons
24 polygons
High plants
Deciduous tree80 polygons
Unknown112 polygons
52 polygons
Table 2. Template of tree models in LoD 2
192 Trisyanti SW et al.

because of the area only about 47 hectares. But in the future, semi-automated and automated methods should be developed to facilitate the modeling of tree for the wider area than campus area.
4.1.2. 3D Modeling 3D model for vegetation in this research has divided into three levels of detail (LoD), for LoD 1-3. Based on the 3D city modeling result for LoD 1-3 in Figure 9, visualization of LoD 3 is more informative and more interesting than the lower level. But the data size is bigger than other lower level because the model has more polygons. The visualization of LoD 1 more interesting than LoD 2, but the geometry of LoD 2 closer to the real object than LoD 1. Besides that, the form of some vegetation models didn’t close to the real object because of the human error when classification process. That is one of the lack using the manual method for classifying the tree species from orthophoto.
4.1.3. Sun Shadow Analysis From the Figure 10, the tree shadow in LoD 1, 2, and 3 can be compared to the geometry. The tree shadow in LoD 1 didn’t like the real tree shadow, which is because it’s only formed by two intersecting
polygons. The tree shadow in LoD 2 is better than LoD 1, it follows the simple geometry of the real object and massive. And the model of LoD gives the best shadow geometry than other lower level, closest to the real object shadow. It’s not massive, there’s some little hole, indicating that some of the sunlight can penetrate the crown of the tree. The shape of the tree shadow will correspond to the geometrical shape of the tree model. Therefore, the more detailed form of the tree model, then the more real shadow is produced. For the purposes of the landscape architect in planning the ambiance and temperature of a place then required a good level of detail, in this research is LoD 3. The example of using tree shadow in urban design are to determine the location of sitting area, pedestrian, an opening in the building.
5. Conclusion
Based on the research that has been done, this research generated 3D vegetation model in LoD 1, 2, and 3. The 3D vegetation model in LoD 1 only needs the tree height and crown diameter, LoD 2 needs the tree height, crown diameter, and the tree species. Model in LoD 3 requires tree height, crown diameter, tree species, and tree parts (branch, crown, and root).
HAYATI J Biosci 193Vol. 26 No. 4, October 2019
a
e
c
g
d
h
b
fFigure 8. 3D models for coniferous tree in (a) LoD 1, (b) LoD 2, (c) LoD 3, and (d) LoD 4 (concept). 3D models with texture
in (e) LoD 1, (f) LoD 2, (g) LoD 3, and (h) LoD 4
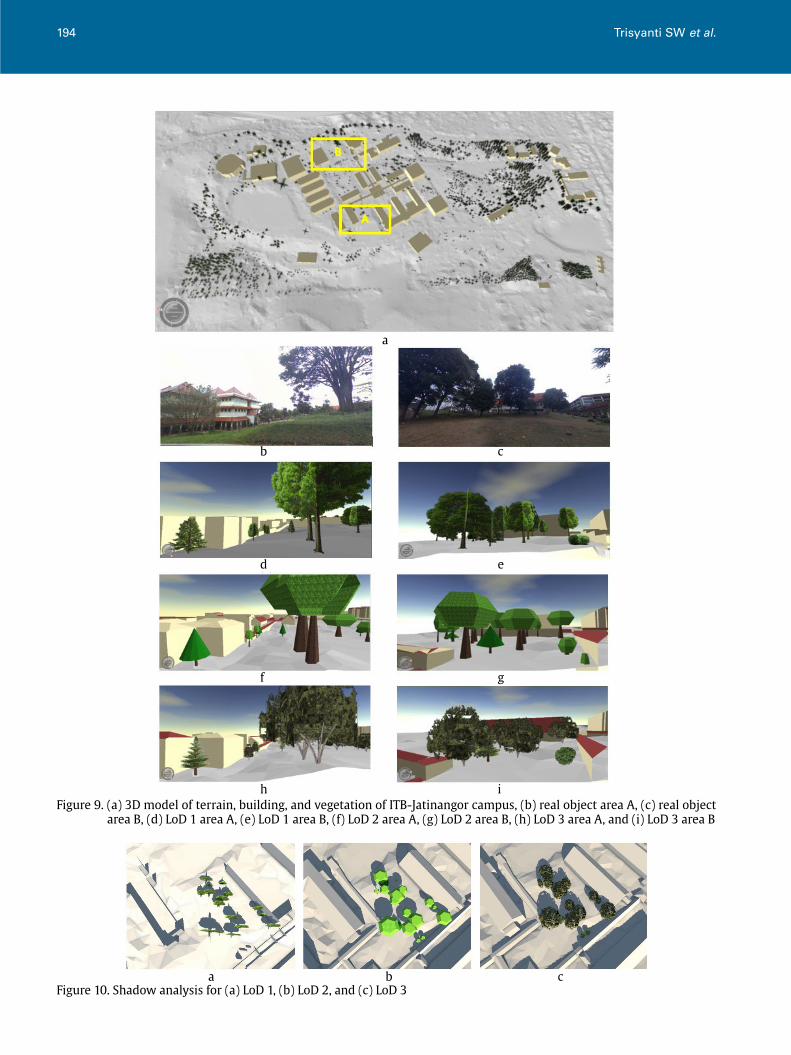
Figure 9. (a) 3D model of terrain, building, and vegetation of ITB-Jatinangor campus, (b) real object area A, (c) real object area B, (d) LoD 1 area A, (e) LoD 1 area B, (f) LoD 2 area A, (g) LoD 2 area B, (h) LoD 3 area A, and (i) LoD 3 area B
a
b
d
f
h
c
e
g
i
Figure 10. Shadow analysis for (a) LoD 1, (b) LoD 2, and (c) LoD 3a b c
194 Trisyanti SW et al.

For the model in LoD 4 required height of tree, crown diameter, tree type, tree parts, and relationships between the tree parts. Based on the information needed for each of LoD, the orthophoto and DSM only can be modeled the vegetation in LoD 1 and 2 because the model in LoD 3 was needed the real form and size of each part of the tree. For appearance, texture is the important thing in 3D vegetation model especially for LoD 1. The minimum LoD that can be used for sun shadow analysis is LoD 2 which has geometric information.
5.1. Future Work For the future works, the concept of LoD 4 of the 3D tree model needs to be developed, so the model fits the real object. Besides that, the terrestrial mapping is also needed to provide the more detail information about trees. For the methods, semi-automated or even automated methods should be developed to facilitate the modeling. Another analysis is also required using the 3D vegetation model in order to provide more evaluation of the 3D tree model. In the future, it must be some research about the database for saving the 3D models.
References
Biljecki F et al. 2015. Applications of 3D city models: state of the art review. International Journal of Geo-Information 4:2842-2889.
Breuste JH. 2004. Decision making, planning, and design for the conservation of indigenous vegetation within urban development. Landscape and Urban Planning 68:439-452.
Firdaus A. 2017. Evaluasi Pemanfaatan Titik Kontrol Udara Menggunakan Pengamatan GNSS Teliti pada Teknik Pemetaan UAV-Fotogrametri. Bandung: Institut Teknologi Bandung.
Kolbe T, Bacharach S. 2006. CityGML: An Open Standard for 3D City. Available at: https://www.directionsmag.com/article/2898 [Data accessed: 29 September 2017]
Lim Y et al. 2015. Calculation of tree height and canopy crown from drone images using segmentation. Journal of the Korean Society of Surveying Geodesy Photogrammetry and Cartography 33:605-613.
Mikita T et al. 2016. Forest stand inventory based on combined aerial and terrestrial close-range photogrammetry. MDPI 7:1-14.
Nursyifa C. 2015. Arboretum ITB: Hutan Koleksi dan Konservasi Kampus ITB Jatinangor. Available at: https://www.itb.ac.id/ [Data accessed: 23 September 2017]
OGC Member. 2012. OGC standard. (Gröger G, Kolbe TH, Nagel C, Häfele KH (Eds.). Available at: http://www.opengeospatial.org [Data Accessed: 17 September 2015]
Prameshwari I. 2017. Implementasi CityGML Menggunakan Produk UAV-Fotogrametri. Bandung: Institut Teknologi Bandung.
Richardson JJ et al. 2014. Terrestrial laser scanning for vegetation sampling. Sensors 14:20304-20319. DOI:10.3390/s141120304
Vosselman G. 2000. Slope Based Filtering of Laser Altimetry Data. XXXIII. Amsterdam: IAPRS.
Wahyuni E, Qomarun. 2013. Identifikasi lansekap elemen softscape dan hardscape pada Taman Balekambang Solo. Sinektika 13:114-124.
HAYATI J Biosci 195Vol. 26 No. 4, October 2019