3d geomodeling of the lower cretaceous oil reservoir, masila oil field, yemen
TRANSCRIPT

ORIGINAL PAPER
3D geomodeling of the Lower Cretaceous oil reservoir,Masila oil field, Yemen
Hassan S. Naji & Mohammed Khalil Khalil
Received: 29 January 2010 /Accepted: 19 October 2010 /Published online: 16 November 2010# Saudi Society for Geosciences 2010
Abstract Oil was first discovered in the Masila area ofYemen in the late 1990s, with about 90% of the reservesfound in the Lower Qishn Clastic Member of the QishnFormation. The porosity determinations of the LowerQishn Clastic are relatively high and the permeabilityranges from 103 to 374 md. This paper tries to evaluatethe hydrocarbons in the porous zones encountered in theLower Cretaceous formations, which were penetrated bythe eight wells in the study area. The water saturationshows low values, while the hydrocarbon saturation is ina reverse relation, i.e., the hydrocarbon increases wherethe water saturation decreases. Different cross-plots suchas Rho-PHIN, Rho-DTN, and M-N were used inlithological identification for the two studied formations(Saar and Qishn) in the studied wells. Formationevaluation and presentation forms of the obtainedpetrophysical parameters have frequently proven thatthe formations have high hydrocarbon saturation in thisarea and contain many pay zones. On of the main targetsof this paper is to build a detailed 3D geologicalmodeling of the Lower Cretaceous Sequence conductedthrough an integrated study.
Keywords 3D geomodeling . Oil potentialities . LowerCretaceous . Oil pay zone . History matching
Introduction
Oil was first discovered in the Masila area (Fig. 1) in thelate 1990s, with commerciality being declared in late 1991and oil production commenced in July 1993. By the end ofDecember 1999, the total known oil-in-place exceeds 1.6billion stock tank barrels (STB), with proven ultimaterecoverable oil reserves approaching 900 million STB. TheQishn Formation was deposited as predominantly post-riftsediments in the east/west-oriented Say’un–al Masila riftbasin that initiated during Late Jurassic to Early Cretaceousas part of the second Mesozoic rift phase. Deposition wasrelated to a regional east to west transgression overlying aregional lower Cretaceous unconformity at the top of theSa’af Member. Regionally, the Qishn Formation wasdeposited on an inner neritic to shallow-marine platformsetting within the graben. During deposition of the QishnFormation, the Say’un–Masila Basin was open to fullymarine waters based on the presence of correlativecarbonate strata toward the southeast at Socotra Island inthe Gulf of Aden. Carbonates intertongue with fluvialdeltaic to littoral deposits, becoming fully siliciclasticwestwards. The Barremian to Aptian age range for theQishn Formation was confirmed by samples analyzed in1994. The Qishn Formation is likely to be equivalent to thelower fluviatile sandstones of the Tawilah Group of westernYemen, and to the east, it becomes more carbonate-rich andpasses into the purer carbonate facies of the Mahra Group(Fig. 2b). In the Masila area, the Lower Cretaceous sequenceis divided, from base to top, into Saar and Qishn Formations.
The integration of geological and geophysical data leadsto better reservoir characterization (Naji and Khalil 2010;Khalil and Naji 2010; Greenwood 1967; Greenwood andBleackley 1967; Naji 2010; Naji et al. 2010a, b).
H. S. Naji :M. K. Khalil (*)Department of Petroleum Geology and Sedimentology, Faculty ofEarth Sciences, King Abdelaziz University,Jeddah, Saudi Arabiae-mail: [email protected]
H. S. Najie-mail: [email protected]
Arab J Geosci (2012) 5:723–746DOI 10.1007/s12517-010-0226-y

Stratigraphic setting
Figure 2a (Canadian Oxy Company 2003) shows thegeneral stratigraphy of the study area, from oldest toyoungest, as follows.
Precambrian
The upper part of basement of the Say’un–Masila Basinconsists mostly of metamorphosed Precambrian to LowerCambrian sediments (Fig. 1). It is unconformably overlainby Middle to Upper Jurassic sequence.
Kohlan Formation
During the Middle–Late Jurassic, sandstones were depositedwidely across the area now occupied by Yemen, with thicksedimentation within depositional lows of pre-Jurassic topog-raphy. These thick sandstone deposits are known as theKohlan Formation (Fig. 2a) and include siltstone, sandstone,and conglomerate with thin limestones and green clay.
Shuqra Formation
The Shuqra Formation (Fig. 2a) is generally composed of limemudstones, wackestones, and grainstones. The Shuqra For-
mation is of Upper Jurassic age (Oxfordian to Kimmeridgian)and forms carbonate platform with reefal buildups.
Madbi Formation
The Madbi Formation consists of porous lime grainstone toargillaceous lime mudstone (Fig. 2a), of which thelithofacies represents deposition within an open marineenvironment. This unit is classified into two members. Thelower member is commonly made up of argillaceouslimestones and sandstones and forms a good reservoir insome oil fields of the Masila Basin (Canadian OxyCompany 2003). The upper member is composed oflaminated organic-rich shale, mudstone, and calcareoussandstone and is a prolific source rock in the Masilaprovince (Mills 1992).
Naifa Formation
In general, the Naifa Formation is composed mainly of siltyand dolomitic limestone and lime mudstone with wacke-stone and chalk (Fig. 2a). The upper part of the formation iscomposed of very porous clastic carbonates overlain by theSaar dolomite facies. The Formation was deposited as chalkand lime mudstones in shallow water to deepwater marineconditions.
STUDY AREA
Fig. 1 Geological map of Yemen with location of the study area and principal sedimentary basins (modified from Beydoun et al. 1998)
724 Arab J Geosci (2012) 5:723–746

Fig. 2 a Lithostratigraphiccolumn and oil potentialities ofMasila oil field. b Facies mapfor the Clastic and LowerCarbonate members of theQishn Fm
Arab J Geosci (2012) 5:723–746 725

Saar Formation
This formation overlies the Naifa Formation and iscomposed mainly of limestone, with some mudstone andsandstones (Fig. 2a). Oil companies classified the formationinto lower Saar carbonates and upper Saar clastics.
Qishn Formation
The term “Qishn Formation” was first defined byBeydoun (1964) and further refined in Beydoun (1966)and Beydoun and Greenwood (1968) and is used widelyby operating oil companies in Yemen. The QishnFormation could be divided into four easily separatedmembers as follows. The lowest two members of theQishn Formation are the laterally equivalent to the ClasticMember and the Lower Carbonate Member. All themembers pass laterally into a clastic-dominated sectionin western Yemen (Holden and Kerr 1997). The uppermember (Carbonate Member) is composed of limestonewith subordinate dolomites (Fig. 2a). Under the CarbonateMember, there is a widespread mudstone unit, called theShale Member (Fig. 3).
Late Lower Cretaceous–Tertiary formations
The Late Lower Cretaceous–Tertiary formations consistof Harshiyat Formation (clastics) and Fartaq Formation(carbonate), Mukalla Formation (Coniacian though
Campanian—fluvial sediments, Fig. 2a), Sharwan Formation(Mastrichtian—carbonates), Umm Er-Radhuma Formation(dominantly carbonates, Paleocene Early Eocene), RusFormation (Middle Miocene—anhydrites, Fig. 2a),Ghaydah Formation (Middle to Late Eocene—carbonate),and shallow marine fine-grained Clastics of the HabashiyaFormation.
Materials and methods
Well logs data methodology
Eight wells, which cover the whole study area, wereselected based on the different log types (Fig. 4). Theavailable well logs are listed in Table 1. These logs include:gamma ray (GR), caliper, spontaneous potential (SP),apparent formation resistivity (Rwa), micro-sphericallyfocused log (MSFL), laterolog shallow and deep (LLSand LLD), formation density compensated, boreholecompensated sonic, compensated neutron log (CNL),and litho-density tool. These logs are checked andmatched for depth before processing and interpretation.
A detailed foot-by-foot analysis was required to allowsummations of reservoir properties over each of the manystratigraphic horizons. The well log evaluation has beenachieved using PC-based software application for reservoirproperty analysis and summation.
Shale volume (Vsh) was calculated from single curveindicators, such as the GR, SP, and deep resistivity (RESD)responses, and double curve indictors. The minimum ofthese values at each level was selected as the final valuefor shale volume. A unique clean sand and pure shalevalue for GR, SP, and RESD were chosen for each zonein each well. A linear relationship was applied to the Vsh
from GR. The resistivity equation for Vsh is similar to theGR equation, but using the logarithm of resistivity in eachvariable.
Where a full suite of porosity logs was available, theeffective porosity (PHIe) was based on a shale-correctedcomplex lithology model using PEF, density, and neutrondata. This method is quite reliable in a wide variety of rocktypes. No matrix parameters are needed by this model,unless light hydrocarbons are present. Shale-correcteddensity and neutron data are used as inputs to the model.Results were depending on shale volume and the densityand neutron shale properties selected for the calculation.In wells with an incomplete suite of porosity logs, theshale-corrected density log, shale-corrected neutron log,or the shale-corrected sonic log have been used to buildthe model.
The equation used was PHIe = PHIt × (1 − Vsh). Thisstep was the most important contribution to the project as it
Fig. 3 a Location map showing the study wells in Masila oil field. bSample for the available well log data plot output
726 Arab J Geosci (2012) 5:723–746

harue -1Scale : 1 : 1000
27/02/2006 19:08DEPTH (1399.95M - 1800.M)
SP (MV)-80. 20.
GR (GAPI)0. 150.
RWA (OHMM)0. 5.
DEPTHM
LLD (OHMM)0.2 2000.
LLS (OHMM)0.2 2000.
MSFL (OHMM)0.2 2000.
DPHI (V/V)0.45 -0.15
RHOB (G/C3)2. 3.
NPHI (V/V)0.45 -0.15
CALI (IN)6. 16.
SGR (GAPI)0. 150.
DRHO (G/C3)-0.25 0.25
PEF (B/E)0. 10.
1450
1500
1550
1600
1650
1700
1750
b
Fig. 3 (continued)
Arab J Geosci (2012) 5:723–746 727

integrates all available data in all wells in a consistentmanner. The value for total porosity, PHIt, was derivedfrom combining the readings of two porosity logs of thedensity and neutron logs.
After that, both old and new wells were treated identically,with water saturation, permeability, and mappable reservoirproperties being derived in a uniform and consistent manner.
Water saturation (Sw) was computed with a shalecorrection using the Simandoux equation and the Waxman–Smits equation (Rojstaczer et al. 2008). Both equations
reduce to the Archie equation when shale volume is zero.Simandoux and Waxman–Smits methods gave very similarresults in this project area. The resistivity curves used werethe long normal from ES logs, the deep induction, or thedeep laterolog.
Absolute permeability at each well of the study area isestimated using the following relation (Rojstaczer et al. 2008):
logK ¼ ln φe 1� Swið Þð0:59
þ 5:0
RHO / NPHI cross plot
Sandstone
RHOB- NPHI Matrix cross plot
Sandstone
GR / NPHI cross plot
Sandstone
GR / RHOB cross plot
Sandstone
ba
dc
Fig. 4 Lithological identification cross-plots of Lower Qishn Clastic–North Camaal-1 well
Table 1 Available open hole well logs in the study area
No. Well name Available data
1 Camaal-4 GR, SP, LLS, LLD, MSFL, DTLN, RWA, CAL, PEF, RHOB, DRHO, NPHI, DPHI, SGR
2 Haru-1 GR, LLS, LLD, MSFL, RWA, CAL, SP, PEF, RHOB, DRHO, NPHI, DPHI, SGR
3 Heijah-3 GR, LLS, LLD, MSFL, DTLN, RWA, SP, CAL, PEF, DRHO, RHOB, NPHI, DPHI, SGR
4 Heijah-5 RWA, CAL, GR, SP, LLS, LLD, MSFL, SGR, PEF, DRHO, RHOB, NHPI, DPHI
5 Hemiar-1 CAL,GR, SP, LLS, LLD, MSFL, RWA, SGR, PEF, DRHO, PEF, RHOB, NPHI, DPHI
6 South Hemiar-1 RWA,GR, SP, LLS, LLD, MSFL, CAL, DTLN, SGR, PEF, DRHO, NPHI, DPHI, RHOB
7 North Camaal-1 GR, RWA, SP, LLD, LLS, MSFL, DTLN, CAL, SGR, PEF, RHOB, DRHO, NPHI, DPHI
8 Tawila-1 GR, SP, RWA, LLS, LLD, MSFL, CAL, DTLN, SGR, DRHO, PEF, RHOB, NPHI
728 Arab J Geosci (2012) 5:723–746

where K is the absolute permeability in millidarcies, φe isthe effective porosity, and Swi is the irreducible watersaturation.
Porosity values were distributed across the model usingsequential Gaussian simulation (SGS). Similarly, watersaturation and permeability were distributed with SGScollocated on the distributed porosity data.
Water saturation calculations are based on the distribu-tions related to porosity ranges. This fast and simplemethod allows the generation of a consistent watersaturation distribution that respects a realistic degree ofcorrelation between porosity and saturation.
Sequential indicator simulation method was chosen todistribute three facies types in each reservoir interval—shale, sandstone facies, and carbonates facies—using theflags created in petrophysical information (Fig. 5).Reservoir properties, such as initial water saturations,porosities, permeabilities, and facies, were upscaled intomodel cells along the well paths from processed well logs.
3D geomodeling data and methodology
One of the main aspects of building the proposed 3D modelis to understand the data and check the quality of the data
Fig. 5 Masila oil field reservoirsincluding Saar Formation andLower Qishn and Upper Qishnmembers
Data Formats Type
Well data
Well headers (Well heads (*.*)) Well
Well deviations (well path deviation)(ASCII)(*.*) Well
Well logs (Well log (LAS 3.0) (*.las) Well
Well tops (ASCII) (*.*) Well tops
3D seismic data Seisworks Horizon Pick (ASCII) (*.*) Lines
Table 2 Available data of themost important aspects ofbuilding any 3D model
PHT total porosity, PHEeffective porosity, Rw waterresistivity, Sw water saturation
Arab J Geosci (2012) 5:723–746 729

files (Table 2). Extensive data sets were used to constructthe geological model of the reservoir such as:
1. Geological structures (major horizons, permeabilitybarriers, fluid contacts, etc.).
2. Fault polygons for all major faults3. Processed log data for eight well penetrations.4. Well log data (porosity, permeability, saturations, etc.).5. Seismic data.
1. Well dataWells data are imported in three steps:
(a) Well head data: Awell head file was created to specifythe top position of the well and length of the well path.
(b) Well path/deviation data(c) Well log data: Several well logs for eight
wells (Table 1), which cover the whole study area,were selected (petrophysical parameters logs inLAS format).
2. Well tops dataA table with ASCII format for the tops of the studied
horizons has been used.3. Seismic data
The available seismic data include seismic horizonsfor top upper Qishn, top lower Qishn, top Saar, and topBasement in addition to fault polygons.
Procedure for building the 3D geological modeling
The processes of building 3D geological models are:
(a) Creating geological and geophysical modeling to con-struct the geological framework for the studies reservoir
(b) Reservoir characterization–distribution of the geolog-ical rock units, facies, and fluid properties
(c) Reservoir flow modeling through upscaling (orupgridding) and flow modeling
A set of equations was derived from well tests and porositylogs and used to populate the 3D grid. This method forderiving permeability distribution gives satisfactory results.
Results and discussion
Cross-plot lithological identification
The type and amount of each lithologic component forLower Qishn Clastic was determined through differentcross-plots. These cross-plots give a quick view about therock and mineral contents in a qualitative way. Some ofthese cross-plots give the amount of lithologic contents in aquantitative way. These cross-plots include the NPHI-RHOB cross-plot, NPHI-RHOB matrix cross-plots, andGR-RHOB GR-NPHI cross-plots. It is clear that thelithology for all wells is almost the same. The lithologicalidentification of North Camaal-1 well is an example of suchcross-plots (Fig. 4a–d).
RHOB/NPHI cross-plot identification
The cross-plot of RHOB/NPHI (Fig. 4a) shows that themain lithology is carbonates (limestone and dolomite) withshale for the Lower Qishn Clastic rock unit. The sandstonecontent is generally low, as shown from the lesser plottedpoints along the sandstone line.
Table 3 PHT, PHE, Rw, Sw, and hydrocarbon saturation of the Saar Fm and the Qishn units in the study wells
Parameters Formation Heijah-5(%)
Heijah-3(%)
N.Camaal- 1(%)
Camaal-4(%)
Harue-1(%)
S. Hemiar-1(%)
Hemiar-1(%)
Tawila-1(%)
Total porosity Upper Qishn Carb. 17.7 20.7 18.2 20.7 14.3 14.6 14.9 16.4
Lower Qishn clastic 20.9 24.9 19.7 21.7 21.6 22.8 22.7 20.8
Saar Formation 19.7 16.3 19.4 10.6 5.23 11 10.4 9.2
Effect porosity Upper Qishn Carb. 12.2 14.3 16.1 18.9 10.6 13.9 10.8 14.5
Lower Qishn clastic 17.5 23.7 18.2 21.4 16.8 22.1 18.8 20.4
Saar Formation 2.88 9.3 18.2 8 5.21 6.7 5.7 8.6
Water resistivity Upper Qishn Carb. 0.62 0.55 0.77 1.90 0.50 0.61 0.89 0.91
Lower Qishn clastic 2.03 1.89 2.60 2.50 1.29 1.58 2.50 1.67
Saar Formation 0.312 0.22 0.64 0.48 0.61 0.95 0.41 0.64
Water saturation Upper Qishn Carb. 60.6 65.1 54.3 48.2 62.3 57.9 58.9 55.7
Lower Qishn clastic 31.6 32.6 28.8 30.9 31.8 31.4 29.9 37.2
Saar Formation 75.4 80.2 69.6 67.5 75.6 61.3 67.00 53.3
Hydrocarbonsaturation (Sh)
Upper Qishn Carb. 39.4 34.9 45.7 51.8 37.7 42.1 41.1 44.3
Lower Qishn clastic 68.4 67.4 71.2 69.1 68.16 68.6 70.1 62.8
Saar Formation 24.6 19.8 30.4 32.5 24.4 38.7 33 46.7
730 Arab J Geosci (2012) 5:723–746

RHOB/NPHI matrix cross-plot identification
The cross-plot of RHOB/NPHI matrix (Fig. 4b) reflects thesame picture of the above plot. The scattered plotted pointsshow that the main lithology is carbonates (limestone anddolomite) with some shale for the Lower Qishn Clastic rockunit. The sandstone content is low, as shown from the lesserplotted points in the quartz matrix zone.
GR/NPHI cross-plot identification
This plot (Fig. 4c) shows that the plotted points arescattered. This reflects the variation of lithology of the
Lower Qishn Clastic rock unit. It shows that the pointshave a low GR and low NPHI, which indicate thepresence of limestone and dolomite. The points withmedium GR and medium NPHI indicate sandstone, andthe points with high GR and high NPHI reflect theabundance of shale. By comparing, it is clear that themain lithology is limestone and dolomite with shale anda little sandstone.
GR/RHOB cross-plot identification
This plot (Fig. 4d) illustrates the same result as in the aboveplot, as expected from the density of the limestone and
Heijah-3Scale : 1 : 2000
12/02/2006 11:22DEPTH (1634.95M - 1830.93M)
DEPTHM
CALI (IN)6. 16.
RHOB (G/C3)1.95 2.95
PHIT (Dec)0.5 0.
PHIE (Dec)0.5 0.
BVWSXO (Dec)0.5 0.
BVW (Dec)0.5 0.
Movable Hyd
Water
VWCL (Dec)0. 1.
PHIE (Dec)1. 0.
VSAND (dec)0. 1.
VLIME (dec)0. 1.
VDOL (dec)0. 1.
Clay
Porosity
Sandstone
Limestone
Dolomite
1700
1800
1
Low
er Q
ishn
F
orm
atio
ns
Gas
Oil
Fig. 6 Litho-saturation plotoutput showing log porosityderived from Vsh and Sw log ofthe Lower Qishn clastic Memberin the study area
Arab J Geosci (2012) 5:723–746 731

Hemiar-1
South Hemiar-1
North Camaal-1
Camaal-4
Haur-1
Heijah 3
Tawilah-1
Heijah 5
49 02' 38"E 49 05' 26"E 49 08' 13"E 49 11' 01"E 49 13' 49"E49 00' 00"E
0 5000 10000
15 24' 47"N
15 27' 30"N
15 30' 13"N
15 32' 55"N
15 35' 37"N
15 38' 19"N
15 41' 02"N
15 43' 45"N
15 46' 27"N
o
o
o o o o o o
o
o
o
o
o
o
o
m
Contour interval = 0.3
ba
c
Fig. 7 a Total porosity distribution map of the Lower Qishn Member. b Effective porosity distribution map of the Lower Qishn Member. c Watersaturation distribution map of the Lower Qishn Member
732 Arab J Geosci (2012) 5:723–746

a Rho- DT crossplot of Qishn Formation
Quartz
Calcite
Dolomit
b Rho- PHIN crossplot of Qishn Formation
Quartz
Calcite
Dolomite
c M-N crossplot of Qishn Formation
Gyp
DoloLm Qtz
Approx Shale Region
Secondary porosity
Anh
f M- N crossplot of Saar Formation
Gyp
Dolo Lm Qtz
Approx Shale Region
Secondary porosity
Anh
d Rho- DT crossplot of Saar Formation
Quartz
Calcite
Dolomite
e Rho- PHIN crossplot of Saar Formation
Quartz
Calcite
Dolomite
Fig. 8 Lithology and facies identification cross-plots for the Qishn and Saar formations. a Rho-DT cross-plot of Qishn Formation. b Rho-PHIN cross-plot of Qishn Formation. c M-N cross-plot of Qishn Formation
Arab J Geosci (2012) 5:723–746 733

Scale : 1 : 1000 Heijah-3DEPTH (1510.M - 1978.02M)
DEPTHM
1550
1400
1550
1600
1650
1700
1750
1800
1450
1500
1550
1600
1650
1700
1750
1800
1600
1650
1700
1750
1800
1850
1900
1950
DEPTHM
DEPTHM
DEPTHM
GR (GAPI) VWCL (Dec)
VDOL(dec)VLIME (dec)VSAND (dec)PHIE (Dec)RHOB (G/C3)
.0.0
1.0.0.0.
1.
0.1.1.1.
1.7
150.
2.7
04/18/2006 17:41Scale : 1 : 1000 Hemiar
DEPTH (1390.M - 1808.03M) 04/18/2006 17:49 Scale : 1 : 1000 Heijah-5DEPTH (1528.M - 1828.08M) 04/18/2006 17:22
ClayPorosity
Sandstone
LimestoneDolomite
DEPTHM
GR (GAPI) VWCL (Dec)
VDOL(dec)
VLIME (dec)
VSAND (dec)
PHIE (Dec)RHOB (G/C3)0. 0.
1.
0.
0.
0.
1.
0.
1.
1.
1.
1.7
150.
2.7
Porosity
Clay
Sandstone
Limestone
Dolomite
DEPTHM
GR (GAPI) VWCL (Dec)
VDOL(dec)
VLIME (dec)
VSAND (dec)
PHIE (Dec)RHOB (G/C3)0. 0.
1.
0.
0.
0.
1.
0.
1.
1.
1.
1.7
150.
2.7
Porosity
Clay
Sandstone
Limestone
Dolomite
VWCL (Dec)
VDOL(dec)VLIME (dec)VSAND (dec)PHIE (Dec)
0.
1.0.0.0.
1.
0.1.1.1.
PorosityClay
SandstoneLimestoneDolomite
1
2
3
1
2
3
1
2
3
GR (GAPI)RHOB (G/C3)
0.
1.7
150.
2.7
VWCL (Dec)
VDOL(dec)
VLIME (dec)
VSAND (dec)
PHIE (Dec)0.
1.0.0.0.
1.
0.1.1.1.
Porosity
Clay
Sandstone
Limestone
Dolomite
GR (GAPI)RHOB (G/C3)
0.
1.7
150.
2.7
VWCL (Dec)
VDOL(dec)
VLIME (dec)
VSAND (dec)
PHIE (Dec)0.
1.
0.
0.
0.
1.
0.
1.
1.
1.
Porosity
Clay
Sandstone
Limestone
Dolomite
GR (GAPI)
RHOB (G/C3)0.
1.7
150.
2.7
734 Arab J Geosci (2012) 5:723–746

dolomite which is larger than that of the sandstone in theLower Qishn Clastic rock unit. Thus, the points oflimestone and dolomite locate in the left direction ofthe cross-plot. Finally, according to these cross-plots(Fig. 4a–d), it could be concluded that the lithology of thisreservoir (Lower Qishn Clastic) is composed of sandstonewith shale and carbonate. The sandstone content isgenerally high, as shown from the highest plotted pointsalong the sandstone line.
Determination of the formation water resistivity (Rw)
In this work, the SP log is used to determine the Rw via Pcsoftware, which is calculated for all the studied wells(Table 3).
Determination of formation porosity (φ)
In this work, the porosity can be determined from equations ofthe Inactive Petrophisecis software, which is calculated for all
the studied wells for the studied formations. It could beconcluded that the porosity of Lower Qishn Clastic in rangesfrom 19% to 24.9%, while the porosity of the Saar Formationranges from 6% to 19.7%.
Determination of fluid saturation
The determination of fluid saturation is very important tocomplete the deduced petrophysical parameters of thestudied reservoir rock units. The hydrocarbon saturationsfor the studied rock units are calculated depending onwater saturation (Sw). The hydrocarbon saturation can becalculated by the following relation:
Sh ¼ 1� Sw:
It can be concluded that the water saturation for LowerQishn Clastic ranges from 30% to 38% and for SaarFormation from 53% to 80% (Table 3).
Hydrocarbon potentiality
Evaluation of the oil potential of the reservoir rocks inthe study area is based on the results of well logging
Heijaha-3 Heijaha-5 Harue-1
ate
tic
aar
ent
SSTVD
1550
1600
1650
1700
1750
1800
(1856)
1498
-0.82 126.12GR -0.04 0.49PHIT-0.04 0.57NPHI1.51 2.91RHOB
Top Qishn carbonate
Top Qishn clastic
Top Saar
Top Basement
Heijaha [SSTVD]SSTVD
1500
1550
1600
1650
1700
1750
1800
1850
1900
1950
2000(2014)
1477
1.09 110.01GR -0.04 0.49PHIT-0.04 0.50NPHI1.39 2.92RHOB
Top Qishn carbonate
Top Qishn clastic
Top Saar
Top Basement
Heijah [SSTVD]SSTVD
1400
1450
1500
1550
1600
1650
1700
1750
1800
(1820)
1380
-3.24 112.68GR -0.04 0.49PHIT1.52 3.07RHOB-0.06 0.50NPHI
Top Qishn carbonate
Top Qishn clastic
Top Saar
Top Basement
Haru [SSTVD]
Top Qishn carbonate
Top Qishn clastic
Top Qishn Saar
Top Basement
Fig. 10 Correlation and lithology of Heijaha-5, Heijaha-3, and Harue-1 well output from Interactive Petrophysics software
Fig. 9 Lithology of Heigah-3, Hemiar-1, and Heigah-5 well outputfrom Interactive Petrophysics software
�
Arab J Geosci (2012) 5:723–746 735

Fig. 11 a Structural model ofthe Masila area showing themajor fault and selected hori-zons: pre-fault top of basement(blue surface); syn-fault tops ofthe Upper Qishn and LowerQishn members and Saar For-mation (red, yellow, and greensurfaces, respectively). b Faultmodel showing fault outlinesystem (A), fault surfaces (B),and surface appended of thehorizons (C) in the Masila oilfield. c 3D structural modelincludes faults, stratigraphy, andgeometry of the reservoirs in thestudy area
736 Arab J Geosci (2012) 5:723–746

Fig. 12 a Porosity modeloutput: 3D gridding model (A),horizontal slice sequentialGaussian simulation (B), color-coded according to porosity ofthe Upper Qishn Member (C)
Arab J Geosci (2012) 5:723–746 737
analysis for the studied wells. These analyses includevertical petrophysical distribution cross-plots of theanalyzed data in each well and the horizontal isopara-metric configuration maps. The vertical distribution, ina form of litho-saturation cross-plots (volumetricanalysis), shows irregular changes in lithology andwater and hydrocarbon contents (Fig. 6). The lateralisoparametric maps show the petrophysical parameterconfiguration in the form of water and hydrocarbonsaturations, total porosity, and effective porosity distri-bution (Fig. 7a–c).
The total porosity of the Lower Qishn Clastic (Fig. 7a)decreases from the central-western part toward the north-western, southwestern, and eastern parts of the study area.
The effective porosity (Fig. 7b) decreases from the central-southern part toward the east and northwest and increases atthe northeastern part of the study area. Meanwhile, thewater saturation map of the Lower Qishn Clastic shows adecrease from the central-western part toward the east,northeastern, and southwestern parts of the study area(Fig. 7c).
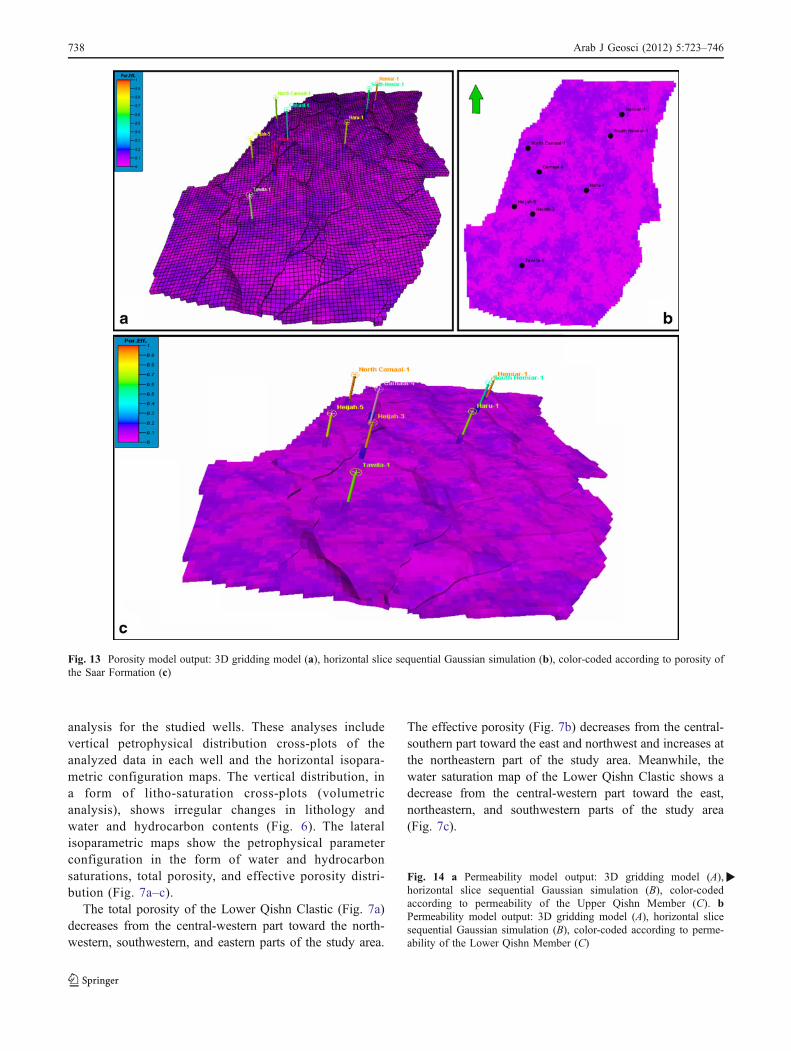
Fig. 13 Porosity model output: 3D gridding model (a), horizontal slice sequential Gaussian simulation (b), color-coded according to porosity ofthe Saar Formation (c)
Fig. 14 a Permeability model output: 3D gridding model (A),horizontal slice sequential Gaussian simulation (B), color-codedaccording to permeability of the Upper Qishn Member (C). bPermeability model output: 3D gridding model (A), horizontal slicesequential Gaussian simulation (B), color-coded according to perme-ability of the Lower Qishn Member (C)
�
738 Arab J Geosci (2012) 5:723–746

Arab J Geosci (2012) 5:723–746 739

Determination of lithology
Cross-plot technique, combined with the different welllog parameters, was applied here to identify lithologytypes and define the mineralogical associations ofeach lithotype. A number of cross-plots (ρb vs. ΦN,GR vs. ρb, ρb vs. ΔT) for both Qishn and Saarformations are given in Fig. 8a–f. It could be concludedthat the lithology of Lower Qishn Clastic Member iscomposed mainly of sandstones with dolomite andlimestone, while the Upper Qishn Carbonate Memberconsists of carbonates (limestone and dolomite) withshale and has low sandstone content. The lithology ofthe Saar Formation is consists mainly of carbonate(limestone and dolomite) with shale and sandstones(Figs. 8a–f, 9, and 10).
3D geomodeling
3D geological modeling
The stratigraphy of the studied reservoir can be summarizedas follows, from top to bottom:
(a) Upper Qishn Member (red surface)(b) Lower Qishn Member (green surface)(c) Saar Formation (yellow surface)
The top and base structure maps were digitized andtransformed into surfaces (Fig. 11a). The main geologicalfeature in this field is a system of faults (Fig. 11a, b) thatdivides the field into eastern and western sections. The faultsystem, as well as other smaller faults, was modeled asvertical fault surfaces (Fig. 11b, c).
Fig. 15 Permeability model output: 3D gridding model (a), horizontal slice sequential Gaussian simulation (b), color-coded according topermeability of the Saar Formation (c)
740 Arab J Geosci (2012) 5:723–746

Fig. 16 a Water saturationmodel output: 3D griddingmodel (A), horizontal slicesequential Gaussian simulation(B), color-coded according towater saturation of the UpperQishn Member (C). b Watersaturation model output: 3Dgridding model (A), horizontalslice sequential Gaussiansimulation (B), color-codedaccording water saturation of theLower Qishn Member (C)
Arab J Geosci (2012) 5:723–746 741

Petrophysical model
Figures 12a, b and 13 show geological models for theporosity, permeability, and water saturation distributioncreated by SGS in the study area. Those models reflectthat the porosity values for the Upper Qishn Member rangefrom 9.5% to 14.5%. The porosity model of the LowerQishn Member (Fig. 12b) reflects porosity values that donot exceed 21.5%. However, the porosity model of the SaarFormation (Fig. 13) shows that the porosity values rangefrom 3% to 12%.
In the studied reservoir, the permeability model of theUpper Qishn Member (Fig. 14a) shows that the perme-ability values range from 43 to 155 md, while thepermeability model of the Lower Qishn Member(Fig. 14b) illustrates that the permeability values range
from 100 to 380 md. The permeability model of the SaarFormation (Fig. 15) shows that the permeability valuesrange from 1 to 65 md.
The water saturation model of the Upper Qishn Member(Fig. 16a) shows that the water saturation values range from57% to 62%. The water saturation model of the LowerQishn Member (Fig. 16b) illustrates that the watersaturation values range from 29% to 37%. The watersaturation model of the Saar Formation (Fig. 17) shows thatthe water saturation values range from 52% to 76%.
Fig. 17 Water saturation model output: 3D gridding model (a), horizontal slice sequential Gaussian simulation (b), color-coded according towater saturation of the Saar Formation (c)
Fig. 18 a Facies model output: 3D gridding model (A), horizontalslice sequential indicator simulation (B), color-coded according tofacies of the Upper Qishn Member (C). b Facies model output: 3Dgridding model (A), horizontal slice sequential indicator simulation(B), color-coded according to facies of the Lower Qishn Member (C)
�
742 Arab J Geosci (2012) 5:723–746

Arab J Geosci (2012) 5:723–746 743

Facies model
The facies model of the Upper Qishn Member (Figs. 18a, band 19) shows that it is composed mainly of carbonatewith shale and a few of sandstones. The facies modelat the Lower Qishn Member shows that it is composedof sandstone with shale and carbonates. Meanwhile,the facies model of the Saar Formation shows that itis composed mainly of carbonates with shale andsandstone.
Reservoir flow model
The geological model was converted into a flow modelwith 750,000 (500×500×3) grid blocks. This flow modelwill be used to evaluate the productive potential of the
Lower Cretaceous reservoirs (Fig. 20). Figure 21 shows a3D geological model for the studied Lower CretaceousMasila reservoirs.
Summary and conclusions
1. In the fields of the Masila block, the Early Cretaceousmarine Qishn Formation provides both the reservoirsandstone and an overlying sealing tight limestone unit.
2. The largest hydrocarbon volumes are reservoired insands of the Qishn Formation sands of Barremian–Aptian age that have produced considerable rates of oilwith little dissolved gas.
3. The Qishn Formation comprises shallow shelf to fluvio-deltaic sandstones in central and western Yemen and is
Fig. 19 Facies model output: 3D gridding model (a), horizontal slice sequential indicator simulation (b), color-coded according to facies of theSaar Formation (c)
744 Arab J Geosci (2012) 5:723–746

likely to be equivalent to the lower fluviatile sandstonesof the Tawilah Group of western Yemen, and to the east, itbecomes more carbonate-rich and passes into the purercarbonate facies of the Mahra Group.
4. The porosity analyses illustrated that the total porosityranges from 18% to 24.3% while the effective porosityranges from 25% to 18%. The permeability of this
reservoir ranges from 375 to 103md. The water saturationvalues range from 29% to 37%, whereas the hydrocarbonsaturation has matched with the water saturation in areverse relationship. The hydrocarbon occurrencedecreases where the water saturation increases.
5. The lithological identification of the investigatedreservoir indicates that the main lithology is madeup of sandstone with shale and carbonates. Theutility of cross-plots illustrated that the QishnFormation is composed mainly of sandstone withlimestone and dolomite, and Saar Formation iscomposed mainly of limestone and dolomite withshale and low content of sandstone.
6. The petrophysical parameters refer to high hydrocarbonsaturation with many pay zones in the studied reservoir.Hydrocarbon saturation of the Qishn Formation ishigher than that of the Saar Formation.
7. Reservoir properties of well log analysis were aug-mented by similarly detailed seismic and stratigraphiccorrelations and then integrated together in a 3Dgeological model. The integration of such inputsenhances considerably not only the static reservoirdescription but also the consistency of the future
Fig. 20 Property modeling of Lower Cretaceous Reservoirs in Masila oil field: porosity model (a), permeability model (b), water saturationmodel (c), and facies model (d)
Fig. 21 3D geological model for Lower Cretaceous Masila reservoir
Arab J Geosci (2012) 5:723–746 745

reservoir model, which will better reproduce theobserved field performance and facilitate at a laterstage the production history matching process.
References
Beydoun ZR (1964) The stratigraphy and structure of the EasternAden protectorate. Overseas Geol Miner Resour, Suppl Ser, BullSuppl 5. HMSO London, 107 pp
Beydoun ZR (1966) Eastern Aden protectorate and part of Dhufar. In:Geology of the Arabian Peninsula. USGS Professional Paper560H, Washington, DC, 49 pp
Beydoun ZR, Greenwood JEGW (1968) Aden protectorate andDhufar. In: Dubertret L (ed) Lexique Stratigraphique International,vol. III. Asie fasc
Beydoun ZR, As-Saruri MAL, El-Nakhal H, Al-Ganad IN, Baraba RS,Nani ASO, Al-Aawah MH (1998) International lexicon ofstratigraphy, Volume III, Republic of Yemen, Second Edition:International Union of Geological Sciences and Ministry of Oil andMineral Resources, Republic of Yemen Publication 34, 245 p
Canadian Oxy Company (2003) Yemen (unpublished report)Greenwood JEGW (1967) Photogeological map of Western Aden
Protectorate, scale 1:250,000. D.O.S. (Geol.) 1159A
Greenwood JEGW, Bleackley D (1967) Aden protectorate. In:Geology of the Arabian Peninsula. USGS Professional Paper560-C. Washington, DC, 96 pp
Holden A, Kerr HM (1997) A subsurface lithostratigraphic division ofthe Hauterivian to Aptian, Furt (informal) and Qishn formations,Yemen. Mar Petrol Geol 14:631–642
Khalil M, Naji HS (2010) 3D structural geomodeling and oiloccurrence of the Lower Cretaceous successions, Masila Oilfield,Yemen. Journal of Geological Society of India (in press)
Mills SJ (1992) Oil discoveries in the Hadramaut: how Canadian Oxyscored in Yemen. Oil Gas J Spec 9:49–52
Naji HS (2010) Reservoir properties of Lower Cretaceous Qishn andSaar formations from well logs analyses of Masila Region,Yemen. JKAU: Earth Sci 21(2) (in press)
Naji HS, Khalil M (2010) Hydrocarbon potentialities and reservoircharacterization of Lower Cretaceous successions of Masila Oilfield, Yemen. JKAU: Earth Sci (in press)
Naji HS, Hakimi H, Khalil M, Sharief FA (2010a) Stratigraphydeposition and structural framework of the Cretaceous and 3Dgeological model of the Lower Cretaceous reservoirs, Masila OilField, Yemen. Arab J Geosci 3(3):221–248
Naji HS, Sharief FA, Khalil M (2010b) Sedimentology and quantita-tive well logs petrophysical parameters, Lower Qishn Clasticreservoir, Masila Oilfield, Yemen. JKAU: Earth Sci 21(1):53–77
Rojstaczer S, Ingebristen E, Hayb DO (2008) Permeability ofcontinental crust influenced by internal and external forcing.Geofluids 8:128–139
746 Arab J Geosci (2012) 5:723–746