35th barley improvement conference proceedings -...
TRANSCRIPT

35th Barley Improvement Conference Proceedings
Mills House Hotel Charleston, South Carolina
January 11-12, 2005
Sponsored by: American Malting Barley Association, Inc. Idaho Barley Commission Minnesota Barley Research & Promotion Council Montana Wheat & Barley Committee National Barley Growers Association North Dakota Barley Council Oregon Grains Commission Washington Barley Commission

PROCEEDINGS OF THE 35TH BARLEY IMPROVEMENT CONFERENCE
January, 2005 TABLE OF CONTENTS
Page
Development of Scab Tolerant Barley Varieties at North Dakota State University and the University of Minnesota Richard Horsley .............................................................................................................. 1 Management of Barley Diseases in the Upper Midwest Ruth Dill-Macky............................................................................................................. 13 Current Status of the Northern Plains Genotyping Laboratory in Fargo, North Dakota Shiaoman Chao............................................................................................................... 16 Applications of Microarrays to Barley Research Gary Muehlbauer ............................................................................................................ 20 Health Effects of Barley Consumption Joan Conway................................................................................................................... 24 Malting Barley Quality Panel – What Do Brewers Want? David Lewis.................................................................................................................... 31 Susan Kay ....................................................................................................................... 33 Joseph Hertrich ............................................................................................................... 37 Barley Insect Research at the USDA-ARS Plant Science Research Laboratory David Porter.................................................................................................................... 44 ARS Barley Research at Aberdeen: Progress in Research and Product Development, Facilities, and Goals Phil Bregitzer .................................................................................................................. 48 Potential and Status of Winter Malting Barley Variety Development in the US Don Obert ....................................................................................................................... 53
1
Development of Scab Tolerant Barley Varieties at North Dakota State University and the University of Minnesota
Rich Horsley, North Dakota State University and Kevin Smith, University of Minnesota
Executive Summary Fusarium head blight, incited by Fusarium graminearum, has adversely affected the quality of barley grown in North Dakota and northwestern Minnesota every year since 1993. The disease reduces the quality of harvested grain because of blighted kernels and the presence of deoxynivalenol (DON), a mycotoxin produced by the pathogen. Beginning in 1993, barley researchers in the upper Midwest U.S. began the world-wide search for accessions with FHB resistance, to study the genetics of FHB resistance, to identify methods to control FHB, and to develop malting barley varieties with FHB resistance. This genetics of reduced FHB severity and DON accumulation is now much better understood due to the numerous genetic studies conducted. A QTL located near the centromere of chromosome 2H appears to confer stable FHB resistance and low DON accumulation across environments. However, all lines identified to date with this QTL have unacceptable plant height. Research is being conducted to better understand this region of chromosome 2H and to develop plants with the bin 10 FHB resistance QTL and acceptable plant height. Breeding lines with improved FHB resistance and reduced DON accumulation have been developed by the six-rowed barley breeding programs at the University of Minnesota (U of M) and North Dakota State University (NDSU). These lines will be candidates for entry in the 2005 American Malting Barley Association (AMBA) Pilot Scale Evaluation Program. Introduction Fusarium head blight, incited by F. graminearum, has adversely affected the quality of barley grown in North Dakota and northwestern Minnesota every year since 1993. Quality of harvested grain was reduced because of blighted kernels and the presence of DON, a mycotoxin produced by the pathogen. Grain buyers discount the price paid for malting barley based on levels of kernel discoloration and DON. At times during the last 12 years, the discount between malting barley and feed barley has approached $1.00 per bushel. Zero or low levels of DON are needed in barley because DON has been found to carry through malting and brewing into finished beer (Schwarz et al., 1995). The contamination of the malting barley crop with the mycotoxin DON has made large portions of the crop unsuitable for use in malting and brewing. This has resulted in significant revenue losses to growers, since they cannot realize malting barley premiums and must sell their barley as feed. The GAO estimates that losses in North Dakota from 1993-1997 due to FHB of barley were about $200 million (GAO, 1999). This amount is equal to about 17 percent of the $1.2 billion in total barley revenues that North Dakota growers received during this period. Nganje et al. (2001) estimated losses of $136 million in the same region from 1998-2000. The malting industry, which is concentrated in the Dakotas, Minnesota, and Wisconsin, has been forced to purchase barley with low or no DON at a higher price from Canada and other areas outside its traditional sourcing area in the Dakotas and Minnesota.

2
When we began breeding for FHB resistance in 1993, the breeders and pathologists in the upper Midwest new little about the disease. Unknowns included the number of genes controlling FHB resistance and DON accumulation, the types of resistance against F. graminearum, sources of resistance and their characteristics, and the effects of cultural practices in controlling the disease. Because of increased support from state barley commodity groups, the AMBA, and the USDA-ARS U.S. Wheat and Barley Scab Initiative, significant progress has been made in understanding the disease and developing barley lines with improved resistance. This report will provide highlights on some of the progress made at the U of M and NDSU since 1993. Use of Fungicides to Control FHB Research to test the efficacy of fungicides in reducing FHB and DON levels in barley has been conducted using cultivars susceptible to FHB. Pederson and McMullen (1999) found that the fungicides Folicur, Tilt, Benlate, Mancozeb, and Quadris significantly reduced FHB severity and DON content of barley. However, the fungicides were not successful in reducing DON content to a level that would be acceptable to maltsters and brewers. In a preliminary study, Horsley et al. (2000) evaluated the efficacy of Folicur in controlling FHB on barley genotypes with different levels of resistance. They concluded that Folicur did not significantly reduce FHB levels in any of the 14 genotypes included in their study. Thus, a series of field experiments were conducted to determine if the integrated use of fungicides and resistant or moderately resistant barley genotypes would reduce FHB severity and DON accumulation. Figure 1 provides an example of the results obtained in the study conducted from 2000-2002 in Langdon and Osnabrock, North Dakota. In all cases, Folicur significantly reduced the amount of DON accumulated. However, in the susceptible genotypes, the fungicide did not reduce the DON levels below 1.0 ppm. In the moderately resistant class, the mean DON of the genotypes was reduced from 1.3 to 0.8 ppm. In the resistant class, the mean DON of the untreated genotypes was already below 1.0 ppm; however, application of the fungicide did not reduce the mean DON below the 0.5 level desired by many malting barley buyers. These results suggest that the integrated used of Folicur and moderately resistant genotypes could be successful in reducing the DON levels below 1.00 ppm in years with moderate levels of FHB.
0.0
0.5
1.0
1.5
2.0
Resistant Mod. Resistant Susceptible
Genotype class
DO
N (p
pm)
ControlFolicur
Figure 1. Effect of fungicides on DON accumulation of barley grown at six North Dakota environments, 2000-2002.

3
Characteristics of FHB Resistant Accessions Over 40 six-rowed and two-rowed barley germplasm accessions have been identified with partial resistance to FHB (Steffenson and Scholz (2001), Prom et al., 1996). Most of these accessions originate from eastern Asia and have the two-rowed spike morphology, and are unadapted for growth in upper Midwest because of late maturity and tall, weak straw. Many of these germplasm lines are being used as sources of genes for FHB resistance and low DON accumulation; yet, little is known about their agronomic and malt quality characteristics, and their response to other foliar pathogens. Urrea et al. (2005) determined the malt quality, agronomic potential, and foliar disease susceptibility of many of the resistant accessions. They found that none of the FHB-resistant barley germplasm lines had acceptable malt quality for all traits. Kernel plumpness, percent grain protein, and malt extract were the traits impacted most severely. The FHB-resistant barley germplasm lines headed significantly later than the adapted barley cultivars. Most FHB-resistant germplasm lines were susceptible to the common foliar diseases of the upper Midwest. Finally, they indicated that at least four cycles of breeding will probably be necessary to develop FHB-resistant germplasm lines acceptable to producers and the malting and brewing industry. Table 2 presents a comparison of the FHB severity, DON accumulation and malt quality of some of the most resistant accessions to Foster and Stander barley. Table 1. Fusarium head blight severity (FHB), deoxynivalenol (DON) content, and malt quality† of selected barley genotypes grown at two North Dakota locations in each of three years. FHB DON Plump Grain Malt Genotype severity content kernels protein extract % ppm % % % Zhedar 1 5.9 2.9 63.0 16.2 73.5 Zhedar 2 7.4 5.0 59.6 16.2 72.2 Svanhals 6.7 2.9 57.4 16.0 74.2 CIho 4196 6.6 2.7 55.4 15.6 74.5 Foster 34.6 17.5 76.4 13.6 78.3 Stander 41.1 28.9 79.5 14.2 78.4 †Malt data courtesy of Dr. Paul Schwarz, Dept. of Plant Sciences, NDSU. Genetic Diversity of FHB Resistant Accessions An interesting phenomenon of the most resistant two-rowed accessions is that they are very much alike morphologically and in quality. Whether they are from East Asia or Northern Europe (e.g., Zhedar 1, Zhedar 2, ExBarley 2, ExBarley 8, and Svanhals), they have similar maturities, plant height, plant morphology, malt quality, and disease resistance. A question we had is whether these lines were actually lines from a common ancestor. If they are, then the genes conferring resistance in these lines are likely similar. If the lines are different genetically, then the likelihood of the accessions having different FHB genes is greater. Knowing if lines have the same or different genes conferring resistance is important when selecting parents for crossing. It would be desirable to pyramid different resistant genes into a common line with the hope that this line would have better FHB resistance than either parent.

4
Because of the polygenic nature of FHB resistance, determining if accessions have the same gene(s) would be time consuming and expensive. First, QTL or genes conferring resistance in each of the accessions would have to be identified. Next, lines would have to be derived from each accession that has only one FHB resistance QTL. Once these lines are developed, then allelism tests would be conducted between lines that have FHB resistance QTL in the same region. An alternative method to determine if accessions would likely have similar FHB resistant genes would be to measure their genetic diversity using cluster analysis of molecular marker data. This method requires the “fingerprinting” of the accessions using a series of molecular markers that map across the genome, and then performing cluster analysis on these data. Accessions with similar FHB resistant genes by decent would be expected to cluster more closely, while genotypes with different genes would be expected to have greater genetic diversity. Determination of the genetic diversity of FHB resistant accessions using this method has been conducted at the U of M (Belina et al., 2002; Wingbermuehle et al., 2001) and NDSU (Lamb, 2005; Urrea, 2000). An example of the results from this type of research is presented in Figure 2 (Lamb, 2005).
Figure 2. Dendogram based on cluster analysis of the genetic distance among 45 barley genotypes.

5
Lamb (2005) found that the genotypes could be divided into seven clusters, and that the FHB resistant two-rowed accessions from East Asia clustered together in cluster 5 and the FHB resistant six-rowed accessions clustered together in cluster 1. Based on the results, he stated that it is possible that the East Asian genotypes in cluster 5 have different FHB resistance genes than the six-rowed accessions in cluster 2. However, he also stated that additional information would be necessary to make definitive conclusions. Identification of QTL Conferring Reduced FHB and DON Accumulation Since 1993, several mapping populations have been developed using FHB resistant accessions and QTL conferring reduced FHB severity and DON accumulation have been identified (de la Pena et al., 1999; Zhu et al., 1999; Ma et al., 2000; Dahleen et al., 2003; Mesfin et al. ,2003; Lamb, 2005). QTL for reduced FHB severity were found on most chromosomes. However, common to all studies was the location of a large effect QTL in the bin 10 region of chromosome 2H. This QTL also was found to be located close to QTL for plant height, maturity, and the vrs1 locus controlling the spike row number morphology. Figure 3 presents the centromeric region of chromosome 2H, including molecular and morphological markers and QTL. Work is continuing at the U of M and Washington State University to fine map the BIN 10 region of chromosome 2H surrounding the vrs1 locus. On BIN 8 of chromosome 2H, coincident QTL for FHB (Qrfg.ndsu-2H-8) and days to heading (Eam6) exist (Mesfin et al., 2003, de la Pena et al., 1999. It was not clear as to whether these are two tightly linked QTL, or if late heading has a pleiotropic effect on FHB severity. Recently, Nduulu et al. (2004) reported results of a fine mapping study that suggests that there are two distinct QTL (Figure 4). In order to have stable resistance similar to the best resistant accessions, Horsley et al. (manuscript in preparation) state that the FHB resistance QTL in bin 10 (Qrfg.ndsu-2H-10) must be present. If this QTL is lacking, other FHB QTL may provide some protection, but resistance will not be similar to that of the best resistant accessions, nor will it be stable across environments. A problem with Qrfg.ndsu-2H-10 is its close proximity to a locus, possibly hcm1, controlling plant height. All resistant lines with Qrfg.ndsu-2H-10 are tall. In attempt to break this association, the NDSU six-rowed barley breeding project has grown several F2 populations with more than 15,000 plants. No recombinants between Qrfg.ndsu-2H-10 and the height locus were found. Thus, the association between plant height and Qrfg.ndsu-2H-10 is either due to an extremely tight linkage or pleiotropic effects. To overcome this negative association, crosses are being made between lines with Qrfg.ndsu-2H-10 and ones with semi-dwarf genes outside the centromeric region of chromosome 2H.

6
Figure 3. Proposed chromosome 2HL linkage block based on a mapping population derived
from the cross Foster/CIho 4196 (Horsley et al., manuscript in preparation).
Heading date
ABG714B
Rachis nodes, Plant height lin1, hcm1
Six-rowed spike 1vrs1
ABC306 (8)
MWG865 (10)
ABG461C (6)
MWG503 (11)
Plant height
FHB severityQrfg.ndsu-2H-8
Eam6
FHB severityQrfg.ndsu-2H-10 DON accumulation
7
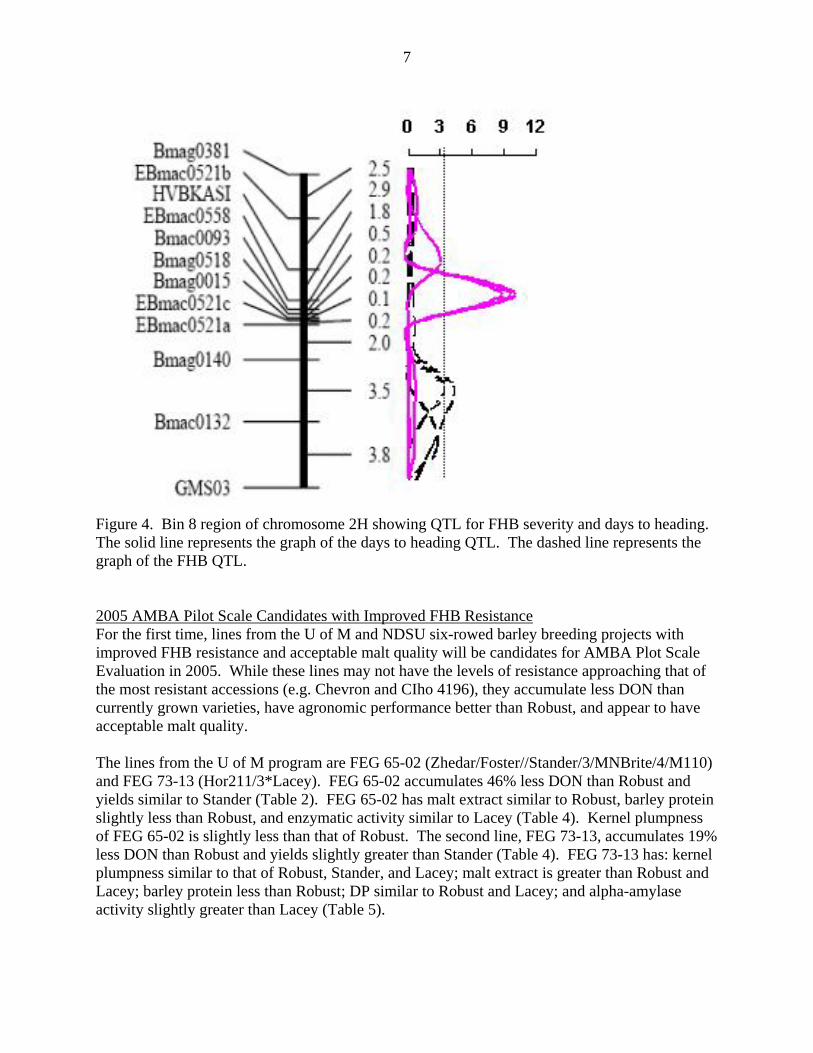
Figure 4. Bin 8 region of chromosome 2H showing QTL for FHB severity and days to heading. The solid line represents the graph of the days to heading QTL. The dashed line represents the graph of the FHB QTL. 2005 AMBA Pilot Scale Candidates with Improved FHB Resistance For the first time, lines from the U of M and NDSU six-rowed barley breeding projects with improved FHB resistance and acceptable malt quality will be candidates for AMBA Plot Scale Evaluation in 2005. While these lines may not have the levels of resistance approaching that of the most resistant accessions (e.g. Chevron and CIho 4196), they accumulate less DON than currently grown varieties, have agronomic performance better than Robust, and appear to have acceptable malt quality. The lines from the U of M program are FEG 65-02 (Zhedar/Foster//Stander/3/MNBrite/4/M110) and FEG 73-13 (Hor211/3*Lacey). FEG 65-02 accumulates 46% less DON than Robust and yields similar to Stander (Table 2). FEG 65-02 has malt extract similar to Robust, barley protein slightly less than Robust, and enzymatic activity similar to Lacey (Table 4). Kernel plumpness of FEG 65-02 is slightly less than that of Robust. The second line, FEG 73-13, accumulates 19% less DON than Robust and yields slightly greater than Stander (Table 4). FEG 73-13 has: kernel plumpness similar to that of Robust, Stander, and Lacey; malt extract is greater than Robust and Lacey; barley protein less than Robust; DP similar to Robust and Lacey; and alpha-amylase activity slightly greater than Lacey (Table 5).

8
The lines from NDSU that will be candidates for the 2005 AMBA Pilot Scale Evaluation Program are ND20448 (ND16918/3/ND12738//Foster/CIho 4196) and ND20508 (ND16918*2/CIho 6610). ND20448 accumulates about 23% less DON than Drummond (Table 6). Yield of ND20448 and Drummond are similar, while days to heading and plant height of ND20448 and Robust are similar (Table 6). The second line, ND20508, accumulates about 26% less DON than Robust; otherwise, it is similar agronomically to Drummond (Table 7). Results from micro-malting tests indicate that ND20448 has greater kernel plumpness, malt extract, and alpha-amylase activity than Robust. Grain protein and diastatic power of ND20448 are 0.6 percentage units and 11 oL lower than Robust, respectively (Table 8). ND20508 has greater kernel plumpness, malt extract, wort protein, S/T ration, and enzymatic activity than Robust (Table 8). Grain protein of ND20508 and Robust is similar. Table 2. Yield and disease comparisons of FEG 65-02 to three adapted six-rowed barley
varieties. Percent of Robust Entry FHB DON Yield Station years 13 10 6 FEG 65-02 44 54 107 Robust 100 100 100 Stander 142 149 109 MNBrite 79 65 --
Table 3. Malt quality comparisons of FEG 65-02 to three adapted six-rowed barley varieties†.
Barley Alpha- Beta- Entry Plumps protein Extract S/T DP amylase glucan (%) (%) (%) (%) (oASBC) (20o DU) (ppm) Sta. yrs. 5 5 5 5 5 5 5 FEG 65-02 76 13.1 78.6 46.4 153 63.3 287 Robust 86 13.3 78.5 44.7 161 52.9 248 Stander 89 13.0 79.8 52.9 147 83.4 217 Lacey 87 13.3 78.9 46.6 159 64.1 176
†Data courtesy of the USDA-ARS Cereal Crops Research Unit, Madison, WI. Table 4. Yield and disease comparisons of FEG 78-13 to three adapted six-rowed barley
varieties. Percent of Robust Entry FHB DON Yield Station years 19 9 6 FEG 78-13 83 81 110 Robust 100 100 100 Stander 158 149 109 MNBrite 88 65 --

9
Table 5. Malt quality comparisons of FEG 78-13 to three adapted six-rowed barley varieties†. Barley Alpha- Beta- Entry Plumps protein Extract S/T DP amylase glucan (%) (%) (%) (%) (oASBC) (20o DU) (ppm) Sta. yrs. 5 5 5 5 5 5 5 FEG 78-13 88 13.5 79.1 47.7 160 64.3 231 Robust 86 13.7 78.6 44.3 166 52.2 263 Stander 88 13.1 79.7 54.4 145 81.1 238 Lacey 89 13.7 78.9 44.4 169 59.7 193
†Data courtesy of the USDA-ARS Cereal Crops Research Unit, Madison, WI. Table 6. Yield and disease comparisons of ND20448 to Robust and Drummond barley grown in
North Dakota, 2002-2004. Days to Plant Entry DON† heading height Yield (%)‡ (days after 31 May) (inches) (bu/ac) Station years 6 13 12 13 ND20488 77 29 33 85 Robust -- 29 33 82 Drummond 100 28 31 85 †Data courtesy of Dr. Paul Schwarz, North Dakota State University ‡% DON of Drummond Table 7. Yield and disease comparisons of ND20508 to Robust and Drummond barley grown in
North Dakota, 2002-2004. Days to Plant Entry DON† heading height Yield (%)‡ (days after 31 May) (inches) (bu/ac) Station years 8 13 12 13 ND20508 74 29 31 84 Robust 100 29 33 82 Drummond -- 28 31 85 †Data courtesy of Dr. Paul Schwarz, North Dakota State University. ‡% DON of Robust.

10
Table 8. Malt quality comparisons of ND20448 and ND20508 to Robust barley grown in North Dakota, 2002-2003†.
Barley Wort Alpha- Entry Plumps protein Extract protein S/T DP amylase (%) (%) (%) (%) (%) (oASBC) (20o DU) Sta. yrs. 3 3 3 3 3 3 3 ND20448 89 12.4 79.6 5.80 49.2 137 62.2 ND20508 85 12.9 79.6 6.16 49.5 185 66.0 Robust 78 13.0 79.4 5.84 46.1 148 52.3
†Data courtesy of the USDA-ARS Cereal Crops Research Unit, Madison, WI. Literature Cited Belina, K.M., W.J. Wingbermuehle, and K.P. Smith. 2002. Genetic diversity of new Fusarium
head blight resistant barley sources. p. 16. In S.M. Canty, J. Lewis, L. Siler, and R.W. Ward (eds.) Proc. 2002 National Fusarium Head Blight Forum, Erlanger, KY. 7-9 Dec. 2002. U.S. Wheat & Scb Initiative, East Lansing MI.
Dahleen, L.S., H.A. Agrama, R.D. Horsley, B.J. Steffenson, P.B. Scwarz, A. Mesfin, and J.D.
Franckowiak. 2003b. Identification of QTLs associated with Fusarium head blight resistance in Zhedar 2 barley. Theor Appl Genet 108:95-104.
de la Pena, R.C., K.P. Smith, F. Capettini, G.J. Muehlbauer, M. Gallo-Meagher, R. Dill-Macky,
D.A. Somer, and D.C. Rasmusson. 1999. Quantitative trait loci associated with resistance to Fusarium head blight and kernel discoloration in barley. Theor. Appl. Genet. 99:561-569.
General Accounting Office. 1999. U.S. Agriculture: grain fungus creates financial distress
for North Dakota barley producers. GAO/RCED-99-59. U.S. Govt. Printing Office, Washington, D.C.
Horsley, R.D., M.P. McMullen, and J.D. Pederson. 2000. Efficacy of the fungicide Folicur in controlling barley Fusarium head blight in genotypes with partial resistance. In Proceed. 2000 National Fusarium Head Blight Forum. Cincinnati, OH. 4-6 Dec. 2000.
Lamb, K.E. 2005. Genetic diversity, mapping, and heritability studies related to Fusarium head blight resistance in barley. Ph D Diss. North Dakota State Univ., Fargo.
Ma, Z., B. J. Steffenson, L.K. Prom, N.L.V. Lapitan. 2000. Mapping of quantitative trait loci for
Fusarium head blight resistance in barley. Phytopath. 90(10):1079-1088.
Mesfin, A., K.P. Smith, R. Dill-Macky, C.K. Evans, R. Waugh, C.D. Gustus, and G. J. Maeuhlbauer. 2003. Quantitative trait loci for Fusarium head blight resistance in barley detected in a two-rowed by six-rowed population. Crop Sci. 43:307-318.

11
Nduulu, L.M., A. Mesfin, G.J. Muehlbauer, and K.P. Smith. 2004. “High resolution mapping of Fusarium head blight resistance and heading date QTL on chromosome 2H of barley.” In Canty, S. M., Boring, T., Wardell, J. and Ward, R. W. (eds.) Proceedings of the 2nd International Symposium on Fusarium Head Blight; incorporating the 8th European Fusarium Seminar; 2004, 11-15 December; Orlando, FL, USA. Michigan State University, East Lansing, MI. pp. 246-249.
Nganje, W.E., D.D. Johnson, W.W. Wilson, F.L. Leistritz, D.A. Bangsund, and N.M.Tiapo.
2004. Economic Impacts of Fusarium Head Blight in Wheat and Barley: 1993-2001. Agribusiness and Applied Economics Report No. 538. North Dakota State University, Fargo ND.
Pederson, J., and M. McMullen. 1999. Evaluation of fungicides for control of Fusarium head
blight (FHB) in barley. p. 244. In R.N. Reid (ed.) Fungicide and nematicide tests. APS Press, St. Paul, MN
Prom, L.K., B.J. Steffenson, B. Salas, J. Mos, T.G. Fetch Jr., and H.H. Casper. 1996. Evaluation
of selected barley accessions for resistance to Fusarium head blight and deoxynivalenol concentration. p. 764-766. In Scoles and Rossnagel (eds.) Proc. of the Fifth International Oat Conference and VII International Barley Symposium. Univ. of Saskatchewan, Saskatoon, Canada. 30 Jul. - 6 Aug. 1996. University Extension Press, Saskatoon, Saskatchewan, Canada.
Schwarz, P.B., H. H. Casper, and J.M. Barr. 1995. Survey of the occurrence of deoxynivalenol
(vomitoxin) in barley grown in MN, ND, and SD during 1993. MBAA Technical Quarterly 32: 190-194.
Steffenson, B.J. and U. Scholz. 2001. Evaluation of Hordeum accessions for resistance to
Fusarium head blight. P. 208 In S.M. Canty, J. Lewis, and R.W. Ward (eds.): Proc. 2001 National Fusarium Head Blight Forum, Erlanger, KY, 8-10 December 2001. U.S. Wheat & Scab Initiative, East Lansing MI.
Urrea, C.A. 2000. Genetic studies on Fusarium head blight and deoxynivalenol accumulation in
barley. Ph D Diss. North Dakota State Univ., Fargo. Urrea, C.A., R.D. Horsley, B.J. Steffenson, and P.B. Schwarz. 2005. Agronomic characteristics,
malt quality, and disease resistance of barley germplasm lines with partial Fusarium head blight resistance. Crop Sci. (accepted).
Wingbermuehle, W.J., K. Belina, K.P. Smith. 2001. Assessing the genetic diversity of Fusarium
head blight resistant sources in barley. p. 38. In S.M. Canty, J. Lewis, L. Siler, and R.W. Ward (eds.) Proc. 2001 National Fusarium Head Blight Forum, Erlanger, KY. 8-10 Dec. 2001. U.S. Wheat & Scab Initiative, East Lansing MI.

12
Zhu, H., L. Gilchrist, P. Hayes, A. Kleinhofs, D. Kudrna, Z. Liu, L. Prom, B. Steffenson, T. Toojinda, and H. Vivar. 1999. Does function follow form? Principal QTLs for Fusarium head blight (FHB) resistance are coincident with QTLs for inflorescence traits and plant height in a doubled-haploid population of barley. Theor. Appl. Genet. 99: 1221-1232.
Acknowledgements The authors would like to express their thanks to the USDA-ARS US Wheat and Barley Scab Initiative and AMBA for providing support for much of the research presented in this report. Thanks also are expressed to the numerous unnamed individuals at the U of M and NDSU that supplied help in collecting much of the data presented. Finally, the authors would like to recognize the contributions of Dr. Andris Kleinhofs and his lab for developing the molecular marker map for the Foster/CIho 4196 map presented (Figure 3).

13
Management of Barley Diseases in the Upper Midwest R. Dill-Macky, B. J. Steffenson, C. Hollingsworth and K. P. Smith The management of barley disease in the Upper Midwest involves barley researchers in North Dakota and Minnesota; however, for ease of presentation at the Barley Improvement Conference in Charleston, SC in January 2005 we chose to focus on the research efforts in Minnesota. Minnesota has a long and successful history in managing barley disease in barley production and has contributed to the barley industry with the release of cultivars such as Morex, Excel, Robust Stander and Lacey. Research on the management of barley diseases in Minnesota is an integrated program involving research projects in the Department of Plant Pathology and the Department of Agronomy and Plant Genetics. Diseases with an economic impact on barley production in the Upper Midwest include; Fusarium head blight, net blotch, Septoria speckled leaf blotch, stem rust and spot blotch. Fusarium Head Blight (FHB or scab) FHB, caused by Fusarium graminearum and other Fusarium spp., re-emerged as a disease problem on barley in 1993 and has had a devastating impact on barley production in the Upper Midwest over the past twelve years. FHB is currently the most important factor limiting barley production in the Upper Midwest. The upsurge in FHB has likely resulted from multiple changes to production systems including; the widespread adoption of reduced tillage practices for soil conservation purposes, the susceptibility of the prevalent wheat and barley cultivars, the expansion of corn production in the Upper Midwest in combination with weather patterns that have favored FHB development. In addressing the FHB problem, the University of Minnesota has examined chemical control that will provide short term control of FHB and undertaken research on long term solutions to FHB including cultural practices to reduce inoculum and on the development of barley cultivars with improved resistance to FHB. The University of Minnesota evaluates chemicals for the control for FHB in barley, participates in annual uniform fungicide trials (UFT) coordinated by the University of Arkansas. Commercially available and experimental products and several application rates were examined in the 2004 UFT established at Crookston, MN. The Fusarium spp. that incite FHB have a broad host range and are saprophytes in crop residues for majority of their life cycle. The importance of crop residues to the epidemiology of FHB indicates that cultural control practices may provide long-term disease control options for FHB. At the University of Minnesota research has been undertaken examining the effect of crop rotation, residue reduction/destruction, and the elimination of the pathogen in infested crop residues. As with many plant diseases, host genetic resistance is likely to provide the most economic and environmentally sound long-term method of disease control. Over the past ten years, a large effort has been made in developing techniques for the evaluation

14
of host resistance in the greenhouse and field. This research effort has meant that large numbers of breeding lines can now be examined annually for resistance expression. In 2004, over 12,000 plots were examine in field nurseries to assist the breeding program in the development of FHB-resistant barley lines. The sources of resistance to FHB being utilized in the breeding program include; Chevron, Zhedar, Gobernadora, Fredrickson, Atahualpa, AC Oxbow and Hor211. Two advanced lines (FEG 65-02 and FEG 73-13) are candidates for AMBA pilot testing in 2005. Net Blotch Net blotch is caused by the fungus Pyrenophora teres f. teres. The University of Minnesota is working to build new genetic resistance to net blotch. Disease screening is conducted annually in a field nursery at Stephen, MN, which includes both elite and early generation lines. Screening is also conducted on seedling material in the greenhouse. There are numerous sources of net blotch resistance in barley; however, the Minnesota program is working largely with net blotch resistance from Canadian germplasm, especially from the cultivar Heartland. The advanced line M99-106 is a net blotch resistant line and potential candidate for AMBA pilot testing in 2005. Septoria Speckled Leaf Blotch (SSLB) SSLB is a complex incited by Septoria passerinii and Stagonospora avenae f. sp. triticea. Like FHB and net blotch, SSLB is a residue borne disease. The disease can cause substantial crop losses from straw breakage following severe infections. The Minnesota barley improvement program is working to improve the level of genetic resistance in barley to SSLB. PC 84 and CI 4780 are being used as sources of resistance to SSLB. Disease screening is conducted annually in a field nursery at Crookston, MN for both pathogens, which includes both elite and early generation lines. Screening is also conducted on seedling material in the greenhouse. The advanced line SEP2-23 is a SSLB resistant line and potential candidate for AMBA pilot testing in 2005. Stem Rust While stem rust, caused by Puccinia graminis f. sp. tritici (Pgt) and P. graminis f.sp. secalis (Pgs) is a disease that has the potential to devastate barley crops, the disease has done little damage to barley crop in recent years due to the effective deployment of host resistance. The single gene Rpg1, from the cultivar Chevron, has provided durable resistance to the majority of races of Pgt for about 50 years. The only concern with regard to the use of Rpg1 followed the appearance in 1989 of a new race (Pgt-QCC) of Pgt with virulence on Rpg1. Fortunately Pgt-QCC, which built up on winter wheat cultivars in the central US appears to have largely disappeared from the rust population following the withdrawal from production of the susceptible wheat cultivars. Resistance to race Pgt-QCC and Pgs has been identified and is available to the breeding program should it be needed. It is essential, however, that the resistance conferred by Rpg1 is maintained in Midwest germplasm. The University of Minnesota tests breeding material in order to maintain this resistance in the germplasm.

15
Spot Blotch Spot blotch, incited by Bipolaris sorokiniana (teleomorph Cochliobolus sativus), like stem rust does not pose an immediate threat to barley production in the Upper Midwest because of the widespread deployment of host resistance in 6-rowed germplasm. Resistance to spot blotch, derived from ND B112 has provided durable resistance in 6-rowed germplasm for over 30 years. The University of Minnesota screens germplasm to maintain this resistance in Upper Midwest germplasm. Two-rowed barley cultivars do not possess the durable resistance found in six-rowed types and may suffer severe losses during epidemics. Breeding for resistance to barley pathogens remains a major focus of the University of Minnesota barley improvement program; however, chemical and cultural control practices are also being examined where they are likely to provide crop protection. The management of barley diseases is likely to be most effectively achieved using an integrated approach to disease management. Acknowledgements The barley improvement program at the University of Minnesota would like to thank Stephanie Dahl, Amar Elakkad, C. Kent Evans, Yue Jin, Chris Motteberg, Gary Muehlbauer, George Nelson, Bacilio Salas, Ed Schiefelbein, Galen Thompson, Guillermo Valasquez, Karen Wennberg, Jochum Wiersma, John Wiersma. Funding for this research was provided by AMBA, the Minnesota Small Grain Initiative and the U.S. wheat and barley scab initiative.

16
Current Status of Northern Plains Small Grains Genotyping Lab in Fargo, North Dakota Shiaoman Chao USDA ARS Biosciences Research Lab, 1605 Albrecht Blvd, Fargo ND 58105-5674 USDA-ARS Small Grains Regional Genotyping Centers - Introduction The USDA ARS has provided leadership and services for small grains improvement to meet national needs in crop improvement. Current regional ARS labs characterize germplasm, improve end-use quality, and improve resistance to disease and insect pests of wheat, barley and oat. In FY2002, USDA-ARS established four small grains regional genotyping centers located in Pullman, Washington; Fargo, North Dakota; Manhattan, Kansas; and Raleigh, North Carolina. Each lab will work closely with breeders in the West, North Central, Central and East regions of the US, respectively. The main goal of these genotyping labs is to facilitate the use of DNA markers in small grains improvement. A gap exists between discovery of genomic information and its use in practical breeding practices. With the present rapid development of high throughput genotyping technology, the genotyping centers will serve to bridge the gap between mappers and breeders, and develop and implement high throughput genotyping protocols to incorporate marker technology in wheat, barley and oat breeding programs. Northern Plains Small Grains Genotyping Lab in Fargo, ND - Status Report Personnel The Fargo lab planned to hire two scientists to manage the genotyping projects. I joined the lab in October 2003 and a search for the other scientist is still underway. A full-time lab technician search is also currently in process. Laboratory equipment The equipment setup in Fargo lab is adequate at the moment. We have three DNA sequencers for high throughput DNA fragment and DNA sequence analysis. A liquid handling robot can be trained to handle various lab experiments. A leaf tissue grinder that can hold two 96-deep-well plates at the same time will be used to process and extract DNA from large number of leaf samples. We also have a robot that can print microarray slides and pick library clones. A couple of thermocyclers are available in the lab that can fit PCR reaction plates in either the 96-well or 384-well plate format. A liquid handling workstation with 96 micro-tips has been routinely used to manipulate PCR reaction plates, including adding DNA template and multiplexing PCR products. Genotyping projects A few genotyping projects have been initiated with wheat and barley breeders in the Northern Plains region and elsewhere. The DNA markers used in these projects are PCR based microsatellites or SSR markers. The ongoing projects include mapping the pre-harvest sprouting

17
trait in tetraploid durum wheat and association analysis of malting quality traits with SSRs through the use of breeding lines from various breeding programs. Other large-scale genotyping projects are in the planning stage with a focus on implementing and use of DNA markers to assist breeding lines selection. Development of A High Throughput Genotyping Protocol The process of marker-assisted selection (MAS) often requires analyzing thousands of samples from a breeding program in a short period of time. PCR-based DNA markers, which can be readily amenable for large-scale fingerprinting technique, will be the most suitable and efficient marker system to use for the sample screening. The MAS process normally requires four steps, (1) plant DNA extraction, (2) PCR reactions, (3) gel electrophoresis, and (4) data analysis. The Fargo genotyping lab is expected to work with at least 18 breeding programs in the Northern Plains region. The data throughput is estimated to be 300,000 data points per year in order to accommodate all the breeders in this region who intend to apply MAS in their breeding programs. It is suggested that a daily throughput of 1,920 data-points is required to achieve 400,000 data-points in a year. Thus an immediate need for the genotyping lab to come up with a high throughput sample processing protocol is obvious. A PCR-based high throughput genotyping protocol has been developed that employs fluorescent-based genotyping technology using a semi-automated capillary gel system, ABI3100, from Applied Biosystems. The fluorescent detection system has the advantage of enabling multiplexing of PCR products labeled with different fluorescent dyes into a single lane. This technique allows samples to be screened on a large-scale (96-well or 384-well plate format), and greatly increases the data throughput from a single gel run. Each 96-well plate run can yield 384 data points, while each 384-well plate run can yield 1,536 data points. In cases where PCR products have non-overlapping sizes, more than four samples can be pooled and run concurrently. An internal size standard included in each lane will ensure the accuracy in allele size calls using the automated allele-calling algorithms. The following is a detailed description of how this protocol works. Large-scale amplification of PCR-based markers The PCR reaction setup was based on the M13-tailed PCR method (Boutin-Grnache, et al, 2001) after optimization. The protocol requires forward primers to be modified by adding 19 bases of M13 derived sequence to their 5’end. The 19-base M13 primer was labeled with one of the four fluorescent dyes, FAM, VIC, NED and PET. For PCR reactions, 50ng of DNA template was used along with a modified forward primer, reverse primer and M13 primer labeled with one dye added at a molar ratio of 0.15:1:1. The total reaction volume was 10 microliters. The cycling condition was based on published results for particular SSRs. Pooling PCR products Among the four fluorescent dye-labeled M13 primers, PET tends to give weaker signal. When pooling PCR products, a slightly larger volume of PET-labeled PCR products is required in the

18
pool and an equal volume of FAM, VIC and NED-labeled PCR products were added to the pool. This ensured the optimum amount of each PCR product was included in the final pool and the success of genotyping. Semi-automated DNA sequencer The semi-automated genotyping technology using the ABI3100, a 16-capillary gel system, involves three steps, (1) electrophoresis and separation of PCR products, (2) sizing of DNA fragments, and (3) allele binning and calling. Gel electrophoresis - The plates with pooled samples and size standards were loaded on the ABI3100. Each gel run allows 16 samples to be analyzed simultaneously in 40 minutes. One 384-well plate run will take about 20 hr. Sizing of DNA fragments and allele binning and calling - These steps are performed using GeneMapper v3.5 software from Applied Biosystems. For fragment sizing the software detects each peak and matches found peaks to the size standards. The fragment size is called based on the Local Southern method. For allele calling, because of the capillary-to-capillary shift, the software will first group alleles with size differences ranging with 0.8 base (the tolerance level) into a bin and then produce a consensus allele call. For instance, a fragment with a peak at 123.3 bases appearing in one sample and a fragment of 122.8 bases in another sample would be assigned to the same bin and recognized as the same allele fragment with a size of 123 bases. The tolerance level is user specified. Once the tolerance level is determined, allele binning and calling are automatically carried out for all samples from each gel run. During the allele sizing and calling, non-specific or background fragments may be erroneously recognized as possible alleles by the software. Thus manual data editing is required to ensure accurate allele calls. The final edited allele size report can be exported and opened in any spreadsheet software for data archiving. Data Throughput The genotyping protocol described above has been used to process samples both in 96-well and 384-well plates. With the current lab setup we have a capacity to set up PCR reactions in 16 to 20 384-well plates, or run 4 to 5 384-well plates in a week with one person. The approximate data throughput is estimated at 7,000 data points/week/person. Cost Based on the amount of lab consumables used, the estimated cost to generate each data point was between 30 and 40 cents. If cost of labor, primer synthesis and expenses for plant sample preparation were included, the actual cost would be about one dollar per data point.

19
Genotyping Data Management System To facilitate management of genotyping projects established between genotyping labs and their collaborative breeders labs, a management system is currently under development. The back-end of the system is a MySQL based relational database. A common set of protocol will be set up for breeders to submit their genotyping projects. Breeders can enter information regarding types of materials, traits to be genotyped, and upload sample record spreadsheets through a web interface. All the information will be stored in the database so that the files can be retrieved and updated for the subsequent stages of sample processing performed in the genotyping lab. The web access will allow users, both breeders and genotyping lab personnel, to track sample status and genotyping progress. All the genotyping data will be stored in the database for future data query and retrieval. Future Genotyping Protocol Development As stated before, a MAS process will generally require four steps. The detailed genotyping protocol described above has addressed the steps of setting up large-scale PCR reactions, running semi-automated gel system and analyzing data. We are now in the process of developing a protocol to extract plant genomic DNA using a 96-well plate format. As reported previously plant DNA extraction is often the rate-limiting step in the MAS process that requires analyzing thousands of samples in a short period of time (Lange et al., 1998). A quick protocol yielding good quality DNA is crucial to dictate the number of samples that can be processed each day in the genotyping lab. We will explore a few methods, obtained from both published sources and through personal communication, in the coming months. References Boutin-Ganache, I., M. Raposo, M. Raymond and C.F. Deschepper (2001) M13-tailed primers improve the readability and usability of microsatellite analysis performed with two different allele-sizing methods. BioTechniques 31(1):25-28. Lange, D.A., S. Penuela, R.L. Denny, J. Mudge, V.C. Concibido, J.H. Orf and N.D. Young (1998) A plant DNA isolation protocol suitable for polymerase chain reaction based marker-assisted breeding. Crop Sci. 38:217-220.

20
APPLICATIONS OF MICROARRAYS TO BARLEY RESEARCH Gary J. Muehlbauer1, David F. Garvin2, Jayanand Boddu1, Seungho Cho1 1Department of Agronomy and Plant Genetics, University of Minnesota, St. Paul, MN 55108; Plant Science Research Unit, 2United States Department of Agriculture-Agricultural Research Service, St. Paul, MN 55108 INTRODUCTION
The Barley1 Affymetrix GeneChip probe array was developed in 2003 and has provided a new resource for barley geneticists to examine gene expression in barley. This article summarizes the development of the GeneChip and several applications to barley research. The basis of the summary is from a talk given at the Barley Improvement Conference in Charleston, South Carolina in January 2005. Uses of microarray technology
Traditionally, gene expression studies have relied on methods and technologies such as northern blot analysis that examine one to a few genes at a time. In contrast, microarray technology provides the opportunity to examine expression of thousands of genes in parallel. Thus, microarray technology provides an increase of at least three orders of magnitude in the number of genes that can be assessed in a single experiment relative to more classical methods. There are multiple uses of microarray technology in barley including: (1) examining gene expression during abiotic and biotic stresses, (2) high-throughput gene mapping, (3) determining gene expression during developmental processes such as those associated with malting, (4) evaluating tissue-specific gene expression, (5) assessing gene expression differences in defined mutant backgrounds, (6) gene cloning, and (7) marker saturation of genomic regions. Thus, the recent development of the Barley1 GeneChip probe array has provided the barley genetics community a new high-throughput tool to assess gene expression patterns.
Development of Barley1 Affymetrix GeneChip probe array In 2001, a group of U.S. barley geneticists (Andris Kleinhofs, Timothy Close, Roger Wise,
Rod Wing and Gary Muehlbauer) obtained funding from an USDA-IFAFS grant to develop barley microarray technology. After much discussion, it was decided that we fund Affymetrix (Santa Clara, CA) to fabricate a Barley1 GeneChip probe array. The design of the GeneChip was to be based on barley expressed sequence tags. At the time, the U.S. barley genetics groups had generated approximately 65,000 barley ESTs. To develop the most comprehensive and robust GeneChip possible, we sought barley ESTs from international barley genetics groups. Thus, at the 2002 Plant and Animal Genome meeting in San Diego we obtained cooperation from Robbie Waugh (Scottish Crop Research Institute, Scotland), Andreas Graner (Institute of Plant Genetics and Crop Plant Research, Germany), Alan Schulman (University of Helsinki, Finland) and Kazuhiro Sato (Okayama University, Japan) to provide EST sequences. The combined total of the international effort was approximately 350,000 ESTs. Over approximately one year, Tim Close and Roger Wise’s laboratories worked together to condense all barley gene sequences into an exemplary set of sequences to send to Affymetrix to begin fabrication of the GeneChip. The finished product was the Barley1 GeneChip probe array, which represents

21
22,792 barley genes and thus provides the resource to examine transcript accumulation of all of these genes in parallel (Close et al., 2004).
The strong collaborative spirit of the barley international genetics community provided the necessary resources to be the first large-genome crop plant with a custom built GeneChip. Compared to other well-funded crop plants, this is quite an accomplishment. The Barley1 GeneChip has been such a financial success for Affymetrix that they have subsequently developed GeneChips for a variety of other crop plants free of charge.
Details of Barley1 GeneChip probe array The 22,792 genes are represented on the Barley1 GeneChip probe array (Affymetrix, Santa
Clara, CA) in the form of 22,792 probe sets. These probe sets were mostly designed from the last 600 bp of each exemplar sequence (Close et al., 2004). Each probe set consists of 11 pairs of matched and 11 mismatched 25-mer oligonucleotides. The mismatched nucleotide for each pair is always at nucleotide number 13. Hybridization of labeled RNA to the probe sets is determined for specificity to the matched versus the mismatched probes, and raw values for each probe set are provided. The raw values are a numerical representation of the amount of transcript detected from each probe set. These values can be examined with a variety of computer programs and statistical packages to address specific questions relating to gene expression.
Barley1 GeneChip applications
We have focused primarily on using the Barley1 GeneChip to (1) physically map barley genes to chromosomes; and (2) to examine the RNA profiles in barley infected with Fusarium graminearum. RESULTS
High-throughput physical mapping We have developed an approach to utilize wheat-barley addition lines in combination with
the Barley1 GeneChip to physically map large numbers of barley genes to chromosomes. The barley (Hordeum vulgare L.) disomic chromosome addition lines of wheat (Triticum aestivum) were developed through wide hybridization between the hexaploid wheat cultivar Chinese Spring (recipient) and the barley cultivar Betzes (donor) (Islam et al., 1981). These genetic stocks contain the full complement of wheat chromosomes and a single chromosome pair from barley. Disomic addition lines have been developed for six of the seven barley chromosomes including 1(7H), 2(2H), 3(3H), 4(4H), 6(6H) and 7(5H), and wheat-barley ditelosomic addition lines harboring 13 of the 14 barley chromosome arms have been generated (Islam et al., 1981). Our hypothesis was that the transcripts detected in Betzes and the addition lines, but low or no detection in Chinese Spring were derived from Betzes and could be used to designate a barley gene derived from the donor barley chromosome.
We examined transcript accumulation in seedling tissues of Betzes barley, Chinese Spring wheat and wheat-barley chromosome addition lines carrying barley chromosome 2H, 3H, 4H, 5H, 6H, or 7H. We identified 1,010, 1,010, 810, 1,024, 555 and 1,077 (5,486 total) transcripts in the addition lines carrying barley chromosome 2H, 3H, 4H, 5H, 6H and 7H, respectively. Thus, in a single experiment we were able to position 5,486 genes to barley chromosomes. We validated our results by conducting in silico comparisons to the wheat and rice genomes. We

22
found that our physical map positions were highly syntenic with the wheat and rice genomes. Therefore, our results provide a substantial increase in the pool of potential markers for use in marker assisted selection, map-based cloning and for scaffolds for full-genome sequencing. Our results show that the Barley1 GeneChip combined with the wheat-barley addition lines is an efficient method to physically map barley genes. Barley-F. graminearum interactions
We are also using the Barley1 GeneChip to study barley infected with Fusarium graminearum. Fusarium head blight (FHB) of barley, caused by F. graminearum, is a major disease problem for barley growers in the United States and in the barley growing regions of the world (Parry et al., 1995). F. graminearum infection of barley spikes results in the accumulation of trichothecenes such as deoxynivalenol (DON) in the harvested grain. DON accumulation in barley grain results in reduced malting quality. Therefore, we seek to understand the interaction between barley and F. graminearum with the intent to identify genes that provide resistance to FHB. In addition, by examining specialized genetic stocks we will identify markers that are linked to FHB resistance QTL.
We sampled four replications of spikes from the FHB susceptible barley cultivar Morex at 1, 2, 3, 4, and 6 days after F. graminearum and water inoculation. A fifth replication at 1 and 3 days after F. graminearum and water inoculation was also conducted. We used the Barley1 GeneChip to examine RNA profiles from these timepoints during infection. We identified a total of 392 transcripts that were differentially expressed between F. graminearum-and mock (water) inoculated barley spikes at one or more time points between 1 and 6 days after inoculation (dai). The differentially accumulating transcripts were placed into two subgroups. One subgroup of 215 transcripts was identified based on the presence versus absence of transcripts between F. graminearum and mock-inoculated spikes. This subgroup was referred to as qualititatively-induced during infection. The other subgroup of 175 transcripts was identified as significantly induced between F. graminearum- and mock-inoculated barley spikes. This subgroup was referred to as quantitatively-induced during infection. The transcript accumulation from all detected genes was greater in the F. graminearum-treated plants. To validate these transcript accumulation patterns from the GeneChip, we performed RNA gel blot analysis on seven differentially expressed genes. Transcript accumulation data via RNA gel blot analysis were consistent with the GeneChip data.
Using the gene expression profiles identified in the two subgroups, we made four major observations: (1) We identified six predominant transcript accumulation patterns during infection including: induced at 1, 2, 3, 4, and 6 dai; induced at 2, 3, 4 and 6 dai; induced at 3, 4 and 6 dai; induced at 4 and 6 dai; induced at only 6 dai; and induced at only 3 dai. (2) Most of the induced genes were identified at 3 dai, indicating that this is an important host response timepoint. (3) Based on the gene expression patterns, we proposed three major stages of disease progression: an early stage (1 to 2 dai); an intermediate stage (3 dai); and a late stage (4 to 6 dai). These stages provide the theoretical basis for a better understanding of the plant response to infection. (4) We identified genes from the tryptophan biosynthetic pathway that were upregulated. This observation demonstrates a specific biochemical host response to infection.
To identify genes that are involved with FHB resistance, we used the Barley1 GeneChip to examine transcript accumulation during F. graminearum infection in a barley near-isogenic line (NIL) pair carrying resistant and susceptible alleles at the DON resistant chromosome 3H QTL. The DON resistant QTL was identified in the Fredrickson/Stander recombinant inbred line

23
population (Smith et al., 2004). NIL pairs carrying resistant and susceptible alleles at the chromosome 3 (BIN 6) DON QTL were provide by Kevin Smith (University of Minnesota). We identified approximately 70 genes that are differentially expressed in the lines containing the differing alleles at the barley chromosome 3H QTL. These genes may represent a set of genes that are involved with resistance.
In addition, due to the allelic differences in the NIL pairs carrying the resistant and susceptible alleles, it is likely that some of the 70 differentially expressed genes map to the chromosome 3H QTL region. In silico mapping to the rice and wheat genomes of the 70 genes indicates that 24 genes might map to the QTL-containing 3H region of the barley genome. Currently, we are mapping these genes to the barley genome. ACKNOWLEDGEMENTS Support for this research was from grants to GJM and DFG from U.S. Barley Genome Project, and grants to GJM from the U.S. Wheat and Barley Scab Initiative and the USDA-IFAFS. REFERENCES Close, T. J., S.I. Wanamaker, R.A. Caldo, S.M. Turner, D.A. Ashlock, J.A. Dickerson, R.A. Wing, G.J. Muehlbauer, A. Kleinhofs and R.P. Wise. 2004. A new resource for cereal genomics: 22K barley GeneChip comes of age. Plant Physiol. 134: 960-968. Islam, A. K. M. R., K. W. Shepherd, and D. H. B. Sparrow. 1981. Isolation and characterization of euplasmic wheat-barley chromosome addition lines. Heredity 46: 16 l-174. Parry, W.D., P. Jenkinson, and L. McLeod. 1995. Fusarium ear blight 9scab) in small grain cereals – a review. Plant Pathol. 44:207-238. Smith, K.P., C.K. Evans, R. Dill-Macky, C. Gustus, W. Xie and Y. Dong. 2004. Host genetic effect on deoxynivalenol accumulation in Fusarium head blight of barley. Phytopath. 94:766-771.

24
Health Effects of Barley Consumption Joan M. Conway and Kay M. Behall
Diet & Human Performance Laboratory, Beltsville Human Nutrition Research Center, Agricultural Research Center, United States Department of Agriculture
Beltsville, MD 20705 Obesity has reached epidemic proportions within the American population, such that 65% of Americans are classified by the Centers for Disease Control as overweight or obese by the CDC (1). The diseases associated with this epidemic include: type 2 diabetes, cardiovascular disease (heart disease and stroke), osteoarthritis, high blood pressure, some cancers, sleep apnea and gall bladder disease. Furthermore scientists have shown that people with the Metabolic Syndrome, those with at least three of the following risk factors: a large waist, high blood pressure, high triglycerides and cholesterol, low HDL cholesterol, glucose and insulin irregularities, have increased risk for diabetes and cardiovascular disease (2). By necessity resolution of this health crisis in America will require multi-faceted interventions on the national level that focus on the prevention of obesity, the development of effective long-term weight loss strategies, the reduction of risk factors for disease in those who are already overweight, and the prevention of regain of weight in those who have achieved a weight reduction. All of these goals require dietary changes as part of total lifestyle changes. Benefits of consuming grains Consumption of diets high in whole grains has been recommended in the 2005 Dietary Guidelines for Americans (3) and has been reported to have a number of beneficial health effects including reduced risk of cancer (4), cardiovascular disease (5,6), and NIDDM (7,8), which are leading causes of death in the USA. These results have been attributed to the effects of the soluble and insoluble fiber content of whole grain foods on risk factors for these diseases including blood glucose (9), insulin (10), and cholesterol (11,12). Other more general beneficial physiological effects of consumption of whole grains include reduced transit time which may reduce risk of colon cancer (13,14), and reduced rate of absorption of energy containing nutrients (15, 16) which may reduce glucose and insulin responses and risk of obesity (17). Numerous studies have demonstrated that whole grains that are high in soluble fibers, such as beta-glucan, found in oats and barley are more effective in lowering blood cholesterol than those in which fibers are predominantly insoluble such as wheat or rice (18-21). Health claims that consumption of oats or oat products effectively lower blood cholesterol concentrations have been approved by the Food and Drug Administration (22). This claim states that consumption of oats or oat products containing a total of at least 3 grams of beta-glucan per day is necessary to observe a health benefit. Benefits of Barley Consumption – Studies at BHNRC Because cardiovascular disease (1 in 4 people) and diabetes (1 in 18 people) are among the leading causes of morbidity and mortality in the USA, we have focused our research on the ability of soluble fiber from oats and more recently from barley on the expression of the risk factors for these diseases. These factors include fasting plasma

25
lipids, i.e., total cholesterol, triglycerides, the glucose and insulin response to a carbohydrate challenge, and blood pressure. Plasma Lipids Compared to oats, barley has been utilized as the beta-glucan source in few studies. Work conducted in this laboratory (23-28) indicates that consumption of a diet rich in barley results in as great or even greater reduction in plasma cholesterol and other blood lipids. Data from these studies are currently being used as support for an application to the FDA for a health claim for barley similar to that for oats. The long-term studies were conducted in adults who consumed each of the 4 study diets in a random order. The meal plans consisted of 1) the American Heart Association Step 1 diet, 2) a control diet containing 30% fat, 15% protein and 55% carbohydrate with no added soluble fiber (beta-glucan), 3) a moderate beta-glucan diet of 3 grams per day, and 4) a high beta-glucan diet of 6 grams per day. The food used to vary the beta-glucan content of the diets included granola, muffins, spiced cake, cookies, steamed grains, and tabouleh salad. The experimental food products were made with either whole wheat flour or flakes, with a 50/50 mixture of barley and wheat flour or flakes, or barley flour or flakes. Plasma total cholesterol and triglycerides decreased significantly in men with moderate and high beta-glucan intakes from barley and total cholesterol and LDL cholesterol decreased in post-menopausal women (Figure 1). In studies comparing the response of plasma cholesterol and triglycerides to diets rich in oats or barley, barley appeared to be more effective in lowering plasma cholesterol than oats, perhaps because of its higher beta-glucan content.
44.44.85.25.6
66.4
Tot
al C
hole
ster
ol(m
mol
/L)
Men Pre-Women Post-Women
Amer Heart Assoc Control Moderate High
Figure 1. Total cholesterol response to the American Heart Association’s Step 1 diet, to a control diet low in beta-glucan and diets containing moderate and high levels of beta-glucan from barley. Pre-women = pre-menopausal women; Post-women = post-
a a b b
b b
aa
aababab

26
menopausal women. For dietary comparisons, within gender groups, treatments with different letters are different. Plasma glucose and insulin In acute studies where volunteers were fed carbohydrate containing meals the glucose responses to oats, barley, and extracts of both grains were significantly lower than responses to the glucose solution (23). Insulin responses for the barley extract were lowest and were significantly lower than after the glucose solution. Oat and barley extracts retain the beneficial effects of the grains from which they are extracted. Barley, which is high in the soluble fiber beta-glucan, is more effective than standard oats. Barley, as a whole grain or as an extract, can serve as a fat replacer in food products and can provide a useful addition to menus to control plasma glucose responses. The effect of acute barley consumption on post-meal insulin values was similar to that of the other grains tested in that there was a blunted post-meal insulin response in comparison to the response after a glucose load (25). The analyses are ongoing from a long-term study of barley intake on glucose and insulin responses. In a review of the effect of fiber-rich carbohydrates on features of the Metabolic Syndrome, Davy and Melby (29) report that there is ample evidence of the reduction in risk factors for cardiovascular disease and diabetes with a 3 g/day soluble fiber and a total dietary fiber intake of the 20-35 g/day recommendations of the American Dietetic Association. Soluble Fiber Intakes The typical American diet contains less than half the amount of soluble fiber or total dietary fiber recommended to provide health benefits. The median reported total dietary fiber intake for men and women in the U. S. was 17.0 and 13.8 g/d, respectively (30). This is approximately half the level of intake suggested by many health organizations (29) and the National Academy of Sciences, Institute of Medicine’s Dietary Reference Intakes (30). The recommended intake for total fiber for adults 50 years and younger is set at 38 grams for men and 25 grams for women, while for men and women over 50 it is 30 and 21 grams per day, respectively, due to decreased food consumption. It is essential to determine ways to increase intake of total fiber and, especially, soluble fibers. Increasing the intake of whole grain products such as barley would increase both total and soluble dietary fiber in the diet and most likely would result in decreasing the risk factors for disease even in men and women already overweight. Dietary Fiber, Satiety, and Body Weight Regulation Few studies have been conducted on the short or long term effect of the soluble fiber beta-glucan on satiety or the feeling of fullness after a meal. A pilot study (n=11) of the effect on body weight of dietary fiber supplementation to an ad libitum diet for 3 weeks compared a methylcellulose supplement with a pectin/beta-glucan (2:1 ratio) supplement. No significant effect on food intake, assessed by 24 h recalls, or on body weight was found (32). In a position paper for The American Dietetic Association on the health implications of dietary fiber, Marlett et al, (33) provide support to the hypothesis that

27
meals rich in fiber are processed more slowly thereby promoting satiety and potentially reduce overall energy intake. Pereira and Ludwig (34) reviewed the literature on dietary fiber and body-weight regulation and concluded that many short term and epidemiological studies support the role of dietary fiber in body-weight regulation. Further they suggested an increase in fiber intake as a means of preventing obesity in children. They also note that there is a need for further research and for long-term dietary intervention studies. Acute satiety studies A study (Figure 2) is currently underway to test the effect of cooked whole grain barley and a barley or oat extract containing beta-glucan on satiety. Twenty men and women who are at risk for the Metabolic Syndrome have been recruited to consume a “breakfast” test meal of 75 g of glucose or a food product, such as yogurt or whole grain cereal containing different doses of soluble fiber as beta-glucan varying between 0 and 5 grams. Blood glucose and Visual Analogue Scales (VAS) are measured at -¼, 0, ¼, ½, 1, 2, 2½ hours to test hunger, satiety, desire to eat, nausea, drowsiness, etc. A standardized lunch offering of a casserole containing approximately 2000 kcal is fed at 2 hours after the breakfast test meal. Satiety is evaluated based on the VAS results and on the amount of energy consumed at lunch.
Figure 2. The time course of an acute satiety study underway at USDA, ARS< BHNRC, DHPL.
Blood glucose Visual Analogue
Scale
-15 0 15 30 60 120 150 min
Food consumption (A glucose solution or a food such as yogurt or cooked cereal with 0-5 grams of beta-glucan)
Lunch

28
Planned Long-term Studies Future studies will examine the effect of supplementation of the diet in people
who have successfully lost weight with high soluble fiber food items. The metabolic measurements that are planned include resting metabolic rate, body weight, body fat, fasting plasma glucose, insulin, triglycerides and cholesterol, insulin sensitivity, blood pressure, body composition, measures of satiety, and behavioral measures. These studies will be long-term and will take place over a period of time of at least 6 months to one year. Conclusion
Consumption of soluble fiber improves risk factors for cardiovascular diseases and diabetes mellitus. It also provides satiety value. Soluble fiber reduces plasma cholesterol concentrations, lowers postprandial plasma glucose and insulin concentrations and ameliorates insulin resistance. Most research on soluble fiber has focused on oats. Barley, another excellent soluble fiber source, has received little attention. Many forms of barley or barley extracts have not been investigated in human subjects. Thus, research is needed to assess the health effects of human consumption of barley and barley products including germinated barley foodstuff, barley co-products, and barley Nutrim. This paper describes research that uses controlled feeding of human subjects to determine the ability of barely and barley products to affect risk factors for cardiovascular disease and diabetes in normal weight and overweight adults. Moreover, the research will assess the ability of diets high in soluble fiber to aid in weight loss and maintenance of weight-reduced subjects. The proposed research will extend the number of barley products and extracts examined for health benefits. References
1. Centers for Disease Control, National Center for Health Statistics, http://www.cdc.gov/nchs/products/pubs/pubd/hestats/obese/obse99.htm; accessed on February 14, 2005.
2. American Heart Association, http://www.americanheart.org/presenter.jhtml?identifier=4756, accessed on February 14, 2005.
3. Dietary Guidelines for Americans, 2005. http://www.health.gov/dietaryguidelines/, accessed on February 14, 2005.
4. Jacobs DR, Marquart L, Slavin J, Kushi LH. Whole grain intake and cancer: An expanded review and meta-analysis. Nutr Cancer 30:85-96, 1998.
5. Truswell AS. Cereal grains and coronary heart disease. Eur J Clin Nutr 56:1-14, 2002.
6. Rimm EB, Ascherio A, Giovannucci E, Spiegelman D, Stampfer MJ, Willett WC. Vegetable, fruit and cereal fiber intake and risk of coronary heart disease among men. J Am Med Assoc 275:447-451, 1996.
7. Fung TT, Hu FB, Pereria MA, Liu S, Stampfer MJ, Colditz GA, Willett WC. Whole-grain intake and the risk of type 2 diabetes: a prospective study in men.

29
Am J Clin Nutr 76:535-540, 2002. 8. Liu S, Manson JE, Stampfer MJ, Hu FB, Giovannucci E, Colditz GA, Hennekens
CH, Willett WC. A prospective study of whole-grain intake and risk of type 2 diabetes mellitus in U. S. women. Am J Public Health 90:1409-1415, 2000.
9. Hallfrisch J, Behall KM. Mechanisms of the effects of grains on insulin and glucose responses. J Am Col Nutr 19:320S-325S, 2000.
10. Willett W, Manson J, Liu S. Glycemic index, glycemic load, and risk of type 2 diabetes. Am J Clin Nutr 76:274S-280S, 2002.
11. Behall KM, Scholfield DJ, Hallfrisch J. Effect of beta-glucan level in oat fiber extracts on blood lipids in men and women. J Am Col Nutr 16:46-51, 1997.
12. Leinonen KS, Poutanen KS, Mykkanen HM. Rye bread decreases serum total and LDL cholesterol in men with moderately elevated serum cholesterol. J Nutr 130:164-170, 2000.
13. Bruce B, Spiller GA, Klevay LM, Gallagher SK. A diet in whole and unrefined foods favorably alters lipids, antioxidant defenses, and colon function. J Am Col Nutr 19:61-67, 2000.
14. Lupton JR, Morin JL, Robinson MC. Barley bran flour accelerates gastrointestinal transit time. J Am Dietet Assoc 93:881-885, 1993.
15. Bridges SR, Anderson JW, Deakins DA, Dillon DW, Wood CL. Oat bran increases serum acetate of hypercholesterolemic men. Am J Clin Nutr 56:455-459, 1992.
16. Wolever TMS, Vuksan V, Eshuis H, Spadafora P, Peterson RD, Chao ESM, Storey ML, Jenkins DJA. Effect of method of administration of psyllium on glycemic response and carbohydrate digestibility. J Am Col Nutr 10:364-371, 1991.
17. Wisker E, Godau A, Daniel M, Peschutter G, Feldheim W. Contribution of barley fiber to the metabolizable energy of human diets. Nutr Res 12:1315-1323, 1992.
18. Jenkins DJ, Kendall CW, Vuksan V, Vidgen E, Parker T, Faulkner D, Mehling CC, Garsetti M, Testolin G, Cunnane SC, Ryan MA, Corey PN. Soluble fiber intake at a dose approved by the U. S. Food and Drug Administration for a claim of health benefits: serum lipid risk factors for cardiovascular disease assessed in a randomized controlled crossover trial. Am J Clin Nutr 75:834-839, 2002.
19. Onning G, Wallmark A, Persson M, Akesson B, Elmstahl S, Oste R. Consumption of oat milk for 5 weeks lowers serum cholesterol and LDL-cholesterol in free-living men with moderate hypercholesterolemia. Ann Nutr Metab 43:301-309, 1999.
20. Dubois C, Armand M, Senft M, Portugal H, Pauli A-M, Bernard P-M, Lafont H, Lairon D. Chronic oat bran intake alters postprandial lipemia and lipoproteins in healthy adults. Am J Clin Nutr 61:325-333, 1995.
21. Lupton JR, Robinson MC, Morin JL. Cholesterol-lowering effect of barley bran

30
flour and oil. J Am Diet Assoc 94:65-70, 1994. 22. U. S. Food and Drug Administration. Center for Food Safety and Applied
Nutrition. Office of Nutritional Products, Labeling, and Dietary Supplements. Claims that can be made for conventional foods and dietary supplements. CFR 101.81. Appendix C. 2001.
23. Behall KM, Scholfield DJ, Hallfrisch JG. Fasting glucose and insulin and measures of insulin resistance of men after consumption of whole wheat/brown rice or barley. (Abstract). J Am Coll Nutr 21:486,2002.
24. Hallfrisch J, Scholfield DJ, Behall KM. Blood pressure reduced by whole grain diets containing barley or whole wheat and brown rice in moderately hypercholesterolemic men. Nutrition Research 23:1631-1642. 2003.
25. Hallfrisch J, Scholfield DJ, Behall KM. Physiological responses of men and women to barley and oat extracts (Nu-trimX) II. Comparison of glucose and insulin responses. Cer Chem 80:80-83, 2003.
26. Behall, KM, Scholfield DJ, Hallfrisch JG. Comparison of insulin resistance measures in men and women after consumption of whole wheat/brown rice or barley (Abstract). J Am Coll Nutr 23:476,2004.
27. Behall KM, Scholfield DJ, Hallfrisch J. Diets containing barley significantly reduce lipids in mildly hypercholesterolemic men and women. Am J Clin Nutr. 80(5):1185-93, 2004.
28. Behall KM, Scholfield DJ, Hallfrisch J. Lipids significantly reduced by diets containing barley in moderately hypercholesterolemic men. J Am Coll Nutr. 23(1):55-62. 2004
29. Davy BM, Melby CL. The effect of fiber-rich carbohydrates on features of Syndrome X. J Am Diet Assoc 103; 86-96, 2003.
30. Interagency Board for Nutrition Monitoring and Related Research. Third report on nutrition monitoring in the United States. Bethesda, MD: Life Sciences Research Office, Federation of American Societies for Experimental Biology, 1995.
31. Food and Nutrition Board, Institute of Medicine. Dietary reference intakes for energy, carbohydrate, fiber, fat, fatty acids, cholesterol, protein and amino acids (Macronutrients). Washington, D. C. National Academy of Sciences. 2003.
32. Howarth NC, Saltzman E, McCrory MA, Greenberg AS, Dwyer J, Ausman L, Kramer DG, Roberts SB. Fermentable and nonfermentable fiber supplements did not alter hunger, satiety or body weight in a pilot study of men and women consuming self-selected diets. J Nutr 133:3141-3144, 2003.
33. Martlett JA, McBurney MI, Slavin JL. Position of the American Dietetic Association: Health implications of dietary fiber. J Am Diet Assoc 102:993-1000, 2002.
34. Periera MA, Ludwig DS. Dietary fiber and body-weight regulation. Observations and mechanisms. Pediatr Clin North Am 48;969-80, 2001.

31
Malting Barley Quality Panel What Do Brewers Want?
David Lewis, Sierra Nevada Brewing Company Brief Company Overview Sierra Nevada Brewing Co. began at the level of a garage brewery about 25 years ago, and in the ensuing 25 years has grown steadily to its present size of ~600,000 bbls/year. Its roots remain firmly in the ‘craft brewing’ tradition, which for us means the exclusive use of whole hops, two row barley malt (and wheat malt where appropriate), primarily bottle fermentation, and numerous other traditional and somewhat labor intensive production methods. Past Approach to Malt When craft brewing first took hold, there was only one option for malt – the “craft brewer’s blend”, which was primarily Klages. This variety was in fact well received by the brewers at the time, who thought it had excellent flavor characteristics, and Sierra Nevada was no exception. Because of our size and inexperience, we had almost no capability (or perceived need) to regularly control brewhouse efficiency, wort quality, or consistency of raw materials. The fact that we are an all-malt brewery means that we essentially never had fermentation problems caused by insufficient FAN or enzymes, and this perhaps strengthened the tendency towards fewer brewhouse controls. This is not to say the brewery never had fermentation issues – rather that what problems did occur were not related to low FAN or enzymes. However, we were sensitive to any combination of factors that influence fermentability, filterability, physical stability, or flavor stability. Fermentability primarily because of our bottle fermenting process, which means that sluggish fermentations could result in bottles bursting once they have been shipped out to the trade; filterability because in the early days we did not have much flexibility in dealing with filtration problems; physical stability because we filter relatively coarsely, which means physical haze is relatively more likely to form; and flavor stability for all the obvious reasons. The replacement of Klages by Harrington was disconcerting for a couple of reasons: 1) As a brand new brewery, we had never experienced one raw material being replaced by another; 2) There was a shared perception in the craft brewing industry that Klages had superior flavor characteristics. In time, however, we made all the necessary adjustments to the new malt blend, and then moved on to new challenges. The relentless growth we experienced in the first two decades meant that we never had enough breathing space to consider in advance what to do when Harrington reached the point of being phased out (which was inevitable), so when that did happen, it came as yet another surprise. For the major brewers, this natural cycle of change in raw materials is well-known, and they have managed the transitions skillfully for decades. For new brewers, it was (and to some extent still is) a surprise.

32
Present Approach to Malt The first selection criteria for malt is the flavor of the wort and beer. Our products are very characterful – malty, hoppy and estery – and the malt flavor must be of high quality. Other important quality parameters are:
• Low beta glucans • High homogeneity • Resilient husks • Low protein • ‘Adequate’ extract
Extract levels, while important, are not first on the list. Another important area to us (and to all brewers) is the occasional disconnect between malt analyses and actual performance in the brewhouse. This is a well known issue in brewing and malting, and steady progress has been made, but there is still room for improvement. Hand in hand with good malt flavor is the flavor stability of the beer. This is a complex area that is certainly influenced by raw materials as well as process and brewery specific aspects of brewing, fermentation and beer finishing. It is not possible yet to specify a ‘flavor stable’ malt, but much research is being done to identify the factors that contribute to flavor stability, and we think it is conceivable that in the near future these become part of our malt specifications. Obviously much remains to be done in this area, but it seems to us that a good approach would be for brewers and malters to closely cooperate to identify what combination of factors in malting and brewing result in increased flavor stability.

33
Malting Barley Quality Panel What Do Brewers Want?
Malt - The Heart and Soul of Beer
Miller Brewing Company Malt Strategy Susan Kay, Miller Brewing Company
For good reason malt is considered to be the heart and soul of beer. It contributes to and impacts flavor, foam, physical stability, flavor stability, mouthfeel, and color. This makes the development of new malting barley varieties, and the malting of said varieties that meet the needs of brewers, very challenging. This report will provide Miller Brewing Company’s vision for current and future needs for malted barley to enable a very successful supply chain. Miller uses optimized blends of quality 6-row and 2-row malting barley varieties, which are developed using the criteria listed in Table 1. Each malt variety in the blend must be well balanced and properly modified. Additionally, Miller requests malt suppliers to ensure consistency as part of meeting Miller’s malt specifications for quality. Table 1. Performance Criteria used to Evaluate Malt
Optimal brewhouse performance
Predictable, consistent fermentation performance Desired beer aroma and flavor profile Target analytical parameters of beer
The AMBA Ideal Barley Breeding Guidelines revised by the AMBA Technical Committee in December 2004 are listed in Table 2.

34
Table 2.
These guidelines meet the needs of Miller Brewery Co. with two exceptions. The Diastatic Power (DP) and Alpha Amylase levels as listed show no upper limit, implying that no DP or alpha amylase levels are too high. DP is listed at >140 ASBC units for 6-row and >120 ASBC units for 2-row malted barley, while Alpha Amylase is listed as >45 DU. This does not reflect Miller’s requirements. Malt with DP values in the range from about 145 to 155 ASBC units, and alpha amylase values from 45 to 55 DU perform optimally with Miller’s current processes, product portfolio, and equipment. These enzymes are critical in mashing as the stage is set by their activities for the ratio of fermentable to non-fermentable sugars, ultimately determining the amount of ethanol and real extract in finished beer. Time and temperature are the only tools that brewers have to control the mashing step, and there are limits as to how much these tools can be utilized. The preferred variety for Miller, with respect to enzyme levels, DP and alpha amylase, continues to be Robust or Robust-like varieties such as Lacey. It is important to note that even Robust has created challenges for Miller brewers, as DP levels have risen in Robust over time. Stander, Legacy, Tradition and Drummond, with their high enzyme packages, do not fit the Miller malt
Two-Row Barley Six-Row BarleyBarley Factors
Plump Kernels (on 6/64), % > 90 >80 Thin Kernels (thru 5/64), % < 3 < 3 Germination (4ml- 72 hr. GE), % > 98 > 98 Protein, % 11.0-13.0 11.5-13.5 Skinned & Broken Kernels, % < 5 < 5
Malt Factors Total Protein, % 10.8-12.8 11.3-13.3 On 7/64 screen, % > 70 > 60
Measures of Malt Modification Beta-Glucan, ppm <100 <120 F/C Difference <1.2 < 1.2 Soluble/Total Protein 40-47 42-47 Turbidity, NTU < 10 < 10 Viscosity, absolute cP < 1.50 < 1.50
Congress Wort Soluble Protein, % 4.4-5.6 5.2-5.7 Extract (FG, db), % >81.0 >79.0 Color, °ASBC 1.6-2.2 1.8-2.2 FAN, mg/L >180 >190
Malt Enzymes Diastatic Power, °ASBC >120 >140 Alpha Amylase, DU >45 >45
MALTING BARLEY BREEDING GUIDELINESIDEAL COMMERCIAL MALT CRITERIA
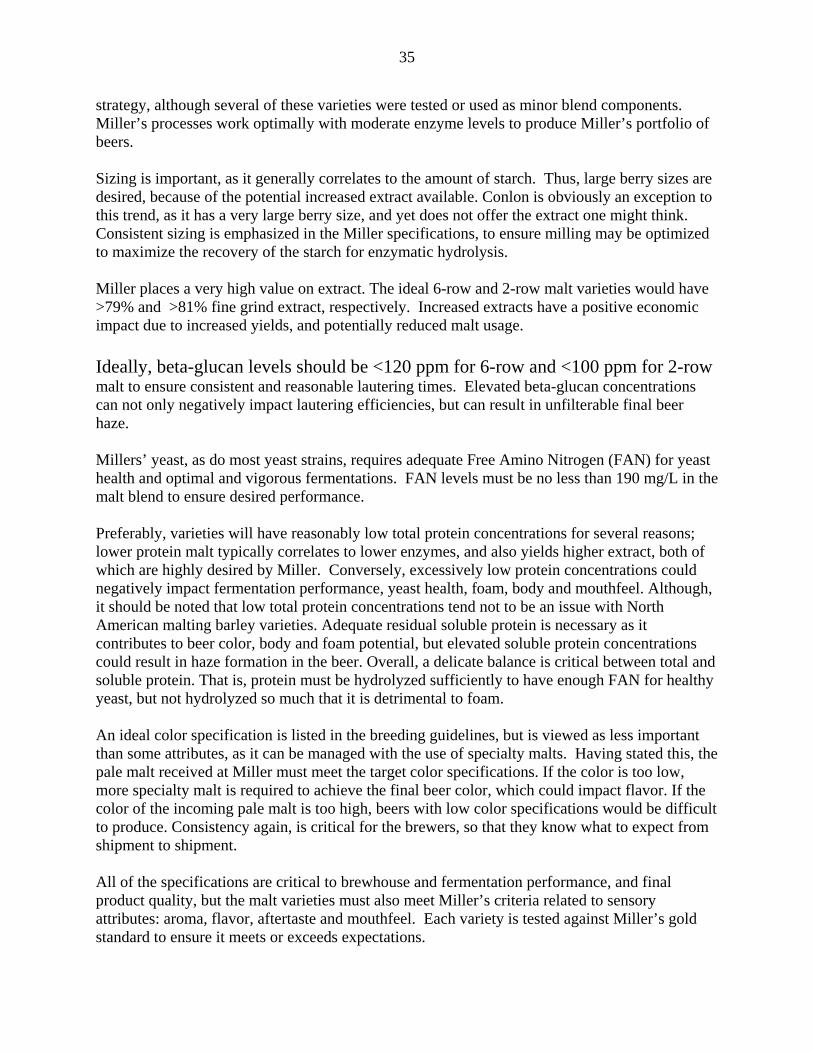
35
strategy, although several of these varieties were tested or used as minor blend components. Miller’s processes work optimally with moderate enzyme levels to produce Miller’s portfolio of beers. Sizing is important, as it generally correlates to the amount of starch. Thus, large berry sizes are desired, because of the potential increased extract available. Conlon is obviously an exception to this trend, as it has a very large berry size, and yet does not offer the extract one might think. Consistent sizing is emphasized in the Miller specifications, to ensure milling may be optimized to maximize the recovery of the starch for enzymatic hydrolysis. Miller places a very high value on extract. The ideal 6-row and 2-row malt varieties would have >79% and >81% fine grind extract, respectively. Increased extracts have a positive economic impact due to increased yields, and potentially reduced malt usage. Ideally, beta-glucan levels should be <120 ppm for 6-row and <100 ppm for 2-row malt to ensure consistent and reasonable lautering times. Elevated beta-glucan concentrations can not only negatively impact lautering efficiencies, but can result in unfilterable final beer haze. Millers’ yeast, as do most yeast strains, requires adequate Free Amino Nitrogen (FAN) for yeast health and optimal and vigorous fermentations. FAN levels must be no less than 190 mg/L in the malt blend to ensure desired performance. Preferably, varieties will have reasonably low total protein concentrations for several reasons; lower protein malt typically correlates to lower enzymes, and also yields higher extract, both of which are highly desired by Miller. Conversely, excessively low protein concentrations could negatively impact fermentation performance, yeast health, foam, body and mouthfeel. Although, it should be noted that low total protein concentrations tend not to be an issue with North American malting barley varieties. Adequate residual soluble protein is necessary as it contributes to beer color, body and foam potential, but elevated soluble protein concentrations could result in haze formation in the beer. Overall, a delicate balance is critical between total and soluble protein. That is, protein must be hydrolyzed sufficiently to have enough FAN for healthy yeast, but not hydrolyzed so much that it is detrimental to foam. An ideal color specification is listed in the breeding guidelines, but is viewed as less important than some attributes, as it can be managed with the use of specialty malts. Having stated this, the pale malt received at Miller must meet the target color specifications. If the color is too low, more specialty malt is required to achieve the final beer color, which could impact flavor. If the color of the incoming pale malt is too high, beers with low color specifications would be difficult to produce. Consistency again, is critical for the brewers, so that they know what to expect from shipment to shipment. All of the specifications are critical to brewhouse and fermentation performance, and final product quality, but the malt varieties must also meet Miller’s criteria related to sensory attributes: aroma, flavor, aftertaste and mouthfeel. Each variety is tested against Miller’s gold standard to ensure it meets or exceeds expectations.

36
The desirable, ideal quality traits for Miller malt are summarized in Table 3. Table 3. Ideal Quality Traits for Miller Brewing Company
Well-Modified and Balanced High Extract
Moderate Enzyme Package Low Beta-Glucan Concentration
High FAN Acceptable Flavor Potential
References 1. The Practical Brewer: A Manual for the Brewing Industry (2nd Edition). MBAA. Editor H.
M. Broderick. 1977 2. Malting and Brewing Science: Volume 1: Malt and Sweet Wort (2nd Edition). D.E. Briggs,
J.S. Hough, R. Stevens and T.W. Young. 1981

37
Malting Barley Quality Panel “What Do Brewers Want?”
Joseph D. Hertrich, Anheuser Busch, Inc.
When considering the question “What do Brewers Want?“ lets answer two other basic questions first,
• What does malt contribute to brewing? • How does malting convert barley to malt to meet the malt contribution
requirements of brewing? Then we can come back to the panel question and refine it to ”What do Brewer’s Want in a barley variety?” All maltsters and brewers will agree on the following list of contributions that malt makes to the brewing process and product,
• Source of carbohydrate • Source of enzymes to reduce starch to sugar • Source of soluble protein • Source of enzymes to further simplify protein • Source of beer color • Source of beer flavor
If we look beyond the obvious requirements that each individual brewer has to meet for his own product goals for appearance and taste, we can then examine what are the brewing process basics that are really important to be met, Brewers must:
• Recover carbohydrate extract • Convert extract first to fermentable sugar, and then on to alcohol • Manage a healthy fermentation
So which of the malt attributes are the real enablers for these brewing process basics, • Well modified and free flowing carbohydrate extract
• Efficiency of recovery in the brewhouse • Availability to enzymes for conversion
• Carbohydrate reducing enzymes • RDF achievement
• Adequate distribution of soluble protein • FAN for yeast nutrition

38
Where do these malt attributes come from. Are they intrinsic in barley regardless of malting, are they developed only during barley modification by the malting process, or should they be considered outcomes of the modification process? Here is one view of how these attributes could be categorized.
Barley Based Attributes
Sizing Assortment Total Protein Modification Potential
Modification Indicators
CHO
C/F Ratio Viscosity Beta glucan Friability Turbidity
Protein S/T ratio Alpha Amylase pH
Modification and Kilning Outcomes
Extract Soluble Protein FAN Color Diastatic power
If we accept this categorization of malt attributes, we can next assign the accountability for at what point in the barley development process, the management of the malting process, or brewers variety selection and malt specifications should these attributes be managed.
Barley Breeders Production Agriculture
Breeding for variety driven modification balance – CHO to Protein Manage barley production and distribution of Total Protein Sizing Assortment
Maltsters Malting Process
Comprehensively modify the barley selected, CHO first, protein second Kiln for flavor optimization
Brewers Variety Selection and Blend
Management Extract Soluble Protein FAN Color Diastatic power
What is our point of this categorization and assignment of the accountability for malt attributes? It is to clearly establish the pathways from barley through the malting process to the optimization of most important malt attributes that are required by the brewer. We would state it this way.

39
The maltster’s responsibility is to comprehensively convert the barley provided, regardless of the specific outcomes.
• He cannot change the physical attributes of the barley entering the malt plant • He should not reshape outcomes by interfering with the natural modification
profile of a variety The brewer’s responsibility is to manage the outcomes of comprehensive modification through specifications, variety selection or blend management.
• Malt specifications should not force a maltster to alter the natural modification profiles and required outcomes
• If you don’t like the malting outcome, change the variety or the blend, not the malting process
When we apply these concepts to the key brewing process enablers, we see that outcomes do not always fit the traditional expectation. For example, it has always been expressed that total protein level and grain sizing are the critical drivers for malt extract. In reality, modification level is a more important factor in developing well modified and free flowing carbohydrate extract. Fig 1 is a summary of over 1200 Harrington kilns. The population was divided into three groupings of lower, mid, and higher extract levels. As expected, protein levels are lower as extract increased, but not expected by traditional thinking is that plumps are identical across all populations. Beyond protein, extracts are increasing as modification indicators improve, specifically increasing Kolbach ratios and declining F/C differences. Low Extract
CGas Moderate Extract
CGas High Extract
CGas Extract CGas 74.6 76.1 77.3 Malt Protein 12.8 12.5 12.2 Wort Protein 5.4 5.4 5.4 S/T 42.2 43.2 43.7 FAN 210 210 210 Plumps 94 93 94 Viscosity 1.41 1.41 1.43 F-C Difference 1.2 1.0 0.8 β-glucans 117 121 126
Figure 1 – HARRINGTON OFF KILN

40
Fig 2 examines 700 B1202 kilns. The same observations regarding extract, plump, and modification can be made. Additionally, it can be seen that the modification levels that release extract are different between the varieties. The concept of balanced modification can be seen on this data set. Carbohydrate modification must be completed in balance with protein modification. B1202 is an example of a variety where protein modification lags behind carbohydrate modification. In the data set, adequate carbohydrate modification can be achieved in B1202 with a low Kolbach ratio and resultant lower FAN levels. Although enzymes are not included in this data set, it can be shown the B1202 enzymes are traditionally lower than Harrington. For some brewers, this lower soluble, lower FAN, and lower enzymes represent attributes that are not appropriate for their blend.
Low Extract CGas
Moderate Extract CGas
High Extract CGas
Extract CGas 74.5 75.4 76.3 Malt Protein 12.5 12.2 12.2 Wort Protein 5.0 5.0 5.0 S/T 39.8 40.7 41.4 FAN 184 191 201 Plumps 94 94 94 Viscosity 1.46 1.45 1.46 F-C Difference 1.3 1.2 1.1 β-glucans 124 115 126
Figure 2 – B1202 OFF KILN After looking at these two data sets, we would reach some conclusions about extract.
• Modification releases (creates) free flowing extract • High plumps will not guarantee high extract • Higher modification does not always consume extract as a negative
consequence • CG mashing is still important in malt evaluation
Looking at another key brewing process enabler, the ability to achieve Real Degree of Fermentation (RDF) in the brewhouse. When investigating drivers for RDF, emphasis has been primarily placed on levels of diastatic power and alpha amylase in malt. But it can be shown that degree of modification as measured by higher Kolbach and by lower viscosity are more important attributes toward the achievement of RDF than the absolute levels of enzyme present in the malt. That leads us toward some conclusions about modification and RDF achievement.
• Well modified and free flowing extract allows the enzymes that are present to be more functional

41
• Degree of modification is as important as the absolute levels of diastatic power
and alpha amylase Accepting these observations, let’s get back to the panel question, “What Do Brewers Want?”. Specifically, how do we translate this knowledge into the breeding and the selection of new barley varieties.
• Capacity to modify is critical • A balanced modification profile between carbohydrate and protein is even more
critical Fig 3 is a summary of six row malting barleys in use over the past several years. It can be noted that on most of the new varieties introduced in the 1990s, to reach an effective carbohydrate modification, the barley required a higher level of protein modification to make the malt functional. This condition was called “hot”, but maybe the condition should be redefined as having an unbalanced modification profile. Unbalanced defined as when carbohydrate modification reaches the desired level of low viscosity and low beta glucan, protein modification as measured by Kolbach and FAN is not on target. An Excel, Stander, and/or Legacy type require their Kolbach indexes to proceed to the higher 40’s to achieve lower viscosities and beta glucans.
Robust Morex Excel Stander Legacy Lacey Tradition Ext FGdb 78.6 78.2 79.2 79.8 79.0 78.0 79.4 Malt Pro 12.9 12.8 12.4 12.1 12.5 12.9 12.5 Wort Pro 5.5 5.4 5.7 5.8 5.6 5.4 5.3 S/T 42.5 42.0 46.2 47.9 44.9 42.0 42.0 FAN 204 204 221 237 215 188 215 On 7/64 63 45 65 44 58 63 66 Viscosity 1.41 1.50 1.41 1.49 1.42 1.40 1.44 F-C Diff 1.0 1.0 1.0 .9 .9 .8 1.0 Β-glucans 112 147 109 156 101 65 90
Figure 3 – Six Row Malting Varieties Extracts certainly advanced in these newer varieties as the protein modification advanced, but some brewers did not like the higher protein modification outcomes – higher soluble protein, higher enzymes, and higher color. In contrast, most new varieties in the 2000s, Tradition and Drummond would be examples, effective carbohydrate modification does not require a higher level of protein modification to make the malt functional. These would be defined by some brewers as less “hot”, but maybe they should be redefined as having a balanced modification – carbohydrate to protein. These varieties appear to represent a move back toward the modification balance of Morex and Robust. The ability to achieve good carbohydrate modification without exceeding 42-43% Kolbach ratio is important when considering dry land production barley that goes up to a 13.5% total protein level.

42
Lacy possibly represents a barley with a slightly unbalanced modification in the other direction. It appears to be able to achieve effective carbohydrate modification without really reaching adequate protein modification. To some brewers, this variety will not fit their profile because the resultant malt will generally have lower soluble protein, lower FAN, and lower alpha amylase. Other brewers find this moderation of protein modification attributes quite desirable. Fig 4 is a summary of two row malting barleys over the same period. The same comments regarding the balance between carbohydrate modification and protein modification that were made in reviewing six rows can be made here.
Harrington B1202 Merit Conrad Metcalfe Ext FGdb 80.2 80.2 81.4 80.7 79.8 Malt Pro 12.4 12.0 11.6 12.1 12.2 Wort Pro 5.4 4.9 5.4 5.4 5.6 S/T 43.3 40.9 46.2 44.2 45.5 FAN 212 185 219 218 215 On 7/64 73 82 75 83 80 Viscosity 1.42 1.46 1.41 1.42 1.40 F-C Diff 1.0 1.1 .9 .9 .7 Β-glucans 121 124 115 107 60
Figure 4 – Two Row Malting Varieties Again, it can be noted that on Merit, effective carbohydrate modification requires a higher level of protein modification to make the malt functional. B1202 represents unbalanced modification in the other direction. This variety can achieve effective carbohydrate modification without really reaching adequate protein modification – always has been low soluble, FAN, enzymes and color. Conrad and Metcalfe appear to have a similar modification balance as Harrington.
Summation and Look Ahead If we accept this view that modification potential, and that the modification balance between carbohydrate and protein, are barley variety traits, we can reach some conclusions on one approach to evaluating new barley variety candidates from breeding programs.
• Do not focus on the absolute outcome numbers, focus on the modification factors and the modification balance between carbohydrates and protein
• There is no such thing as a “hot” variety, nor a high soluble variety, nor a high beta glucan variety, but there are varieties that are not balanced in their modification potential and there are varieties that will not provide balanced outcomes in production agriculture when taken up to 13.5% total protein maximum
• Varieties should achieve complete carbohydrate modification while the protein modification is between 42 and 44 S/T ratio

43
• Varieties should achieve adequate alpha amylase and FAN at the 42-44 S/T ratio range
• Varieties should achieve improved agronomic performance at 12.5%-13.0% total protein, not 13.5%.
• Brewers and Maltsters may have to optimize current varieties by capping barley specifications at 12.5% or 13.0% total protein, not the current 13.5%

44
Barley Insect Research at the USDA-ARS Plant Science Research Laboratory
David R. Porter, Dolores W. Mornhinweg, and Gary J. Puterka
USDA-Agricultural Research Service Plant Science Research Laboratory
1301 N. Western Rd. Stillwater, OK 74075-2714
The USDA-ARS Plant Science Research Laboratory at Stillwater, Oklahoma houses the Wheat, Peanut and Other Field Crops Research Unit. The lab is located on the north side of the main campus of Oklahoma State University. It was built on OSU property in 1980 and occupies this land through a long-term lease arrangement. Given the proximity to OSU, our scientists have close working relationships with OSU faculty and have developed many collaborative research projects that benefit both institutions.
Fig. 1. USDA-ARS Plant Science Research Laboratory, Stillwater, Oklahoma The mission of the Wheat, Peanut and Other Field Crops Research Unit is to provide wheat, peanut, sorghum, and barley producers with new technologies to protect their crops from insect pests and diseases. Our research programs produce alternatives to chemical pesticides to control insects and diseases. These alternatives include genetically resistant crop plants and biological control of insect pests using their natural enemies. These technologies, and others, are integrated into a package of pest management tactics for low-input sustainable cropping systems. Reducing crop producer’s dependence on chemical pesticides increases productivity and decreases the cost of agricultural production. This is good for the producer, the consumer, and the environment.
Organizationally, we are composed of three separate CRIS research projects: (1) Genetic Improvement of Insect Pest Resistance in Wheat, Barley, and Sorghum, (2) Biorational Cereal Aphid Management, and (3) Improvement of Disease Resistance and the Quality of Peanuts. We

45
have a total of nine scientists and nine technicians working in the research unit. Three scientists and technicians are assigned to Genetic Improvement CRIS project, four of each are assigned to the Biorational CRIS project, and two of each are assigned to the Peanut CRIS project.
CRIS Project Scientists assigned Genetic Improvement of Insect Pest Resistance in Wheat, Barley, and Sorghum
Dr. David Porter, Dr. Dolores Mornhinweg, Dr. Yinghua Huang
Biorational Cereal Aphid Management Dr. Norm Elliott, Dr. Gary Puterka, Dr. John Burd, Dr. Kevin Shufran
Improvement of Disease Resistance and the Quality of Peanuts
Dr. Hassan Melouk, Dr. Kelly Chenault
The objectives of the research unit are to: identify new sources of genetic resistance to insect pests (Russian wheat aphid, greenbug, and bird cherry-oat aphid) in wheat, barley, sorghum, and related species; determine the genetic diversity and genetic control of resistance to insect pests in wheat, barley, and sorghum; develop improved wheat, barley, and sorghum germplasm with genetic resistance to insect pests.
The approach utilized to accomplish these objectives is to search available germplasm collections to find new, effective sources of resistance to virulent aphid pests in wheat, barley, and sorghum. The genetic diversity and genetic control of resistance will be characterized, and resistance genes will be transferred into adapted genetic backgrounds. Molecular markers of aphid resistance genes will be developed for use in marker-assisted selection protocols. The project will work closely with collaborating plant breeding programs to obtain elite breeding lines to use as parents in backcrossing procedures to transfer aphid resistance genes. The resultant aphid-resistant germplasm will be field-tested for agronomic and quality performance prior to release. The project will provide testing and selecting support to assure these aphid resistance genes move through the various breeding programs on their way to the producers via cultivar and hybrid releases.
Dr. Dolores Mornhinweg, who is within the Genetic Improvement CRIS project, is responsible for all aspects of barley insect pest resistance, and devotes 100% of her time to barley improvement. Dr. David Porter, also within this CRIS project, carries an ongoing, albeit much smaller, effort on barley improvement. Time devoted to barley improvement by Dr. Porter varies from perhaps 5 to 10%. The bulk of his time is devoted to wheat pest resistance research and administrative duties associated with his position as research leader for the unit.
Dr. Gary Puterka, research entomologist, was recently hired to fill a newly created position with responsibilities to establish a research project which focuses on monitoring, collecting, characterizing, and testing for new virulent aphids in populations within the U.S. and from around the world. The objective is to identify new virulent aphids before they attain economic pest status. As these new virulent aphids are identified, proactive screening and testing for new sources of plant resistance can begin to assist the plant breeding programs. This new research project was made possible through the efforts of the National Barley Improvement Committee to obtain new permanent funding from Congress. Dr. Puterka will work closely with the barley improvement team to address needs arising from the occurrence of new damaging biotypes of Russian wheat aphid and their impact on the development of resistant barley germplasm and cultivars.

46
When the NBIC first set out to obtain new funding for this project, only one source of virulence within RWA was known in field populations. Since then, at least three new biotypes have been detected in samples taken from Wyoming, Colorado, and Texas. A biotype, as defined here, is a new form of RWA that can damage crop plants that were bred to be resistant to the original pest population. The occurrence of new biotypes poses a particularly serious challenge to plant breeders who have spent a lot of time and other resources developing genetically resistant plants.
While these new RWA biotypes were collected from fields of wheat and barley, early tests indicate that they are only able to differentially damage sources of resistance in wheat. This is a major setback for wheat breeders, especially in Colorado where the RWA is a major perennial threat to wheat production. Fortunately, all of the resistant barleys developed by Dr. Mornhinweg appear to retain their resistance when tested against these new RWA biotypes. The occurrence of these new RWA biotypes reveals that there is now a potentially high level of genetic diversity within the populations throughout the Great Plains. This is a troubling development in that the aphid, which was presumed to be stable for the last 15 years, may now also be able to develop the ability to exploit new environmental habitats, in addition to its ability to develop new virulence traits. If this happens, migration to areas outside its present range may result in infestations in crop production areas where the RWA has not previously been an economic pest problem.
Other pest targets under research are the greenbug and bird cherry-oat aphid (BCOA). The greenbug is a perennial source of damage to small grains grown in the southern Great Plains. New interest in barley production in this area is being generated by the prospect of utilizing barley in the production of ethanol for use as a biofuel. Given the prevalence of the greenbug in the central and southern Great Plains, and its ability to cause great damage to barley, research has intensified to identify and deploy effective greenbug resistance genes in barley. Currently, there are two resistance genes in barley that provide good levels of protection against most biotypes. Our recent research efforts have resulted in the identification of new sources of resistance in barley to the very virulent greenbug biotype G. These new sources of resistance were actually found in some common barley cultivars, such as ‘Wintermalt,’ ‘Bancroft,’ and ‘Colter.’
Work is ongoing to refine a seedling bioassay for BCOA resistance in barley. Dr. Mornhinweg has established a testing protocol utilizing nonviruliferous aphids that is very effective in killing all seedling barley entries within a short period of time. This protocol will be modified accordingly and then used on a larger pool of barley accessions to begin the search for resistance to BCOA feeding damage in seedling plants.
Our list of products developed is growing. Recently, the first RWA resistant barley variety was released to growers. ‘Burton’ is a RWA resistant 2-rowed spring feed barley jointly developed with ARS-Aberdeen, and co-released with Colorado State University, University of Nebraska, University of Idaho, and New Mexico State University. Two more varieties of RWA resistant feed barleys are to be released soon. These originated from specific requests from eastern Colorado growers for a RWA resistant replacement to the popular ‘Otis’ variety grown throughout the region, which was displaced by the RWA.
The scientists and staff at the USDA-ARS Plant Science Research Laboratory, Stillwater, Oklahoma enjoy and value our relationship with AMBA and NBIC. We look forward to working with the barley community to provide needed research products to growers and others in the industry. In our ongoing effort to be responsive to your needs, we welcome any comments or

47
suggestions you may have about our programs or for research needs that you feel should be addressed.
Please visit our Internet website at: http://www.ars.usda.gov/main/site_main.htm?modecode=62-17-15-00

48
ARS Barley Research at Aberdeen Progress in Research & Product Development, Facilities, and Goals
Phil Bregitzer, USDA-ARS National Small Grains Germplasm Research Facility
1691 S. 2700 W., Aberdeen, ID 83210 [email protected]
Since the last BIC conference, ARS-Aberdeen has much to report, both with respect to research products and with respect to an expansion of our capabilities and opportunities to serve producers, industry, and consumers. Expansion of our facilities, staffing, and research goals is underway. Ultimately these changes will expedite the development of information and products useful to US agricultural interests. It is not possible to adequately cover the details in a short presentation, so I encourage anyone with questions to contact any of our scientists directly. Please feel free to contact any of us individually for details; our web page is a convenient link to us: http://www.ars.usda.gov/main/site_main.htm?modecode=53-66-00-00.
We have had the good fortune to receive funding for a major expansion of our Aberdeen laboratory and greenhouse facilities. $4.57 million has been appropriated for a 12,000 sq. ft addition that will house six new laboratories, various spaces for major and shared laboratory equipment, office space for scientists and technical staff, and a conference room. Design of the facilities is complete, and groundbreaking is expected to begin this year. Already in progress is a separate, $400,000 35' x 80' greenhouse addition, which will effectively increase our greenhouse growth facilities by 50%. We expect to begin use of this facility this spring.
We have also gained facilities by expanding our work to include a component of aquaculture: specifically, trout growers are interested in developing diets which rely heavily on agricultural sources of energy, and we are working to make sure that barley is a useful component of future aquaculture rations. We are working with a team of ARS and University of Idaho personnel located in Hagerman, Idaho. This location is in South Central Idaho on the Snake River, a region that is home to many springs--both hot and cold--and a thriving aquaculture industry whose produce includes trout, sturgeon, catfish, tilapia, and alligator. More than half of the US trout production comes from this region.
Critical to our mission is access to barley germplasm with variability for key traits--such as pest resistance, productivity, and quality. At Aberdeen we have exceptional access to barley germplasm. The National Small Grains Germplasm Collection (NSGC) and the Hordeum Genetic Stocks Center are housed at Aberdeen, and are comprised of over 30,000 accessions of cultivated barley and wild relatives. Harold Bockelmen, An Hang, and Mike Bonman have major responsibilities for work with these materials. These are "working" collections, meaning that samples of the accessions are available on request to barley researchers worldwide, with the exception of a few protected varieties. The collection is also working in the sense that it is continually being evaluated and reevaluated for sources of variability to meet new needs with respect to pest resistance, quality traits, or other characteristics of interest. Furthermore, work to better understand the nature of the materials in the collection is ongoing. For instance, identification of the geographic locations from which variability for Russian wheat aphid (RWA) resistance or stripe rust resistance is derived may guide future collection efforts that have the objectives of identifying novel sources of resistance to these threats.

49
Our germplasm is probably best known to this audience in the form of our released cultivars. The process of cultivar development is a long one, and some of what I show you today was initiated by Darrell Wesenberg, retired ARS barley breeder. This is certainly the case with two of our current cultivar releases--the winter malting barley variety 'Charles', and the spring malting barley line 90AB241 (to be named). Don Obert has completed the process of bringing these new cultivars forward for release in 2005, and will present more information concerning the winter barley malt breeding program in the next presentation. We have also released--in 2004--the RWA-resistant feed cultivar 'Burton'. Named in honor of Dr. Bob Burton, one of the ARS researchers that helped organize the effort to screen the NSGC for RWA resistance, the development of Burton was a cooperative project involving ARS scientists from Aberdeen and Stillwater, and University personnel from Idaho, Colorado, New Mexico, and Nebraska.
Critical to future cultivar releases is our continual work to add useful characteristics to our base of elite barley germplasm. An Hang, Dave Hoffman, and I have major responsibilities in this area, but we work closely with Don Obert and Mike Bonman as we move germplasm into the cultivar development stream. In particular, we are concentrating on three areas. One major area concerns reducing seed phytate, which is the major storage form of seed phosphorus and which is not digestible by monogastric animals. It also is considered "antinutritional", in that is an effective chelator of divalent mineral cations). The development of low phytate feed barleys is expected to contribute to better animal growth, and a reduction of agricultural phosphorus entering the environment--which is of particular concern to the aquaculture industry as they work to meet phosphorus effluent limits.
Another area of great interest is the development of barleys with specific levels of beta-glucan. For certain feed applications, industry desires barley with moderate or even low levels (4% or less), whereas for human nutritional needs very high levels (8-9%) are desired. High beta-glucan barleys are sought by industry, as these barleys can be fractionated to provide a number of different products, including high-value purified beta-glucan fiber.
We have a renewed interest in hulless barley, also a response to the needs of the aquaculture industry. Processing hulless, versus hulled, barley is greatly preferred by the aquaculture feed industry, and it may be a preferred ingredient for industrial production of barley grain products such as ethanol and purified beta-glucan fiber. The development of high and low beta-glucan barleys, with and without the low phytate trait, is receiving a great deal of attention in our germplasm development program.
One other area of research--in addition to cultivar and germplasm development--is what I will describe as "supporting genetic research". I don't have the timeto list all of the ongoing work that fits into this category, but suffice it to say that this area covers all of the basic genetic research that helps us to understand the characteristics of our new products, and to understand the basic biological processes which we want to modify in our future products. Basic investigations of relevant genetic systems may not have direct commercial application, but they are the spark, that source of new ideas, that is necessary for growth and productivity far into the future. Examples of our research in this area include the identification and use of markers for important characteristics such as enzymatic properties of malting barley and pest resistance, and the discovery and investigation of the genes responsible for the low phytic acid trait. This latter area of research is a major focus of the work done by Victor Raboy, who is the scientist ultimately responsible for contributing the LP trait to our germplasm development program.

50
I would like to return to the topic of expansion by pointing out the number of breeding nurseries used by our program, which is now up to ten within the State of Idaho. There are also several nurseries in surrounding states. This is a considerable increase over what we traditionally had available, and was made possible in large part by splitting the Research Leader/Barley and Oat breeder position into two separate positions. We hope that this will increase our ability to identify useful materials, and to bring products forward more quickly in the future. At present let's focus on several of the existing products I mentioned earlier. First, here are data concerning the malting qualities and agronomic performance of the spring 2-rowed malting line, 90Ab241. Relative to the malting standard 'Harrington', it has shown good performance, and we hope it will prove useful both to the malting and brewing industry and to barley producers. Malting performance of 90Ab241 across 23 location years, Aberdeen and Tetonia, Irrigated and non-irrigated % plumps % protein % extract % wort protein S/T DP AA 90Ab241 94 13.2 79.7 4.7 37 145 60 Harrington 85 13.4 78.1 4.3 33 109 46 Agronomic performance of 90Ab241 across 48 location/years, irrigated & dryland, Idaho Yield (bu/A) Test weight (lb/bu) % plumps 90Ab241 96 52.1 91 Harrington 92 52.0 77 'Burton', a RWA-resistant feed barley, was released in 2004 and seed is now available to growers. It has been tested in a wide variety of environments and has shown itself to be competitive with the popular feed cultivar 'Baronesse' in the absence of RWA infestations, and superior in the presence of RWA infestations. The source of the resistance was an accession held in the NSGC, and the development of Burton is a great example of a NSGC contribution to commercial agriculture. In the data presented below, note that the RWA infestations were relatively mild at the Yellow Jacket location. Burton's source of resistance has been shown to be very robust even under conditions of severe infestation, and the recently documented biotypic variability in RWA populations has not overcome the source of resistance in Burton. Performance of Burton without RWA infestations over 31 location/years (ID, CO, NE, irrigated & non-irrigated) heading (past
1/1) height
(in) % lodging yield
(bu/A) TW
(lb/bu) % plumps
Burton 181 29 15 80 50.2 73 Baronesse 180 27 33 83 50.1 72 Performance of Burton with RWA infestations, Yellow Jacket, CO 2001-2004
yield (bu/A) TW (lb/bu) % plumps Burton 114 50.2 86 Baronesse 103 49.2 79

51
I'll present one final set of data concerning the development of low phytate (LP) lines. As I've metioned, we think these lines will confer benefits to producers and to the environment, a real win-win situation. We have available to us a number of different low phytate mutants which trace to allelic changes at several loci. Mutants exist which have phytate reductions from 50-95%. Lines with the more moderate reductions--50-65%--are available which are agronomically competitive, although we have seen associations between low phytate and reductions in resistance to environmental stress, test weight, and diastatic power. Thus, a dual use malting/LP feed cultivar is probably not a realistic goal, nor will LP lines be best suited for non-irrigated locations that are subject to high temperatures. The test weight reduction appears to be approximately 1-2 pounds per bushel, which in the context of 6-rowed barley may put us out of some export markets (for instance, Japan has interest in the LP trait but only in the context of a 50 pound test weight). We are now concentrating our efforts on 2-rowed and hulless LP barleys, which will enable us to achieve acceptable test weights under a number of production environments.
Despite the 20-20 hindsight that would have advised against putting the LP trait in a relatively low test-weight 6-rowed background, let me show some of the productivity data we have for one of our advanced 6-rowed lines. In addition to the data shown below, statewide testing of this line in 2004 showed it to be consistently among the top producers, and in some environments the test weight is above 50 pounds per bushel. Performance of 00ID1550, 2003-2004 Irrigated
(Aberdeen and Filer) Dryland
(Soda Springs and Tetonia) % lodging yield
(bu/A) TW
(lb/bu)% plumps yield
(bu/A) TW
(lb/bu) % plumps
00ID1550 10 168 50.2 90 56 46.0 66 Baronesse 17 161 53.7 93 62 49.1 68 Finally, I would like to revisit the topic of aquaculture and provide you with a more complete description of our efforts to feed barley to trout. Once fully staffed, the effort will be led by five principal investigators. Rick Barrows, Ken Overturf, and Gibson Gaylord will be stationed at the Hagerman facility, and they combine to offer a wealth of expertise in fish nutrition and fish genetics. Two other scientists will be located in the new laboratory facilities at Aberdeen. Gongshe Hu, a recently hired scientist who will join us this spring, will investigate molecular genetic systems of plants as they relate to nutritional issues. We are in the process of hiring a cereal chemist that will enhance our ability to examine the nutritional package that we will assemble for aquaculture rations, and we hope that scientist will be on board by the end of 2005.
The mission of the aquaculture project, as I stated previously, is to substitute grain (barley) for fish and fishmeal-derived ingredients. Initially, their work will be to evaluate existing products--including both available trout strains and available cereal products--in an effort to match the best cereal-based diet with trout strains best able to utilize these products. Ultimately, genetic techniques will be utilized to breed trout strains that are specifically adapted to growth on cereal-

52
based diets. We'll be doing our best at Aberdeen to make sure that barley is the best cereal for these diets.
In conclusion, we are enthusiastic about the research we are conducting on barley at Aberdeen, and we are grateful for the support we get from our many contituencies. Thanks to all for your support. Lest we forget the efforts of the many individuals at Aberdeen who you may not know, but who are critical to our success, I've listed all the individuals at Aberdeen who spend at least part of their time on barley research. Mike Bonman Jana Avant Harold Bockelman Charles Erickson, Kay Calzada, Carol Truman, Scott McNeil Don Obert Dave Burrup, Karla Reynolds, Chris Evans Dave Hoffman Robert Campbell, Irene Shackelford An Hang Charlotte Burton, Kathy Satterfield Phil Bregitzer Doug Fiedler, Vince Edwards, Anne Sturbaum Victor Raboy Kevin Peterson

53
Potential and Current Status of Winter Malting Barley in the United States Donald Obert, USDA/ARS National Small Grains Germplasm Facility
The development of winter malting barley cultivars, and their subsequent use by the malting and brewing industry, would provide several advantages over the current practice of growing only spring malting barley cultivars. Among these advantages are 1) increased yield of winter cultivars, 2) the better use of limited water supplies for irrigation, 3) a more stable supply of malting barley due to earlier harvest of the winter crop, and 4) added flexibility for the barley producer in deployment of equipment and labor, marketing, and risk management.
The current culture of winter barley in the United States is limited. In fact, it is so limited that state barley variety surveys make no mention of winter barley varieties. Regardless, winter feed barleys are grown in Idaho, Oregon, and Washington. This is not the case with winter malting barleys, as there are no current winter varieties currently recommended by the American Malting Barley Association (AMBA).
In spite of the fact that winter barley acreage is small, there is public sector research aimed at improving winter barley cultivars in the US because of the significant potential for the crop. Most of this effort is geared toward the development of feed barleys.
Dr. Steve Baenziger at the University of Nebraska devotes about five percent of program resources to the development of winter barley varieties, with the remainder of his effort focused on the development of winter wheat varieties. Major breeding targets at Nebraska are hulless types with sufficient winter-hardiness and grain and forage yield. There is no effort toward the development of malting types, although lines with malt quality are used as parents in order to introgress important traits for yield, test weight, and plump kernels into hulless germplasm.
Oregon State University’s breeding program, led by Dr. Pat Hayes, is devoted solely to the development of winter barley cultivars. The vast majority of this effort is toward development of malting types. In cooperation with Dr. Don Obert, USDA-ARS, Aberdeen, ID, Dr. Hayes exchanges and evaluates germplasm adapted to the Intermountain West areas of Idaho, Oregon, and Washington. Screening for resistance to barley stripe rust (Puccinia striiformis f. sp. hordei) is an important aspect of the effort at Oregon State University and materials from the ARS-Aberdeen program are screened at Corvallis, OR for stripe rust resistance. Yield and other agronomic traits are evaluated at Pendleton, OR.
The USDA-ARS breeding program at Aberdeen, ID encompasses the development of barley and oat germplasm and varieties. Approximately 15 percent of the overall breeding effort is devoted to the development of winter malting cultivars. In addition to malting varieties, winter lines favorable for aquaculture, animal, and human consumption are also being pursued. The program employs three testing locations in Idaho (Aberdeen, Filer, and Parma), two in Oregon (Corvallis and Pendleton), and one in Pullman, WA (Fig.1). All except the Corvallis, OR location have both preliminary and elite yield evaluations.

54
Corvallis, OR
Pendleton, OR
Aberdeen, ID
Filer, IDParma, ID
Pullman, WA
Figure 1. Locations of winter malting barley nurseries for the USDA-ARS Aberdeen breeding program. The winter barley breeding effort at Virginia Tech consumes about 30 percent of program resources, with the remaining 70 percent allocated to winter wheat development. The winter barley work focuses on hulless types with traits favorable to the poultry and swine industry such as high protein and low fiber. Resistance to foliar diseases is also an important breeding goal of the Virginia Tech program.
Although there are relatively few public breeding programs with an effort towards winter barley development, the areas represented are quite diverse and represent a significant portion of traditional winter barley growing areas.
Winter barley has shown tremendous yield potential at Aberdeen, ID (Table 1) and has been significantly greater than that of spring barley when grown at this site from 2003-2004 (Table 2).
Table 1. Yield of selected elite winter barley lines at Aberdeen, ID. 2003-04.
Entry Pedigree Aberdeen Parma Mean 00Ab278 88Ab536/Plaisant 207 207 207 Sprinter 212 194 203 95Ab2314 ORWM8412/Harrington 208 197 202 00Ab14 93Ab428/Crystal 195 197 196 Charles Bearpaw/81Ab1702 184 194 187 88Ab536-B NE76129/2*Morex 184 149 166

55
Table 2. Yield in bushels per acre of winter vs. spring barley at Aberdeen, ID in 2003 and 2004.
Test 2003 2004 Mean Elite Winter 1 170 210 190 Elite Winter 2 130 197 164 Elite Spring Malt 118 157 138 Elite Spring Feed 115 146 131
In addition winter barley was superior to winter wheat at several locations across Idaho from 2001-2003 (Table 3). The significant yield advantage over both spring barley and winter wheat provides the potential for significant increases in available malting barley production in growing areas that currently support significant winter wheat acreage. *Table 3. Yield in pounds per acre of winter barley and wheat across two locations from 2001-2003. Year 2001 2001 2002 2002 2003 2003 Location Barley Wheat Barley Wheat Barley WheatAberdeen 7138 6180 8904 6360 8321 7800 Kimberly 7208 7260 8268 7560 4028 7860 Mean 7173 6720 8586 6960 6175 7830 *Data courtesy of University of Idaho Small Grains Extension. Although the winter-hardiness of barley is less than that of wheat, it is still sufficient to allow for its culture in major portions of the Intermountain West. Figures 2-4 illustrate the winter wheat acreages in selected counties of Idaho, Oregon, and Washington, respectively. The counties highlighted in figures 2-4 are those which have existing winter testing locations within or adjacent to existing winter barley nurseries. These areas do not experience the severe winter conditions associated with winter kill that occur in many areas of the Midwestern US. Additionally, we have evaluated our existing winter malting barley elite lines in these counties, or in bordering counties, and have not observed significant winter injury. Thus significantly improved winter-hardiness is not a prerequisite for the success of winter malting barley. The expansion of winter malting barley into these areas would be relatively easy as small grains, especially wheat, are already the predominantly grown crop.

56
Filer
Parma
Winter Wheat Acreage (2003)
Aberdeen66K108.6
Nez Perce81K79.4
Latah76K76.8
Figure 2. Winter wheat acreage for selected Idaho counties based on proximity to existing winter barley trials.
Pendleton264K
Corvallis
Oregon Barley Nurseries
Pendleton (Umatilla) 1070’Corvallis (Benton) 250’
Morrow180K
Figure 3. Winter wheat acreage for selected Oregon counties based on proximity to existing winter barley trials.

57
Washington Barley Nurseries
Pullman (Whitman) 2351’
Pullman
351K82
Figure 4. Winter wheat acreage for Whitman County Washington. One aspect of additional flexibility provided by winter malting barley production is that of spreading labor and equipment use over a greater portion of the year. Fall planting allows for the utilization of equipment and labor in an otherwise ‘slow’ period for the producer. In addition, winter barley generally can be harvested 24 d sooner than spring barley. The earlier harvest date provides a more uniform cash flow and optimized harvest conditions for the producer, as well as an earlier supply of malting barley for industry.
Although winter barley was previously grown in considerable acreages in Oregon and Washington, incentives associated with the existing farm program place winter feed barley at a financial disadvantage when compared to winter wheat. A value added product, such as malting barley, would provide the additional value required to make winter barley competitive with winter wheat. The only currently available winter malting barley with near malting quality is 88Ab536-B, a germplasm released from the USDA-ARS Aberdeen program (Wesenberg et al., 1998). Although this serves as our winter malting barley ‘standard’ it does not meet current industry standards for malting quality barley. The recent release of ‘Charles’ winter malting barley by the ARS-Aberdeen program may provide a suitable winter malting cultivar for use by industry. This line, previously tested as 94Ab1274, was advanced to plant-scale quality evaluation following three years of favorable ratings in AMBA sponsored pilot-scale analyses. In testing at Aberdeen, ID from 1999-2003 it showed favorable malting quality values compared to Harrington (Harvey and Rossnagel 1984), the western 2-row malt standard (Table 4).
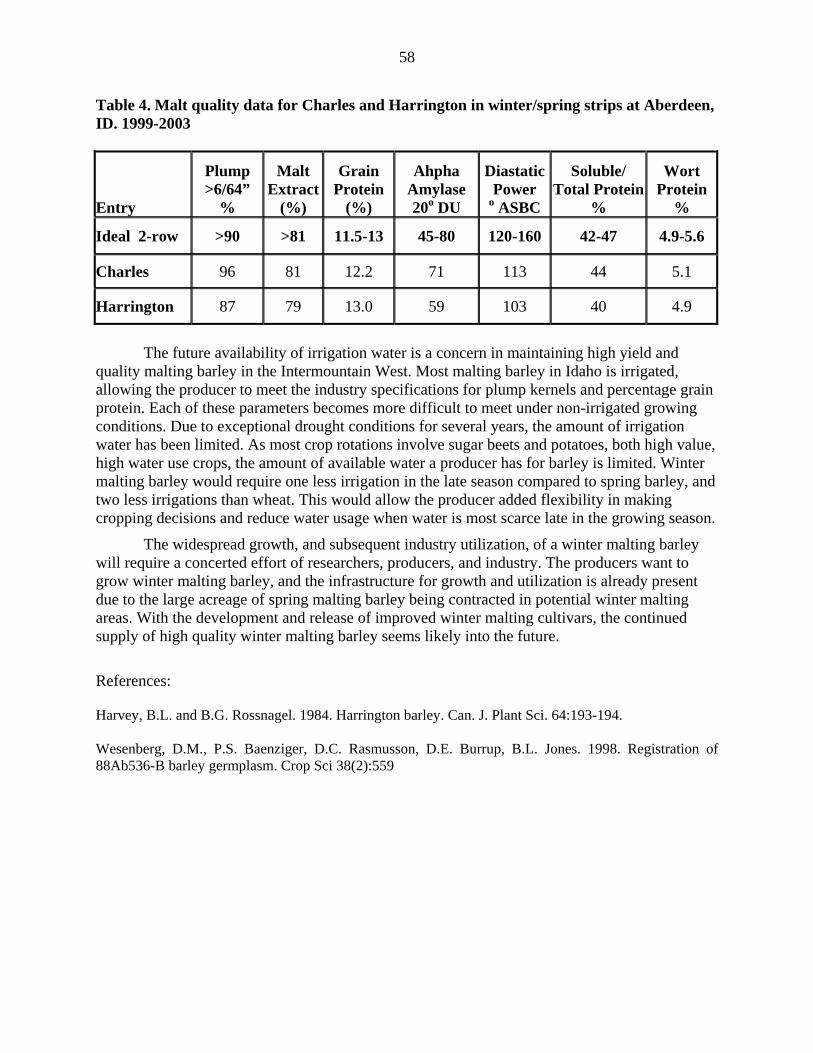
58
Table 4. Malt quality data for Charles and Harrington in winter/spring strips at Aberdeen, ID. 1999-2003
Entry
Plump >6/64”
%
Malt Extract
(%)
Grain Protein
(%)
Ahpha Amylase 20o DU
DiastaticPower
o ASBC
Soluble/ Total Protein
%
Wort Protein
%
Ideal 2-row >90 >81 11.5-13 45-80 120-160 42-47 4.9-5.6
Charles 96 81 12.2 71 113 44 5.1
Harrington 87 79 13.0 59 103 40 4.9
The future availability of irrigation water is a concern in maintaining high yield and quality malting barley in the Intermountain West. Most malting barley in Idaho is irrigated, allowing the producer to meet the industry specifications for plump kernels and percentage grain protein. Each of these parameters becomes more difficult to meet under non-irrigated growing conditions. Due to exceptional drought conditions for several years, the amount of irrigation water has been limited. As most crop rotations involve sugar beets and potatoes, both high value, high water use crops, the amount of available water a producer has for barley is limited. Winter malting barley would require one less irrigation in the late season compared to spring barley, and two less irrigations than wheat. This would allow the producer added flexibility in making cropping decisions and reduce water usage when water is most scarce late in the growing season.
The widespread growth, and subsequent industry utilization, of a winter malting barley will require a concerted effort of researchers, producers, and industry. The producers want to grow winter malting barley, and the infrastructure for growth and utilization is already present due to the large acreage of spring malting barley being contracted in potential winter malting areas. With the development and release of improved winter malting cultivars, the continued supply of high quality winter malting barley seems likely into the future.
References: Harvey, B.L. and B.G. Rossnagel. 1984. Harrington barley. Can. J. Plant Sci. 64:193-194. Wesenberg, D.M., P.S. Baenziger, D.C. Rasmusson, D.E. Burrup, B.L. Jones. 1998. Registration of 88Ab536-B barley germplasm. Crop Sci 38(2):559