34 chapter 6 understanding music - nempnemp.otago.ac.nz/pdfs/music_00/chapter6/chapter6.pdf · 34...
TRANSCRIPT
34 CHAPTER 6 UNDERSTANDING MUSIC
The 2000 music assessments included ten assessment tasks related to understanding music.
All ten tasks were identical for year 4 and year 8 students. Three are trend tasks (fully described with data for both 1996 and 2000), four are released tasks (fully described with data for 2000 only), and three are link tasks (to be used again in 2004, so only partially described here).
The task details and results for the trend tasks are presented in the fi rst section, followed by the task details and results for the released tasks. The third section contains some task information and the results for the link tasks.
Comparing results for year 4 and year 8 students
Averaged across 66 task components, 20 percent more year 8 than year 4 students (or teams of students) produced correct responses. This indicates that, on average, students have made very substantial progress between year 4 and year 8 in the skills assessed by the tasks. The differences were greatest on High to Low and Music in Style.
Trend results: Comparing 1996 and 2000 results
Three trend tasks involving a total of 22 components were administered to students in both the 1996 and 2000 assessments.
For year 4 students there was a very slight decline in performance between 1996 and 2000. The percentage of students succeeding decreased from 1996 to 2000, with lower performance in 2000 on 13 of the 22 components, and three percent fewer students, on average, in choosing the correct or preferred responses.
For year 8 students the picture was similar. The percentage of students succeeding decreased very slightly from 1996 to 2000, with lower performance in 2000 on 14 of the 22 components, and two percent fewer students, on average, in choosing the correct or preferred responses.

Chapter 6: Understanding Music 35
% responses 2000 (’96) 2000 (’96)
year 4 year 8
Approach: Level:Focus:Resources:
% responses 2000 (’96) 2000 (’96)
year 4 year 8
Trend task Musical Instruments
Station Year 4 and year 8
Associating the sounds of musical instruments with pictures of them.
Video recording on laptop computer.
Questions/instructions:
Click on the button that says Musical Instruments and watch the video that plays. The computer will tell you what to do. If it doesn’t, tell the teacher.
Put a number in the circle beside the instrument you hear.
The fi rst one is done for you.
Commentary:For most instruments, year 8 students performed substantially better than year 4 students. The exception was for the guitar music selection, where a classical guitar piece fooled many of the students into identifying the instrument as a banjo. Unfortunately, a small change in the task between 1996 and 2000 makes the trend analysis unreliable, the size of the picture of the violin was increased in 2000. This clearly made it harder for students to distinguish the cello and violin. On the other instruments, there is no clear trend from 1996 to 2000.
Clarinet music 5 45 (44) 78 (79)
Guitar music 3 27 (31) 26 (22)
Cello music 7 21 (32) 51 (68)
Banjo no music
Trombone no music
Keyboard music 2 85 (85) 96 (97)
Violin music 4 42 (58) 80 (92)
Saxophone music 6 71 (69) 92 (92)
1
5
3
7 6
2
2000 version
1996 version
4

36 NEMP Report 17: Music 2000
Approach: Level: Focus: Resources:
% responses 2000 (’96) 2000 (’96)
year 4 year 8
% responses 2000 (’96) 2000 (’96)
year 4 year 8
High to Low Trend task
Station Year 4 and year 8
Identifying upward or onward pitch movements or trends.
Video recording on laptop computer.
Questions/instructions:
Section 1
The fi rst section asked students to listen to two notes, chords, and musical phrases and identify whether the second was higher, the same, or lower in pitch than the fi rst. After an example with answer given, six assessment items followed.
This activity is done on the computer.
Draw a ring around the words to show your answers.
1. higher lower same
2. higher lower same
3. higher lower same
4. higher lower same
5. higher lower same
6. higher lower same
7. higher lower same
5. same 53 (53) 87 (82)
1. Example
3. same 57 (67) 91 (92)
4. lower 30 (37) 64 (67)
2. higher 54 (57) 85 (86)
6. lower 52 (52) 82 (81)
7. higher 37 (41) 54 (58)
Section total:
5–6 18 (21) 64 (61)
3–4 39 (41) 25 (31)
1–2 34 (33) 10 (7)
0 9 (5) 1 (1)
Chapter 6: Understanding Music 37
% responses 2000 (’96) 2000 (’96)
year 4 year 8
% responses 2000 (’96) 2000 (’96)
year 4 year 8
1. Example
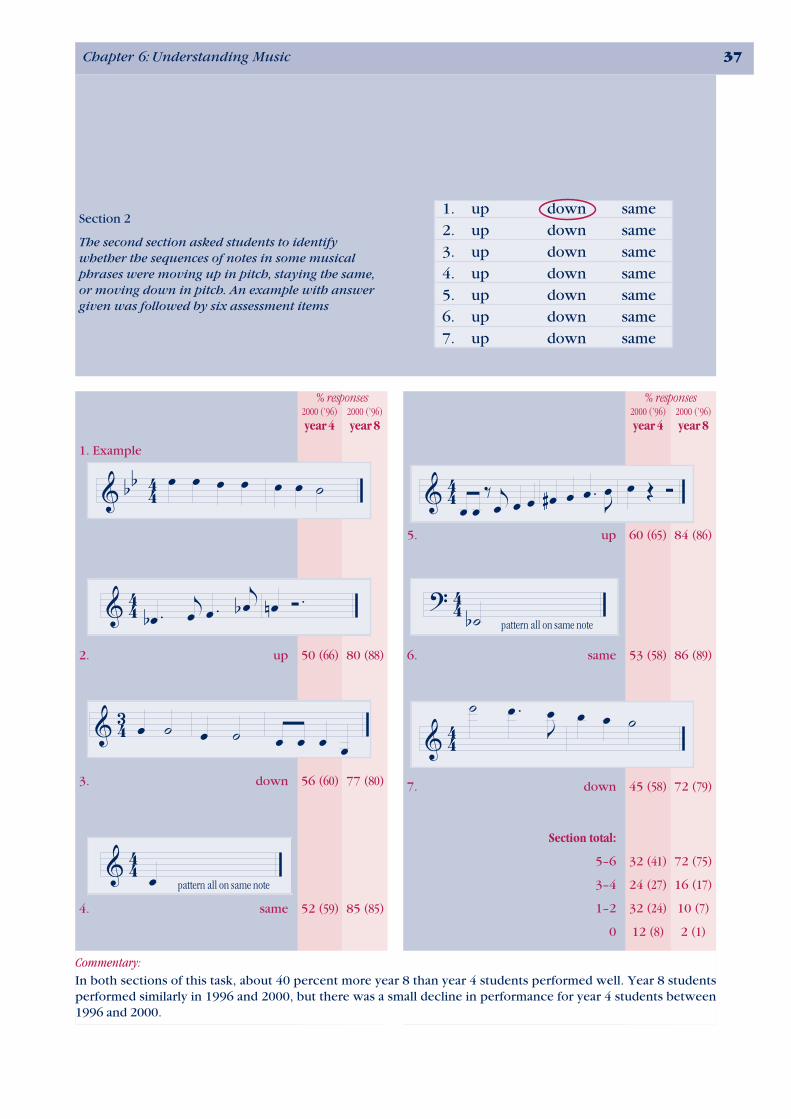
Commentary:In both sections of this task, about 40 percent more year 8 than year 4 students performed well. Year 8 students performed similarly in 1996 and 2000, but there was a small decline in performance for year 4 students between 1996 and 2000.
1. up down same
2. up down same
3. up down same
4. up down same
5. up down same
6. up down same
7. up down same
Section 2
The second section asked students to identify whether the sequences of notes in some musical phrases were moving up in pitch, staying the same, or moving down in pitch. An example with answer given was followed by six assessment items
7. down 45 (58) 72 (79)
2. up 50 (66) 80 (88)
3. down 56 (60) 77 (80)
4. same 52 (59) 85 (85)
5. up 60 (65) 84 (86)
6. same 53 (58) 86 (89)
Section total:
5–6 32 (41) 72 (75)
3–4 24 (27) 16 (17)
1–2 32 (24) 10 (7)
0 12 (8) 2 (1)
pattern all on same note
pattern all on same note

38 NEMP Report 17: Music 2000
Approach: Level: Focus: Resources:
% responses 2000 (’96) 2000 (’96)
year 4 year 8
% responses 2000 (’96) 2000 (’96)
year 4 year 8
Melodic Direction Trend Task
Station Year 4 and year 8
Selecting, from two or three options, the music notation that fi ts a performed musical phrase.
Video recording on a laptop computer.
Questions/instructions:
1. Click on the button that says Melodic Direction. Click the Play button, to watch the video. The computer will tell you what to do.If it doesn’t, tell the teacher.
Put a tick in the box to show your answer.
Commentary:The fi nal item was clearly too hard, with success no better than guessing. On the other items about 20 percent more year 8 than year 4 students performed well. Differences between 1996 and 2000 were small.
Students were asked to listen to each phrase played, and select which of the music notation options fi tted with the phrase. The fi rst phrase was an example to show what to do.
Example 4.
�
1.
� 68 (75) 96 (96)
2.
� 74 (80) 94 (92)
3.
� 63 (60) 70 (80)
� 70 (64) 85 (84)
5.
� 65 (63) 79 (80)
6.
� 28 (27) 25 (29)
Total score: 6 7 (9) 14 (19)
4–5 55 (51) 70 (68)
2–3 28 (31) 14 (11)
0–1 10 (9) 2 (2)
Chapter 6: Understanding Music 39
% responses year 4 year 8
Approach: Level:Focus:Resources:
Example
1.
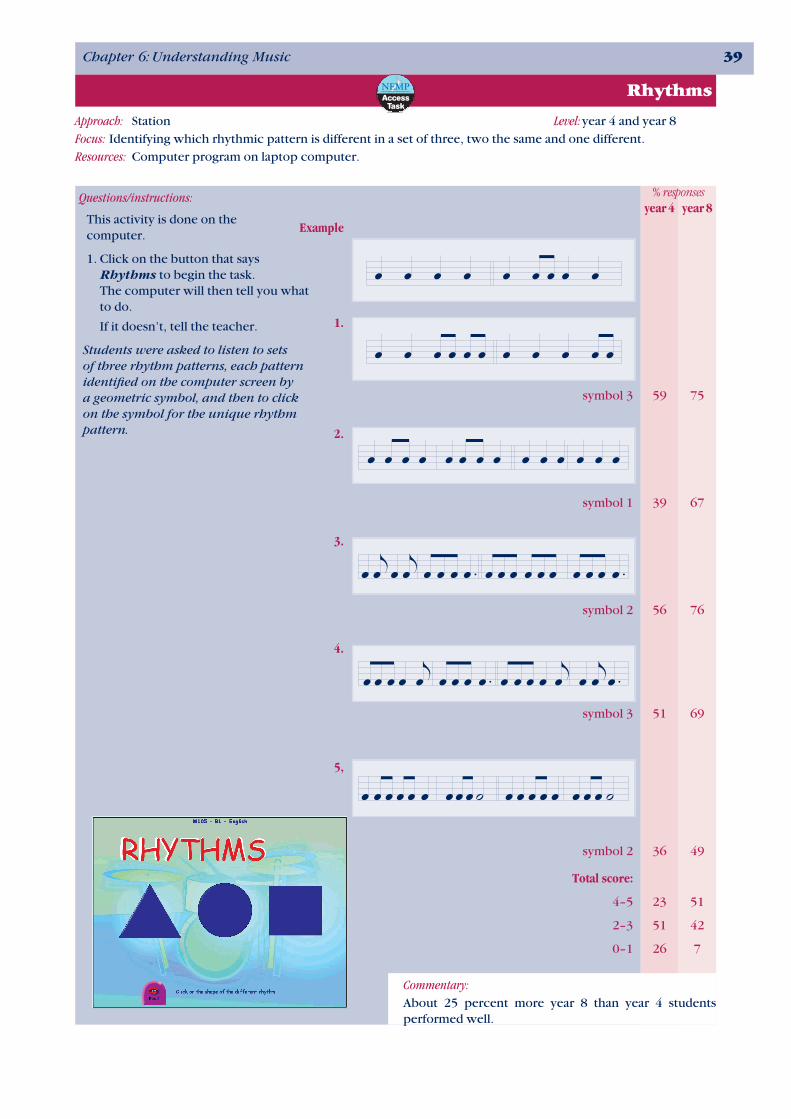
symbol 3 59 75
2.
symbol 1 39 67
3.
symbol 2 56 76
4.
symbol 3 51 69
5,
symbol 2 36 49
Total score:
4–5 23 51
2–3 51 42
0–1 26 7
Rhythms
Station year 4 and year 8
Identifying which rhythmic pattern is different in a set of three, two the same and one different.
Computer program on laptop computer.
Questions/instructions:
This activity is done on the computer.
1. Click on the button that says Rhythms to begin the task. The computer will then tell you what to do.
If it doesn’t, tell the teacher.
Students were asked to listen to sets of three rhythm patterns, each pattern identifi ed on the computer screen by a geometric symbol, and then to click on the symbol for the unique rhythm pattern.
Commentary:About 25 percent more year 8 than year 4 students performed well.
40 NEMP Report 17: Music 2000
% responses y4 y8
Approach: Level: Focus: Resources:
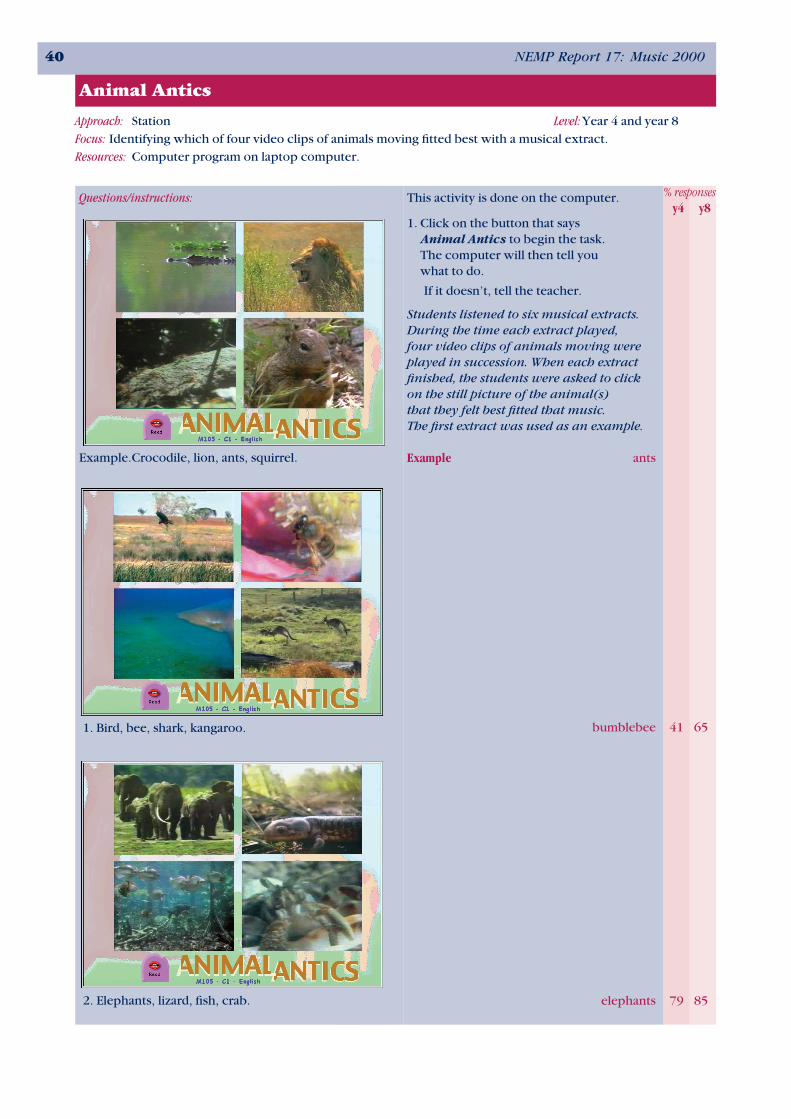
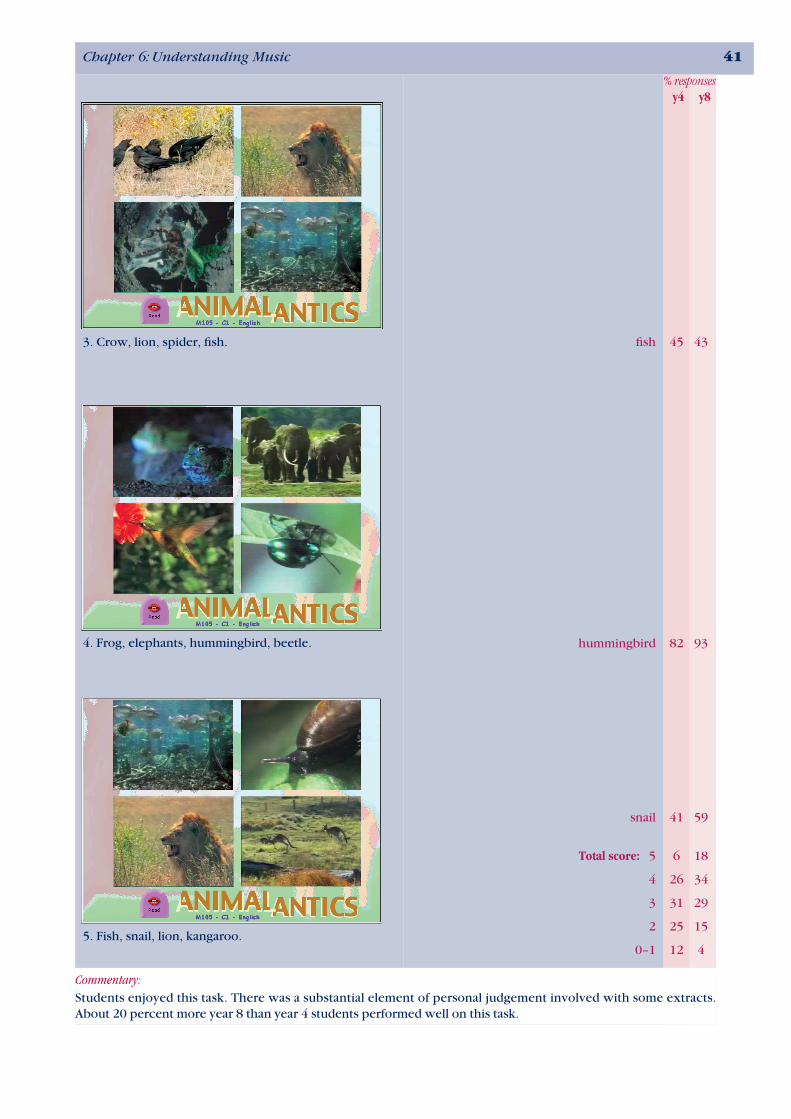
Animal Antics
Station Year 4 and year 8
Identifying which of four video clips of animals moving fi tted best with a musical extract.
Computer program on laptop computer.
Questions/instructions:
Example.Crocodile, lion, ants, squirrel.
2. Elephants, lizard, fi sh, crab.
1. Bird, bee, shark, kangaroo.
This activity is done on the computer.
1. Click on the button that says Animal Antics to begin the task.The computer will then tell you what to do.
If it doesn’t, tell the teacher.
Students listened to six musical extracts. During the time each extract played, four video clips of animals moving were played in succession. When each extract fi nished, the students were asked to click on the still picture of the animal(s) that they felt best fi tted that music. The fi rst extract was used as an example.
Example ants
bumblebee 41 65
elephants 79 85
Chapter 6: Understanding Music 41
% responses y4 y8
3. Crow, lion, spider, fi sh.
Commentary:Students enjoyed this task. There was a substantial element of personal judgement involved with some extracts. About 20 percent more year 8 than year 4 students performed well on this task.
4. Frog, elephants, hummingbird, beetle.
5. Fish, snail, lion, kangaroo.
fi sh 45 43
hummingbird 82 93
snail 41 59
Total score: 5 6 18
4 26 34
3 31 29
2 25 15
0–1 12 4
42 NEMP Report 17: Music 2000
% responses y4 y8
% responses y4 y8
Approach: Level:Focus:
Resources:
Approach: Level:Focus:
Resources:
% responses y4 y8
% responses y4 y8
% responses y4 y8
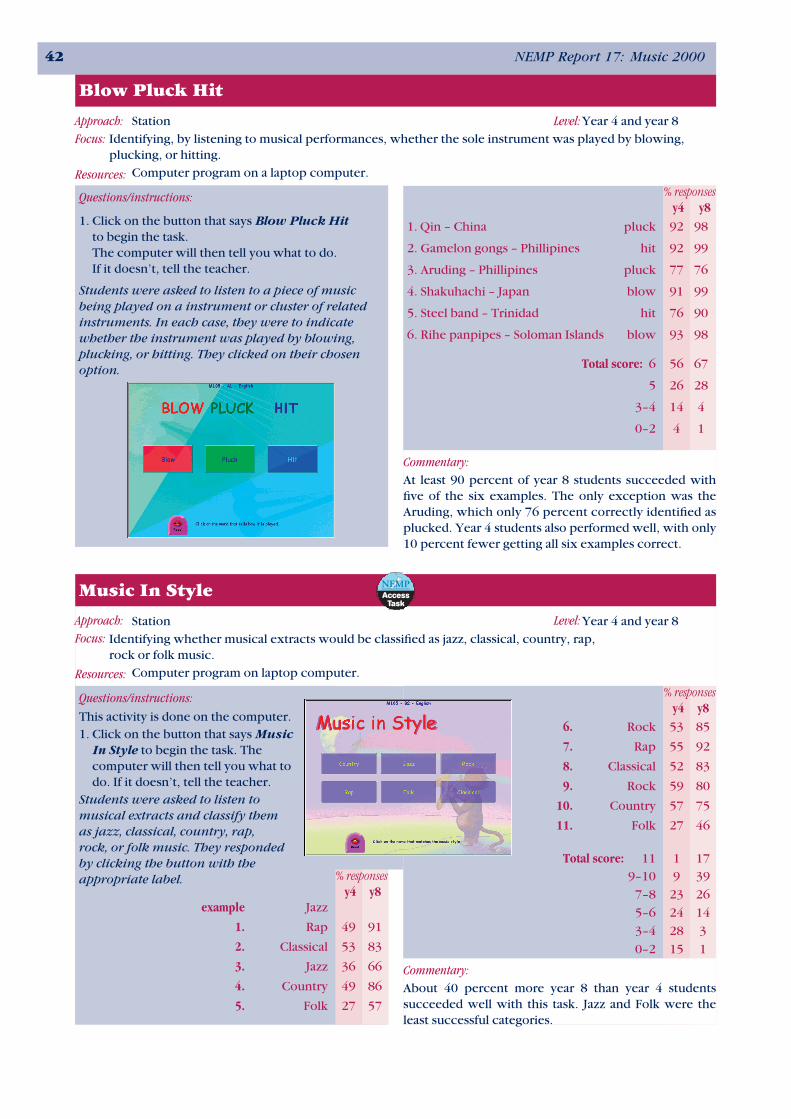
Blow Pluck Hit
Station Year 4 and year 8
Identifying, by listening to musical performances, whether the sole instrument was played by blowing, plucking, or hitting.
Computer program on a laptop computer.
Questions/instructions:
1. Click on the button that says Blow Pluck Hit to begin the task. The computer will then tell you what to do. If it doesn’t, tell the teacher.
Students were asked to listen to a piece of music being played on a instrument or cluster of related instruments. In each case, they were to indicate whether the instrument was played by blowing, plucking, or hitting. They clicked on their chosen option.
1. Qin – China pluck 92 98
2. Gamelon gongs – Phillipines hit 92 99
3. Aruding – Phillipines pluck 77 76
4. Shakuhachi – Japan blow 91 99
5. Steel band – Trinidad hit 76 90
6. Rihe panpipes – Soloman Islands blow 93 98
Total score: 6 56 67
5 26 28
3–4 14 4
0–2 4 1
Commentary:At least 90 percent of year 8 students succeeded with fi ve of the six examples. The only exception was the Aruding, which only 76 percent correctly identifi ed as plucked. Year 4 students also performed well, with only 10 percent fewer getting all six examples correct.
Music In Style
Station Year 4 and year 8
Identifying whether musical extracts would be classifi ed as jazz, classical, country, rap, rock or folk music.
Computer program on laptop computer.
Questions/instructions:
This activity is done on the computer.1. Click on the button that says Music
In Style to begin the task. The computer will then tell you what to do. If it doesn’t, tell the teacher.
Students were asked to listen to musical extracts and classify them as jazz, classical, country, rap, rock, or folk music. They responded by clicking the button with the appropriate label.
example Jazz
1. Rap 49 91
2. Classical 53 83
3. Jazz 36 66
4. Country 49 86
5. Folk 27 57
6. Rock 53 85
7. Rap 55 92
8. Classical 52 83
9. Rock 59 80
10. Country 57 75
11. Folk 27 46
Total score: 11 1 17
9–10 9 39
7–8 23 26
5–6 24 14
3–4 28 3
0–2 15 1
Commentary:About 40 percent more year 8 than year 4 students succeeded well with this task. Jazz and Folk were the least successful categories.
Chapter 6: Understanding Music 43
% responses y4 y8
% responses y4 y8
% responses y4 y8
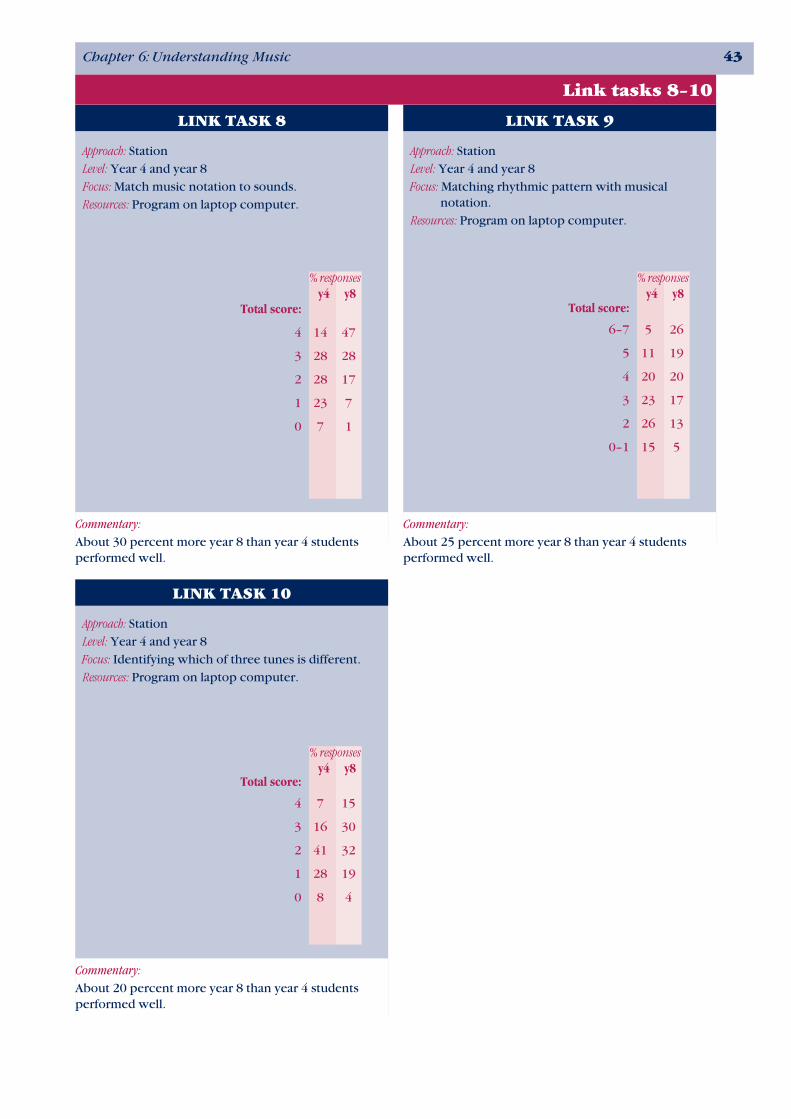
Link tasks 8–10
LINK TASK 8
Approach: Station
Level: Year 4 and year 8
Focus: Match music notation to sounds.
Resources: Program on laptop computer.
Total score:
4 14 47
3 28 28
2 28 17
1 23 7
0 7 1
LINK TASK 9
Approach: Station
Level: Year 4 and year 8
Focus: Matching rhythmic pattern with musical notation.
Resources: Program on laptop computer.
Total score:
6–7 5 26
5 11 19
4 20 20
3 23 17
2 26 13
0–1 15 5
LINK TASK 10
Approach: Station
Level: Year 4 and year 8
Focus: Identifying which of three tunes is different.
Resources: Program on laptop computer.
Total score:
4 7 15
3 16 30
2 41 32
1 28 19
0 8 4
Commentary:About 30 percent more year 8 than year 4 students performed well.
Commentary:About 25 percent more year 8 than year 4 students performed well.
Commentary:About 20 percent more year 8 than year 4 students performed well.