31 south africa - global methane initiative · 31 south africa 31.1 . summary of coal industry ....
TRANSCRIPT

31 South Africa
31.1 Summary of Coal Industry 31.1.1 ROLE OF COAL IN SOUTH AFRICA South Africa is the world’s seventh largest coal producer and dominates the African coal industry,producing 259 million tonnes (Mmt) of coal in 2012 (EIA, 2013). It is the seventh largest coal exporter in the world (EIA, 2013), and responsible for about 97 percent of all coal production inAfrica (EIA, 2013). South Africa’s coal resources are estimated at 115 billion tonnes, based on a survey conducted in 1987 (DME, 2010a). As seen in Table 31-1, its reserves are estimated at about30.1 billion tonnes which consist almost entirely of hard coals (i.e., anthracite and bituminous)(EIA, 2013).
Table 31-1. South Africa’s Coal Reserves and Production Sub-Anthracite & bituminous Total Global Rank
Indicator Bituminous (million tonnes) & Lignite (million tonnes) (# and %)
(million tonnes) Estimated Proved Coal Reserves 30,156 0 30,156 10 (3.39%) (2011) Annual Coal Production (2012) 259 0 259 7 (3.29%)
Source: EIA (2013)
Coal is the primary fuel produced and consumed in South Africa, accounting for 69.4 percent of total primary energy supply in 2011 (IEA, 2013). Three quarters of its production is consumedinternally and one quarter is exported to the European Union and East Asia (EIA, 2014). Internal consumption is primarily for electric power generation (about 53 percent of locally sold coal in2013). The second most important use is conversion to synthetic liquid petrol and diesel fuels (33percent). The metallurgical industries consumed 12 percent of South Africa’s domestic coal consumption and 2 percent was used for domestic heating and cooking coal (Figure 31-1) (ESK, 2014).
Figure 31-2 illustrates the distribution of coal deposits in the country. Seventy percent of South Africa’s recoverable coal reserves lie in the Highveld, Waterberg, and Witbank fields. The great bulkof the coal reserves are concentrated in 19 Karoo (Permian) coalfields in the Mpumalanga region of the country and underlay an area of about 115,000 square miles (EIA, 2007).
CMM Country Profiles 278

SOUTH AFRICA
Figure 31-1. South Africa’s Domestic Coal Consumption by Sector
Source: ESK (2014)
Figure 31-2. South Africa’s Coal Basins
Source: Walker (2000)
CMM Country Profiles 279
SOUTH AFRICA
South Africa’s production of bituminous coal increased by 6.54 Mmt (2.5 percent) and exportsincreased by 5.5 Mmt (8.0 percent) from 2011 to 2012. In 2012, South African coal was mainlyexported to India (30 percent) and, in order of decreasing percentage, was exported to Europe (19percent), China (17 percent), Other Asia and Oceania (14 percent), Middle East (10 percent), Africa (7 percent), South America and Caribbean (2 percent), and North America (1 percent) (EIA, 2014). Revenue from export sales increased from 2007 to 2012 by 46.8 percent and total revenue from the sale of coal increased by 45.9 percent (DMR, 2013).
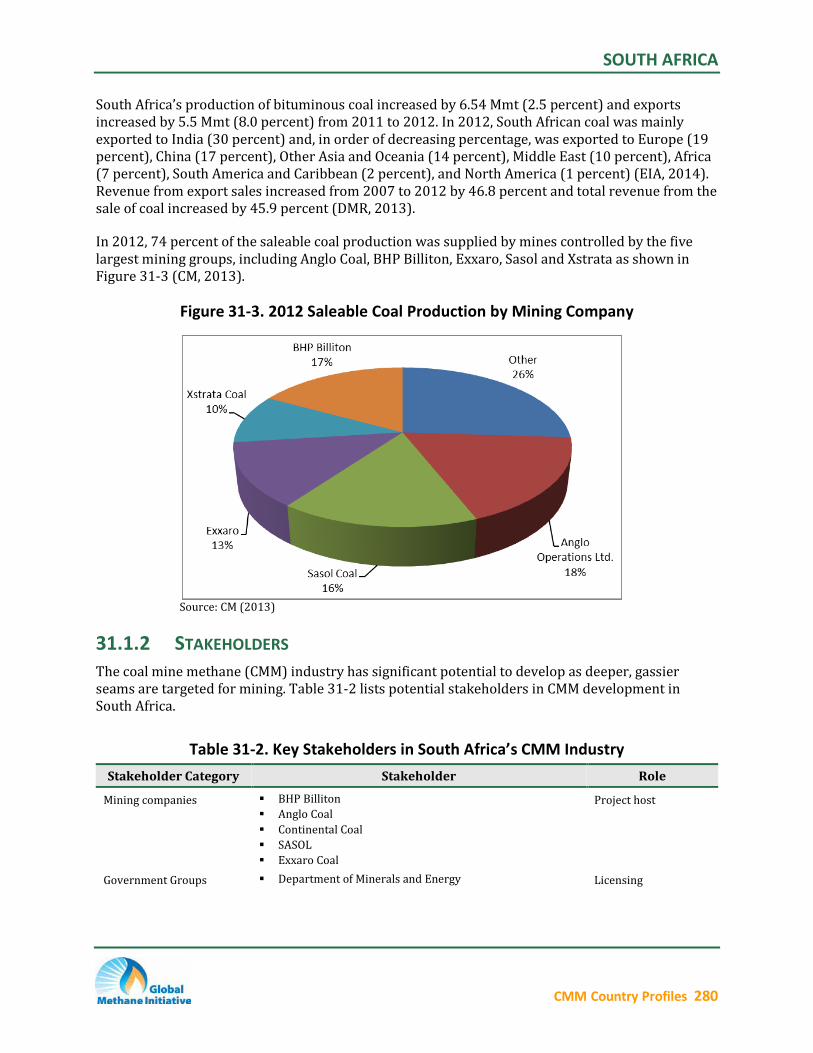
In 2012, 74 percent of the saleable coal production was supplied by mines controlled by the fivelargest mining groups, including Anglo Coal, BHP Billiton, Exxaro, Sasol and Xstrata as shown inFigure 31-3 (CM, 2013).
Figure 31-3. 2012 Saleable Coal Production by Mining Company
Source: CM (2013)
31.1.2 STAKEHOLDERS The coal mine methane (CMM) industry has significant potential to develop as deeper, gassierseams are targeted for mining. Table 31-2 lists potential stakeholders in CMM development inSouth Africa.
Table 31-2. Key Stakeholders in South Africa’s CMM Industry Stakeholder Category Stakeholder Role
Mining companies BHP Billiton Project host Anglo Coal Continental Coal SASOL Exxaro Coal
Government Groups Department of Minerals and Energy Licensing
CMM Country Profiles 280
SOUTH AFRICA
Table 31-2. Key Stakeholders in South Africa’s CMM Industry Stakeholder Category Stakeholder Role
Developers and See http://www.epa.gov/coalbed/networkcontacts.html Project opportunityConsultancy identification,
planning and technicalassistance
Organizations Chamber of Mines of South Africa South African Mining Development Association
Universities, Research See Table 31-6 Establishments
Source: DME (2010a, 2010b)
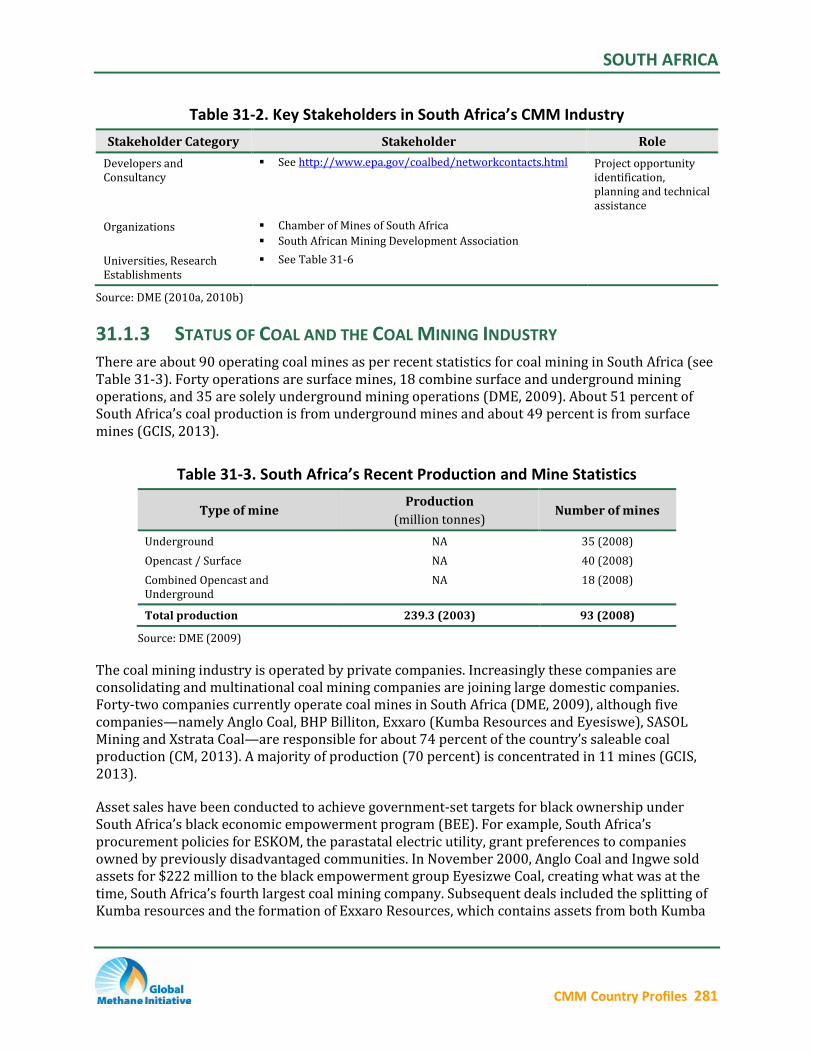
31.1.3 STATUS OF COAL AND THE COAL MINING INDUSTRY There are about 90 operating coal mines as per recent statistics for coal mining in South Africa (seeTable 31-3). Forty operations are surface mines, 18 combine surface and underground miningoperations, and 35 are solely underground mining operations (DME, 2009). About 51 percent of South Africa’s coal production is from underground mines and about 49 percent is from surfacemines (GCIS, 2013).
Table 31-3. South Africa’s Recent Production and Mine Statistics
Type of mine Production
(million tonnes) Number of mines
Underground NA 35 (2008) Opencast / Surface NA 40 (2008) Combined Opencast andUnderground
NA 18 (2008)
Total production 239.3 (2003) 93 (2008)
Source: DME (2009)
The coal mining industry is operated by private companies. Increasingly these companies areconsolidating and multinational coal mining companies are joining large domestic companies.Forty-two companies currently operate coal mines in South Africa (DME, 2009), although five companies—namely Anglo Coal, BHP Billiton, Exxaro (Kumba Resources and Eyesiswe), SASOLMining and Xstrata Coal—are responsible for about 74 percent of the country’s saleable coal production (CM, 2013). A majority of production (70 percent) is concentrated in 11 mines (GCIS, 2013).
Asset sales have been conducted to achieve government-set targets for black ownership underSouth Africa’s black economic empowerment program (BEE). For example, South Africa’s procurement policies for ESKOM, the parastatal electric utility, grant preferences to companies owned by previously disadvantaged communities. In November 2000, Anglo Coal and Ingwe soldassets for $222 million to the black empowerment group Eyesizwe Coal, creating what was at the time, South Africa’s fourth largest coal mining company. Subsequent deals included the splitting ofKumba resources and the formation of Exxaro Resources, which contains assets from both Kumba
CMM Country Profiles 281
SOUTH AFRICA
and Eyesizwe (DME, 2008b). Exxaro is now the largest black mining firm and the fourth largest coal producer in South Africa (DME, 2006).
Future new coal developments are expected to be located mainly in the northern provinces of Limpopo and Mpumalanga. Anglo and Sasol began operation of the Kriel South coalfield, Mpumalanga province in 2005 which produces about 5.0 Mmt/year (Anglo, 2005). Coal of Africa (COA, 2009) is progressing with plans for two mines in the Limpopo province, which—at fullcapacity—will produce a total of 10 Mmt/year (combined investment $755 million). ESKOMestimates that 40 new mines will be necessary over the next decade to produce enough coal to fuel future electricity demand (SAinfo, 2009).
Two new coal power stations with capacities of 4,800 MW each are under construction. The Medupi power station is located near Lephalale in Limpopo and the Kusile power station in Mpumalanga.
The percentage of operating mines considered “gassy” is very low. It is estimated that in theshallower fields, methane loss could have approached 80 percent of initial gas content in the coalification process (UNFCCC, 2000). However, newer underground mines that may be developedin deeper zones are likely to be gassier.
31.2 Overview of CMM Emissions and Development Potential
In the mid-1990s, South Africa was ranked as one of the world’s top five CMM emitters attributable to its high coal production and estimates placed the gas content of South Africa’s coals on a par withAustralia’s. Since then, it has been shown that these original estimates were overstated. In 2010, itsrank in worldwide CMM emissions dropped to ninth with estimated emissions of approximately 8.2million tonnes of carbon dioxide equivalent (MmtCO2e) (EPA, 2012).
The Global Methane Initiative (GMI) International CMM Projects Database currently identifies one CMM recovery project in South Africa (GMI, 2014). The recovery project is a flaring project at AngloAmerican Thermal Coal’s New Denmark colliery near Standerton. The operation involves the incorporation of two enclosed Swiss-designed mobile flares into the mine's methane drainage system. A small diesel blower delivers the methane to four flaring nozzles where the gas is mixedwith air to a concentration that enables it to be safely burnt. The process can be monitoredremotely via the flare’s solar-powered communication system. The project reportedly cost $1.2million and the project developers are pursuing carbon credits under the Clean DevelopmentMechanism (Creamer, 2010a).
31.2.1 CMM EMISSIONS FROM OPERATING MINES A national greenhouse gas (GHG) inventory for South Africa was initially prepared for the years1990-1994 for South Africa’s First National Communication Report to the UNFCCC, published in2000. Work is currently underway by the Climate Change Division of the Department of Environmental Affairs and Tourism (DEAT) to design a process and approach for preparation of anupdated inventory (DEAT, 2010).
In the energy sector, fugitive emissions contributed 323 gigagrams (Gg) or 475 million cubic meters (Mcm) of methane in 1990 and 327 Gg (481 Mcm) in 1994, which represents about 16 percent of
CMM Country Profiles 282
SOUTH AFRICA
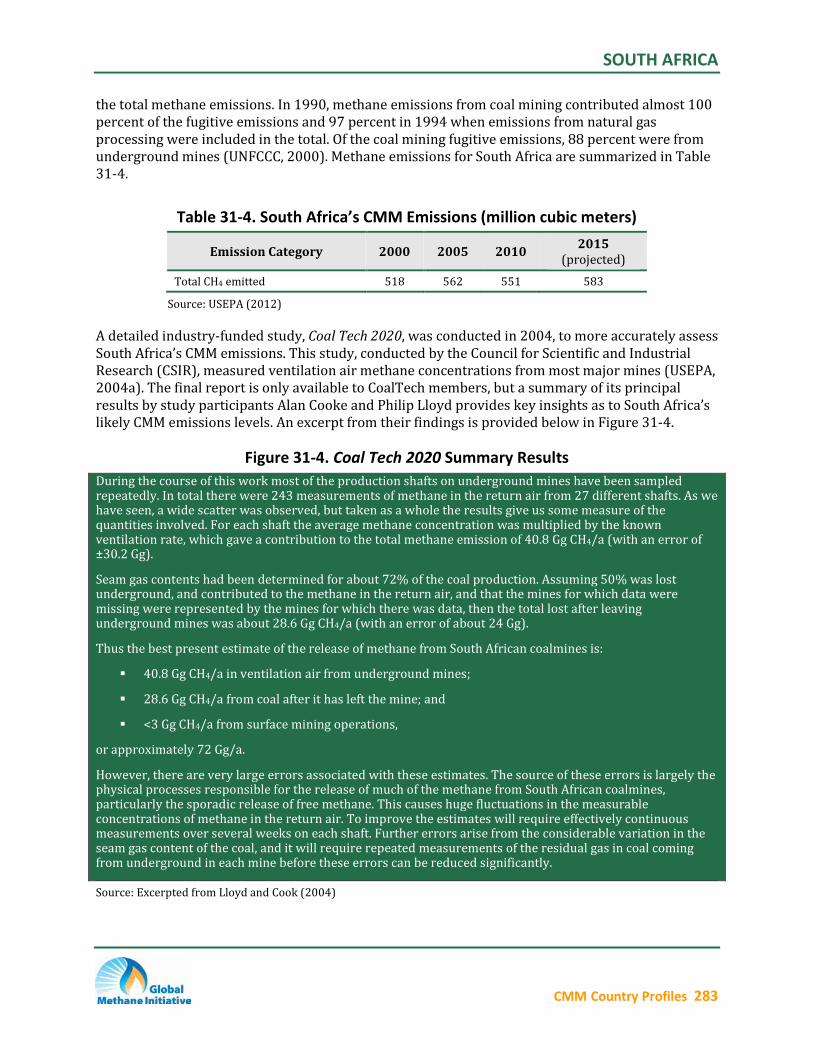
the total methane emissions. In 1990, methane emissions from coal mining contributed almost 100percent of the fugitive emissions and 97 percent in 1994 when emissions from natural gasprocessing were included in the total. Of the coal mining fugitive emissions, 88 percent were from underground mines (UNFCCC, 2000). Methane emissions for South Africa are summarized in Table 31-4.
Table 31-4. South Africa’s CMM Emissions (million cubic meters) 2015Emission Category 2000 2005 2010 (projected)
Total CH4 emitted 518 562 551 583
Source: USEPA (2012)
A detailed industry-funded study, Coal Tech 2020, was conducted in 2004, to more accurately assess South Africa’s CMM emissions. This study, conducted by the Council for Scientific and IndustrialResearch (CSIR), measured ventilation air methane concentrations from most major mines (USEPA,2004a). The final report is only available to CoalTech members, but a summary of its principal results by study participants Alan Cooke and Philip Lloyd provides key insights as to South Africa’s likely CMM emissions levels. An excerpt from their findings is provided below in Figure 31-4.
Figure 31-4. Coal Tech 2020 Summary Results During the course of this work most of the production shafts on underground mines have been sampledrepeatedly. In total there were 243 measurements of methane in the return air from 27 different shafts. As we have seen, a wide scatter was observed, but taken as a whole the results give us some measure of thequantities involved. For each shaft the average methane concentration was multiplied by the knownventilation rate, which gave a contribution to the total methane emission of 40.8 Gg CH4/a (with an error of ±30.2 Gg).
Seam gas contents had been determined for about 72% of the coal production. Assuming 50% was lost underground, and contributed to the methane in the return air, and that the mines for which data weremissing were represented by the mines for which there was data, then the total lost after leavingunderground mines was about 28.6 Gg CH4/a (with an error of about 24 Gg).
Thus the best present estimate of the release of methane from South African coalmines is:
40.8 Gg CH4/a in ventilation air from underground mines;
28.6 Gg CH4/a from coal after it has left the mine; and
<3 Gg CH4/a from surface mining operations,
or approximately 72 Gg/a.
However, there are very large errors associated with these estimates. The source of these errors is largely thephysical processes responsible for the release of much of the methane from South African coalmines,particularly the sporadic release of free methane. This causes huge fluctuations in the measurableconcentrations of methane in the return air. To improve the estimates will require effectively continuousmeasurements over several weeks on each shaft. Further errors arise from the considerable variation in the seam gas content of the coal, and it will require repeated measurements of the residual gas in coal comingfrom underground in each mine before these errors can be reduced significantly.
Source: Excerpted from Lloyd and Cook (2004)
CMM Country Profiles 283
SOUTH AFRICA
The coal seams of the main Karoo coalfields being relatively shallow are generally not regarded asbeing very gassy. Accordingly, little attention has been paid to CMM recovery and end-use. There are, however, several individual examples of gassy mines in South Africa. The most noted exampleis the Majuba Colliery, which experienced higher than expected levels of methane in the mine workings. Gas desorption tests showed that the coal contains up to 300 cubic feet per ton. In theearly 1990s, several in-mine horizontal wells were drilled to degasify the coal in advance of mining. The mine operators were contemplating various CMM drainage and end-use scenarios, but themine was eventually closed due to other reasons (USEPA, 2004b).
Some South African mines have been known to drain methane prior to mining through surfaceholes and the feasibility of recovering this methane for use in local heating has been widelyinvestigated (UNFCCC, 2000).
31.2.2 CMM EMISSIONS FROM ABANDONED MINES South Africa has a number of abandoned coal mines; the number of operating mines havingdeclined by about one half between 1986 and 2004 (Limpitlaw and Aken, 2005). No data quantifying emissions from abandoned mines in South Africa were found. However, the percentage of gassy mines is thought to be low as most of the gassy areas of South Africa’s coal resources have not yet been developed. It does not appear that any company is currently extracting methane resources from abandoned mines. Key barriers are legal and regulatory constraints; many companies are concerned that once they have received a mine closure certificate, further work inand around the mine could expose them to legal liabilities.
31.2.3 CBM FROM VIRGIN COAL SEAMS The country’s coal bed methane (CBM) resource is estimated to be 0.14 to 0.28 trillion m3. Currently, there is no commercial CBM production reported for South Africa; however, there issignificant discussion about possible future projects, and several pilot wells have been installed andare undergoing testing. Moreover, adoption of CBM/CMM technologies could become increasinglylikely as additional mines are expected to open in gassy coal fields.
The most promising areas for CBM are where the deeper, thicker, and gassier coal resources are found. The Waterberg Basin in the northwest Mpumalanga region of the country and the southwestportion of the Highveld coalfield near Paardekop-Amersfoort are deeper (> 1,000 feet) and gassier(4-10 m3/tonne at 1000-1200 ft) and appear to have the best potential for CBM development (ARI, 1992).
Anglo Coal has been conducting a CBM exploration program in the Waterberg Basin for the past 15years. As part of this program, a series of core wells were drilled and tested and a five-well pilotproduction project was installed. Barriers to project progress include its remote location, delays inrights conversions, lack of prior experience among government authorities, and lack of incentives (DME, 2006; Merwe, 2007). Other CBM licenses are held by Badimo, NT Energy Africa, Molopo/Highland Energy, and numerous smaller companies, but little work has been done to date.
While there is only one active CMM recovery and end-use activity in South Africa, there are several reports, from the gold mining sector, of companies utilizing methane coming from gold mine shafts.For example, at the Harmony Gold Mine in the Free State province, the kitchen stoves and bathhouses were fueled by captured mine methane for over 20 years (USEPA, 2004b). The Beatrix Gold
CMM Country Profiles 284
SOUTH AFRICA
Mine, also in the Free State province, has applied for a methane capture project under the CleanDevelopment Mechanism of the Kyoto Protocol (Le Roux, 2007). Methane emanates from faults andfissures intersected during normal mining operations and a pipeline drainage system is currentlybeing installed to capture the methane at source underground and transport it to the surface where the gas will be flared (Creamer, 2010b). The mine estimates that for an initial outlay of $5.5 million,$27 million in carbon credits will be earned over 7 years through flaring alone, with resultantemission reductions estimated to be 2.6 MmtCO2e. Plans are also in place to begin construction of a methane-fueled, 5-MW power plant in 2011.
31.3 Opportunities and Challenges to Greater CMM Recovery and Use
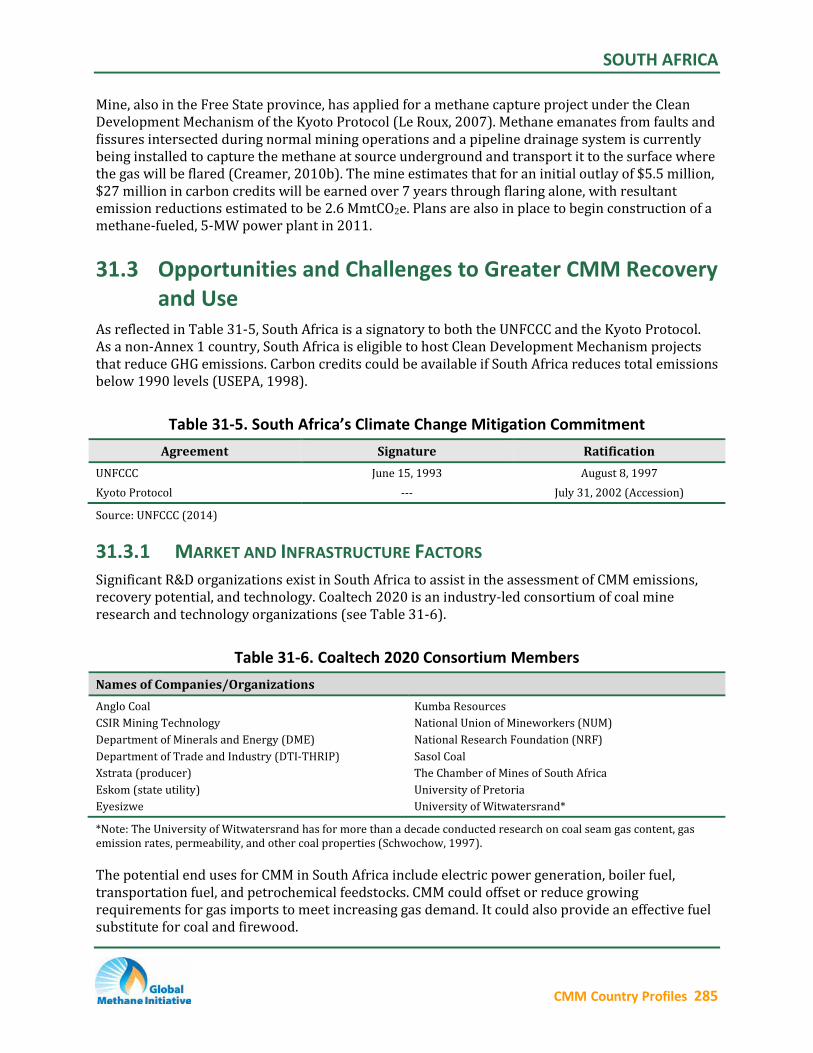
As reflected in Table 31-5, South Africa is a signatory to both the UNFCCC and the Kyoto Protocol.As a non-Annex 1 country, South Africa is eligible to host Clean Development Mechanism projectsthat reduce GHG emissions. Carbon credits could be available if South Africa reduces total emissions below 1990 levels (USEPA, 1998).
Table 31-5. South Africa’s Climate Change Mitigation Commitment Agreement Signature Ratification
UNFCCC June 15, 1993 August 8, 1997 Kyoto Protocol -- July 31, 2002 (Accession)
Source: UNFCCC (2014)
31.3.1 MARKET AND INFRASTRUCTURE FACTORS Significant R&D organizations exist in South Africa to assist in the assessment of CMM emissions,recovery potential, and technology. Coaltech 2020 is an industry-led consortium of coal mineresearch and technology organizations (see Table 31-6).
Table 31-6. Coaltech 2020 Consortium Members Names of Companies/Organizations Anglo Coal CSIR Mining Technology
Department of Minerals and Energy (DME)
Department of Trade and Industry (DTI-THRIP) Xstrata (producer)
Eskom (state utility) Eyesizwe
Kumba Resources National Union of Mineworkers (NUM) National Research Foundation (NRF) Sasol Coal The Chamber of Mines of South Africa University of Pretoria University of Witwatersrand*
*Note: The University of Witwatersrand has for more than a decade conducted research on coal seam gas content, gasemission rates, permeability, and other coal properties (Schwochow, 1997).
The potential end uses for CMM in South Africa include electric power generation, boiler fuel, transportation fuel, and petrochemical feedstocks. CMM could offset or reduce growingrequirements for gas imports to meet increasing gas demand. It could also provide an effective fuel substitute for coal and firewood.
CMM Country Profiles 285
SOUTH AFRICA
Where mines are shallow and less gassy, collected CMM could be used for local heating purposes,but infrastructure would be required. In new areas, where virgin seams are deeper and gassier, CBM development could precede mining. Higher gas volumes from CBM and subsequent CMM incommercial quantities would require infrastructure investments for development of deeper mines,installation of gas collection technologies, and construction of gas pipelines to move the methane tomarkets.
Evidence of the gas potential in South African coals has evolved from a long record of gas-relatedmine explosions. Mines experience problems with gas and dust explosions and fires because thecoals are hard and highly prone to sparking, as are the sandstone roof rocks. The proportion of mine deaths related to explosions increased from 3 percent in 1955 to 21 percent in 1993(Schwochow, 1997).
31.3.2 REGULATORY INFORMATION In South Africa, CBM is defined by law as a unique mineral, so rights to its exploration anddevelopment can be separate from those of coal in the same seam. Under the latest Minerals Act, all mineral rights are vested with the government. Companies that held mineral rights under oldorders, however, can apply for an extension to retain those rights. Technically, developmentlicenses are required by law after commercially successful exploration, but many mines currently operate under exploration licenses. Licensing requirements and applications are available forreview on the Department of Minerals and Energy’s Web site (www.dme.gov.za).
Electricity, petroleum pipelines, and piped gas including CBM are regulated by the independentNational Energy Regulator of South Africa (NERSA), which, among other things, issues licenses forconstruction and operation of gas transmission, storage, distribution, liquefaction, and re-gasification facilities (Gas Act, 2001). The piped gas industry is regulated by the Gas Act as amendedby the National Energy Regulatory Act, which was brought into operation in 2005. Prior to 2005, the gas industry was not regulated and companies had to negotiate a regulatory agreement with the South African Government. The Piped-Gas Regulations Act came into effect in 2007. The Act iscontinuously reviewed by NERSA with the aim of suggesting possible amendments to the Ministerof Minerals and Energy should these be deemed necessary (NERSA, 2009).
31.4 Profiles of Individual Mines A comprehensive inventory of coal mines and coal production in South Africa can be found on theDME web site (DME, 2010c). Detailed spreadsheets of mines and contact information are alsoavailable online at http://www.dme.gov.za. Profiles for individual mines are not available.
31.5 References Anglo (2005): Production starts at Anglo American’s Isibonelo coal mine in South Africa, AngloAmerican
press releases, July 2005. http://www.angloamerican.com/media/press-releases/2005/2005-07-04
ARI (1992): Coalbed Gas -2: Vast Resource Potential Exists in Many Countries, Kuuskraa, Vello A., and Jonathan R. Kelafant., Oil & Gas Journal, 2 November 1992. (Reprint)
CM (2013): Facts and Figures 2012, Chamber of Mines of South Africa, 2013.https://commondatastorage.googleapis.com/comsa/facts-and-figures-2013.pdf
CMM Country Profiles 286
SOUTH AFRICA
COA (2009): Coal of Africa Limited, Annual Report, 2009. http://www.coalofafrica.com/annualreports/CoAL_AR_2009.pdf
Creamer (2010a): “Methane flaring mitigating climate change – Anglo Thermal Coal,” Mining Weekly, 12 May2010. http://www.miningweekly.com/article/methane-flaring-mitigating-climate-change-anglothermal-coal-2010-05-12
Creamer (2010b): “Gold Fields turns killer-gas methane curse into R200m Beatrix revenue stream,” MiningWeekly, 26 May 2010. http://www.miningweekly.com/article/gold-fields-turns-killer-gas-methanecurse-into-r200m-beatrix-revenue-stream-2010-05-26
DEAT (2010): National Greenhouse Gas Inventory, Department of Environmental Affairs and Tourism climatechange web page, accessed July 2010.http://www.environment.gov.za/ClimateChange2005/National_Greenhouse_Gas_Inventory.htm
DME (2006): South Africa’s Mineral Industry 2005/2006, South Africa Department of Minerals and Energy, 2006.
DME (2008): South Africa’s Mineral Industry 2007/2008, South Africa Department of Minerals and Energy, 2008.
DME (2009): Operating Mines and Quarries and Minerals Processing Plants in the Republic of South Africa –2009, South Africa Department of Minerals and Energy, Pretoria, South Africa, 2009.
DME (2010a): “Coal,” South Africa Department of Minerals and Energy, accessed 2010.
DME (2010b): “Overview of the Minerals Industry,” South Africa Department of Minerals and Energy,accessed 2010.
DME (2010c): “Mineral Directories,” South Africa Department of Minerals and Energy, accessed 2010.
DMR (2013): Stat Tables 2013, Department of Mineral Resources, 2013.
EIA (2007): Data obtained from International Energy Annual 2005, U.S. Energy Information Administration, Washington, DC, table posted 21 June 2007.
EIA (2013): International Energy Statistics, U.S. Energy Information Administration, Washington, DC, dataaccessed June 2014. http://www.eia.gov/cfapps/ipdbproject/iedindex3.cfm?tid=1&pid=7&aid=1&cid=regions&syid=1980&eyid=2007&unit=TST#
EIA (2014): South Africa Country Analysis Brief, U.S. Energy Information Administration, Washington, DC, 28February 2014. http://www.eia.gov/countries/analysisbriefs/South_africa/south_africa.pdf
ESK (2014): Coal Fact Sheet, Eskom, Johannesburg, South Africa, January 2014.http://www.eskom.co.za/AboutElectricity/FactsFigures/Documents/CO0007CoalSARev12.pdf
Gas Act (2001): Act No. 48 of 2001, Published in the Government Gazette of the Republic of South Africa, 21February 2002.
GCIS (2013): South Africa Yearbook 2012/2013 – Minerals, Energy and Geology, Government Communication and Information System, 2013.http://www.gcis.gov.za/sites/www.gcis.gov.za/files/docs/resourcecentre/yearbook/2012/08%20Energy%20.pdf
GMI (2014): International Coal Mine Methane Projects Database, Global Methane Initiative, accessed October2014. https://www.globalmethane.org/coal-mines/cmm/index.aspx
IEA (2013): Energy Statistics – Share of total primary energy supply in 2011, International Energy Agency,Paris, France, accessed 10 June 2014. http://www.iea.org/stats/WebGraphs/SOUTHAFRIC4.pdf
Limpitlaw and Aken (2005): “Post Mining Rehabilitation, Land Use, and Pollution at Colliers in South Africa,”presented at the Colloquium: Sustainable Development in the Life of Coal Mining, Boksburg, 13 July 2005.
CMM Country Profiles 287
SOUTH AFRICA
http://limpitlawconsulting.com/05Limpitlaw%20et%20al%202005%20Post%20Mining%20Rehabilitation%20Land%20Use%20and%20Pollution%20at%20Collieries.pdf
Le Roux (2007):“Gold Mine Pursues Carbon Credits for Methane Capture,” Mining Weekly Online, Helene Le Roux, May 2007. http://www.miningweekly.com/article/gold-mine-pursues-carbon-credits-formethane-capture-2007-05-04
Lloyd and Cook (2004): Methane Release from South African Coal Mines, Lloyd, Philip and Alan Cook, 2004.http://www.erc.uct.ac.za/Research/publications/05Lloyd-Cook%20Methane%20release.pdf
Merwe (2007): “Interest in Coal Bed Methane on the Increase,” Mining Weekly Online, Christy van der Merwe,March 2007. http://www.miningweekly.com/article/interest-in-coalbed-methane-on-the-increase2007-03-16
NERSA (2009): NERSA Annual Report for 2008/09, posted 2009.http://www.nersa.org.za/Admin/Document/Editor/file/News%20and%20Publications/Publications/Current%20Issues/NERSA%20Annual%20Report%202009.pdf
SAinfo (2009): South Africa ‘needs 40 new coal mines,’ August 2009.http://www.southafrica.info/news/business/832012.htm
Schwochow (1997): The International Coal Seam Gas Report, Cairn Point Publishing, Steve Schwochow, chief editor, 1997.
UNFCCC (2000): South Africa “Initial National Communication to UN Framework Convention on ClimateChange,” p.77, October 2000. http://unfccc.int/resource/docs/natc/zafnc01.pdf
UNFCCC (2014): Ratification Status – South Africa, United Nations Framework Convention on Climate Change,accessed September 2014. http://maindb.unfccc.int/public/country.pl?country=ZA
USEPA (1998): “South Africa Country Fact Sheet” World Bank / U.S. EPA Seminar and Roundtable on CoalbedMethane Development Potential, September 1998.
USEPA (2004a): Coalbed Methane Outreach Program South Africa Trip Report, 1-13 March 2004.
USEPA (2004b): International Activities – South Africa, U.S. Environmental Protection Agency, Coalbed Methane Outreach Program, 2004.
USEPA (2012): Global Anthropogenic Non-CO2 Greenhouse Gas Emissions: 1990 – 2030, U.S. EnvironmentalProtection Agency, Office of Atmospheric Programs, Climate Change Division, December 2012.http://www.epa.gov/climatechange/EPAactivities/economics/nonco2projections.html
CMM Country Profiles 288