3 the global carbon cycle: geological …geosci.uchicago.edu/~kite/doc/fundamentals_of_geo... ·...
TRANSCRIPT

20
Fundamentals of Geobiology, First Edition. Edited by Andrew H. Knoll, Donald E. Canfield and Kurt O. Konhauser.
© 2012 Blackwell Publishing Ltd. Published 2012 by Blackwell Publishing Ltd.
3
THE GLOBAL CARBON CYCLE:
GEOLOGICAL PROCESSESKlaus Wallmann1 and Giovanni Aloisi1,2
1Leibniz Institute for Marine Sciences (IFM-GEOMAR), Wischhofstrasse, 1–3; 24148, Kiel, Germany2UMR CNRS 7159LOCEAN, Universite Pierre et Marie Curie, Paris, France
3.1 Introduction
In this chapter, we will discuss the geological carbon
cycle including all processes controlling the distribution
of carbon between the interior of the Earth, the litho-
sphere, the hydrosphere and the atmosphere (Fig. 3.1,
Table 3.1). Our discussion focuses on the geochemical
evolution of carbon inventories and fluxes on a multi-
million year timescale. We will first address the magni-
tude of carbon fluxes in the pre-human Holocene and
then over the last million years. We next examine the
feedbacks stabilizing the distribution of carbon on our
planet and present a balanced geological carbon cycle.
Subsequently, we explore proxies and models to explain
how carbon cycling may have changed over the Earth’s
geological history in parallel with its biological and geo-
logical evolution.
3.2 Organic carbon cycling
Land plants and phytoplankton use solar energy to con-
vert atmospheric CO2 into biomass via photosynthesis.
The overall stoichiometry of photosynthesis can be
expressed as:
⇒2 2 2 2CO + H O C(H O) + O (3.1)
where the simple carbohydrate C(H2O) represents
organic carbon formed by this process. Molecular oxy-
gen (O2) is released as an important by-product of this
reaction (see Chapter 7). Most of the biomass formed by
photosynthesis, however, is rapidly consumed by
microorganisms living in soils and in the oceans. Just as
humans do, they use the biomass as an energy resource
and recycle CO2 into the atmosphere (electron acceptors
other than O2 are also used to oxidize organic matter as
described below):
⇒2 2 2 2C(H O) + O CO + H O (3.2)
This respiration process consumes more than 99% of the
biomass produced by photosynthesis both on land and
in the sea (Table 3.2). On land, the remaining biomass
accumulates in living vegetation, soils and detritus, but
this is only transient, as most terrestrial organic matter is
finally exported into the oceans by rivers in dissolved or
particulate form (IPCC, 2007). Overall, approximately
4–5 Tmol yr−1 of terrestrial organic matter accumulates
in marine sediments deposited on the continental shelf
(Burdige, 2005). During certain periods of the geological
past (e.g. Permian, Carboniferous) however, the accu-
mulation of terrestrial organic carbon in swamps and
wetlands contributed significantly to the global carbon
burial flux (Berner and Canfield, 1989).
Ancient marine sediments represented by shales are
by far the largest reservoir of organic carbon on our
planet. Organic matter is liberated from these rocks, and
other rocks including carbonates, by physical erosion
and chemical weathering. Even though this old organic
matter is much more resistant towards microbial degra-
dation than young organic carbon in soils, studies indi-
cate that it is oxidized by microbes in the presence of
atmospheric oxygen (Petsch et al., 2001). Thus, if the oxi-
dation reactions proceed much faster than the geological
processes (uplift, physical erosion, chemical weather-
ing) that expose fossil organic matter to the atmosphere
Knoll_c03.indd 20Knoll_c03.indd 20 2/16/2012 1:27:31 PM2/16/2012 1:27:31 PM

The Global Carbon Cycle: Geological Processes 21
Atmosphere,oceans, soils
BBC BPOC
DC
DPOC
DM
WC
WPOC
BAC BCH4
WOSIL
WCSIL
(b) Fluxes affecting CO2 in the surfacereseroirs of the C - cycle
Carbonate minerals
Continents
Oceanic crust
Continents
Oceanic crust
Organic carbon
Atmosphere,oceans,
biosphere, soils
BBC, BACBPOC, BCH4
DCDPOC
DM
WCWPOC
AOCEPOC
APOC
EC
AC
Mantle
SCSPOC
(a) The geological C - cycle
Figure 3.1 (a) The geological carbon (C) cycle; (b) fluxes
affecting the concentration of carbon dioxide (CO2) in the
surface reservoir of the carbon cycle. Notes: fluxes that are
discussed in detail and quantified in the present work are
solid arrows: BPOC
(burial of POC in marine sediments), BCH4
(burial of methane in marine sediments), BBC
(burial of
biogenic carbonates in marine sediments), BAC
(burial of
authigenic carbonates in marine sediments), DPOC
(metamorphic degassing of POC), DC (metamorphic degassing
of carbonate minerals), DM
(degassing of the mantle), WPOC
(weathering of POC on the continents), WC (weathering of
carbonates on the continents), AOC
(alteration of oceanic crust),
WCSIL
(weathering of silicate minerals on the continents), WOSIL
(weathering of silicate minerals in marine sediments). Other
carbon fluxes are (dashed arrows): EPOC
(erosion and transport
of POC to the ocean), APOC
(accretion of POC during
continental collision), EC (erosion and transport of carbonate
minerals to the ocean), AC (accretion of carbonate minerals
during continental collision), SPOC
(subduction of POC in the
mantle), SC (subduction of carbonate minerals in the mantle).
Table 3.1 Distribution of carbon on our planet
( pre-human Holocene)
Substance Mass (1018 mol)
Carbonate C in rocks 5000
Organic C in rocks 1250
Methane in gas hydrates 0.1–0.3
C in soil 0.3
Inorganic C dissolved in deep ocean
(>100 m water depth)
2.7
Inorganic C dissolved in upper ocean
(0–100 m water depth)
0.1
Atmospheric CO2
0.06
Terrestrial biosphere 0.05
Marine biosphere 0.0005
Modified from Berner (2004) and Wallmann (2001).
Table 3.2 The global cycle of organic carbon (pre-human
Holocene, fluxes in Tmol C yr−1)
Land
CO2-fixation in living biomass 4700
Accumulation of terrestrial organic carbon in
vegetation, soil and detritus
33
Export of terrestrial organic carbon to the oceans 33
Weathering of fossil organic carbon (WPOC
) 8–16
Oceans
CO2-fixation in living biomass 4040
Export of marine biomass into the deep ocean 800
Rain of particulate organic matter to the seafloor 190
Burial of organic matter in surface sediments 10–65
Burial of organic matter, authigenic carbonate and
methane in deep sediments (BPOC
+ BAC
+ BCH4
)
5.4–27
Modified after (IPCC, 2007); (Sarmiento and Gruber, 2006);
Burdige, 2007; Wallmann, 2001; Wallmann et al., 2008. Note:
symbols for fluxes correspond to those appearing in Fig. 3.1.
Knoll_c03.indd 21Knoll_c03.indd 21 2/16/2012 1:27:34 PM2/16/2012 1:27:34 PM

22 Fundamentals of Geobiology
(Berner, 2004), which is normally true (Bolton et al., 2006), then upon exposure, a significant fraction of fossil
organic carbon is ultimately degraded into CO2. The
total rate of organic carbon weathering is estimated
as ∼8 Tmol of particulate organic carbon (POC) yr−1, cal-
culated from a rock denudation rate of 22 × 1015 g yr−1
(Berner and Berner, 1996) and an average POC concen-
tration in weathering rocks of 0.45 wt-% (Lasaga and
Ohmoto, 2002).
The total rate of physical erosion, however, is larger
than the rate of continental denudation since much sedi-
ment eroded from upland areas is deposited in lowland
areas without reaching the oceans. Thus, only about 10%
of the sediments eroded in the United States reaches the
oceans, whereas the remaining 90 % is re-deposited on
the continents (Berner and Berner, 1996). On the other
hand, physical erosion has been greatly accelerated by
agriculture and other human land-uses. It is thus very
difficult to constrain the modern and pre-human rates of
physical erosion and organic matter weathering.
Considering the available data on physical erosion and
continental sediment recycling (Gaillardet et al., 1999b)
and the modeling results on POC weathering in shales
(Bolton et al., 2006), we estimate that about 8–16 Tmol of
CO2 yr−1 were produced by POC weathering during the
pre-human Holocene.
Phytoplankton living in the surface layer of the
oceans contribute significantly to the global primary
production, and most of the organic matter produced
(typically about 80%) is consumed by microbes and
zooplankton within the upper ∼ 100 m of the water col-
umn (Sarmiento and Gruber, 2006). Of the fraction
exported into the deeper ocean as sinking particles
(Table 3.2), most is degraded during passage to the sea-
floor. Furthermore, of the particulate organic matter
reaching the seafloor a large proportion is consumed
by microbes and other benthic organisms living in the
top 10 cm of the sediment column. Only a small fraction
of this organic matter is finally preserved into marine
sediments accumulating at the deep-sea seafloor.
However, much more organic matter is preserved in
rapidly depositing shallow shelf sediments and there is
a consensus that most marine organic carbon is cur-
rently buried in these sediments (Dunne et al., 2007;
Hedges and Keil, 1995; Middelburg et al., 1993). The
rate of organic carbon burial in seafloor sediments is
only poorly constrained (Burdige, 2007) and falls into
the broad range of 10–65 Tmol yr−1 (Table 3.2). Estimates
generated from marine productivity and particle export
data (Dunne et al., 2007) are much higher than estimates
based on mass balances from sediment data (Hedges
and Keil, 1995).
Before final preservation, much organic matter is
decomposed by anaerobic microbes, of which sulfate
reducers are particularly important (see Chapter 5).
These microbes use seawater sulfate as an oxidant and
convert sedimentary organic matter into bicarbonate
(HCO3−):
− −⇒ +22 4 3 2
1 1C(H O) + SO HCO H S
2 2 (3.3)
Much of the sulfide (HS− and H2S) produced is fixed as
pyrite (FeS2) and other authigenic sulfide minerals.
Further down in the sediment column, where sulfate is
completely consumed, other microbes transform organic
carbon into methane (CH4) and CO
2:
⇒2 2 4C(H O) ½ CO + ½ CH (3.4)
Natural gas hydrates are formed in marine sediments
from methane produced in deep sediment layers by the
microbial degradation of organic matter. Applying the
appropriate kinetic rate laws for the microbial
degradation of organic matter in marine sediments
(Middelburg, 1989; Wallmann et al., 2006), it is estimated
that only ∼20 ± 10% (∼ 2–13 Tmol C yr−1) of the organic
matter buried in surface sediments is still preserved
after 1 million years of microbial degradation. The major
portion of buried organic matter (80 ± 10 %) is, thus,
transformed into HCO3−, CO
2 and CH
4. These metabolites
are either recycled into the ocean or fixed as authigenic
carbonate minerals, gas hydrates and natural gas in
marine sediments (Dickens, 2003; Wallmann et al., 2006;
Wallmann et al., 2008). The burial flux of authigenic
CaCO3 in anoxic marine sediments has been estimated
as 3.3–13.3 Tmol yr−1 (Wallmann et al., 2008) while the
accumulation rate of methane and methane hydrates in
deep sediments may fall into the range of 0.1–0.6 Tmol
yr−1 (Dickens, 2003).
When considering long-term climatic change and the
geochemical evolution of the Earth on a million year
time scale, the most relevant fluxes in the recycling of
organic carbon are the weathering of fossil organic car-
bon on land (8–16 Tmol yr−1) and the burial of organic
matter, authigenic carbonates and methane in marine
sediments (5.4–27 Tmol yr−1; Table 3.2).
3.3 Carbonate cycling
Most of the carbon residing on the surface of the Earth is
bound in carbonate minerals (Table 3.1), and the turno-
ver of these carbonates has a profound effect on geologi-
cal carbon cycling. Today, carbonates are mostly formed
by marine organisms using calcium carbonates (CaCO3,
calcite or aragonite) as shell material. The overall stoi-
chiometry of this biogenic calcification can be formu-
lated as:
2+3 3 2 2Ca + 2HCO CaCO + CO + H O− ⇒
(3.5)
Knoll_c03.indd 22Knoll_c03.indd 22 2/16/2012 1:27:34 PM2/16/2012 1:27:34 PM
The Global Carbon Cycle: Geological Processes 23
Biogenic carbonate formation thus serves as a sink for
seawater bicarbonate and as a source for atmospheric
CO2 (Table 3.3).
Calcification occurs on shallow and warm continental
shelf areas where corals and other organisms produce
aragonite and calcite in large scale at an estimated
10 Tmol CaCO3 yr−1 (Kleypas, 1997). Due to smaller shelf
area and a lower sea-level stand, carbonate accumula-
tion was probably reduced to ∼3 Tmol yr−1 during the
last glacial maximum (Kleypas, 1997). The average
CaCO3 accumulation rate on the continental shelf over
the last one million years may thus be estimated as
4–7 Tmol yr−1.
Much more biogenic carbonate is formed by calcare-
ous plankton living in the open oceans, and about
40–130 Tmol CaCO3 yr−1 of this pelagic carbonate is
exported into the deep ocean by sinking particles
(Berelson et al., 2007; Dunne et al., 2007). Most of the
exported carbonate is, however, dissolved on its way to
the seafloor because deep water masses are often under-
saturated with respect to aragonite and calcite. Moreover,
a large fraction of CaCO3 raining to the seafloor is dis-
solved within surface sediments by metabolic CO2
produced during the microbial decomposition of sedi-
mentary organic matter (Archer, 1996). The accumula-
tion of pelagic carbonates in seafloor sediments is thus
reduced to 10 Tmol yr−1 (Berelson et al., 2007). The
accumulation rate of pelagic carbonates has probably
changed little through glacial/interglacial climate
cycles, and the overall global accumulation rate of
biogenic carbonate over the last 1 million years may
thus be estimated as 14–17 Tmol yr−1.
Bicarbonate dissolved in seawater is precipitated as
carbonates during the reaction of oceanic crust with sea-
water at moderate temperatures (0–50 °C):
3
3
basaltic ocean crust + HCO
CaCO + altered ocean crust
−
⇒
(3.6)
Because protons released from HCO3− during carbonate
precipitation are mostly consumed by seafloor weather-
ing reactions (Wallmann, 2001), the alteration of ocean
crust serves as a sink for seawater bicarbonate but not as
source for CO2. Rates of CaCO
3 accumulation in oceanic
crust are estimated at 1.5–2.4 Tmol of CaCO3 yr−1
(Wallmann, 2001).
Carbonates also accumulate in anoxic marine sedi-
ments because large amounts of carbonate alkalinity are
formed from organic matter decomposition by micro-
bial sulfate reduction, by the anaerobic oxidation of
methane, and by the weathering of silicate minerals
(Wallmann et al., 2008). The burial flux of authigenic
CaCO3 in anoxic marine sediments has been estimated
as 3.3–13.3 Tmol yr−1 (Wallmann et al., 2008). This carbon
flux contributes significantly to the burial of atmos-
pheric CO2 in marine sediments and may be regarded as
part of the organic carbon burial flux.
Most of the bicarbonate in river water is derived from
the weathering and dissolution of carbonates on land.
Carbonate weathering serves as an important sink for
atmospheric CO2 and a source of seawater bicarbonate:
2+3 2 2 3CaCO + CO + H O Ca + 2HCO−⇒
(3.7)
River chemistry data suggest that 12.3 Tmol of CO2 yr−1
are presently consumed by carbonate weathering
(Gaillardet et al., 1999b). This flux is probably not
strongly affected by human land use and other anthro-
pogenic effects. During glacial sea-level low-stands, car-
bonate banks and reefs were exposed to the atmosphere.
Some studies suggest that because of this, carbonate
weathering was enhanced by 2–6 Tmol CO2 yr−1 during
the last glacial maximum (Ludwig et al., 1999; Munhoven,
2002). Other studies (Lerman et al., 2007) conclude that
lower temperatures, diminished runoff and expanded
ice area would have reduced carbonate weathering by
30%. Overall, the average rate of CO2 consumption
through carbonate weathering over the last 1 million
years probably falls in the range of 10–16 Tmol yr−1.
3.4 Mantle degassing
Magma is produced by the partial melting of mantle
rocks at spreading centres, subduction zones, and hot
spot volcanoes. Carbon is an incompatible element that
is strongly enriched in the partial melt and delivered to
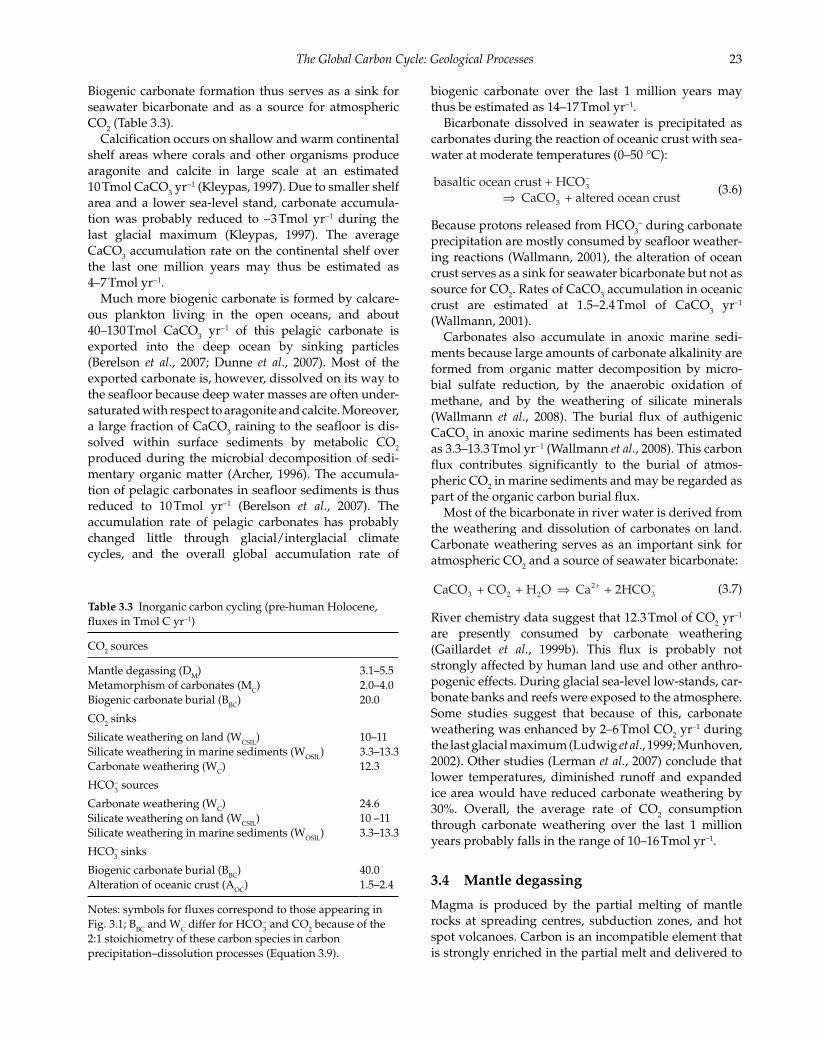
Table 3.3 Inorganic carbon cycling (pre-human Holocene,
fluxes in Tmol C yr−1)
CO2 sources
Mantle degassing (DM
) 3.1–5.5
Metamorphism of carbonates (MC) 2.0–4.0
Biogenic carbonate burial (BBC
) 20.0
CO2 sinks
Silicate weathering on land (WCSIL
) 10–11
Silicate weathering in marine sediments (WOSIL
) 3.3–13.3
Carbonate weathering (WC) 12.3
HCO3− sources
Carbonate weathering (WC) 24.6
Silicate weathering on land (WCSIL
) 10 –11
Silicate weathering in marine sediments (WOSIL
) 3.3–13.3
HCO3− sinks
Biogenic carbonate burial (BBC
) 40.0
Alteration of oceanic crust (AOC
) 1.5–2.4
Notes: symbols for fluxes correspond to those appearing in
Fig. 3.1; BBC
and WC differ for HCO
3− and CO
2 because of the
2:1 stoichiometry of these carbon species in carbon
precipitation–dissolution processes (Equation 3.9).
Knoll_c03.indd 23Knoll_c03.indd 23 2/16/2012 1:27:38 PM2/16/2012 1:27:38 PM
24 Fundamentals of Geobiology
the surface environment as lava is extruded. 3He, a pri-
mordial isotope stored in the mantle, has a similar solu-
bility in magma as CO2 and can be used to track and
trace volcanic CO2 emissions. The largest 3He fluxes are
found at submarine spreading centres. The global 3He
flux within this tectonic setting (1000 mol 3He yr−1) is
well constrained (Farley et al., 1995), and the molar
CO2/3He ratio in the volcanic volatile phase has been
measured in hydrothermal fluids (Resing et al., 2004)
and a large number of fluid and melt inclusions (Marty
and Tolstikhin, 1998). It converges towards a value of 2 ×
109 (Resing et al., 2004). Applying this ratio and the total 3He flux, the CO
2 emissions at spreading centres become
2 Tmol yr−1.
Unfortunately, it is not possible to derive the global 3He flux at subduction zones from the few reliable 3He
flux measurements available. Thus, mantle-CO2 fluxes
have been calculated from estimates for magma produc-
tion and degree of partial melting in this tectonic setting
(Marty and Tolstikhin, 1998). With this approach, the
release of mantle-CO2 at subduction zones is estimated
as 0.3–0.5 Tmol yr−1 (Marty and Tolstikhin, 1998; Sano
and Williams, 1996). Additional CO2 is also released at
subduction zones by the metamorphism of subducted
carbonate rocks and fossil organic carbon (see below).
Hot spot and intra-plate volcanoes tap deeper into the
mantle, and estimates of CO2 emissions from these types
of volcano, though poorly constrained, fall into the
range of 0.8–3 Tmol yr−1 (Allard, 1992; Marty and
Tolstikhin, 1998). The total rate of CO2 release from the
mantle is thus 3.1–5.5 Tmol CO2 yr−1.
3.5 Metamorphism
Metamorphism takes place at convergent continental
margins where during subduction and associated
mountain building, rocks are exposed to high tempera-
tures and pressures. Carbonate and organic matter-
bearing rocks may release CO2 into the atmosphere
under these conditions. Indeed, Becker et al. (2008) esti-
mated that 0.9 Tmol yr−1 of metamorphic CO2 is emitted
into the atmosphere in the Himalayas. This CO2 comes
from carbonate rocks and to a smaller extent from
organic carbon exposed to high temperatures (∼ 300 °C)
at a depth of ∼ 6 km below the surface.
The 13C/12C and 3He/CO2 ratios in volcanic gases
emitted at subduction zones indicate that most of the
CO2 comes from subducted carbonates (Sano and
Williams, 1996). CO2 measurements at fumaroles indi-
cate that ∼ 3.3 Tmol CO2 yr−1 is emitted into the atmos-
phere by metamorphic decarbonation of subducting
slabs (Sano and Williams, 1996). Decarbonation is pro-
moted by the infiltration of H2O-rich fluids into carbon-
ate-bearing rocks. This water is mostly released from the
lower oceanic crust or from serpentinite, a water-rich
mineral formed by the reaction of upper mantle rocks
with seawater. Numerical modeling predicts a global
CO2 flux from subducted carbonates of 0.35–3.12 Tmol
yr−1 (Gorman et al., 2006). Considering contributions
from the Himalayas and other major collision zones, the
total metamorphic release of CO2 from carbonate-bear-
ing rocks is estimated as 2 – 4 Tmol CO2 yr−1. The CO
2
contribution from fossil organic carbon is estimated
using the 13C/12C ratios measured at CO2-rich fumorals
and hot springs in volcanic arcs (Sano and Williams,
1996) and back-arcs of subduction zones (Seward and
Kerrick, 1996) and in the Himalayas (Becker et al., 2008).
Overall, the metamorphic release of organic matter
amounts to 0.4–0.6 Tmol of CO2 yr−1.
3.6 Silicate weathering
Chemical weathering transforms primary silicate min-
erals such as feldspars into clays and other particulate
and dissolved products. The overall reaction may be
represented as:
2
4 4 3
primary silicates + CO clays
+ dissolved metal cations
+ H SiO + HCO−
⇒
(3.8)
Dissolved metal cations (Mg2+, Ca2+, Na+, K+, ...) and silica
(H4SiO
4) are released during this reaction while CO
2 is
transformed into bicarbonate (HCO3−). The dissolved
products are transported into the oceans through rivers
and groundwater discharge. Silicate weathering is the
most important sink for atmospheric CO2 on geological
time scales. It removes CO2 from the atmosphere and
increases the dissolved bicarbonate load of the oceans.
Studies of river chemistry indicate that about
11.7 Tmol of atmospheric CO2 yr−1 are presently con-
sumed by silicate weathering (Gaillardet et al., 1999b),
with young basaltic rocks and tephra the most reactive,
contributing ∼4.1 Tmol CO2 yr−1 to this global weather-
ing rate (Dessert et al., 2003). Silicate weathering is pro-
moted by physical erosion because the reactive surface
area of silicate minerals is greatly enhanced by the
grinding of rocks into finer particles (Gaillardet et al., 1999a). Physical erosion has been increased by human
land use since cropland, pasture, and open range export
much more particulate material than natural forest and
grassland (Berner and Berner, 1996). Humans have
increased the sediment transport by global rivers
through soil erosion by about 16% {Syvitski, 2005, p.
3949}. Considering these man-made effects on physical
erosion, the pre-human rate of silicate weathering is
here estimated as 10–11 Tmol CO2 yr−1.
Silicate weathering is enhanced in soils compared to
bare rock. This is because soils have a higher partial
pressure of CO2 due to organic matter decompositions
Knoll_c03.indd 24Knoll_c03.indd 24 2/16/2012 1:27:40 PM2/16/2012 1:27:40 PM

The Global Carbon Cycle: Geological Processes 25
(Lerman et al., 2007) and because plants and microbes
release organic chemicals which remove Al3+ and other
cations from the surface of silicate minerals promoting
dissolution (Berner and Berner, 1996). Rates of silicate
weathering were, therefore, much lower before the
advent of land plants during the Paleozoic (Berner, 2004;
see chapter 11).
Most importantly, silicate weathering depends on
climate and the variables of temperature, runoff, and
pCO2 (Berner, 1994). The hydrological cycle – including
evaporation, precipitation, and runoff – is accelerated
under warm surface conditions, while high surface
temperatures are usually related to elevated pCO2
values. This threefold link creates a strong climate sen-
sitivity of silicate weathering. The rate of silicate
weathering was probably reduced by 10–40 % during
the last glacial maximum by cooler surface tempera-
tures, lower pCO2, diminished runoff and the sealing
of land surfaces by the expansion of continental ice
shields (Lerman et al., 2007; Munhoven, 2002). Thus,
the global rate of silicate weathering averaged over
the last 1 million years is probably in the range of
6 – 10 Tmol CO2 yr−1.
Reactive silicate minerals not weathered on land are
ultimately deposited on the seafloor in continental
margin sediments, and these minerals are reactive
within sediments (Maher et al., 2004). Silicate weather-
ing rates are especially high in anoxic sediments rich in
labile organic matter. Indeed, most of the metabolic
CO2 produced during organic matter decomposition is
converted into HCO3
− by reaction with feldspars, vol-
canic ash and other silicate minerals (Wallmann et al., 2008). The rate of silicate weathering in marine sedi-
ments has been estimated as 5–20 Tmol CO2
yr−1(Wallmann et al., 2008). About one third of the bicar-
bonate generated by marine weathering is fixed in
authigenic carbonates and is treated here as part of the
organic carbon cycle as it is ultimately produced by
organic matter decomposition. The remaining fraction
(3.3–13.3 Tmol of HCO3
− yr−1 ) is recycled into the
oceans. These new data suggest that the rate of marine
silicate weathering may be as high as the rate of conti-
nental silicate weathering.
3.7 Feedbacks
Drastic changes in atmospheric pCO2 and seawater
bicarbonate concentration are mitigated by negative
feedbacks in the geological carbon cycle. As an example,
inorganic carbon is removed from the oceans and atmos-
phere when levels of atmospheric CO2 or seawater
bicarbonate are too high. Such negative feedbacks also
work in the opposite direction, where, for example,
depleted inventories of inorganic carbon in the oceans
and atmosphere can be restored to pre-depletion levels.
The most important negative feedback on atmos-
pheric pCO2 is through the temperature sensitivity of
terrestrial silicate weathering (see below). If volcanoes
deliver high doses of CO2 to the oceans and atmosphere,
the concentrations of CO2 reach only moderate levels.
This is because the removal rate of CO2 by silicate and
carbonate weathering is accelerated due to higher tem-
peratures imparted by the higher CO2 concentrations
(Walker et al., 1981). Conversely, with a reduced source
of CO2, atmosphere CO
2 concentrations do not fall too
low as the resulting lower temperatures reduce the
removal rate of CO2 by weathering. Therefore, the tem-
perature sensitivity of weathering reactions acts to stabi-
lize atmospheric pCO2.
Bicarbonate concentrations in the oceans are stabi-
lized by another negative feedback loop. Bicarbonate is
mainly removed from the oceans by the burial of bio-
genic carbonates in sediments (see above). Carbonate
burial depends on the saturation state of seawater with
respect to calcite and aragonite. With high bicarbonate
concentrations in seawater, oceans tend to be oversatu-
rated with respect to these carbonate minerals, increas-
ing the accumulation of carbonate in sediments and
stabilizing bicarbonate concentration at a moderate
level. The equilibrium reaction representing carbonate
precipitation and dissolution within the oceans is shown
in Equation 3.9.
2+3 3 2 2Ca + 2HCO CaCO + CO + H O− ⇔
(3.9)
This reaction equation also demonstrates an additional
negative feedback on CO2 since surplus CO
2 delivered
by volcanoes and other sources is removed from the
oceans and atmosphere by enhanced carbonate dissolu-
tion at the seafloor.
Organic carbon burial in the seafloor is another impor-
tant CO2 sink (see above). It is ultimately regulated by
the inventory of dissolved phosphate in the oceans since
phosphate is the major limiting nutrient for marine pro-
ductivity on geological timescales. Since organic carbon
burial and phosphorus removal are enhanced when
oceanic phosphate inventories are high, the phosphate
inventory and marine productivity are restored to mod-
erate levels by organic matter burial in a negative feed-
back loop. Phosphate is delivered to the oceans through
chemical weathering on land, and since weathering
rates are accelerated at high pCO2, enhanced phosphate
delivery to the oceans and elevated organic matter bur-
ial dates are promoted by high pCO2 levels. Thus,
organic matter burial provides a negative feedback for
the stabilization of atmospheric pCO2 values (Wallmann,
2001). The C:P ratio of marine phytoplankton increases
at elevated pCO2 levels (Riebesell et al., 2007). Therefore,
more organic carbon can be fixed and stored in marine
sediments for a given oceanic phosphate inventory
Knoll_c03.indd 25Knoll_c03.indd 25 2/16/2012 1:27:41 PM2/16/2012 1:27:41 PM

26 Fundamentals of Geobiology
when surplus CO2 is added to the atmosphere. Together,
these negative feedbacks have acted to maintain the car-
bon inventory of oceans and atmosphere at a moderate
level throughout Earth’s history.
Positive feedbacks may amplify the effects of natural
and anthropogenic perturbations to the carbon cycle
and destabilize the carbon inventories in oceans and
atmosphere. An example relates to marine productivity
and organic carbon burial, with dissolved iron in seawa-
ter playing a key role in this feedback loop. Iron is
another essential nutrient for marine plankton, limiting
marine productivity in many areas of the modern ocean
(Sarmiento and Gruber, 2006). Iron is mostly delivered
to the oceans as wind-blown dust particles. At low pCO2
values and surface temperatures, land tends to be drier
and winds are stronger, resulting in a larger dust and
iron flux to the oceans, which may ultimately increase
CO2 removal via ocean fertilization. Through this chain
of processes, low pCO2 values may be further dimin-
ished by enhanced marine productivity and organic car-
bon burial rates in a positive feedback loop. Fortunately,
these positive feedbacks are usually mitigated by more
powerful negative feedback loops on geological time
scales. Otherwise, life on Earth could not be maintained.
3.8 Balancing the geological carbon cycle
In what follows, we apply a mass balance approach to
constrain the fluxes in the geological carbon cycle. Ice
core data show that atmospheric pCO2 has ranged from
190 and 280 μatm over the last 400 kyr (Petit et al., 1999)
responding to glacial/interglacial cycles without a sig-
nificant long-term trend. It may thus be concluded that
the carbon cycle reached a pseudo-steady state during
the last 1 million years with an average pCO2 of
∼230 μatm overprinted by short term oscillations. This
steady state is achieved through negative feedbacks sta-
bilizing the global CO2 inventory in oceans and atmos-
phere (see above). The long-term mass balance for CO2
may thus be formulated as:
2 2CO sinks = CO sources (3.10)
with
CO2 sinks = carbonate weathering (W
C) + silicate weath-
ering on land (WCSIL
) + silicate weathering in
marine sediments (WOSIL
) + burial of POC
(BPOC
), authigenic carbonates (BAC
), and
methane (BCH4
) in marine sediments
CO2 sources = mantle degassing (D
M) + metamorphic
degassing of carbonates (DC) + metamorphic
degassing of POC (DPOC
) + POC weathering
(WPOC
) + biogenic carbonate burial (BBC
)
where the symbols for the different fluxes of carbon are
the same as those which appear in Fig. 3.1. We also
assume that the total carbon inventory of oceans and
atmosphere reached a steady state:
carbon sinks = carbon sources (3.11)
with
carbon sinks = biogenic carbonate burial (BBC
) + burial of
POC (BPOC
), authigenic carbonates (BAC
),
and methane (BCH4
) in marine sediments
+ alteration of oceanic crust (AOC
)
carbon sources = mantle degassing (DM
) + metamorphic
degassing of carbonates (DC) + meta-
morphic degassing of POC (DPOC
) +
POC weathering (WPOC
) + carbonate
weathering (WC)
Sediment core data reveal a constant base line for the
carbon isotopic composition of biogenic carbonates and
seawater over the last one million years (Zachos et al., 2001) overprinted by glacial/interglacial fluctuations
(Sarmiento and Gruber, 2006). An isotopic mass balance
can thus be defined to further constrain the magnitude
of geological carbon fluxes:
δ δ13 13C of carbon sinks = C of carbon sources (3.12)
with
δ13C of carbon sinks = δ13CCA
× (BBC
+ AOC
) + δ13CPA
× (BPOC
+ BAC
+ BCH4
)
δ13C of carbon sources = δ13CM
× DM
+ δ13CCW
× (DC + W
C)
+ δ13CPW
× (DPOC
+ WPOC
)
The carbon isotopic compositions of the different carbon
sinks and sources are given as (Wallmann, 2001):
carbonate minerals accumulating at the seafloor
(δ13CCA
= 0 ‰), sedimentary POC accumulating at the
seafloor (δ13CPA
= −24 ‰), carbonate minerals subject to
weathering and metamorphosis (δ13CCW
= +2 ‰), fossil
POC subject to weathering and metamorphosis
(δ13CPW
= −26 ‰) and mantle CO2 (δ13C
M = −5 ‰).
The isotopic composition of carbonates and POC has
changed over time (Fig. 3.2). Thus, the δ13C values of the
input fluxes produced by the weathering and metamor-
phism of ancient rocks (δ13CCW
and δ13CPW
) differ from
the modern output fluxes generated by POC and CaCO3
accumulation at the seafloor (δ13CCA
and δ13CPA
).
Balanced carbon fluxes can be calculated applying
the three mass balance equations for CO2, carbon, and the
isotopic composition of the different carbon sources and
sinks considering also the range of fluxes estimated
above. Technically speaking, this can be achieved with
constrained minimization techniques. The results of this
exercise are listed in Table 3.4. They indicate that 7.3 Tmol
of CO2 yr−1 are released by mantle degassing and
metamorphism while 10.6 Tmol of CO2 yr−1 are consumed
by silicate weathering on land and in marine sediments.
An additional 4.3 Tmol of CO2 yr−1 are released by the
Knoll_c03.indd 26Knoll_c03.indd 26 2/16/2012 1:27:42 PM2/16/2012 1:27:42 PM

The Global Carbon Cycle: Geological Processes 27
turnover of biogenic carbonates (burial – weathering)
while 1.0 Tmol of CO2 yr−1 are fixed by POC cycling (bur-
ial – weathering). Silicate weathering is, thus consuming
volcanic and metamorphic CO2 and additional CO
2 pro-
duced by an imbalance in sedimentary carbon cycling.
Seawater bicarbonate is maintained at a steady level by
carbonate and silicate weathering adding 23.4 and
10.6 Tmol of HCO3− yr−1 to the oceans and by the burial of
biogenic carbonate and crustal alteration removing 32.0
and 2.0 Tmol of seawater HCO3− yr−1. Volcanism is add-
ing mantle carbon into the oceans and atmosphere which
is removed by the net growth of the sedimentary carbon-
ate and POC inventories (burial – weathering – metamor-
phism) and by the alteration of oceanic crust. The
residence time of carbon in the oceans and atmosphere is
calculated as 102 kyr considering the carbon inventory
(2.86 × 10⁶ Tmol of C, Table 3.1) and the balanced input
and output fluxes (28.0 Tmol of C yr−1, Table 3.4).
3.9 Evolution of the geological carbon cycle through Earth’s history: proxies and models
In what follows, we describe the evolution of the carbon
cycle over the past 3.8 Gyr based on available proxy
records and results from geochemical models. We begin
by discussing the proxy records.
0 1 2 3 4–60
–40
–20
0
20δ13
C(a)
(b)
(c)
–10
–5
0
5
10
δ13 C
org
Age (Myr)
Age (Gyr)
δ13 C
carb
0 100 200 300 400 500–35
–30
–25
–20
Carb : organismsCarb : whole rock calciteCarb : whole rock dolomite
Corg : whole rock and kerogen
Figure 3.2 δ13Ccarb
and δ13Corg
throughout Earth’s history.
(a) Complete record for the past 3.8 Gyr. (b) Phanerozoic δ13Ccarb
record. (c) Phanerozoic δ13Corg
record. Note: data from Strauss
and Moore (1992), Hayes et al. (1999) and Prokoph et al. (2008).
Table 3.4 Mean carbon fluxes over the last 1 million years (in
Tmol C yr−1)
Flux Range Balanced Flux
Carbon sources
Mantle degassing (DM
) 3.1–5.5 4.3
Metamorphic degassing of
carbonate rocks (DC)
2.0–4.0 2.5
Chemical weathering of
carbonate rocks (WC)
10–16 11.7
Metamorphic degassing
of POC (DPOC
)
0.4–0.6 0.5
Chemical weathering of POC
(WPOC
)
8–16 9.0
Total 28.0
Carbon sinks
Burial of biogenic carbonate
at the seafloor (BBC
)
14–17 16.0
Alteration of oceanic crust (AOC
) 1.5–2.4 2.0
Burial of POC, authigenic
carbonates, and methane in
marine sediments
(BPOC
+ BAC
+ BCH4
)
5.4–27 10.0
Total 28.0
CO2 sources
Mantle degassing (DM
) 3.1–5.5 4.3
Metamorphic degassing of
carbonate rocks (DC)
2.0–4.0 2.5
Metamorphic degassing
of POC (DPOC
)
0.4–0.6 0.5
Chemical weathering
of POC (WPOC
)
8–16 9.0
Burial of biogenic carbonate at
the seafloor (BBC
)
14–17 16.0
Total 32.3
CO2 sinks
Chemical weathering of silicate
rocks on land (WCSIL
)
6 – 10 7.1
Chemical weathering of silicates
in marine sediments (WOSIL
)
3.3–13.3 3.5
Chemical weathering of
carbonate rocks (WC)
10–16 11.7
Burial of POC, authigenic
carbonates, and methane in
marine sediments
(WPOC
+ WAC
+ WCH4
)
5.4–27 10.0
Total 32.3
Note: symbols for fluxes correspond to those appearing in
Fig. 3.1.
Knoll_c03.indd 27Knoll_c03.indd 27 2/16/2012 1:27:46 PM2/16/2012 1:27:46 PM

28 Fundamentals of Geobiology
3.9.1 Carbon isotope composition of marine carbonates (d13Ccarb) and organic matter (d13Corg)
The stable carbon isotope composition of marine sedi-
mentary carbonates (δ13Ccarb
) provides a record of how
the δ13C of oceanic dissolved inorganic carbon (DIC =
CO32− + HCO
3− + CO
2) has varied through time. Together
with the stable carbon isotope composition of marine
sedimentary organic carbon and kerogen (δ13Corg
), an
estimate of the isotopic fractionation accompanying the
production and burial of organic carbon (eTOC
≈ δ13Ccarb
−
δ13Corg
) can be obtained (Hayes et al., 1999). Of interest to
us here is the use of the eTOC
record to estimate the frac-
tion of carbon buried as organic matter in marine sedi-
ments (fo). This provides information on the pace and
mechanism of oxidation of the Earth’s surface (Hayes
and Waldbauer, 2006). In its simplest form, the relation
between eTOC
and fo is:
f εδ δ13 13carb in o TOCC = C + ×
(3.13)
where δ13Cin is the stable carbon isotopic composition of
the carbon input to the surficial system via volcanism,
metamorphisms, and continental weathering. This simple
relation is valid when the global carbon cycle is in steady
state and submarine hydrothermal weathering reactions
do not influence the δ13C of oceanic DIC (Bjerrum and
Canfield, 2004; Hayes and Waldbauer, 2006).
Figure 3.2 shows the most recent compilation of
δ13Ccarb
through Earth history (Prokoph et al., 2008) along
with a compilation of δ13Corg
data obtained by combining
a dataset for the last 800 Myr (Hayes et al., 1999) with the
Precambrian (540–3800 Myr) dataset of Strauss and
Moore (1992). The interested reader can consult the orig-
inal literature for more information on which type of
inorganic and organic phases are analyzed to generate
these records and for potential analytical pitfalls.
3.9.2 Strontium isotope composition of marine carbonates (87Sr/86Sr)
The 87Sr/86Sr ratio in seawater is homogeneous through-
out the ocean (Veizer and Compston, 1974). Thus, the 87Sr/86Sr ratio as captured in marine carbonates can be
used as an indicator of the 87Sr/86Sr ratio in ancient sea-
water. This reflects the relative intensity of the two Sr
sources to the ocean: silicate weathering, which releases
Sr with high 87Sr/86Sr ratios (modern values between
0.705 and 0.735; Gaillardet et al., 1999b), and seafloor
spreading, which releases basaltic Sr with low 87Sr/86Sr
ratios (modern average ∼0.703; Teagle et al., 1996). Over
long time scales, the evolution of 87Sr/86Sr composition of
the mantle should also be considered. Thus, mantle 87Sr/86Sr increased from ∼0.700 at 4.0 Gyr to 0.703 at pre-
sent due to 87Rb/86Sr decay (Shields, 2007). There might
also be a temperature-dependent Sr isotope fractionation
as Sr is incorporated into carbonate minerals (Fietzke
and Eisenhauer, 2006), but this is usually not considered.
Figure 3.3 presents a compilation of 87Sr/86Sr of marine
carbonates throughout Earth’s history (Prokoph et al., 2008). Analyses come from diagenetically unaltered or
poorly-altered low-Mg calcite shells of marine organisms
(brachiopods, belemnites, corals, inoceramids, planktic
foraminifera, oysters) and the apatite shells of conodonts
supplemented by whole rock samples to fill stratigraphic
gaps in the fossil data and for the Precambrian. While the
Phanerozoic record is considered robust, Precambrian 87Sr/86Sr values have likely been increased considerably
during sedimentary diagenesis (Veizer, 1989).
3.9.3 Proxies of atmospheric pCO2
Because of the fundamental role of atmospheric CO2 in
regulating climate (Mann et al., 1998; Berner, 2004; Royer
0 1 2 3 4
0.71
0.73
0.75
0.77
Fossil shells and micrite
87/8
6 Sr c
arb
(a)
Whole rock
0 100 200 300 400 500
0.707
0.708
0.709
0.710
Age (Myr)
0.718
0.712
0.710
0.708
0.706
0.704
50 %
0 %
100 %
87Sr/86Sr evolution of:Ocean (solid line)Mantle (dotted line)River runoff (dashed line)
River runoff verusMantle influence
Age (Gyr)
(b)
(c)
87/8
6 Sr
Figure 3.3 87Sr/86Sr evolution of the ocean as an indicator of
oceanic crust alteration versus continental weathering inputs of
Sr. (a) 87Sr/86Sr data throughout the past 3.8 Gyr (Prokoph et al., 2008). Inset: detail of the Phanerozoic 87Sr/86Sr record;
(b) secular evolution of 87Sr/86Sr of the mantle (dotted line),
riverine input (dashed line) and ocean (solid line); (c) relative
influence of river inputs and ocean crust alteration as Sr sources
to the ocean deduced from the curved entry or line in panel (b).
Notes: solid line in (b) considers lower envelope of Precambrian 87Sr/86Sr values in Prokoph et al. (2008); see Shields (2008) for
assumptions made to obtain the river runoff curve in panel b;
panels (b) and (c) are redrawn from Shields (2008).
Knoll_c03.indd 28Knoll_c03.indd 28 2/16/2012 1:27:48 PM2/16/2012 1:27:48 PM
The Global Carbon Cycle: Geological Processes 29
et al., 2007), a number of proxies relating the geochemi-
cal characteristics of sediments to past atmospheric CO2
concentrations have been developed:
1 The d13C of pedogenetic minerals (Cerling, 1991).
The δ13C of calcium carbonate or carbonate in goethite
formed in soils reflects the relative contribution of bio-
logically produced and atmospherically-derived CO2,
each with distinct δ13C signatures. With constraints on the
contribution from biologically derived CO2, the δ13C of
pedogenetic minerals can be used to estimate past atmos-
pheric CO2 concentrations. This technique has been
applied to soils from both the Phanerozoic (Ekart et al., 1999) and the Precambrian (Rye et al., 1995; Sheldon,
2006).
2 The d13C of phytoplankton (Freeman and Hayes,
1992). The concentration of dissolved CO2 is one of the
key parameters controlling the carbon isotope difference
between the carbon source (dissolved CO2) and photo-
synthetically-produced biomass. With careful consider-
ation, the Δ13C (= δ13Ccarb
− δ13Corg
) can be used to
reconstruct past atmospheric pCO2 levels, and this
method has been applied to both the Phanerozoic and to
certain periods in the Precambrian (Pagani, 1999a,
1999b; Kaufman and Xiao, 2003; Fletcher et al., 2005).
3 Stomatal distribution (Van der Burgh et al., 1993).
In C3 plants, the flux of CO2 into the leaves is regulated
by pores (stomata). Since the abundance of stomata on
the leaf epidermis is inversely proportional to pCO2,
the stomatal density of fossil leaves can be used to
reconstruct past atmospheric pCO2 levels. This method
provides past pCO2 estimates in the time interval 0–402
Mya (Rundgren and Beerling, 1999; McElwain and
Chaloner, 1995).
4 The d11B of planktonic foraminifera (Pearson and
Palmer, 2000). The δ11B of trace boron incorporated in
the shells of planktonic foraminifera is thought to reflect
that of dissolved B(OH)4
−, one of the two dissolved
boron species (the other is B(OH)3). Since the δ11B of
dissolved boron species is a function of seawater pH, the
δ11B of planktonic foraminifera can be used to estimate
the pH of surface waters. In conjunction with knowledge
of the dissolved inorganic carbon concentration, these
estimates are used to calculate atmospheric pCO2. This
method has been applied in the 0–60 Myr time interval.
5 Calcified cyanobacteria (Kah and Riding, 2007).
Cyanobacteria – microorganisms with a ≥2.7 Gyr evolu-
tionary history which perform oxygenic photo-
synthesis – can induce the precipitation of CaCO3 in the
cyanobacterial sheath (the matrix of organic molecules
which surrounds the cyanobacterial cell). This is thought
to occur at low pCO2 levels, concomitant to the activa-
tion of carbon concentrations mechanisms (CCMs),
which make HCO3
− available to cyanobacteria for pho-
tosynthesis in CO2-limited environments. Because
CCMs are induced when pCO2 is lower than 10× the
present atmospheric level of CO2 (PAL) in modern
cyanobacteria, the first appearance of calcified cyano-
bacteria in the sedimentary record (1.2 Gyr) is taken to
indicate that atmospheric pCO2 fell below 10 PAL at that
time. This method can be applied only to cyanobacteria
that were supposedly calcified in direct contact with
bottom ocean waters, rather than in a cyanobacterial
mat where chemical conditions differ greatly from those
of bottom waters (Aloisi, 2008).
6 Weathering rinds on river gravel (Hessler et al., 2004). Pebbles formed 3.2 Gyr ago by continental erosion
and river transport of felsic volcanic rocks have an outer
layer of altered material (weathering rind) rich in Fe(II)
carbonate. Thermodynamic considerations predict that
Fe(II) carbonate is the most likely mineral phase to form
in this ancient riverine environment if pCO2 levels are
above 2–3 PAL (at lower pCO2 Fe(II)-layer silicates
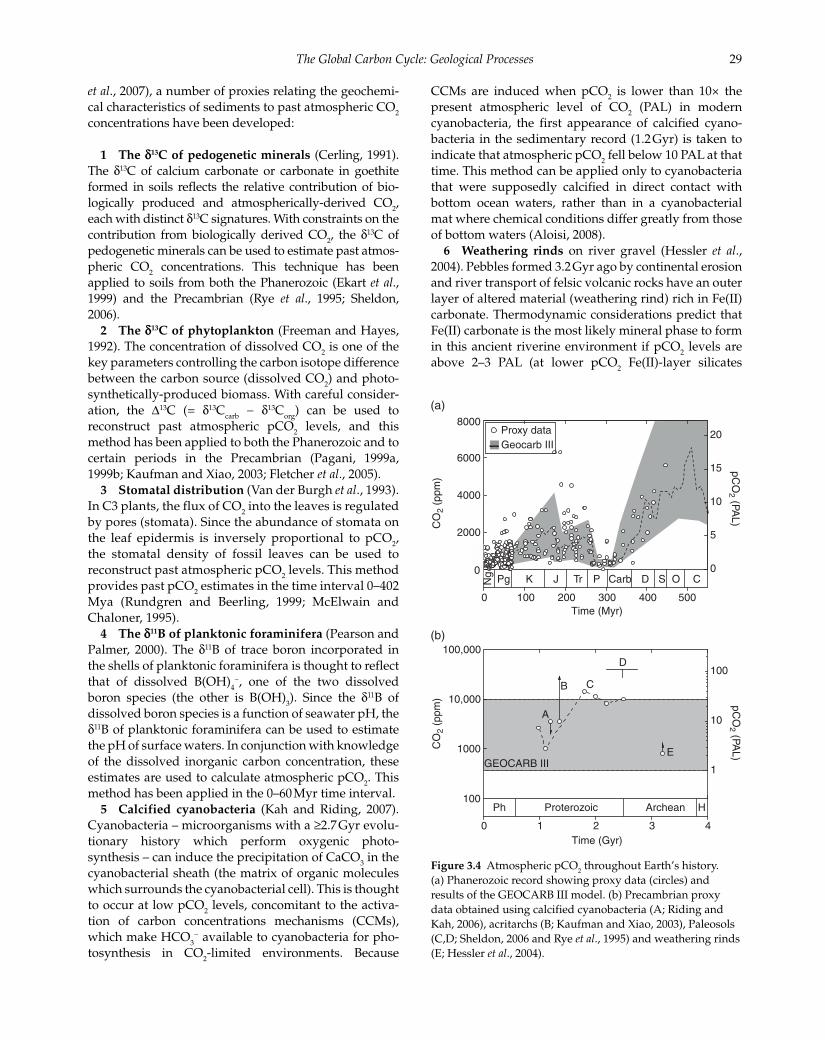
0 100 200 300 400 500
0
2000
4000
6000
8000
(a)
(b)
CO
2 (p
pm)
Time (Myr)
O CSDCarbPTrJKPgNg
pCO
2 (PAL)
0
5
10
15
20
pCO
2 (PAL)
CO
2 (p
pm)
0 1 2 3 4
100
1000
10,000
100,000
E
D
C
A
Time (Gyr)
B
GEOCARB III1
10
100
Ph Proterozoic Archean H
Geocarb IIIProxy data
Figure 3.4 Atmospheric pCO2 throughout Earth’s history.
(a) Phanerozoic record showing proxy data (circles) and
results of the GEOCARB III model. (b) Precambrian proxy
data obtained using calcified cyanobacteria (A; Riding and
Kah, 2006), acritarchs (B; Kaufman and Xiao, 2003), Paleosols
(C,D; Sheldon, 2006 and Rye et al., 1995) and weathering rinds
(E; Hessler et al., 2004).
Knoll_c03.indd 29Knoll_c03.indd 29 2/16/2012 1:27:57 PM2/16/2012 1:27:57 PM
30 Fundamentals of Geobiology
would form). Thus, atmospheric pCO2 at 3.2 Gyr must
have been ≥2–3 PAL.
Figure 3.4 summarizes the atmospheric pCO2 proxy
data and compares it with Phanerozoic atmospheric
pCO2 estimates obtained with the GEOCARB III model
of the global carbon cycle (Berner and Kothavala, 2001).
3.10 The geological C cycle through time
3.10.1 Archean (3.8–2.5 Gyr)
Mantle outgassing and hydrothermal circulation were
likely higher in the Archean than today due to a higher
thermal flux from the Earth’s interior (Sleep and Zahnle,
2001; Lowell and Keller, 2003). The rates of these pro-
cesses are proportional to the rate of hydrothermal heat
flow which can be reconstructed from the thermal char-
acteristics of the oceanic lithosphere and the mantle and
the growth history of the continental crust (Lowell and
Keller, 2003). Continental growth history, however, is
only poorly constrained (Kemp and Hawkesworth,
2005), leading to a great uncertainty of past degassing
and hydrothermal circulation rates. One view – the ‘big
bang’ model of continental growth – proposes that
continental masses reached their present area very early
in Earth’s history (<4 Gyr; Armstrong, 1991). Another
theory is that the continental growth took place mainly
during super-events of crust formation at 2.7, 1.9 and
1.2 Ga (Condie, 1998). Based on an episodic continental
growth history where continents grew from 10% to 80%
of current area between 3.2 Gyr and 2.5 Gyr (Lowell and
Keller, 2003), Hayes and Waldbauer (2006) calculate that
the CO2 degassing flux from the mantle at 3.8 Gs was
about nine times higher than today.
With reduced continental surface area and enhanced
thermal fluxes, alteration of oceanic crust and basalt car-
bonation would have probably been the largest CO2 sink
in the Archean (Walker, 1990), accounting for up to 90%
of the inorganic carbon removal (Sleep and Zahnle,
2001; Godderis and Veizer, 2000). This removal is evi-
denced by the widespread presence of hydrothermal
carbonates in greenstone belts (Veizer et al., 1989;
Nakamura and Kato, 2002).
Archean 87Sr/86Sr values (Fig. 3.3a) are quite variable
ranging from low values of ∼0.701 to much higher val-
ues of ∼0.764. This variability is thought to have resulted
from the addition of heavier Sr during sediment diagen-
esis. Therefore, one typically views the lowest measured
values as representative of the 87Sr/86Sr of contempora-
neous seawater (Prokoph et al., 2008). Following this, the
ocean had very low 87Sr/86Sr values in the Archean. This
is partly due to the fact that the 87Sr/86Sr of the mantle,
which is the ultimate source of Sr to the ocean, has
increased though time due to radiogenic decay of 87Rb
(Shields, 2007) (Fig. 3.3b). The 87Sr/86Sr record, however,
departs from the mantle 87Sr/86Sr curve around 2.7–
2.5 Gyr (Fig. 3.3b) suggesting that at this time the domi-
nant source of Sr to the ocean changed from ocean ridge
hydrothermal sources to continental weathering
(Shields, 2007; Fig. 3.3c). A general picture emerges
which broadly divides Earth’s history into pre-
Neoarchean times, when the exogenic system was
affected principally by inputs from the mantle and post-
Neoarchean where mantle fluxes decreased relative to
those from continental weathering (Veizer and
Compston, 1976; Rey and Coltice, 2008).
The most striking feature of the δ13Ccarb
and δ13Corg
records is, despite some important deviations, the rela-
tive constancy of values throughout Earth’s history (Fig.
3.2). The δ13C of carbon released into oceans and atmos-
phere via mantle degassing, metamorphism and weath-
ering (δ13Cin
) is usually assumed to have been constant
through time and equal to ∼−5‰ (Kump and Arthur,
1999; Bjerrum and Canfield, 2004; Hayes and Waldbauer,
2006). Supporting this is the composition of mantle-
derived diamonds and carbonatites which have δ13C ∼
−5‰ independent of age of emplacement or location
(Kyser, 1986; Mattey, 1987; Pearson et al., 2004). When
these average δ13C values are applied to the simplified
isotopic mass balance defined in equation 13, it can be
concluded that ∼20% of carbon was buried in organic
form for the past 3.5 Gyr (see, however, Bjerrum and
(Canfield, 2004) for a somewhat different view). Hayes
and Waldbauer (2006) reconstructed the fraction of car-
bon buried in the organic form ( f0) and the net accumu-
lation of reduced carbon in the crust in the past 3.8 Gyr
using the δ13C proxies introduced above in conjunction
with an isotopic mass balance (similar to Equation 3.13,
above) and assumptions on the history of mantle degas-
sing and crust-mantle carbon exchanges (Fig. 3.5). These
results seem to indicate that the Archean sedimentary
record carries the geochemical imprint of biological car-
bon cycling operating in an astonishingly stable mode.
The Archean isotope records ends with a prominent
negative δ13Corg
excursion (δ13Corg
down to −60‰) between
2.8 and 2.6 Gyr (Fig. 3.2). Three possible scenarios have
been proposed to explain this event:
1 High 13C depletions caused by high rates of methane
oxidation by aerobic methanotrophic bacteria and the
incorporation of strongly 13C depleted bacterial biomass
into the organic carbon pool. The strongly 13C-depleted
biomass is produced as methanotrophs oxidize highly 13C depleted methane (Hayes, 1994).
2 Sulfate, instead of oxygen, was used to oxidize
methane anaerobically by a microbial consortium of
sulfate-reducing bacteria and methanotrophic Archaea
(Hinrichs, 2002).
3 The 13C-depleted organic matter originated as organic
particles formed from a 13C-depleted organic haze in the
Knoll_c03.indd 30Knoll_c03.indd 30 2/16/2012 1:27:57 PM2/16/2012 1:27:57 PM
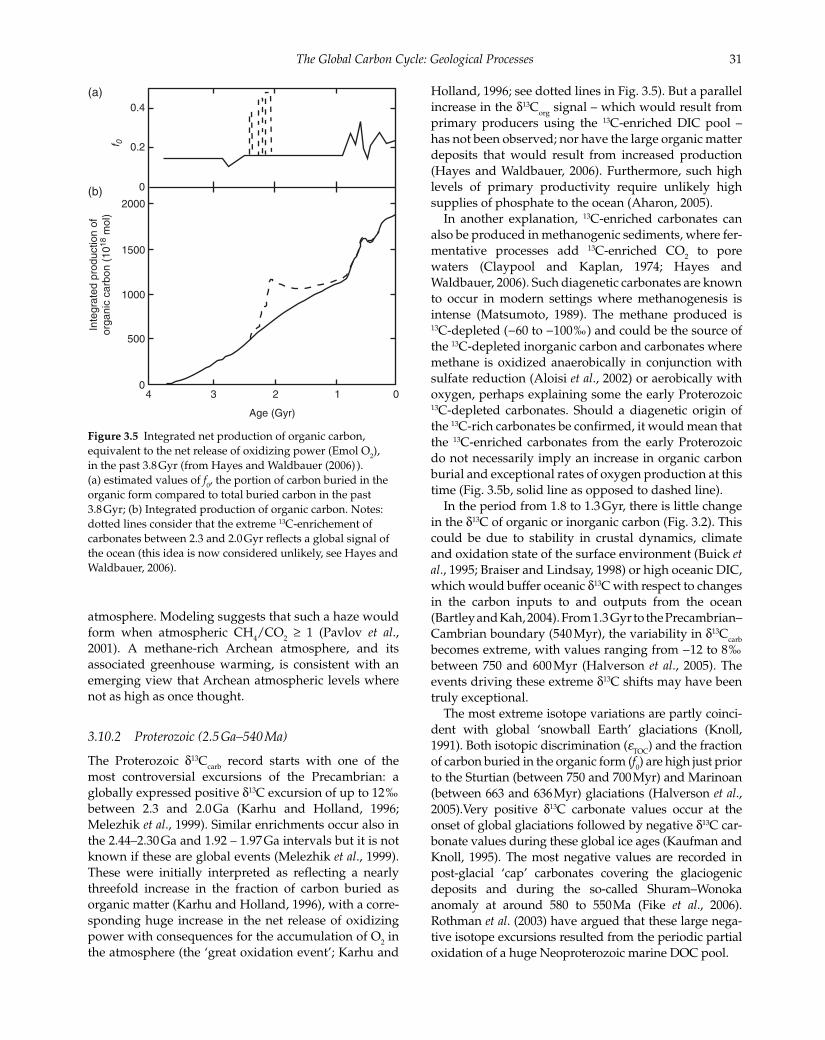
The Global Carbon Cycle: Geological Processes 31
atmosphere. Modeling suggests that such a haze would
form when atmospheric CH4/CO
2 ≥ 1 (Pavlov et al.,
2001). A methane-rich Archean atmosphere, and its
associated greenhouse warming, is consistent with an
emerging view that Archean atmospheric levels where
not as high as once thought.
3.10.2 Proterozoic (2.5 Ga–540 Ma)
The Proterozoic δ13Ccarb
record starts with one of the
most controversial excursions of the Precambrian: a
globally expressed positive δ13C excursion of up to 12‰
between 2.3 and 2.0 Ga (Karhu and Holland, 1996;
Melezhik et al., 1999). Similar enrichments occur also in
the 2.44–2.30 Ga and 1.92 – 1.97 Ga intervals but it is not
known if these are global events (Melezhik et al., 1999).
These were initially interpreted as reflecting a nearly
threefold increase in the fraction of carbon buried as
organic matter (Karhu and Holland, 1996), with a corre-
sponding huge increase in the net release of oxidizing
power with consequences for the accumulation of O2 in
the atmosphere (the ‘great oxidation event’; Karhu and
Holland, 1996; see dotted lines in Fig. 3.5). But a parallel
increase in the δ13Corg
signal – which would result from
primary producers using the 13C-enriched DIC pool –
has not been observed; nor have the large organic matter
deposits that would result from increased production
(Hayes and Waldbauer, 2006). Furthermore, such high
levels of primary productivity require unlikely high
supplies of phosphate to the ocean (Aharon, 2005).
In another explanation, 13C-enriched carbonates can
also be produced in methanogenic sediments, where fer-
mentative processes add 13C-enriched CO2 to pore
waters (Claypool and Kaplan, 1974; Hayes and
Waldbauer, 2006). Such diagenetic carbonates are known
to occur in modern settings where methanogenesis is
intense (Matsumoto, 1989). The methane produced is 13C-depleted (−60 to −100‰) and could be the source of
the 13C-depleted inorganic carbon and carbonates where
methane is oxidized anaerobically in conjunction with
sulfate reduction (Aloisi et al., 2002) or aerobically with
oxygen, perhaps explaining some the early Proterozoic 13C-depleted carbonates. Should a diagenetic origin of
the 13C-rich carbonates be confirmed, it would mean that
the 13C-enriched carbonates from the early Proterozoic
do not necessarily imply an increase in organic carbon
burial and exceptional rates of oxygen production at this
time (Fig. 3.5b, solid line as opposed to dashed line).
In the period from 1.8 to 1.3 Gyr, there is little change
in the δ13C of organic or inorganic carbon (Fig. 3.2). This
could be due to stability in crustal dynamics, climate
and oxidation state of the surface environment (Buick et al., 1995; Braiser and Lindsay, 1998) or high oceanic DIC,
which would buffer oceanic δ13C with respect to changes
in the carbon inputs to and outputs from the ocean
(Bartley and Kah, 2004). From 1.3 Gyr to the Precambrian–
Cambrian boundary (540 Myr), the variability in δ13Ccarb
becomes extreme, with values ranging from −12 to 8‰
between 750 and 600 Myr (Halverson et al., 2005). The
events driving these extreme δ13C shifts may have been
truly exceptional.
The most extreme isotope variations are partly coinci-
dent with global ‘snowball Earth’ glaciations (Knoll,
1991). Both isotopic discrimination (eTOC
) and the fraction
of carbon buried in the organic form (f0) are high just prior
to the Sturtian (between 750 and 700 Myr) and Marinoan
(between 663 and 636 Myr) glaciations (Halverson et al., 2005).Very positive δ13C carbonate values occur at the
onset of global glaciations followed by negative δ13C car-
bonate values during these global ice ages (Kaufman and
Knoll, 1995). The most negative values are recorded in
post-glacial ‘cap’ carbonates covering the glaciogenic
deposits and during the so-called Shuram–Wonoka
anomaly at around 580 to 550 Ma (Fike et al., 2006).
Rothman et al. (2003) have argued that these large nega-
tive isotope excursions resulted from the periodic partial
oxidation of a huge Neoproterozoic marine DOC pool.
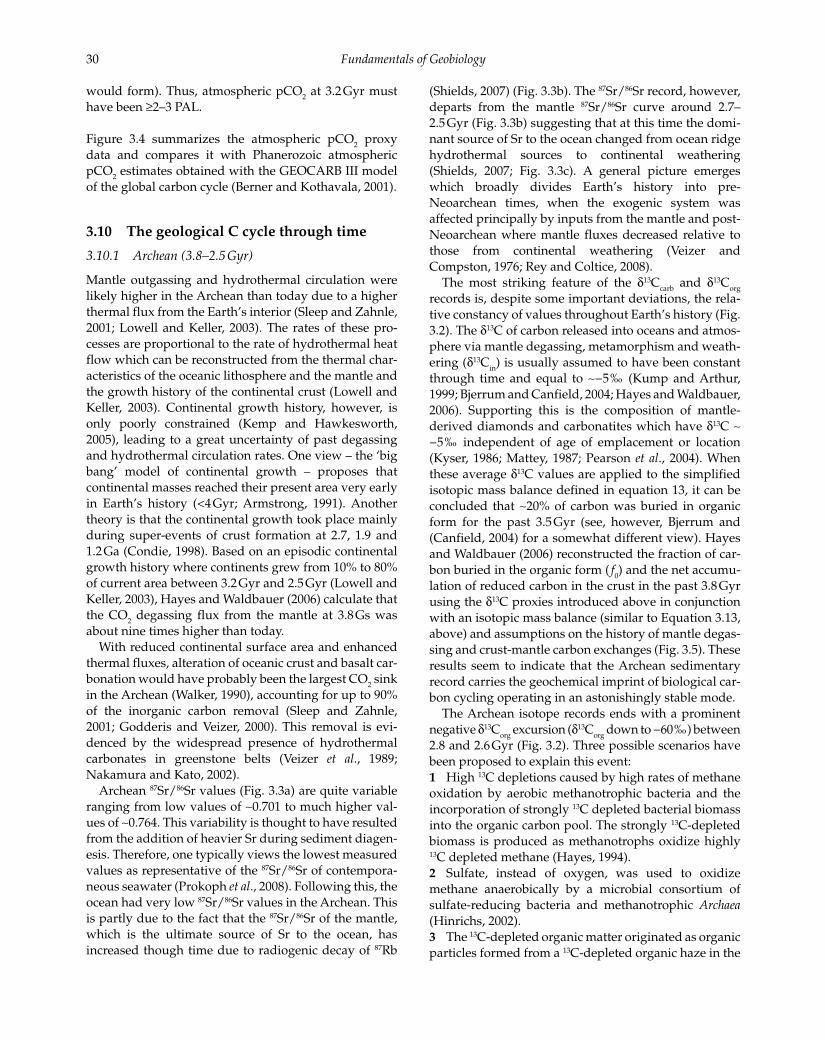
4 123 0
1000
2000
0
500
1500
0.2
0.4
0
Age (Gyr)
Inte
grat
ed p
rodu
ctio
n of
orga
nic
carb
on (
1018
mol
)f 0
(a)
(b)
Figure 3.5 Integrated net production of organic carbon,
equivalent to the net release of oxidizing power (Emol O2),
in the past 3.8 Gyr (from Hayes and Waldbauer (2006) ).
(a) estimated values of f0, the portion of carbon buried in the
organic form compared to total buried carbon in the past
3.8 Gyr; (b) Integrated production of organic carbon. Notes:
dotted lines consider that the extreme 13C-enrichement of
carbonates between 2.3 and 2.0 Gyr reflects a global signal of
the ocean (this idea is now considered unlikely, see Hayes and
Waldbauer, 2006).
Knoll_c03.indd 31Knoll_c03.indd 31 2/16/2012 1:27:57 PM2/16/2012 1:27:57 PM
32 Fundamentals of Geobiology
3.10.3 Phanerozoic
During most of the Cambrian to Devonian, pCO2 values
were higher than today (Berner, 1997, 2004, 2006; Farkaš
et al., 2007; Wallmann, 2004), likely in the range of 1000–
8000 μatm (Royer, 2006; Royer et al., 2007) (Fig. 3.4). These
high levels were probably caused by reduced rates of sili-
cate weathering on land. In part, high CO2 was a conse-
quence of lower solar luminosity. Quite simply, with a
less luminous Sun, higher CO2 concentrations are neces-
sary to raise the Earth surface temperature to the point for
sufficient CO2 removal by weathering. Also, this time was
before the advent of land plants and their enhancement of
silicate weathering through rooting activity leading to
soil formation, enhanced rates organic matter decay, and
elevated soil pCO2 concentrations as discussed above.
A major dip in pCO2 occurred during the Carboniferous
and Permian. The rise and spread of land plants over
this period is the ultimate reason for this prominent
reduction in pCO2 (Berner, 1997). As just mentioned,
vascular plants greatly promoted soil formation and the
consumption of CO2 via silicate weathering. Extensive
burial of organic carbon in wetlands and swamps also
added to the dramatic draw-down in pCO2. Enhanced
organic carbon burial is clearly documented by the very
positive marine δ13C values (Fig. 3.2) indicating the pro-
nounced sequestration of 12C in organic matter.
Atmospheric pCO2 values recovered and reached a
maximum during the Jurassic and Cretaceous. These
elevated pCO2 values, ranging between 500 and
4000 μatm, were probably related to enhanced rates of
mantle degassing and volcanism. The 87Sr/86Sr of marine
waters reached a prominent minimum during this
period. This indicates high rates of hydrothermal activ-
ity at mid-ocean ridges (Fig. 3.3), which correlates with
the high rates of seafloor spreading and mantle degas-
sing of CO2 (Farkaš et al., 2007; Wallmann, 2004).
Over the last ∼40 million years, pCO2 values declined
towards the very low Pleistocene to Holocene value of
∼230 μatm. This decline was probably caused by enhanced
rates of silicate weathering. The collision of India with
Asia formed the Himalayas and the Tibetan Plateau
increased the rate of physical erosion and CO2 removal
by silicate weathering (Gaillardet et al., 1999b; Raymo,
1994). The marine 87Sr/86Sr record supports this scenario.
It shows a very rapid increase in 87Sr/86Sr over the late
Cenozoic indicating that Sr with very high continental-
like ratios was released into the oceans (Wallmann, 2001).
During the Anthropocene, pCO2 values may increase
towards a value of ∼1000 μatm due mainly to the burn-
ing of fossil fuel. Prior to the onset of industrialization,
∼10.5 Tmol of CO2 yr−1 were released by POC weather-
ing and metamorphism (Table 3.4). Burning of fossil fuel
increased the release of CO2 from fossil organic carbon
by almost two orders of magnitude to >600 Tmol of CO2
yr−1 (IPCC, 2007). CO2 from fossil organic sources is
strongly depleted in the heavy 13C isotope. Thus, the iso-
topic composition of the atmosphere and the surface
ocean has shifted towards more negative δ13C values
due to anthropogenic CO2 emissions. Models predict
that anthropogenic CO2 will be removed from the atmos-
phere and taken up by the oceans within the next ∼
100 kyr (Ridgwell and Hargreaves, 2007). The future
geological record will thus document the Anthropocene
as a sharp negative excursion in the δ13C of carbonates
and organic biomarkers.
3.11 Limitations and perspectives
The geological carbon cycle considers the long-term dis-
tribution of carbon on our planet. Thus, most short-term
biological fluxes are not considered in the geological
carbon cycle as they have rather little effect on the long-
term evolution of the major carbon inventories. These
are explored in Chapter 2.
A number of important physical processes are typically
neglected by most researchers working on global carbon
cycling. Thus, the dissolution of atmospheric CO2 in the
oceans, the transport of dissolved carbon compounds by
ocean currents, and the out-gassing of oceanic CO2 into
the atmosphere are usually not resolved in long-term car-
bon cycle models. It is usually assumed that the carbon
distribution between the oceans and atmosphere attains
equilibrium within less than one million years. While this
assumption is basically correct, it may not be strictly
valid for ancient oceans with higher inventories of DIC or
supporting much lower rates of biological activity.
Motivated by these problems and further important
limitations arising in the traditional geological approach,
a new generation of geobiologists are coordinating with
scientists from other fields such as physical and biologi-
cal oceanography and climatology to develop new Earth
system models resolving the complex interactions
between biological, physical, chemical, and geological
processes. These ultimately control the pCO2 of ancient
and future atmospheres, seawater pH and the distribu-
tion of carbon on our planet.
References
Aharon P (2005) Redox stratification and anoxia of the early
Precambrian oceans: implications for carbon isotope excur-
sions and oxidation events. Precambrian Research 137, 207–222.
Allard P (1992) Global emissions of helium-3 by subaereal vol-
canism. Geophysical Research Letters 19(4), 1479–1481.
Aloisi G (2008) The calcium carbonate saturation state in
cyanobacterial mats throughout Earth’s history. Geochimica et Cosmochimica Acta 72(24), 6037–6060.
Aloisi G, Bouloubassi I, Heijs SK, et al. (2002) CH4-consuming
microorganisms and the formation of carbonate crusts at
cold seeps. Earth and Planetary Science Letters 203(1), 195–203.
Knoll_c03.indd 32Knoll_c03.indd 32 2/16/2012 1:27:57 PM2/16/2012 1:27:57 PM
The Global Carbon Cycle: Geological Processes 33
Archer D (1996) A data-driven model of the global calcite lyso-
cline. Global Biogeochemical Cycles 10(3), 511–526.
Armstrong RL (1991) The persistent myth of crustal growth.
Australian Journal of Earth Sciences 38(5), 613–630.
Bartley JK, Kah LC (2004) Marine carbon reservoir, Corg
–Ccarb
coupling, and the evolution of the Proterozoic carbon cycle.
Geology 32(2), 129–132.
Becker JA, Bickle MJ, Galy A, Holland TJB (2008) Himalayan
metamorphic CO2 fluxes: quantitative constrains from
hydrothermal springs. Earth and Planetarian Science Letters
265, 616–629.
Berelson WE, Balch WM, Najjar R, Feely RA, Sabine C, Lee K
(2007) Relating estimates of CaCO3 production, export, and
dissolution in the water column to measurements of CaCO3
rain into sediment traps and dissolution on the sea floor: a
revised global carbonate budget. Global Biogeochemical Cycles
21(GB1024).
Berner RA (1994) GEOCARB II: a revised model of atmospheric
CO2 over Phanerozoic time. American Journal of Science 294,
56–91.
Berner RA (1997) The rise of plants and their effect on weather-
ing and atmospheric CO2. Science 276, 544–546.
Berner RA (2004) The Phanerozoic Carbon Cycle: CO2 and O2.
Oxford University Press, Oxford.
Berner RA (2006) GEOCARBSULF: a combined model for
Phanerozoic atmospheric O2 and CO
2. Geochimica et
Cosmochimica Acta 70, 5653–5664.
Berner EK, Berner RA (1996) Global Environment: Water, Air and Geochemical Cycles. Prentice Hall, Englewood Cliffs, NJ.
Berner RA, Canfield DE (1989) A new model for atmospheric
oxygen over Phanerozoic time. American Journal of Science
289, 333–361.
Berner RA, Kothavala Z (2001) GEOCARB III: a revised model
of atmospheric CO2 over Phanerozoic time. American Journal
of Science 301, 182–204.
Bjerrum CJ, Canfield DE (2004) New insights into the burial
history of organic carbon on the early Earth. Geochemistry, Geophysics, Geosystems 5(8), doi:10.1029/2004GC000713.
Bolton EW, Berner RA, Petsch ST (2006) The weathering of
sedimentary organic matter as a control on atmospheric O2:
II. Theoretical modeling. American Journal of Science 306, 575–
615.
Bowring SA, Housh T (1995) The Earth’s early evolution.
Science, 269, 1535–1540.
Braiser MD, Lindsay JF (1998) A billion years of environmental
stability and the emergence of eukaryotes: new data from
northern Australia. Geology 23, 555–558.
Buick R, Des Marais DJ, Knoll AH (1995) Stable isotopic com-
positions of carbonates from the Mesoproterozoic Bangemall
Group, northwestern Australia. Chemical Geology 123,
153–171.
Burdige DJ (2005) Burial of terrestrial organic matter in marine
sediments: a re-assessment. Global Biogeochemical Cycles
19(GB4011), doi:10.1029/2004GB002368.
Burdige DA (2007) Preservation of organic matter in marine
sediments: controls, mechanisms, and an imbalance in sedi-
ment organic carbon budgets? Chemistry Reviews 107, 467–485.
Claypool GE, Kaplan IR (1974) The origin and distribution of
methane in marine sediments. In: Natural Gases in Marine Sediments (ed Kaplan IR). Plenum, New York, pp. 99–139.
Condie KC (1998) Episodic continental growth and super-con-
tinents: a mantle avalanche connection? Earth and Planetary Science Letters 163, 97–108.
Dickens GR (2003) Rethinking the global carbon cycle with a
large dynamic and microbially mediated gas hydrate capaci-
tor. Earth and Planetary Science Letters 213, 169–183.
Dunne JP, Sarmiento JL, Gnanadesikan A (2007) A synthesis of
global particle export from the surface ocean and cycling
through the ocean interior and on the seafloor. Global Biogeochemical Cycles 21(GB4006), doi:10.1029/2006GB002907.
Ekart DD, Cerling TE, Montanez IP, Tabor NJ (1999) A 400 mil-
lion year carbon isotope record of pedogenetic carbonate;
implications for paleoatmospheric carbon dioxide. American Journal of Science 299, 805–827.
Farkaš J, Böhm F, Wallmann K, et al. (2007) Calcium isotope
budget of Phanerozoic oceans: implications for chemical
evolution of seawater and its causative mechanism.
Geochimica et Cosmochimica Acta 71, 5117–5134.
Farley KA, Maier-Reimer E, Schlosser P, Broecker WS (1995)
Constraints on mantle 3He fluxes and deep-sea circulation
from an oceanic general circulation model. Journal of Geophysical Research 100(B3), 3829–3939.
Fietzke J, Eisenhauer A (2006) Determination of the tempera-
ture-dependent stable strontium isotope (Sr-88/Sr-86) frac-
tionation via braketing standard MC-ICP-MS. Geochemistry, Geophysics, Geosystems, 7, Q08009, doi:10.1029/2006GC001243.
Fike DA, Grotzinger JP, Pratt LM, et al. (2006) Oxidation of the
Ediacaran Ocean. Nature, 444, 744–747.
Fletcher BJ, Beerling DJ, Brentnall SJ (2005) Fossil bryophytes
as recorders of ancient CO2 levels: experimental evidence
and a Cretaceous case study. Global Biogeochemical Cycles 19,
GB3012, doi:10.1029/2005GB002495.
Freeman KH, Hayes JM (1992) Fractionation of carbon isotopes
by phytoplankton and estimates of ancient CO2 levels. Global
Biogeochemical Cycles 6, 185–198.
Gaillardet J, Dupré B, Allègre CJ (1999a) Geochemistry of large
river suspended sediments: Silicate weathering or recycling
tracer. Geochimica et Cosmochimica Acta 63(23/24), 4037–4051.
Gaillardet J, Dupré B, Louvat P, Allègre CJ (1999b) Global sili-
cate weathering and CO2 consumption rates deduced from
the chemistry of large rivers. Chemical Geology 159, 3–30.
Godderis Y, Veizer J (2000) Tectonic control of chemical and iso-
topic composition of ancient oceans: the impact of continen-
tal growth. American Journal of Science 300, 434–461.
Gorman PJ, Kerrick DM, Connolly JAD (2006) Modeling open
system metamorphisc decarbonation of subducting slaps.
Geochemistry, Geophysics, Geosystems 7(4), Q4007,
doi:10.1029/2005GC001125.
Halverson GP, Hoffman PF, Schrag DP, Maloof AC, Rice AHN
(2005) Toward a Neoproterozoic composite carbon-isotope
record. GSA Bulletin 117(9/10), 1181–1207.
Hayes JM (1994) Global mathanotrophy at the Archean–
Proterozoic transition. In: Early Life on Earth (ed Bengston S).
Nobel Symposium 84, Columbia University Press, New
York, pp. 220–236.
Hayes JM, Waldbauer JR (2006) The carbon cycle and associ-
ated redox processes through time. Philosophical Transactions of the Royal Society B 361, 931–950.
Hayes JM, Strauss H, Kaufman AJ (1999) The abundance of 13C
in marine organic matter and isotopic fractionation in the
Knoll_c03.indd 33Knoll_c03.indd 33 2/16/2012 1:27:57 PM2/16/2012 1:27:57 PM

34 Fundamentals of Geobiology
global biogeochemical cycle of carbon during the past 800
Ma. Chemical Geology 161, 103–125.
Hedges JI, Keil RG (1995) Sedimentary organic matter preser-
vation: an assessment and speculative synthesis. Marine Chemistry 49, 81–115.
Hessler AM, Lowe DR, Jones RL, Bird DK (2004) A lower limit
for atmospheric carbon dioxide levels 3.2 billion years ago.
Nature 428, 736–738.
Hinrichs KU (2002) Microbial fixation of methane carbon at 2.7
Ga: was an anaerobic mechanism possible? Geochemistry, Geophysics, Geosystems 3, doi: 10.1029/2001GC000286.
IPCC (2007) Climate change 2007: the physical science basis. In:
Contribution of Working Group I to the Fourth Assessment Report of the Intergovernmental Panel on Climate Change. IPCC,
Geneva, 996pp.
Kah LC, Riding R (2007) Mesoproterozoic carbon dioxide lev-
els inferred from calcified cyanobacteria. Geology 35(9), 799–
802.
Karhu JA, Holland HD (1996) Carbon isotopes and the rise of
atmospheric oxygen. Geology 24(10), 867–870.
Kaufman AJ, Knoll AH (1995) Neoproterozoic variations in the
C-isotopic composition of seawater: stratigraphic and bio-
geochemical implications. Precambrian Research 73, 27–49.
Kaufman AJ, Xiao S (2003) High CO2 levels in the Proterozoic
atmosphere estimated from analyses of individual microfos-
sils. Nature 20, 121–148.
Kemp AIS, Hawkesworth CJ (2005) Granitic perspectives on
the generation and secular evolution of the continental crust.
In: The Crust, Vol. 3 (ed Rudnick RL), Treatise on Geochemistry
(eds Holland HD, Turekian KK). Elsevier-Pergamon, Oxford,
pp. 349–410.
Kleypas JA (1997) Modeled estimates of global reef habitat and
carbonate production since the last glacial maximum.
Paleoceanography 12(4), 533–545.
Knoll AH (1991) End of the Proterozoic Eon. Scientific American
265, 64–73.
Kump LR, Arthur MA (1999) Interpreting carbon-isotope
excursions: carbonates and organic matter. Chemical Geology
161(1–3), 181–198.
Kyser TK (1986) Stable isotope variations in the mantle. Stable
isotope variations in high temperature geological processes.
Reviews of Mineralogy 16, 141–164.
Lasaga A, Ohmoto H (2002) The oxygen geochemical cycle:
dynamics and stability. Geochimica et Cosmochimica Acta
66(3), 361–381.
Lerman A, Wu L, Mackenzie FT (2007) CO2 and H
2SO
4 con-
sumption in weathering and material transport to the ocean,
and their role in the global carbon cycle. Marine Chemistry
106, 326–350.
Lowell RP, Keller SM (2003) High-temperature seafloor hydro-
thermal circulation over geologic time and Archean banded
iron formations. Geophysical Research Letters 30(7), doi:
10.1029/2002GL016536.
Ludwig W, Amiotte-Suchet P, Probst J-L (1999) Enhanced
chemical weathering of rocks during the last glacial maxi-
mum: a sink for atmospheric CO2? Chemical Geology 159,
147–161.
Maher K, DePaolo DJ, Lin JC-F (2004) Rates of silicate dissolu-
tion in deep-sea sediment: in situ measurement using
234U/238U of pore fluids. Geochimica et Cosmochimica Acta
68(22), 4629–4648.
Mann EM, Bradley RS, Hughes K (1998) Global-scale tempera-
ture patters and climate forcing over the past six centuries.
Nature 392, 779–787.
Marty B, Tolstikhin IN (1998) CO2 fluxes from mid-ocean
ridges, arcs and plumes. Chemical Geology 145, 233–248.
Matsumoto R (1989) Isotopically heavy oxygen-containing
siderite derived from the decomposition of methane hydrate.
Geology 17, 707–710.
Mattey DP (1987) Carbon isotopes in the mantle. Terra Cognita
7, 31–37.
McElwain JC, Chaloner WG (1995) Stomatal density and index
of fossil plants track atmospheric carbon dioxide in the
Palaeozoic. Annals of Botany 76, 389–395.
Melezhik VA, Fallick AE, Medvedev PV, Makarikhin VV (1999)
Extreme 13Ccarb
enrichment in ca. 2.0 Ga magnesite-stromato-
lite-dolomite-‘red beds’ association on a global context: a
case for the world-wide signal enhanced by local environ-
ment. Earth Science Reviews 48, 71–120.
Middelburg JJ (1989) A simple model for organic matter
decomposition in marine sediments. Geochimica et Cosmochimica Acta 53, 1577–1581.
Middelburg JJ, Vlug T, van der Nat FJWA (1993) Organic mat-
ter mineralization in marine systems. Global and Planetary Change 8, 47–58.
Munhoven G (2002) Glacial-interglacial changes of continental
weathering: estimates of the related CO2 and HCO
3− flux
variations and their uncertainties. Global and Planetary Change 33, 155–176.
Nakamura K, Kato Y (2002) Carbonate minerals in the
Warrawoona Group, Pilbara Craton: Implications for conti-
nental crust, life, and global carbon cycle in the Early
Archean. Resource Geology 52(2), 91–100.
Pagani M, Arthur MA, Freeman KH (1999a) Miocene evolution
of atmospheric carbon dioxide. Paleoceanography 14, 273–292.
Pagani M, Freeman KH, Arthur MA (1999b) Late Miocene
atmospheric CO2 concentrations and the expansion of C4
grasses. Science 285, 876–879.
Pavlov AA, Kasting JF, Eigenbrode JL, Freeman KH (2001)
Organic haze in Earth’s early atmosphere: source of low-C-
13 Late Archean kerogens? Geology 29(11), 1003–1006.
Pearson PN, Palmer MR (2000) Atmospheric carbon dioxide
concentrations over the past 60 million years. Nature 406,
695–699.
Pearson DG, Canil D, Shirey SB (2004) Mantle samples included
in volcanic rocks: xenoliths and diamonds. In: Treatise on Geochemistry, Vol. 2 (eds H.D. Holland HD, Turekian KK).
Elsevier, Oxford, pp. 172–221.
Petit JR, Jouzel J, Raynaud D, et al. (1999) Climate and atmos-
pheric history of the past 420,000 years from the Vostok ice
core, Antarctica. Nature 399(6735), 429–436.
Petsch ST, Eglinton TI, Edwards KJ (2001) 14C-dead living bio-
mass: evidence for microbial assimilation of ancient organic
carbon during shale weathering. Science 292, 1127–1131.
Prokoph A, Shields GA, Veizer J (2008) Compilation and time-
series analysis of a marine carbonate &sbull;18O, &sbull;13C, 87Sr/86Sr and &sbull;34S database through Earth history.
Earth-Science Reviews 87, 113–133.
Knoll_c03.indd 34Knoll_c03.indd 34 2/16/2012 1:27:57 PM2/16/2012 1:27:57 PM
The Global Carbon Cycle: Geological Processes 35
Raymo ME (1994) The Himalayas, organic carbon burial, and
climate in the Miocene. Paleoceanography 9(3), 399–404.
Resing JA, Lupton JE, Feely RA, Lilley MD (2004) CO2 and 3He
in hydrothermal plumes: implications for mid-ocean ridge
CO2 flux. Earth and Planetary Science Letters 226, 449–464.
Rey PF, Coltice N (2008) Neoarchean lithospheric strengthen-
ing and the coupling of the Earth’s geochemical reservoirs.
Earth and Planetary Science Letters 36(8), 635–638
Ridgwell A, Hargreaves JC (2007) Regulation of atmospheric
CO2 by deep-sea sediments in an Earth system model. Global
Biogeochemical Cycles 21(2), GB2008.
Riebesell U, Schulz KG, Bellerby RGJ, et al. (2007) Enhanced
biological carbon consumption in a high CO2 ocean. Nature
450, 545-U10.
Rothman DH, Hayes JM, Summons, RE (2003) Dynamics of the
Neoproterozoic carbon cycle. Proceedings of the National Academy of Sciences,USA 100, 8124-8129.
Royer DL (2006) CO2-forced climate thresholds during the
Phanerozoic. Geochimica et Cosmochimica Acta 70, 5665–5675.
Royer DL, Berner RA, Park J (2007) Climate sensitivity con-
strained by CO2 concentrations over the past 420 million
years. Nature 446, 530–532.
Rundgren M, Beerling D (1999) A Holocene CO2 record from
the stomatal index of sub-fossil Salix herbacea L. leaves from
northern Sweden. Holocene 9, 509–513.
Rye R, Kuo PH, Holland HD (1995) Atmospheric carbon diox-
ide concentrations before 2.2 billion years ago. Nature 378,
603–605.
Sano Y, Williams SN (1996) Fluxes of mantle and subducted
carbon along convergent plate boundaries. Geophysical Research Letters 23(20), 2749–2752.
Sarmiento JL, Gruber N (2006) Ocean Biogeochemical Cycles.
Princeton University Press, Princeton, NJ.
Sheldon ND (2006) Precambrian paleosols and atmospheric
CO2 levels. Precambrian Research 147, 148–155.
Seward TM, Kerrick DM (1996) Hydrothermal CO2 emission
from the Taupo Volcanic Zone, New Zealand. Earth and Planetary Science Letters 139, 105–113.
Shields GA (2007) A normalised seawater strontium isotope
curve and the Neoproterozoic-Cambrian chemical weather-
ing event. eEarth Discussions 2(69–84).
Sleep NH, Zahnle K (2001) Carbon dioxide cycling and impli-
cations for climate on ancient Earth. Journal of Geophysical Research-Planets 106(E1), 1373–1399.
Strauss H, Moore TB (1992) Abundances and isotopic compo-
sitions of carbon and sulfur species in whole rock and
kerogen samples. In: The Proterozoic Biosphere (eds Schopf
JW, Klein C). Cambridge University Press, Cambridge,
pp. 709–798.
Syvitski J P M, Vorosmarty C.J, Kettner A J, Green P. (2005)
Impact of humans on the flux of terrestrial sediment to the
global coastal ocean. Science 308(5720), 376-380.
Teagle DAH, Alt JC, Bach W, Halliday AN, Erzinger J (1996)
Alteration of upper ocean crust in a ridge-flank hydrother-
mal upflow zone: mineral, chemical and isotopic constraints
from hole 896A. Proceedings of the Ocean Drilling Program, Scientific Results 148, 119–150.
Van der Burgh J, Visscher H, Dilcher DL, Kürschner WM (1993)
Paleoatmospheric signatures in Neogene fossil leaves.
Science 260, 1788–1790.
Veizer J (1989) Strontium isotopes in seawater through time.
Annual Review of Earth and Planetary Sciences 17, 141–167.
Veizer J, Compston W (1974) 87Sr/86Sr composition of seawater
during the Phanerozoic. Geochimica et Cosmochimica Acta 38,
1461–1484.
Veizer J, Compston W (1976) Sr-87–Sr-86 in Precambrian car-
bonates as an index of crustal evolution. Geochimica et Cosmochimica Acta 40(8), 905–914.
Veizer J, Laznicka P, Jansen SL (1989) Mineralization through
geologic time: recycling perspective. American Journal of Science 289, 484–524.
Walker JCG (1990) Precambrian evolution of the climate sys-
tem. Global and Planetary Change 82(3–4), 261–289.
Walker JCG, Hays PB, Kasting JF (1981) A negative feedback
mechanism for the long-term stabilization of Earth’s surface
temperature. Journal of Geophysical Research 86, 9776–9782.
Wallmann K (2001) Controls on Cretaceous and Cenozoic evo-
lution of seawater composition, atmospheric CO2 and cli-
mate. Geochimica et Cosmochimica Acta 65(18), 3005–3025.
Wallmann K (2004) Impact of atmospheric CO2 and galactic
cosmic radiation on Phanerozoic climate change and the
marine &sbull;18O record. Geochemistry, Geophysics, Geosystems 5(1), doi:10.1029/2003GC000683.
Wallmann K, Aloisi G, Haeckel M, Obzhirov A, Pavlova G,
Tishchenko P (2006) Kinetics of organic matter degradation,
microbial methane generation, and gas hydrate formation in
anoxic marine sediments. Geochimica et Cosmochimica Acta 70,
3905–3927.
Wallmann K, Aloisi G, Haeckel M, et al. (2008) Silicate weather-
ing in anoxic marine sediments. Geochimica et Cosmochimica Acta 72, 3067–3090.
Zachos JC, Pagani M, Sloan L, Thomas E, Billups K (2001)
Trends, rhythms, and aberrations in global climate 65 Ma to
present. Science 292, 686–693.
Knoll_c03.indd 35Knoll_c03.indd 35 2/16/2012 1:27:58 PM2/16/2012 1:27:58 PM