3. materials and methods - shodhgangashodhganga.inflibnet.ac.in/bitstream/10603/48060/4/c3.pdf ·...
TRANSCRIPT

3. MATERIALS AND METHODS
The present investigation was carried out to findout the
effect of different concentrations of lead acetate in soil on seed
germination, growth, yield responses, biochemical and mineral contents
of groundnut, and also the effect of suitable soil amendments in
ameliorating the lead toxicity in soil and enhance the overall responses
of ground.
The materials used and the methods followed in the
present investigation to meet the objectives of the present study are
described below.
3.1. MATERIALS
3.1.1. Seed and plant materials
Groundnut seeds were obtained from the “Oil Seed
Regional Research Station”, Virudhachalam, Tamil Nadu, India. Healthy
seeds were chosen and used for both laboratory and field experiments.
The experimental field was setup in B. Mutlur, Chidambaram, Cuddalore.
The vermicompost was obtained from the Department of
Zoology, Annamalai University, and the farmyard manure (FYM) was
obtained from local farmers and they were used for soil amendments.
3.2. PREPARATION OF LEAD ACETATE CONCENTRATIONS
Different concentrations (10, 25, 50, 75, 100 and 200 ppm)
of lead acetate solution were prepared freshly by using tap water and
they were used for treatments.
3.3. GERMINATION STUDY
The healthy seeds of groundnut were surface sterilized with
0.1 per cent Mercuric chloride for 2 min and washed thoroughly with
tap water followed by distilled water. Seeds of groundnut were arranged
equispacially in petridisc with filter paper. They were irrigated uniformly
with equal volume (10 mL) of different concentrations (10, 25, 50, 75,
100 and 200 ppm) of lead acetate. The seeds irrigated with tap water
were treated as control. They were allowed to grow for a week. Three
replications were maintained for this experiment.
3.3.1. Germination percentage
The number of seeds germinated in each treatment was
counted on each and every day and it was last upto 7th day after sowing.
The total germination percentage was calculated by using the
following formula:
Germination percentage = 100 sownseedsofnumberTotal
germinated seeds of number Total
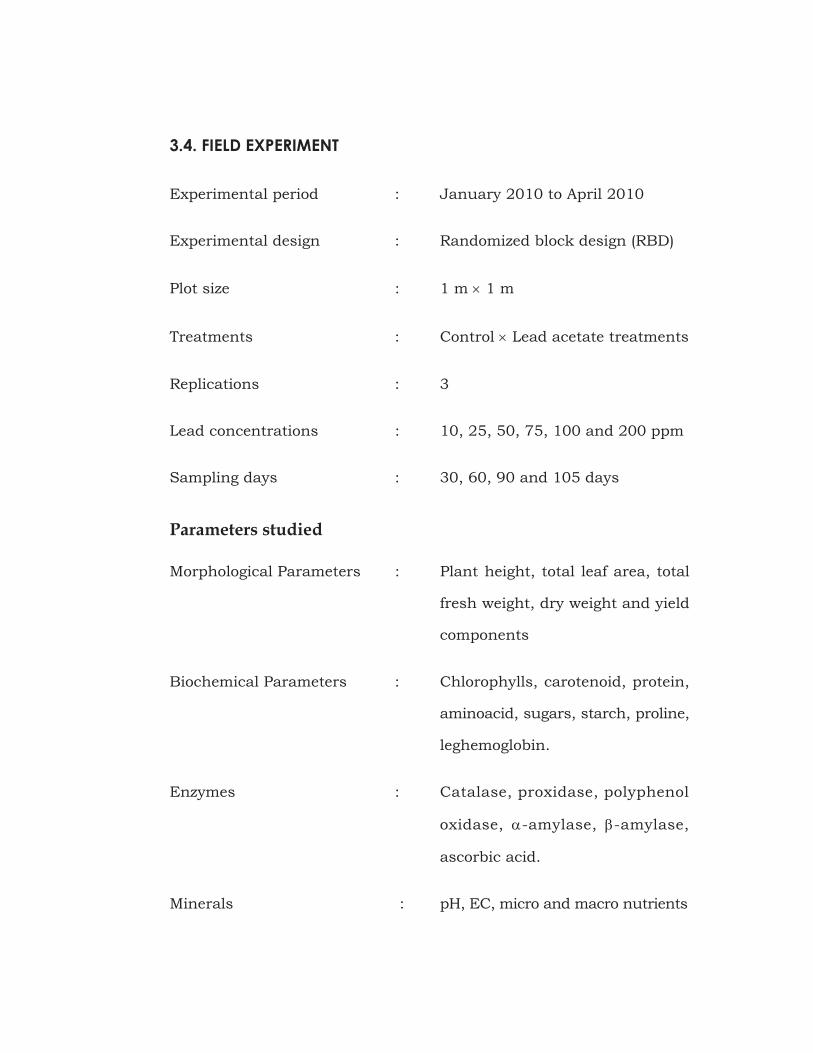
3.4. FIELD EXPERIMENT
Experimental period : January 2010 to April 2010
Experimental design : Randomized block design (RBD)
Plot size : 1 m 1 m
Treatments : Control Lead acetate treatments
Replications : 3
Lead concentrations : 10, 25, 50, 75, 100 and 200 ppm
Sampling days : 30, 60, 90 and 105 days
Parameters studied
Morphological Parameters : Plant height, total leaf area, total
fresh weight, dry weight and yield
components
Biochemical Parameters : Chlorophylls, carotenoid, protein,
aminoacid, sugars, starch, proline,
leghemoglobin.
Enzymes : Catalase, proxidase, polyphenol
oxidase, -amylase, -amylase,
ascorbic acid.
Minerals : pH, EC, micro and macro nutrients
3.5. FIELD PREPARATION
The field was thoroughly ploughed three times before sowing.
The entire field was irrigated for two days before sowing. Groundnut
seeds were sown with a spacing of 15 15 cm.
3.6. IRRIGATION SCHEDULE
The water irrigated experimental plots were kept as control.
First irrigation was done to all plots two days before sowing. The
different concentrations (10, 25, 50, 75, 100 and 200 ppm) of lead
acetate were prepared with tap water. Equal volume of tap water as
well as diluted lead was irrigated.
3.7. MORPHOLOGICAL PARAMETERS
Plant samples were collected randomly at various stages
(30, 60, 90 and 105 DAS) of its growth and used for recording
morphometrical observations like shoot length, root length, total leaf
area, fresh weight, dry weight and yield components of study crop.
Five plants were selected from each concentration including control
for recording the various morphological parameters.
3.7.1. Shoot length and root length
Five seedlings were collected on 30, 60, 90 and 105 DAS.
Their heights were measured by using cm scale and recorded. In another
experiment, shoot length and root length were measured and recorded.

3.7.2. Total leaf area
The leaf area was calculated by measuring the length and
width of the leaf as described by Yoshida et al. (1972).
Leaf area (cm2) = K length breadth
Where K = Kemp’s constant (for dicot leaves 0.66)
3.7.3. Fresh and dry weight
The plant samples taken for morphometric studies were
used for determination of fresh weight and dry weight. They were dried
in a hot air oven at 80 C for 24 hrs and their dry weight was determined
by using electrical single pan balance.
3.8. YIELD AND YIELD COMPONENTS
Five plants were used for recording the various yield
parameters like number of pods per plant, number of seeds per plant,
seed weight and total yield.
3.9. BIOCHEMICAL ANALYSES
The photosynthetic pigments such as chlorophyll and
carotenoid and the biochemical contents such as sugars, starch,
amino acids and protein were estimated in the seventh day old
seedlings of groundnut grown in laboratory.

3.9.1. Chlorophyll (Arnon, 1949)
Five hundred mg of fresh leaf material was ground with a
mortar and pestle using 10 mL of 80 per cent acetone. The homogenate
was centrifuged at 800 rpm for 15 min. The supernatant was saved.
The residue was re-extracted with 10 mL of 80 per cent acetone.
The supernatant was saved and the absorbance values were read at
645 and 663 nm in a UV-Spectrophotometer (Hitachi). The chlorophyll ‘a’,
chlorophyll ‘b’ and total chlorophyll contents were estimated and
expressed in mg/g on fresh weight basis.
Chlorophyll ‘a’ = (0.0127) (O.D 663) – (0.00269) (O.D 645)
Chlorophyll ‘b’ = (0.0229) (O.D 645) – (0.00488) (O.D 663)
Total chlorophyll = (0.0202) (O.D 645) + (0.00802) (O.D 663)
3.9.2. Carotenoid (Kirk and Allen, 1965)
The same extract was used for chlorophyll and carotenoid
estimation. The acetone extract was read at 480 nm in a UV-
Spectrophotometer. The carotenoid content was calculated by using
the following formula and it is expressed in mg/g fresh weight.
Carotenoid = (O.D 480) – (0.114) (O.D 663) – (0.638) (O.D 645)
3.9.3. Estimation of protein (Lowry et al., 1951)

Five hundred mg of plant material was weighed and macerated
in a pestle and mortar with 10 mL of 20 per cent trichloroacetic acid.
The homogenate was centrifuged for 15 min at 600 rpm. The
supernatant was discarded. To the pellet, 5 mL of 0.1 N NaOH was
added and again centrifuged for 5 min. The supernatant was saved
and made upto 10 mL with 0.1 N NaOH. This extract was used for the
estimation of protein.
One mL of the extract was taken in a 10 mL test tube and
5 mL of reagent ‘C’ was added. The solution was mixed and kept in
darkness for 10 min. Later, 0.5 mL of folin-phenol reagent was added
and the mixture was kept in dark for 30 min. The sample was read
at 660 nm in the UV-Spectrophotometer. The protein contents were
expressed in mg/g fresh weight.
Reagent A: 0.4 g of sodium hydroxide was dissolved in 100 mL of
distilled water. To this solution, 2 g of sodium carbonate was added.
Reagent B: One per cent of copper sulphate was mixed with equal
volume of 2 per cent sodium potassium tartarate.

Reagent C: 50 mL of reagent A and 1 mL of reagent B were taken and
mixed and it was prepared freshly at the time of experiment.
Folin-phenol reagent: One mL of folin-phenol reagent was diluted
with 2 mL of distilled water.
3.9.4. Estimation of amino acids (Moore and Stein, 1948)
Five hundred mg of plant material was ground with 10 mL
of 80 per cent ethanol in pestle and mortar. The homogenate was
centrifuged for 10 min at 800 rpm. The supernatant was saved and
used for the estimation of amino acids.
One mL of the extract was pipetted out into a test tube.
A drop of methyl red indicator was added. The sample was neutralized
with 1 mL of 0.1 N sodium hydroxide. To this, 1 mL of ninhydrin
reagent was added and mixed thoroughly. The whole content in the
test tube was heated for 20 min in a boiling water bath and with that
five mL of diluted solution was added and heated in water bath for
10 min. The tubes were cooled under the running tap water and the
contents were mixed thoroughly. Blank was prepared without extract.
The absorbance was read at 570 nm in a UV-Spectrophotometer. The
amino acid content was expressed in mg/g fresh weight.
Eight hundred g of hydrated stannous chloride was dissolved
in 500 mL of citrate buffer with pH 5.0 and 20 g of recrystallized
ninhydrin was dissolved in 500 mL of methyl cellosolve. Then these
two solutions were mixed together.
3.9.5. Estimation of sugars (Nelson, 1944)
Five hundred mg of plant material was ground with 10 mL
of 80 per cent ethanol in a pestle and mortar. The homogenate was
centrifuged for 10 min at 800 rpm. The supernatant was saved. Then,
the ethanol was evaporated in a water bath at 50 C. The net content
was made upto 20 mL with distilled water and the extract was used
for the estimation of reducing sugar.
One mL of extract was taken in a 25 mL test tube. 1 mL of
reagent ‘C’ was added. Then, the mixture was heated for 20 min at
100 C in a boiling water bath, cooled and 1 mL of arsenomolybdate
reagent was added. The solution was thoroughly mixed and diluted to
25 mL with distilled water. The sample was read in a UV-Spectrophotometer
at 520 nm. The sugar contents were expressed in mg/g fresh weight.

Reagent A: Twenty five gram of anhydrous sodium carbonate, 25 g of
sodium potassium tartarate, 20 g of sodium bicarbonate and 200 g of
anhydrous sodium sulphate were dissolved in 800 mL of distilled
water and made upto 1000 mL. Then, it was filtered and stored in a
glass stoppered brown bottle.
Reagent B: Fifteen per cent copper sulphate containing 1 or 2 drops
of concentrated sulphuric acid.
Reagent C: Fifty mL of reagent A and one mL of reagent B were mixed
well and it was prepared freshly at the time of experiment.
Arsenomolybdate reagent: To 450 mL of distilled water, 25 g of
ammonium molybdate, 21 mL of concentrated sulphuric acid were
added and 3 g of sodium arsenate was dissolved in 25 mL of distilled
water. The mixture was kept in a water bath at 37 C for 24 to 48 hrs.
The reagent was stored in a glass stoppered brown bottle.
3.9.6. Non-reducing sugars (Nelson, 1944)
Non-reducing sugars present in the ethanol extracts
(extraction as in reducing sugars) were hydrolysed with sulphuric acid
to reducing sugars. Reducing sugars present in the hydrolysates were
estimated following Nelson’s method. The differences between the total
sugars and the reducing sugars correspond to the non-reducing sugars.
One mL of extract was taken in a test tube and evaporated
to dryness in a water bath for 15 min. To the residue, 1 mL of distilled
water and 1 mL of 0.1 N sulphuric acid were added. The mixture was
hydrolysed by incubating at 49 C for 30 min in a thermostat. The
solution was neutralized with 0.1 N NaOH (5 mL) and the methyl red
as indicator. To this, 1 mL of reagent C (copper reagent) was added
and heated for 20 min, cooled and 1 mL of arsenomolybdate reagent
was added. The content was made upto 25 mL and the absorbance
was read at 495 nm in a UV-Spectrophotometer. The reducing sugar
contents were expressed in mg/g fresh weight. Blank was prepared
with 1 mL of distilled water.
3.9.7. Extraction and estimation of starch (Dubois et al., 1956)
Five hundred mg of plant material was macerated in a
pestle and mortar with 10 mL of 80% ethanol. The sample was
centrifuged at 6000 rpm for 15 min. The supernatant was removed
and the pellets was dissolved with 52% perchloric acid for 30 min
at 0 C. The extract was centrifuged and supernatant was diluted upto
15 times. One mL of diluted sample was mixed with 2 mL of cold
anthrone reagent in ice bath and it was boiled for 10 min at 100 C in
a water bath. The content was cooled and the absorbance was read at

630 nm in a UV-Spectrophotometer. The starch was calculated by
multiplying with 0.9 to the values obtained from standard curve. The
starch contents were expressed in mg/g fresh weight.
3.9.8. Amylases
Amylase activities were estimated following the method of
Tarrago and Nicolas (1976).
One gram of plant material was homogenized in a
prechilled pestle and mortar with 10 mL of cold distilled water at 4 C.
The homogenate was centrifuged at 15,000 g for 30 minutes in a
cooling centrifuge at 4 C. The supernatant was saved and used as
enzyme source for estimating - and -amylase activities.
3.9.8.1. -amylase (1, 4, D-glucanglucanohydrolase EC: 3.2.1.1)
3 mM calcium chloride was added to 5 mL of enzyme extract
and heated for 5 minutes at 70 C to inactivate -amylase activity.
-amylase is stable during heating. This heated extract was used to
estimate the -amylase activity.

To 1 mL of 0.1 M citrate buffer (pH 5.0) and 0.5 mL of
2 per cent soluble starch (freshly prepared) solution was added with
0.5 mL of the heated enzyme extract. The enzyme was allowed to react
for 5 minutes at 30 C. The reaction was terminated at the end of
5 minutes by adding 2 mL of colour reagent. The mixture was heated
for 5 minutes in a water bath at 50 C. After cooling, the final volume
of the solution was made up to 10 mL with distilled water. The
absorbance was read at 540 nm in a spectrophotometer. A calibration
curve was established with maltose and used to estimate the maltose
released during the reaction.
3.9.8.2. -amylase (1, 4, D-glucanmaltohydrolase EC: 3. 2. 1. 2)
-amylase activity was estimated at low pH and with 0.1 M
EDTA to inactivate -amylase (Tarrago and Nicolas, 1976).
To one mL of 0.1 M citrate buffer (pH 3.4), 0.5 mL of 2 per cent
soluble starch was added with 0.5 mL of EDTA treated enzyme extract.
The reaction was allowed for 5 minutes, after the addition of starch at
30 C. After 5 minutes, the reaction was stopped by adding 2 mL of
colour reagent. The mixture was heated for 5 minutes in a water bath
at 50 C. After cooling, the final volume was made up to 10 mL with
distilled water. The absorbance was read at 540 nm in a spectrophotometer.

-amylase and -amylase activities are expressed in terms of
units = micrograms of maltose liberated per min per mg enzyme protein.
Colour reagent
One gram of 3, 5-dinitrosalicylic acid, 200 mg of crystalline
phenol and 50 mg of sodium sulphate were dissolved in 20 mL of
2 per cent sodium hydroxide and 40 grams of potassium tartrate. The
final volume was made up to 100 mL with distilled water and filtered,
freshly prepared reagent was used.
3.10. DETERMINATION OF PROLINE CONTENT
Proline was extracted and estimated by following the
method of Bates et al. (1973).
Five hundred milligram of fresh plant material was homogenized
in a mortar and pestle with 10 mL of 3% aqueous sulfosalicyclic acid.
Then the homogenate was filtered through Whatman No.1 filter paper.
The residue was re-extracted and pooled and the filtrates were made
upto 20 mL with aqueous sulfosalicylic acid and this extract was used
for the estimation of proline.
To 2 mL of proline extract, 2 mL of acid ninhydrin and
2 mL of glacial acetic acid were added. The mixture was incubated for
an hour at 100 C in a boiling water bath. Then the test tubes were
transferred to an ice bath to terminate the reaction. Then 4 mL of
toluene was added and mixed vigorously using a test tube stirrer for
20 seconds and the toluene containing the chromophore was separated
from the aqueous phase with the help of a separating funnel and the
absorbance was measured at 520 nm in a spectrophotometer using a
reagent blank. The proline content was determined from a standard
curve with proline and the results were expressed in milligrams per
gram dry weight.
Acid-ninhydrin reagent
To 1.25 gms of ninhydrin, 30 mL warm glacial acetic acid,
20 mL of 6 M phosphoric acid were added with agitation.
3.11. ESTIMATION OF LEGHAEMOGLOBIN CONTENT OF ROOT NODULES
(Sciffman and Lobel, 1970)
Tris-acetic acid buffer: 0.1 N acetic acid (6.0 g/l) is adjusted to
pH 4.0 with 0.2 tris M (hydroxy methane) methylamine (24.38 g/l).
Benzidine reagent: One hundred mg of benzidine was added to 0.5 mL
of hydrogen peroxide and the volume was made upto 50 mL.
The nodules were washed and weighed. They were crushed
in tris-acetic acid buffer. The extract was centrifuged at 3000 g for
20 min. and 0.1 to 1.0 mL of supernatant was taken and it was made
upto final volume of 4.0 mL by tris-acetic acid buffer so as to get an
absorbance reading between 0.2 and 0.4. Later, 2 mL of freshly prepared
benzidine reagent was added. The rate of colour formation was noted by
observing the change in optical density by using UV-spectrophotometer
at 540 nm. A standard graph was prepared by plotting the absorbance at
the end of 30 second against different concentrations (0.8 to 1.5 g per mL)
of the ox-blood haemoglobin. The leghaemoglobin content of the test
sample was calculated from the standard graph and expressed in
mg g of nodules on fresh weight basis.
3.12. ENZYMES
3.12.1. Catalase activity (CAT, EC: 1.11.1.6)
Catalase activity was assayed as described by Chandlee
and Scandalios (1984).
Five hundred milligram of frozen material was homogenized
in 5 mL of ice-cold 50 mM sodium phosphate buffer (pH 7.5) containing
1mM PMSF. The extract was centrifuged at 4 C for 20 minutes at
12,500 rpm. The supernatant was used for enzyme assay.
The activity of enzyme catalase was measured using the
method of Chandlee and Scandalios (1984) with modification. The
assay mixture contained 2.6 of 50 mL of 50 mM potassium phosphate
buffer (pH 7.0) 0.4 mL, 15 mM H2O2 and 0.04 mL of enzyme extract.
The decomposition of H2O2 was followed by the decline in absorbance
at 240 nm. The enzyme activity is expressed in units 1 mM of H2O2
reduction per minute per mg protein.
3.12.2. Peroxidase activity (POX, EC: 1.11.1.7)
Peroxidase was assayed by the method of Kumar and Khan (1982).
Assay mixture of Peroxidase contained 2 mL of 0.1 M phosphate buffer
(pH 6.8), 1 mL of 0.01 M pyrogallol, 1 mL of 0.005 M H2O2 and 0.5 mL
of enzyme extract. The solution was incubated for 5 min at 25 C after
which the reaction was terminated by adding 1 mL of 2.5 N H2SO4.
The amount of purpurogallin formed was determined by measuring
the absorbance at 420 nm against a blank prepared by adding the
extract after the addition of 2.5 N H2SO4 at zero time. The activity is
expressed in unit mg-1 protein. One unit is defined as the change in
the absorbance by 0.1 min-1 mg-1 protein.
3.12.3. Polyphenol oxidase (o-diphenol: O2 oxidoreductase, EC. 1.10.3.1)
Polyphenol oxidase activity was assayed by the method of
Kumar and Khan (1982).
Assay mixture for polyphenol oxidase-contained 2 mL of
0.1 M phosphate buffer (pH 6.0), 1 mL of 0.1 M catechol and 0.5 mL of
enzyme extract. This was incubated for 5 minutes at 25 C, after which
the reaction was stopped by adding 1 mL of 2.5 N sulphuric acid.
The absorbance of the purpurogallin formed was read at 495 nm.
To the blank 2.5 N sulphuric acid was added at the zero time of the
same assay mixture. The enzyme activity was expressed in units = 0.1
absorbance per minute per mg protein.
3.12.4. Ascorbic acid activity
Ascorbic acid was extracted and estimated by the method
of Omaye et al. (1979).
One gram of plant tissue was homogenized in a pestle and
mortar with 5 mL of 10 per cent trichloroacetic acid (TCA), and centrifuged
at 3500 g for 20 minutes. The pellet was re-extracted twice with
10 per cent TCA and supernatant was made to 10 mL and used as extract.

To one mL of dinitrophenylhydrazine; thiourea and copper
sulphate reagents were added to 0.5 mL of extract and mixed thoroughly.
Then the tubes were incubated at 37 C for 3 hours and to this 0.75 mL of
ice cold 65 per cent sulphuric acid was added. The tubes were then
allowed to stand at 30ûC for 30 minutes. The resulting colour was read
at 520 nm in a Spectrophotometer (U-2001– Hitachi). The ascorbic
acid content was determined using a standard curve prepared with
ascorbic acid and the results are expressed in mg per gram dry weight.
DTC reagent
To 3 gram of 2,4-dinitrophenylhydrazine (DNPH), 0.4 grams
of thiourea and 0.05 gram of copper sulphate in100 mL of 9N
sulphuric acid. Standard solution 10 mg/100 mL 10 per cent TCA.
3.13. MINERALS
Both macronutrients (N, P, K, Ca and Mg) and micronutrients
(Zn, Cu and Fe, Mn, Pb) were analysed and recorded on 30, 60, 90
and 105 DAS. They were estimated by following the methods mentioned
earlier in germination studies.
3.13.1. Total nitrogen (Jackson, 1958 quoted by Yoshida et al., 1972)
Two hundred mg of dried and powered plant sample was
taken in a 100 mL Kjeldahl flask. Two hundred mg of salt mixture
(potassium sulphate, cupric sulphate and selenium powder mixed in
the ratio of 50:10:1) and 3 mL of concentrated sulphuric acid was
added. After digestion, 10 mL of distilled water was added and cooled.
The diluted sample was decanted into the micro-Kjeldahl
distillation flask. To that, 10 mL of 40 per cent sodium hydroxide was
added and distilled. The distillate was collected in a conical flask
containing 10 mL of 4 per cent boric acid and 3 drops of mixed
indicator (0.3 g bromocresol green and 0.2 g methyl red in 400 mL of
90 per cent ethanol). This solution was titrated against 0.05 N HCl.
Nitrogen content was estimated using the following formula,
1000 weight Sample
10014 HCl of N litre)blank - titrate (Sample (%) Nitrogen
3.13.2. Phosphorus (Black, 1965 quoted by Yoshida et al., 1972)
One gram of dried and powdered plant material was digested
with 10 mL of acid mixture (nitric acid 750 mL, sulphuric acid 150 mL
and perchloric acid 300 mL). The digest was cooled and made upto
50 mL and filtered. One mL of the digest was mixed with 2 mL of
2 N nitric acid and diluted to 8 mL. One mL of molybdovanadate
reagent (25 g of ammonium molybdate in 500 mL of water, 1.25 g of

ammonium vanadate in 500 mL of 1 N nitric acid, both were mixed in
equal volume) was added, shaken and the absorbance was measured
at 420 nm in UV-Spectrophotometer after 20 min. Calibration curve
was prepared using potassium dihydrogen phosphate as standard.
3.13.3. Potassium (Williams and Twine, 1960)
Dried and powdered plant material of 0.5 g was digested in
100 mL Kjeldahl flask using 10 mL of concentrated nitric acid, 0.5 mL
of 60% perchloric acid and 0.5 mL of sulphuric acid. The inorganic
residue was cooled and diluted with 15 mL of distilled water and
filtered through Whatman No. 42 filter paper. The filterate was made
upto 50 mL with distilled water. The filtrate was used for potassium
estimation by Flame photometer and standards were prepared with
potassium chloride.
3.13.4. Calcium, manganese and magnesium (Yoshida et al., 1972)
Two mL of the filterate was mixed with 2 mL of 5 per cent
lanthanum chloride solution and diluted with 10 mL of 1 N hydrochloric
acid. The solution was fed into an atomic absorption spectrophotometer
at 211.9 nm for calcium and 285.4 nm for magnesium. Standard
curve was prepared by using calcium chloride/magnesium chloride.
3.13.5. Copper, iron and zinc (De Vries and Tiller, 1980)
One mL of sulphuric acid and 15 mL of double distilled
water were added to a Kjeldahl flask containing 0.5 g of dried and powdered
material was incubated at 80 C for overnight. After that 5 mL of acid
mixture (nitric acid and perchloric acid in the ratio of 3:1) was added
and then digested. The digested material was cooled, made upto 50 mL
and filtered through Whatman No. 42 filter paper. The sample was
aspirated to an Atomic Absorption Spectrophotometer with air/ acetylene
flame and the readings were taken for iron (568 nm), copper (324.6 nm)
and zinc (214 nm).
3.14. SOIL ANALYSES
The soil samples were collected from each plot before
sowing and after harvesting and labelled separately. Their physico-
chemical properties such as pH, electrical conductivity, nitrogen,
phosphorus, potassium, copper, iron, zinc, magnesium, manganese lead
and calcium were estimated and recorded.
3.14.1. pH
Twenty gram of soil sample was air-dried and 50 mL of
distilled water was added and mixed well. The solutions were taken in a
beaker and the pH of the soil sample was recorded by using a pH meter.
3.14.2. Electrical conductivity
Twenty gram of dried soil sample was taken and dissolved
in 50 mL of distilled water and mixed well. The solution was used to
measure the electrical conductivity of the sample soil with the help of
an electrical conductivity meter.
3.14.3. Available nitrogen (Subbiah and Asija, 1976)
Twenty gram of the soil sample was taken in a flask and
20 mL of distilled water, 100 mL of freshly prepared 0.32 per cent
potassium permanganate solution and 100 mL of 2.5 per cent sodium
hydroxide were added. The flask was heated and 30 mL of distillate
was collected in 50 mL of N/50 sulphuric acid. Excess acid was
titrated against N/50 NaOH solution using methyl red indicator. The
amount of available nitrogen per cent in the soil was calculated by
using the following formula:
Available nitrogen (mg kg-1) =
1000
gram in soil of Weight
0.28 consumed NaOH N 0.02 of VolumeSOH N 0.02 of Volume 42
3.14.4. Available phosphorus (Jackson, 1958)
One gram of soil was suspended in 200 mL of 0.002 N
sulphuric acid, shaken well and then filtered through Whatman No. 42
filter paper. To 10 mL of filtrate, three drops of 0.02 per cent
2,4-dinitrophenol indicator were added. Whenever, the solution

became yellow, 2 N sulphuric acid was added until the disappearance
of the yellow colour. If the solution was colourless after adding the
indicator, 4 N sodium carbonate was added till it became colourless.
To that solution, 2 mL of sulphomolybdic acid (ammonium molybdate
25 g in 200 mL; 275 mL con. H2SO4 diluted to 700 mL both were
cooled, mixed and made upto 1000 mL) and 0.5 mL of chlorostannous
acid (25 g SnCl2.2H2O in 50 mL of concentrated HCl diluted to 500 mL
with water and made upto one litre with 1.2 N HCl) were added
and made upto 50 mL. The solution was shaken well and read in a
UV-Spectrophotometer at 660 nm after 5 min. Standard graph was
prepared using potassium dihydrogen phosphate.
3.14.5. Available potassium (Jackson, 1958)
Ten gram of soil was taken in 250 mL conical flask and
100 mL of 1 N ammonium acetate was added to it. The flask was
stoppered, shaken intermittently for 10 min and filtered by suction.
Ammonium acetate was poured to the soil to get a volume of 250 mL
and then evaporated to dry. Dried samples were ashed in a muffle
furnace at 700-800 C for 20-30 min. To the residue, 50 mL of 0.1 N HCl
was added and warmed gently and the extract was fed to Flame
photometer. Potassium chloride was used to prepare the standard solution.
3.14.6. Available calcium (Yoshida et al., 1972)
Five gram of soil was extracted with 50 mL of 1 N
ammonium acetate. Two mL of the extract was mixed with 2 mL of
5 per cent lanthanum oxide solution and diluted with 10 mL of
1 N HCl. The solution was fed into an atomic absorption spectrophotometer
at 211.9 nm. Standard solution was prepared using calcium chloride.
3.14.7. Available magnesium (Jackson, 1958)
Ten gram of soil sample was extracted with 50 mL of 1 N
ammonium acetate and the extract was filtered and used for the
determination of magnesium. The determination procedure was
adopted as in the case of calcium. The amount of magnesium was
estimated by using Atomic Absorption Spectrophotometer. Magnesium
chloride was used for the standard preparation.
3.14.8. Copper, iron and zinc, lead (Piper, 1966)
Fifty gram of soil was extracted with 100 mL of extraction
solution (diethylenetriaminepentaacetic acid – DPTA) and shaken thoroughly
for 2 hrs. The solution was filtered through Whatman No. 42 filter
paper. The filtrate was read at 568 nm for iron, 324.6 nm for copper
and 214 nm for zinc by using the appropriate hollow cathode lamps in
Atomic Absorption Spectrophotometer.
3.14.9. Estimation of manganese (De Vries and Tiller, 1980)
One mL of sulphuric acid and 15 mL of double distilled
water were added to a Kjeldahl flask containing 0.5 g of dried and
powdered material and incubated at 80 C for over night. After that
5 mL of acid mixture (nitric acid, 3: perchloric acid, 1) was added and
digested until the nitric acid and perchloric acid were driven off.
The digest was cooled, diluted, filtered through Whatman No.42 filter
paper and made up to 50 mL.
The solution was directly, aspirated to an Atomic Absorption
Spectrophotometer (Perkin – Elmer – 2280), with air/acetylene flame
for estimating for manganese.
3.15. REMEDIATION BY SOIL AMENDMENTS
3.15.1. Pot culture experiment
Pot culture experiments were conducted with groundnut to
find out the suitability of various soil amendments for getting higher
yield of crop grown under lead acetate polluted soil. Five kg of polluted
soil was taken in an earthen pot. The polluted soil mixed with some
soil amendments such as farmyard manure and vermicompost. The
following soil amendments were given to the polluted soil in pot
culture experiments.

T1 – Garden soil (Control)
T2 – 10 ppm + Lead acetate + Vermicompost
T3 – 25 ppm + Lead acetate + Vermicompost
T4 – 50 ppm + Lead acetate + Vermicompost
T5 – 75 ppm + Lead acetate + Vermicompost
T6 – 100 ppm + Lead acetate + Vermicompost
T7 – 200 ppm + Lead acetate + Vermicompost
The seeds of groundnut were sown in earthen pots. The
pots were irrigated once in a week. Three replicates were maintained for
this experiment. Five plant samples were randomly selected from each
and every treatment and they were used for recording various morphological,
growth and yield parameters as stated earlier in this section.
3.16. STATISTICAL ANALYSIS
The statistical analyses (standard deviation) of experimental
results were carried out as per the procedure given by Sockal and
Rohalf (1973).