3 - international scientific conference
TRANSCRIPT

63
Coaching
Training
and
Testing

64
1. SPECIFIC RHYTMIC GYMNASTICS SKILLS ACQUISITION CONDITIONALLITY IN PRESCHOOL
CHILDREN ................................................................................................................................ 65 2. IDENTIFICATION OF GENERAL COORDINATION LEVEL ACCORDING TO LATERALITY IN
HANDBALL .............................................................................................................................. 71 3. IMPACT OF BODY HEIGHT AND WEIGHT ON SPECIFIC MOTOR ABILITIES OF VOLLEYBALL
PLAYERS .................................................................................................................................. 75 4. ANTHROPOLOGICAL CHARACTERISTICS AND BIOLOGICAL AGE IN SOCCER PLAYERS .......... 83 5. RELATIONS BETWEEN BASIC AND FOOTBALL SPECIFIC MOTOR ABILITIES AMONG FIRST
LEAGUE FEMALE FOOTBALL PLAYERS ................................................................................... 89 6. DIFFERENCES IN PLAYING REVERSAL BALLS ON MATCHES OF ТHE FINALISTS ON THE
FOOTBAL WORLD CHAMPIONSHIP 2010 ................................................................................... 95 7. MODELING OF TABLE TENNIS TRAINING ACCORDING PHYSIOLOGICAL CHARACTERISTICS OF
THE GAME................................................................................................................................ 99 8. POSSIBILITY OF SUBJECTIVE EVALUATION OF DIFFERENT LOAD INTENSTY IN AMATEUR
BOXING TRAINING................................................................................................................. 107 9. CONDITIONALITY OF MAXIMUM OXYGEN UPTAKE OBTAINED BY DIFFERENT EXERCISE
MACHINES WITH TRAINING LOAD SETUP USING GROSS MOTOR SKILL TESTS ..................... 113 10. INFLUENCE OF EXTRAVERSION-INTROVERSION ON THE BALANCE OF THE STUDENTS FROM
THE FACULTY OF SPORT AND PHYSICAL EDUCATION .......................................................... 117 11. INFLUENCE OF BACKGROUND MUSIC ON PHYSICAL PERFORMANCE ................................... 123 12. VALIDITY OF DIFFERENT KINEMATICAL METHODS FOR ASSESING KNEE ANGLE DURING
CYCLING ................................................................................................................................ 129 13. EFFECT OF PLYOMETRIC TRAINING ON CHANGES IN THE LEVEL OF SPEED SKILLS AND
AGILITY OF FOOTBALL PLAYERS .......................................................................................... 135 14. WHOLE-BODY CRYOTHERAPY FOR RECOVERY AFTER PLYOMETRIC EXERCISE .................. 141 15. ASSESSMENT OF BALANCE USING DIFFERENT SITTING TASKS AND RELATIONSHIP TO THE
STRENGTH OF TRUNK MUSCLES............................................................................................ 147 16. INTER- AND INTRA-SESSION REPEATABILITY OF SOME MVC RELATED PARAMETERS
MEASURED BY AN ISOMETRIC KNEE DYNAMOMETER.......................................................... 153 17. MEASUREMENTS OF POSTURAL REFLEX REACTIONS TO SUDDEN LOADING OF THE HANDS: A
RELIABILITY STUDY .............................................................................................................. 159 18. ASSESSEMENT OF ISOMETRIC TRUNK STRENGTH – THE RELEVANCE OF BODY POSITION AND
RELATIONSHIP BETWEEN PLANES OF MOVEMENT ............................................................... 165 19. DIFFERENCES IN THE LEVELS OF REPETITIVE STRENGTH OF YOUNG FOOTBALLERS .......... 171 20. FACTORIAL VALIDITY OF MOTOR TESTS FOR ASSESSING EXPLOSIVE STRENGTH ............... 177 21. DIFFERENCES IN THE VERTICAL JUMPING POWER OF FOOTBALL AND VOLLEYBALL PLAYERS
............................................................................................................................................... 183 22. DIFFERENCES BETWEEN LOWER LIMB EXPLOSIVE STRENGTH OF MEN AND WOMEN
ATHLETES WHO ARE ENGAGED IN VARIOUS SPORTS ........................................................... 187 23. ANALYSIS OF THE JUDO OLYMPIC TOURNAMENT FOR MEN, LONDON 2012 RETROSPECTIVE
............................................................................................................................................... 193 24. EVALUATION OF THE TEHNICAL AND TACTICAL ASPECT IN JUDO OLYMPIC TOURNAMENT
FOR WOMEN .......................................................................................................................... 199 25. DIFFERENCES IN INDICATORS OF CONDITIONAL PREPARATION OF GRAPPLING AND GRECO-
ROMAN STYLE WRESTLERS................................................................................................... 205 26. PREPARATION DURATION FOR THE WEIGHT LIFTERS IN JERK LIFTING ................................ 210 27. SOME MEASURING CHARACTERISTICS OF THE TEST "CIRCULAR KICK" – MAVASHI GERI ... 215 28. THE EXERCISE INTENSITY OF HUNGARIAN A-LEVEL MOTOCROSS ATHLETES ..................... 221 29. USE OF SUPPLEMENTS AMONG THE NATIONAL TRACK AND FIELD TEAM MEMBERS .......... 225

65
SPECIFIC RHYTMIC GYMNASTICS SKILLS ACQUISITION
CONDITIONALITY IN PRESCHOOL CHILDREN
Ana Kezić, Tina Erceg and ðurñica Miletić Faculty of Kinesiology, University of Split, Croatia
Abstract
Rhythmic gymnastics program for beginners stands in complete contrast to the sphere of competitive rhythmic gymnastics. The main aim of current research was to determine the conditionality of the specific rhythmic gymnastics skills acquisition in preschool girls. The sample consisted of 30 preschool girls in the age of 6 from two preschool institutions. All participants were conducted to 5 new specific rope skills tests and 4 fundamental movement skills tests taken from the „Bruininks-Oseretsky Test of Motor Proficiency 2“ battery of tests. The children were subdued to a 35 minutes exercise program three times per week for six months and evaluation of their rope skills was tested three times: initial, transitive and final. A dynamic learning process of all 4 specific rope skills was determined, which is proof of a well organized and appropriate kinesiological treatment. Results of regression analyses indicate that different motor skills are typical for the different learning stages. First motor learning phase wasn't characterized by an effect of chosen fundamental movement skills (R=0.52, p=0.09), while in the second (R=0.56, p=0.04) and especially third (R=0.63, p=0.01) phase, where skills become more complex, the effect of bilateral coordination is very important. Specific coordination, relevant for the success in rhythmic gymnastics, must begin it's development in preschool age already.
Keywords: rope skills, motor learning, movement skill, BOT-2
Introduction
In preschool environment rhythmic gymnastics is not sexually determined and has equal participation of boys and girls as well as equal participation of children with different motor abilities and skills. Revelation of one’s capabilities and opportunities through body movement and manipulation of apparatus is what motivates children to perform increasingly complex movements and skills. Children take part in this kind of program from the age of 4 to significantly increase their training knowledge until they enter the competitive program (Jastrjembskaia and Titov, 1999). Rhythmic gymnastics skills are thought to belong to specific motor skills. These skills are considered to be a combination of fundamental movement skills applied to the performance of specific sports. Successful mastering of fundamental movement skills is a prerequisite to the successful introduction to specific sports and disciplines (Burton and Miller, 1998; Gallahue and Ozmun, 1998; Jürimäe and Jürimäe, 2000; Karabournitios et al., 2002; Schmidt and Lee, 2005) with exercise being the crucial factor of their development (Gallahue and Ozmun, 1998). Gallahue and Donelly (2003) consider that individuals who haven’t reached the mature phase in fundamental movement skills development have limited possibility in specific motor skills acquisition. The question is whether this assumption is justified when certain sports are mentioned, in the case of this study, rhythmic gymnastics?
Basic rhythmic gymnastics skills (especially with rope) have to be mastered at earlier stage of motor development so that the child enriches their motor memory by the time they enter their first competitions. Early mastering of basic rope techniques becomes more important by the fact that the rope is one of the apparatus that is implemented in early competitions first.
So, the main aim of current research was to determine the conditionality of the specific rhythmic gymnastics (rope) skills acquisition in preschool girls.

66
Method
The sample consisted of 30 girls from two preschool facilities from Split, Croatia. Their chronological age was 6 years (± 6 months) and they were without health problems or severe motor deficits. The girls averaged 121.1±5.0 cm in height, 22.8±3.78 kg in weight. All children participated in at least 80% of experiment and all measurement points. They were allowed to participate in sport activities outside the experiment, except for rhythmic gymnastics. Prior to research every parent signed a consent form for their children’s participation in the research.
Rope skills tests (Bozanic, 2011) were constructed following the technical rope elements guidelines of FIG’s (2009) Code of Points (swings, rotations, skipping through the rope, throws and catches and manipulations). According to that classification the following 5 skills were chosen: rope swinging (VNJ), rope rotation in front scale (VR), two foot skipping through the rope (VS), throwing one end of the rope (VB), rope winding (VN). Every skill was assessed by four independent judges on a scale from 0 to 6 according to previously determined criteria (Bozanic, 2011). For the purpose of this research the authors used the sum of all rope skills for each measurement point.
˝Bruininks-Oseretsky Test of Motor Proficiency˝, second edition (BOT-2) (Bruininks and Bruininks, 2005) is a tool for fundamental motor skills assessment. This tool is applicable for testing children from age 4 to 21. It’s used in a number of studies especially because it detects certain motor deficits. The complete BOT-2 form is consisted of 53 different tasks in 8 motor areas. All of these tasks have a progressive flow from easier to demanding ones. Complete form can be applied in 60 to 90 minutes per child. For the use of this research the authors used tasks from 4 different motor areas that are considered to be related to rhythmic gymnastics skills: fine motor integration (FMI), manual dexterity (MD), upper-limb coordination (ULC) and bilateral coordination (BIC).
Fundamental skills (BOT-2) were assessed at the very beginning of the treatment as well as the initial measurement of rope skills. The transitive measurement point of rope skills occurred three months after the initial measurement point, while the final assessment took place at the end of the treatment (six months after the initial assessment). The children were subdued to a 35 minutes exercise program three times per week for six months, among which rhythmic gymnastics skills were inserted.
Data were analyzed using the Statistica for Windows 7.0 package and statistical significance was set at p ≤ 0.05. Basic descriptive statistics were calculated (mean values, standard deviations, minimum and maximum results). Relations between rope skills and fundamental movement skills were analyzed through three regression analyses (R, p) by each measurement point.
Results and Discussion
For the purpose of investigating the relations between fundamental movement skills and rhythmic gymnastics skills, all 5 applied rope skills were added to gain information about the overall rope skills achievement. According to the results of basic statistics from Table 1 it is possible to notice that participants had lowest rope skills scores in the initial measurement point (6.46) and highest scores in the final assessment (25.30). This was highly expected as they entered the experiment without any foreknowledge. Metric characteristics (objectivity and sensitivity) were confirmed by Bozanic (2011).
Table 1. Basic statistics of rhythmic gymnastics (rope) and fundamental skills (BOT-2) variables Mean±SD MIN MAX
ROPE_INITIAL 6.46±3.16 1.00 13.67
ROPE_TRANSITIVE 21.02±3.88 9.33 27.33
ROPE_FINAL 25.30±3.25 17.00 29.67
BOT_FMI 7.30±2.10 3.00 10.00
BOT_MD 4.27±1.17 2.00 6.00
BOT_ULC 5.77±2.52 1.00 10.00
BOT_BIC 6.43±0.77 5.00 7.00

67
Further detailed analysis of dynamics of the learning process (Figure 1) reveales individual rope skills acquisition. Rope technique that was learned on the highest level was rope swinging. The mentioned technique (swinging) is introduced in the learning process first because it is the easiest rope technique. Two foot skipping through the rope seemed to be the most difficult technique to learn for preschool girls. The most probable reason for this phenomenon is that six-year-old girls find it especially difficult to simultaneously perform both body and rope technique. This is confirmed by Miletic (2003) in a similar test on a sample of school girls.
Figure 1. Dynamics of the rope skills learning process through three measurement points: A (initial), B (transitive) and C (final).
Results of the first regression analysis in the initial point of measurement (Table 2) doesn't point to significant influence of fundamental movement skills (BOT-2) on rope skills acquisition (p=0.09). This could be a consequence of a very low level of rope skills at the beggining of the experiment. According to second regression analysis (transitive assessment) it is possible to conclude that the set of predictor variables is statistically significant for success in rope skills performance (p=0.04). The level of explained variance reaches 31% in this measurement point. Very similar result can be observed in the third analysis (final assessment) where even 40% of variance is explained by the predictor variables. When observed partially, in both analyses, motor variables of bilateral coordinaton have significant influence on rope skills performance.
Table 2. Regression analyses with fundamental movement skills (BOT-2) as predictors and total rope achievement in particular measurement point as criterions
ROPE_INITIAL ROPE_TRANSITIVE ROPE_FINAL
Beta Beta Beta
BOT_FMI 0.12 0.23 0.17
BOT_MD 0.29 0.11 0.22
BOT_ULC 0.01 0.00 0.20
BOT_BIC 0.36 0.46 0.43
R 0.52 0.56 0.63 R2 0.27 0.31 0.40 p 0.09 0.04 0.01

68
The most interesting fact from the kinesiological point of view is that the „movement idea“ is created in initial phases of the learning process (Gentile, 1972), and that the motor structures are performed on a basic level (Neljak et al., 2008). This phase is called verbal-cognitive phase of learning (Fitts and Posner, 1967) and is characterized by insecurity, slowness and frequent errors. By time and training, as well as increase of the level motor abilities and skills, errors don't appear as much and performance becomes more secure and accurate. This phase is called motor learning phase (Gentile, 1972). Given that automatic learning phase (Schmidt and Wrisberg, 2000) requires long-term training and experience, it can be assumed that the motor learning phase retains over a long period of time.
By significant increase of the level of rope skills and declining number of performance errors, transitive measurement point can be described as the motor learning phase. In this phase bilateral coordination seems to be a important motor skill. So, timely, accurate and synchronized movements of the upper and lower extremities are responsible for correct rope skills performance. It is clear that during the final assessment these participants were still in a motor learning phase since automatic phase appears only after 40000 – 50000 repetition of a certain movement (Coh et al., 2004) which represents a multi-year period. So, in this higher motor learning phase set of applied predictors have even higher influence on the level of rope skills that in transitive assessment. It is obvious that during the learning process the acquired motor skills become more important. So, girls who had higher level of fundamental movement skills find it easier to eliminate performance errors and are sooner to reach performance stability.
Regarding bilateral coordination, its influence is most obvious in the final point of the learning process. BOT-2 tools for bilateral coordination assessment are most similar to rhythm coordination tests that are mostly used among rhythmic gymnastics trainers and specialists. Namely, both synchronized hops and arm and leg tapping (which are parts of the BOT-2 bilateral coordination assessment tasks) demand a certain performance rhythm. Otherwise it isn’t possible to achieve a high score on the test. According to this, it could be assumed that the applied tests assess not only coordination of upper and lower extremities but also ability of coordination in rhythm. It is known (Miletic et al., 2004; Miletic and Furjan-Mandic, 2005) how coordination in rhythm is one of the important abilities needed for success in rhythmic gymnastics.
According to stated and the fact that coordination is a complex ability, it is possible that there is a sequence of lower and higher phases of coordination: first – motor integration, second – bilateral coordination, and third – degmental coordination. It is also possible to talk about lower and higher levels of coordination. However, it can be concluded that specific coordination, relevant for the success in rhythmic gymnastics, must begin it's development in preschool age already.
References
1. Bozanic, A. (2011). Assessment and analysis of the rhythmic gymnastics motor skills development. Doctoral Dissertation, Split: Faculty of Kinesiology.
2. Bruininks, R.H., & Bruininks, B.D. (2005). Bruininks-Osretsky Test of Motor Proficiency – Second Edition. Minneapolis, MN: Pearson.
3. Burton, W.A., & Miller, E.D. (1998). Movement skill assessment. Champaign, IL: Human Kinetics.
4. Coh, M., Jovanovic-Golubovic, D.; & Bratic, M. (2004). Motor learning in sport. Physical Education and Sport, 2(1), 45-59.
5. Fédération Internationale de Gymnastique - FIG (2009). Code of Points in Rhythmic Gymnastics. Abruzzini E. (Ed.), FIG.
6. Fitts, P.M., & Posner, M.I. (1967). Human performance. Belmont, CA: Books/Cole.
7. Gallahue, D., & Donnely, F. (2003). Developmental physical education for all children. Champaign, IL: Human Kinetics.
8. Gallahue, L.D., & Ozmun, C.J. (1998). Understanding motor development. Infants, children, adolescents, adults. Boston: McGraw-Hill.
9. Gentile, A.M. (1972). A working model of skill acquisition with application to teaching. Quest Monograph, 17, 3-23.

69
10. Jastrjembskaia, N., & Titov, Y. (1999). Rhythmic gymnastics. USA: Human Kinetics.
11. Jürimäe, T., & Jürimäe, J. (2000). Growth, physical activity and motor development in prepubertal children. Boca Raton: CRC Press.
12. Karabourniotis, D., Evaggelinou, C., Tzetzis, G., & Kourtessis, T. (2002). Curriculum enrichment with self-testing activities in development of fundamental movement skills of first-grade children in Greece. Perceptual and Motor Skills, 94 (3), 1259-1270.
13. Miletic, D. (2003). Analiza usvajanja motoričkih znanja u ritmičkoj gimnastici. Doctoral Dissertation, Zagreb: Faculty of Kinesiology.
14. Miletic D., & Furjan – Mandic, G. (2005). Motorička uvjetovanost usvajanja osnovnih tehnika trakom u ritmičkoj gimnastici. In: Sekulic D. (Ed.), Zbornik radova 1. meñunarodnog znanstveno – stručnog savjetovanja ˝Sport – rekreacija – fitness˝, Split, 97-100.
15. Miletic, D., Sekulic, D., & Wolf – Cvitak, J. (2004). Razina motoričkih sposobnosti izravno utječe na kvalitetu izvedbe skokova u ritmičkoj gimnastici. Kinesiology, 36(1), 35-43.
16. Neljak, B., Milic, M., Bozinović Mador, S., & Delas Kalinski, S. (2008). Vježbajmo zajedno 1 – priručnik iz tjelesne i zdravstvene kulture s CD-om za učiteljice i učitelje prvog razreda osnovne škole. Profil, Zagreb.
17. Schmidt, R.A., & Lee, T.D. (2005). Motor control and learning. Champaign, IL: Human Kinetics.
18. Schmidt, R.A., & Wrisberg, C.A. (2000). Motor learning and performance. Champaign, IL: Human Kinetics.

70

71
IDENTIFICATION OF GENERAL COORDINATION LEVEL
ACCORDING TO LATERALITY IN HANDBALL
Dana Bădău
Department of Human Motor Science, University of Medicine and Pharmacy, Tirgu Mures, Romania
Abstract
The process of general and specific training and of competition activity specific to handball game requires the players to possess a high level of coordinative capacity, which allows efficient adaptation of technical and tactical possibilities to the practical developing conditions of games.
The research was carried out in December 2011, on a number of 20 subjects, practicing handball, with ages between 16-18 years; 10 of them with right manual dominance and other 10 with left manual motion prevalence and had in view to identify the general coordination level according to laterality with the help of Matorin test.
The average score of the females at the test on the right side was 8.3 for those with right laterality and 7.4 for those with left laterality. At the test on the left side the average score was: 7.8 for those with right laterality and 8.7 for those with left laterality. In what the males are concerned, the test results for the right-handers were 8.2 points at the test on the right side and 7.3 points on the left, as for those with left laterality, the score was 7.3 for execution on the right and 8.4 for the left side.
The results confirmed the hypothesis from which we started the research and show the fact that the general coordination level is directly influenced by laterality and inferentially by the motion prevalence. The left-handers’ results both of the females and males were slightly better than those of the right-handers.
Keywords: coordination, laterality, handball, hemispheric dominance, right-handers, left-handers.
Introduction
The handball game is characterized through the variety and complexity of technical and tactical situations, in addition to the actions of the partners and opponents, this requiring a constant adaptation of the players and efficiency of the entire motion behavior. (Szabo, 2009)
The enhancement of coordinative capacity is tightly connected to the level of biological potential, which is determined on one hand by the degree of hereditary transmitted predispositions, and on the other hand by the value of accumulations which can be reached through educational course.
The psychomotricity area is wide and has a very complex and diverse content. From the motion behavior perspective, psychomotric elements play an essential role in the voluntary adjusting of actions, both related to intention, purpose orientation, as well as to monitoring, control and coordination-compensation mechanisms. (Horghidan, 2000)
Psychomotricity allows the understanding of human being from the perspective of psychic and motric interrelation, having an essential role within the sportsmen’s psycho-behavioural system. (Badau, Paraschiv, 2007)
Every sensorial surface (skin, retina) is closely connected to a specific sensorial field, situated in the opposite side of the cerebral hemisphere corresponding to this surface. In each cerebral hemisphere is also a sensorial field and a motor center. Between the two cerebral hemispheres identical connections can be found, the majority of neurons having opponents (correspondents) in the reverse side, but carrying specific, separate functions.

72
Theoretical background
Coordinative capacity is based on the correlation of the nervous system as analyzer, adjuster and muscular sense, the development degree of motion analyzer and balance as effectors. Coordinative capacity is systematically carried out from simple to complex level.
People are unique through their capacity to learn a variety of new and complex coordination moves, this allowing them to become talented in various activities.
The “coordination” term defines two or more components acting together in a harmonious manner in order to produce the required result.
Laterality represents the internal awareness of body parts and of the fact that they are different. If not for the concept itself of distinction between the body’s two dissimilar parts, it is very difficult to learn how to coordinate yourself.
Francine Lauzon (quoted by Horghidan, 2000), thinks that laterality is “the interior knowing of the two body parts”. It is transposed into the perfect utilization of one of the body part in executing motion tasks, through the capacity to identify the left from the right. Laterality is manifested in the right or left predominance of the hand, eye or leg in executing moves.
Most research show that lateral dominance is manifested through a relative functional prevalence (we cannot talk about complete left-handers or right-handers), the deviations are the result of multiple causes. Motion prevalence is the result of one cerebral hemisphere’s dominance expressed on the opposite side of the body, personified by the fact that the right-handed has left hemisphere dominance and the left-handed the right hemisphere. Each cerebral hemisphere’s competency is different, specialized as a consequence of human evolution. (Driesen, 2001; Stell at comp., 2000)
Both cerebral hemispheres input in carrying out every function is symmetrical, the difference being in the weight factor of their contribution according to the nature of the stimulus or the task.
Operational capacities of the cerebral hemispheres depend on the involved mechanisms in carrying out the given function and not on the information type that has to be treated. Elements determining the contribution of each cerebral hemisphere to carrying out a function are: the nature of the task, contextual situation and adopted resolution strategies. (Horghidan, 2000)
Types of laterality and their characteristics
From the perspective of the referred segment, the following types of laterality are distinguished: manual, podal, ocular, acoustic and combinations of the above. According to motion prevalence characteristics, the subjects are divided into: left-handed, right-handed and ambidextrous.
Method
The concept from which this research started was that through the testing of general coordination, depending on the motion prevalence of junior handball players, the technical degree increases and the influence of external variables is diminished.
The overall purpose is to test the general coordination level of junior handball players according to manual laterality, with the view to optimize the training process.
To set the hypotheses of this research we started from the premise that the level of general coordination is determined by the motion prevalence.
The methods used for this study were: bibliographic method, test method, scientific and mathematic method as well as graphic method.
The test used for the evaluation of general coordination within the study was the Matorin Test, consisting of a rotation execution by jumping from a sit position. The subject sits in a circle marked with degrees and these degrees are measured during the jump. One jump to the left and one to the right is executed. The estimation is made according to the following grid: 4 points – 270°, 5 points – 300°, 6 points – 330°, 7 points – 360°, 8 points – 390° (360°+30°), 9 points - 420° (360°+60°), 10 points – over 450° (360°+90°).

73
From the multiple mathematical and statistic indices we considered useful for the interpretation of the testing results, the following: the average –X; standard deviation – S; variability coefficient -CV.
The research was carried out in December 2011, on a number of 20 subjects, Juniors One practicing handball (10 females and 10 males), with ages between 16-18 years; 10 of them with right manual dominance (right manual motion prevalence involving a left cerebral hemisphere dominance) and other 10 with left manual motion prevalence (right hemisphere dominance).
The sample of the research consisted of feminine and masculine components of handball teams within the Dinamo Club in Brasov, part of the National Republican Championship Juniors One. They were selected and divided into two groups with the same anthropometric criteria:
− left-handers group: formed by 10 sport players (5 females and 5 males), with the right superior and inferior dominant segment.
− right-handers group: formed by 10 sport players (5 females and 5 males), with the left superior and inferior dominant segment.
Results
Table 1 Results summarization – Matorin Test - to the right Matorin Test – to the right
Females Males Statistics
Laterality
Right-handed
Left-handed
Difference Statistics
Laterality
Right-handed
Left-handed
Difference
X 408° 372° 36° X 397° 368° 29° S 0,69 0,71 - S 0,74 0,87 -
CV 8,31% 9,59% - CV 9,02% 11.91% -
Table 2 Results summarization – Matorin Test - to the left Matorin Test – to the left
Females Males Statistics
Laterality
Right-handed
Left-handed
Difference Statistics
Laterality
Right-handed
Left-handed
Difference
X 384° 412° 28° X 370° 403° 33° S 0,77 0,79 - S 0,93 0,81 -
CV 9,87% 9,08% - CV 12,73% 9,64% -
D
Graphic no. 1 Graphic representation of averages in points – Matorin Test
8.37.8
7.48.7
8.27.3
7.38.4
6.5 7 7.5 8 8.5 9
F emale - right hands
F emale -left handed
Male - right handed
Male - left handed
Matorin - to the left C olumn1

74
Discussion and Conclusion
It is emphasized with the help of this study that the players with right laterality obtained better results at the test on the right side as opposed to those with left laterality. The same phenomenon is noticeable in the case of the test on the left side, where the handball players, both females and males with left laterality reached superior performances in comparison with those having right laterality.
The average score of the females at the test on the right side was 8.3 for those with right laterality and 7.4 for those with left laterality. At the test on the left side the average score was: 7.8 for those with right laterality and 8.7 for those with left laterality.
In what the males are concerned, the test results for the right-handers were 8.2 points at the test on the right side and 7.3 points on the left, as for those with left laterality, the score was 7.3 for execution on the right and 8.4 for the left side.
The homogeneity of these tests was preponderantly good, with two exceptions where the variability coefficient had values above 10%, which indicates only a fine homogeneity.
The results confirmed the hypothesis from which we started the research and show the fact that the general coordination level is directly influenced by laterality and inferentially by the motion prevalence.
The left-handers’ results both of the females and males were slightly better than those of the right-handers. It is known that the improvement of abilities for one arm only is determined by genetic and hormonal factors.
Regarding the study of some existing differences of cerebral processing on the subject of general coordination between men and women, the results of our research reveal the fact that females have a superior general coordination than the males. This statement adds up to the results of other studies according to which women have a better orientation in space as compared to men, as well as a better perception and space visualization.
References
1. Badau, D. (2006). Ambidestrous in physical activities. Transilvania, Brasov: Publish house.
2. Badau, D., & Paraschiv F. (2007). Sport games, Theory and methodology. Transilvania, Braşov: Publish House.
3. Horghidan, V. (2000). Problematica psihomotricitatii. Bucuresti: Globus.
4. Stell, L., Caldwell, B., Dake, D., & Safli, M. (2000). Laterality – the human brain two hemispheres which function differently. Iowa State University.
5. Szabo, M. (2009). Handball. Brasov: Omnia Uni SAST.

75
IMPACT OF BODY HEIGHT AND WEIGHT ON SPECIFIC MOTOR
ABILITIES OF VOLLEYBALL PLAYERS
Sunčica Poček and Milenko Vuković Faculty of Sport and Physical Education, University of Novi Sad, Serbia
Abstract
Effective and efficient movement is fundamental to sports performance. Movement binds together all of the skills of a game into a coherent flow. Sport - specific training program can induce peculiar neuromechanical adaptations that are commonly considered as signs of aquisition and/or improvement of a specific movement skill. An athlete’s anthropometric and physical characteristics may represent important prerequisites for successful participation in any given sport. Twenty one collegiate volleyball players, (age 19.85 +/- 0.83 years; height 181.67 +/- 12.03 cm; weight 72.62 +/- 12.99 kg; training experience 6.76 +/- 2.21 years), were recruited for this study. The purpose of this study was to examine the significance of the impact of body height and weight on the specific motor abilities of volleyball players. The following tests were performed: Block jump, Spike jump, Standing broad jump, Jelka test, T – test, 93639 m test, Obstacle course backwards, Arm plate tapping and Dash 20 m. Regression analysis from package SPSS 15.0 was used for data processing. The results showed that body height and weight had a statistically significant impact on the expression of specific motor abilities of volleyball players. Indeed, it can be assumed that an athlete’s anthropometric characteristics can in some way influence his/her level of performance, at the same time helping to determine a suitable physique for a certain sport.
Keywords: anthropometric measures, CODS abilities, volleyball.
Introduction
Identification of specific characteristics of physique that may contribute to success in sports as well as the possible structural differences among athletes in various sports has been a subject of high interest for sport scientist and coaches (Zaccagni & Gualdi-Russo, 1996; Duncan, Woodfield & al-Nakeeb, 2006). The imporatnce of players’ tall stature in some team sports (e.g., volleyball, basketball) is accepted as it is well known that body height influences positively all body segment lengths and, in turn, athletic performance (Malousaris, Bergeles, Barzouka, Bayios, Nassis, & Koskolou, 2008). Although adequate body size and shape are not the only elements necessary for an athlete to excel, they may represent important prerequisites for successful participation in sport (Lidor & Ziv, 2010). The importance of tall stature in volleyball is well known. Body height is considered a determinant factor for good performance in volleyball and, together with its relation to body mass, is used as a criterion for the selection of promissing volleyball players (Grgantov, Katić & Janković, 2006; Malousaris, et al., 2008). Professional volleyball players are expected to have this anthropometric characteristic along with other physical traits and skills required for a high level of performance. The significance of the antropometric factors in the physical abilities, volleyball technical skills and psychophysiological computerized tests in 13-16 years old female volleyball players has been studied, according to Stamm (2003; 2006), body build determined 42-89% of the results of physical abilities tests, up to 32% of volleyball technical tests and up to 43% of psychophysiological tests. The biological meaning of the findings might consist in an advantage during the volleyball match for players who tend to have a lean physique (Gualdi-Russo & Zaccagni, 2001).
Volleyball is an open skill sport with predominant anaerobic alactic acid power. The “kinanthropometric” profile of volleyball players includes great height, muscle power, jumping ability, velocity and coordination, all necessary in a game involving strength and elevation to block, strength and speed to spike, resistance to play the sets, as well as great technical ability. At higher skill levels, performance characteristics are mainly determined by speed and vertical jumping. The physical capacities determining an athletes’ performance are explosive – dynamic muscle actions, jumping ability and speed

76
in executing rapid, multidirectional movements (Ciccarone, Croisier, Fontani, Martelli, Albert, Zhang, Kloes, 2008). Fontani, Ciccarone and Guilianini (2000) in their study analyzed physical effort in relation to the new game rules and differentiated the workload by the number of jumps made by players in different positions during matches of different duration. They (Fontani et al. 2000), found notably different performance patterns between the old and the new systems. The most important differences were the lower number and shorter duration of active phases in matches played according to the new rules and the increase in passive phases. Nearly 50% of actions were composed of three touches with a mean duration of 5 seconds; however, the percentage of plays on the ball concluding with a single hit was also high and lasted less than 2 seconds (approximately 20% of total actions). This marked shift in the proportion of rapid actions since the introduction of the RPS has subsequently augmented anaerobic-alactic acid energy utilization. On the basis of new rules, and dimensions of court as well as the height of the net, requirements for volleyball players’ are determined.
In light of these findings, it is our intention to provide detailed information about impact of anthropometric characteristics (height and weight) on specific motor abilities of volleyball players (explosive power, change of direction speed, coordination and speed).
Method
Subjects
Twenty one collegiate volleyball players, twelve males (age 19.96 +/- 0.95 years; height 190 +/- 7.27 cm; weight 81.33 +/- 9.60 kg; training experience 6.42 +/- 2.02 years) and nine females (age 19.71 +/- 0.66 years; height 170.56 +/- 6.77 cm; weight 61.00 +/- 5.43 kg; training experience 7.22 +/- 2.49 years), were recruited for this study. The subjects were familiarized with the procedures involved in testing. All subjects received a clear explanation of the study, and written consent for testing was obtained.
Testing procedures
As per the normal testing protocol for this group, the subjects completed their typical practise warm-up prior to testing sessions. In brief, this warm-up included 10 minutes of general activity (light running with change of direction and accelarration), followed by 10 minutes of dynamic activity that increased in speed and intensity (skips, leg swings, arm swings), followed by 3-5 minutes of rest without static stretching, prior to commencing the testing session. Subjects were re-familiarized with the testing protocol.
The subjects performed three trials of each motor test, whilst anthropometric data (body height and body weight) were collected using a single trial. The best trial from the attempts for each motor test, was kept for analysis.
Variables
The sample of measuring instruments consisted out of two predicting variables: body height (BH) and body weight (BW), and nine criteria variables: block jump (BJ), spike jump with three steps approach (SJ), standing broad jump (SBJ), Jelka test (JT), T test (TT), 93639m test, Obstacle course backwards (OCB), arm-plate taping (TAP), and 20m dash (20m). in addition, on the basis of height and weight the body mass index (BMI) was calculated.
Statistical analysis
The data gained were subjected to statistical analysis in the SPSS 15.0 package. Central and dispersion statistics are shown in Table 1 for all variables, and the regression analysis were used to calculate the impact of the body height and body weight on the criteria variables.
Results and Discussion
The descriptive statistics of the student subjects are shown in Table 1. The table shows that the index of nutritional status for volleyball players is within the limits of normal (22.04), so these research subjects belong in the category of average nourished population. The Body mass index values seen in the literature for female volleyball players of different age, nationality and competition level vary between 20.5 kg/m2 and 22.5 kg/m2. The mean value in BMI found in the present study (21.41 kg/m2) is corresponding to

77
values reported in recent investigations (Gualdi-Russo & Zaccagni, 2001; Papadopoulou et al., 2002; Malousaris et al., 2008), mean BMI values 22.1 kg/m2, 20.5 kg/m2, 21.9 kg/m2, respectively. Although the mesomorphy used to be the primary component of competitive female volleyball players somatotype in the last two decades, in the latest studies it appears that the ectomorphy may be taking over at the expense of mesomorphy.
Body height is considered a determinant factor for good performance in volleyball and, together with its relation to body weight, is used as a criterion for the selection of promising volleyball players. The mean value of male and female volleyball players’ height in our study was 170.56 +/- 6.77 cm, with a range from 161 cm to 179 cm; 190.00 +/- 7.27 cm, with a range from 179 cm to 203 cm. When comparing the volleyball players of this study to other male and female volleyball teams, our subjects are inferior with regard to BH (Gualdi-Russo & Zaccagni, 2001; Papadopoulou, Gallos, Paraskevas, Tsapakidou, & Fachantidou, 2002; Malousaris et al., 2008; Sheppard et al., 2008 Carvajal, Betancourt, Leon, Deturnel, Martinez, Echevarria, Castillo, & Serviat, 2012), which can be explained due to comparable level of competition, and selection trough training history. In particular, the BH values of the present study are lower than those investigating others in the literature evaluating competitive female volleyball players. Body height and body weight of male and female volleyball players from National Team of Serbia from London 2012 are (mean value, N=20), 199.75 cm, 84.55 kg; 186.45 cm, 71.95 kg respectively, which is in accordance with demands of contemporary volleyball competition. The obvious differences seen in BH and BW between samples are expected, since the players of Serbian National Team and samples from A1 division (Gualdi-Russo & Zaccagni, 2001; Papadopoulou et al., 2002; Malousaris et al., 2008; Sheppard et al., 2008; Carvajal et al., 2012), go through a stricter selection procedure and may follow more closely professional advice regarding training and diet.
In the research of Rakić (2009), among 8500 subjects of different age groups from Vojvodina, the average body height and weight of 20-year-olds was 181.03 cm and 77.81 kg, respectively, which is an aproximate value of the measured height and weight of our research (after pooling the data), subjects as well. As our subjects belongs to the population of Faculty of Sport and Physical Education students, their results of anthropometric dimensions - body height and weight 180.28 cm, 71.65 kg, are in accordance with the results from same population 180.95 cm, 73.82 kg (2006), 181.26 cm, 74.74 kg (Mihajlović, Petrović & Šolaja, 2011).
On the basis of these results, we can resume, that subjects in our study, by it’s anthropometric characteristics, clearly belongs to the population of college students from Sports Sciences and close to the averaged values on their 20-years-old counterparts.
Table 1. Descriptive statistics of anthropometric characteristics and specific motor abilities for volleyball players (M-Mean, SD-Standard deviation)
Volleyball players (N=22) VARIABLES
M SD MIN MAX Age (decimal years) 19.85 0.83 18.94 21.89 Years of playing 6.76 2.21 3 12 Body height (cm) 181.67 12.03 161 203 Body weight (kg) 72.62 12.99 54 100 Body mass index (kg/m2) 22.04 2.35 18.9 27.4 Block jump (cm) 271.53 19.76 237 311 Spike jump (cm) 287.68 22.74 245 318 Standing broad jump (cm) 234.17 37.14 164 313 Jelka test (0,1s) 35.60 3.79 27.69 41.45 T test (0,1s) 10.36 0.56 8.95 11.91 93639 m (0,1s) 7.79 0.40 7.11 8.52 Obstacle course backwards (0,1s) 10.16 1.71 7.27 14.18 Arm-plate taping (0,1s) 41.21 2.95 34 46 20m dash (0,1s) 3.60 0.30 3.02 4.11
The results of regression analysis, the influence of body height and body weight on specific motor abilities, are shown in Table 2. The system of predicting variables has statistically significant influence on results of motor abilities tests, namely – Block jump (P=0.00), Spike jump (P=0.00), Standing broad jump (P=0.00), Jelka test (P=0.01), and 20 m dash (P=0.00). The coefficient of multiple correlations ih the case of Block jump and Spike jump was R= 0.93 and R=0.86, with 80% and 75% respectively, of common variance between the prediction system and criterion variables. Analysing

78
individual relations of predictors with criterion variable, we can see that only body height have substantial statistical contribution to the significance of the entire system (BJ Beta=0.99, SJ Beta=0.81). The correlation with the criterion variable r=0.93, while its partial correlation was rp=0.84. The body weight variable did not yield a statistically significant effect while the values of correlation and partial correlation were numerically smaller. Vertical jumping ability is, by most of the coaches, considered as the most important physical ability, besides agility and coordination. Vertical jumps (BJ and SJ), are performed frequently by volleyball players during practices and games. In various offensive (attacking, passing, and serving) and defensive (blocking) maneuvers, players are required to jump vertically as high as they are capable of doing. Per set, jumping acts varied according to the players’ position and the type of jump they performed: Setters performed 11-21 jump sets per set, and middle players performed 2-15 spike jumps and 3-19 block jumps. Similar to middle players, outside players performed 1-15 spike jumps and 1-13 block jumps (Sheppard, Gabbett, Kristie-Lee, Dorman, Lebedew & Borgeaurd, 2007). In essence, to achieve high level of proficiency in the game of volleyball, players are required not only to master task-specific techniques and tactics, but also to exhibit good jumping ability in order to gain an advantage over players from the opposing team. Once again, the meaning of body height is emphasised, having in mind significance of the vertical jumping ability and contribution of this anthropometric variable. The taller the player is, the greater chance for succesuful performance in the game of volleyball. However, there are not enough data to support the argument that the higher the players jump, the more wins the team is able to acumulate. Many other factors have the potential to contribute to the success in a volleyball game. In addition, it is possible that once players are able to reach a certain height above the net, additional jumping ability does not improve blocking or spiking performance. In matter of fact, the player don’t need, nor he is unconditional to jump as high as possible in every action and game situation to be successfull in block and jump elements, but for sure, the taller he or she is (the greater the values of BJ and SJ), the more possibilities are to respond adequate.
Based on the results in Table 2, the system of predicting variables has statistically significant influence on expresing explosive leg power (SBJ), change of direction speed (JT) and sprint (20m dash). It can be seen that coefficient of multiple correlations between predictors and SBJ was R=0.70, with 49% of common variance, and with significant contribution of height (Beta= 0.84, p=0.00). The same anthropometric characteristic has statistically significant contribution to variable that represents speed (Beta=-0.79, p=0.01), but in this case the taller the player is the lower the sprint speed was. The system of prediction variables accounts for 54% of common variance with criterion (20m dash), R=0.73. In the variable that represents change of direction speed (JT), system of predicting variables is statistically significant, with common variance of 41% (R=0.64), but neither variable alone (height nor weight), does not contribute statistically significant, which means that different somatotype (or combinations of specific height and weight) does impact this ability. These findings are coresponding with some previous studies (Gualdi-Russo & Zaccagni, 2001; Zary, Reis, Rouboa, Silva, Fernandes & Filho, 2010; Gaurav, Singh, & Singh, 2011; Polluveer, Stamm, & Stamm, 2012).
Table 2. Results of regression analysis of male volleyball players BJ r rp beta p
Body height 0.93 0.84 0.99 0.00 Body weight 0.73 -1.11 -0.07 0.62
R=0.93 R2=0.87 F=58.57 P=0.00 SJ r rp beta p
Body height 0.86 0.68 0.81 0.00 Body weight 0.73 0.73 0.07 0.73
R=0.86 R2=0.75 F=27.02 P=0.00 SBJ r rp beta p
Body height 0.69 0.56 0.84 0.01 Body weight 0.50 -0.15 -0.18 0.54
R=0.70 R2=0.49 F=8.56 P=0.00 JT r rp beta p
Body height -0.63 -0.32 -0.46 0.16 Body weight -0.58 -0.15 -0.21 0.51
R=0.64 R2=0.41 F=6.20 P=0.01

79
Table 2. Results of regression analysis of male volleyball players (CONT) TT r rp beta p
Body height -0.12 -0.18 -0.31 0.45 Body weight -0.02 0.14 0.23 0.56
R=0.18 R2=0.03 F=0.31 P=0.74 93639m r rp beta p
Body height -0.16 -0.32 -0.56 0.17 Body weight 0.03 0.29 0.49 0.22
R=0.32 R2=0.10 F=1.05 P=0.37 OCB r rp beta p
Body height -0.29 -0.08 -0.13 0.75 Body weight -0.31 -0.12 -0.20 0.61
R=0.31 R2=0.10 F=0.99 P=0.39 TAP r rp beta p
Body height 0.12 0.15 0.25 0.54 Body weight 0.04 -0.10 -0.16 0.69
R=0.15 R2=0.02 F=0.21 P=0.81 20m r rp beta p
Body height -0.73 -0.56 -0.79 0.01 Body weight -0.57 0.06 0.07 0.81
R=0.73 R2=0.54 F=10.46 P=0.00
Conclusion
The results of this study clearly demonstrate that system of predicting variables (BH and BW) does impact special motor abilities in volleyball players. Results of some studies in female and male junior and senior volleyball players suggest the longitudinal skeleton dimensionality, coordination, agility and explosive strength of the vertical jump type to have greatest positive impact on volleyball performance. Longitudional skeleton dimensionality enables ball contacts at a greater height above the net, which is of outmost importance in spiking and blocking. However, due to the complexity of these elements, considerable amount of time is needed to master technique and to apply it in situation conditions (at competitions). For these reasons, longitudinal skeleton dimensionality does not entail any significant competition advantage in the players aged 12-13. The more so, in very tall players it may even have unfavorable effect on motor abilities and situation performance because of accelerated growth and development. It is of paramount importance that the coaches be aware of it and to offer adequate opportunities to the very tall players to play, even at at the cost of less successful competition results. It is also important to pay due attention to these players on training sessions. When the longitudinal bone growth has reached the peak, the longitudinal skeleton dimensionality is being integrated into the players’ situation-motor complex. Then the technical-tactical elements perormed above the net (spike and block) become prominent (Grgantov, Katić & Janković, 2006).
Elite volleyball players produce greater vertical jump scores than non-elite and developing players (Fry, Kraemer, Weseman, Contory, Gordon, Hoffman & Maresh, 1991; Smith, Roberts & Watson, 1992; Sheppard, Cronin, Gabbett, McGuigan, Etxebarria, Newton, 2008). Most volleyball coaches would consider vertical jumping ability as the most important physical attribute for volleyball players. As such, a great deal of emphasis has been focused on methods of increasing vertical jump (Newton, Kraemer & Hakkinen, 1999; Maffuletti, Dugnani, Folz, Di Pierno & Mauro, 2002; Newton, Rogers, Volek, Hakkinen & Kraemer, 2006; Marković, 2007), as well as physical factors that contribute to vertical jumping ability specific to volleyball athletes. The ability to evoke higher jump heights, force power and velocity in jump training follows the principles of high quality training, where training variables are manipulated to promote optimal, chronic improvements in performance (Sheppard, Newton & McGuigan, 2007).
Further research is needed regarding position-by-position analysis of anthropometric characteristics within a volleyball team including correlations with players’ physical performance.

80
References
1. Carvajal, W., Betancourt, H., Leon, S., Deturnel, Y., Martinez, M., Echevarria, I., Castillo, M., & Serviat, N. (2012). Kinanthropometric profile of Cuban women Olympic volleyball champions. MEDICC Review, 14(2), 16-22.
2. Ciccarone, G., Croisier, J.L., Fontani, G., Martelli, G., Albert, A., Zhang, L., Cloes, M. (2008). Comparison between player specialization, anthropometric characteristics and jumping ability in top-level volleyball players. Medicina Dello Sport, 61(1), 29-43.
3. Duncan, M.I., Woodfield, L., & al-Nakeeb, I. (2006). Anthropometric and physiological characteristics of junior elite volleyball players. Sports Medicine, 40, 649-651.
4. Fontani, G., Ciccarone, G., & Guilianini, R. (2000). Nuove regole di gioco ed impegno fisico nella pallavolo. SDS – Rivista di Cultura Sportiva, 50, 14-20.
5. Fry, A.C., Kraemer, W.J., Weseman, C.A., Contory, B.P., Gordon, S.E., Hoffman, J. R., & Maresh, C.M. (1991). The Effects of an Off-season Strength and Conditioning Program on Starters and Non-Starters in Women’s Intercollegiate Volleyball. Journal of Applied Sport Science Research, 5, 174-181.
6. Gaurav, V., Singh, M., & Singh, S. (2011). A comparative study of somatic traits and body composition between volleyball players and controls. Indian Journal of science and technology, 4(2), 116-118.
7. Grgantov, Z., Katić, R., & Janković, V. (2006). Morphological characteristics, technical and situation eficacy of young female volleyball players. Collegium Antropologicum, 30(1), 87-96.
8. Gualdi-Russo, E., & Zaccagni, L. (2001). Somatotype, role and performance in elite volleyball players. Journal of Sports Medicine and Physical Fitness, 41(2), 256-262.
9. Lidor, R., & Ziv, G. (2010). Physical and physiological attributes of femalle volleyball players – a review. The Journal of Strength & Conditioning Research, 2(7), 1963-1973.
10. Maffuletti, N.A., Dugnani, S., Folz, M., Di Pierno, E., & Mauro, F. (2002). Effect of combined electrostimulation and plyometric training on vertical jump height. Medicine & Science in Sports & Exercise, 34, 1638-1644.
11. Malousaris, G.G., Bergeles, N.K., Barzouka, K.G., Bayios, I.A., Nassis, G.P., & Koskolou, M.D. (2008). Somatotype, size and body composition of competitive female volleyball players. Journal of Science and Medicine in Sport, 11, 337-344.
12. Marković, G. (2007). Does plyometric training improve vertical jump height? A meta-analytical review. British Journal of Sports Medicine, 41, 349-355.
13. Marković, G., & Jarić, S. (2004). Movement performance and body size: the relationship for different groups of tests. European Journal of Applied Physiology, 92, 139-149.
14. Newton, R.U., Kraemer, W.J., & Hakkinen, K. (1999). Effects of Ballistic Training on Pre-Season Preparation of Elite Volleyball Players. Medicine and Science in Sports and Exercise, 31, 323-330.
15. Newton, R.U., Rogers, R.A., Volek, J.S., Hakkinen, K., & Kraemer, W.J. (2006).Four Weeks of Optimal Load Ballistic Resistance Training at the End of Season Attenuates Declining Jump Performance of Women Volleyball Players, Journal of Strength and Conditioning Research, 20, 955-961.
16. Papadopoulou, S.D., Gallos, G.K., Paraskevas, G., Tsapakidou, A., & Fachantidou, A. (2002). The somatotype of Greek female volleyball athletes. International Journal of Volleyball Research, 5(1), 22-25.
17. Polluveer, K., Stamm, R., & Stamm, M. (2012). Anthropometric and psychophysiological characteristics of top female volleyballers in relation to the players’ position on the court. Papers on Anthropology XXI, 232-245.

81
18. Sheppard, J.M., Cronin, J.B., Gabbett, T.J., McGuigan, M.R., Etxebarria, N., Newton, R.U., (2008). Relative importance of strength, power, and anthropometric measures to jump performance of elite volleyball players. The Journal of Strength and Conditioning Research, 22, 758-765.
19. Sheppard, J.M., Gabbett, T.J., Kristie-Lee, T., Dorman, J., Lebedew, A.J., & Borgeaurd, R. (2007). Development of repeated-effort test for elite men’s volleyball. International Journal of Sports Physiology Performance, 22, 758-765.
20. Sheppard, J.M., Newton, R., & McGiugan, M.R. (2007). The Effect of accentuated eccentric load on jump kinetics in high performance volleyball players. International Journal of Sports Science and Coaching, 2(3), 267-273.
21. Smith, D.J., Roberts, D., & Watson, B. (1992). Physical, Physiological and Performance Differences Between Canadian National Team and Universiade Volleyball Players. Journal of Sports Sciences, 10, 131-138.
22. Stamm, R., Stamm, M., Koskel, S. (2006). Adolescent female voleyballers’ performance (aged 13-15 years) body build classification and proficiency in competitions. Antropologische Anzeiger, 64(4), 423-433.
23. Stamm, R., Veldre, G., Stamm, M., Thomson, K., Kaarma, H., Loko, J., & Koskel, S. (2003). Dependance of young volleyballers’ performance on their body build, physical abilities and psychophysiological properties. Journal of Sports Medicine and Physical Fitness, 43, 1-9.
24. Zaccagni, L., & Gualdi-Russo, E. (1996). Relationship between performance and somatometric traits in elite volleyball players. Cahiers d'anthropologie et biométrie humaine, 14(3-4), 581-591.
25. Zary, J.C., Reis, V.M., Rouboa, A., Silva, A.J., Fernandes, P.R., & Filho, J.F. (2010). The somatotype and dermatoglyphic profiles of adult, junior and juvenile male Brazilian top-level volleyball players. Science & Sports, 25, 146-152.

82

83
ANTHROPOLOGICAL CHARACTERISTICS AND BIOLOGICAL AGE
IN SOCCER PLAYERS
Marko Erceg, Alen Miletić, Ante Raña and Igor Jelaska Faculty of Kinesiology, University of Split, Croatia
Abstract
In order to determine the differences between individual morphological characteristics and motor abilities of 45 U14 soccer players (although all of different biological age), an experiment was conducted with a battery of 10 morphological and 11 motor skills tests. The subjects were divided into two age groups: a younger, pre-U14 age group and the U14 player group. Biological maturity was visually assessed using the maturity stages classification according to the Tanner test. Based on the assessment of biological maturity, the subjects were divided into three groups (pre-puberty, early puberty and mid-puberty). The differences between motor and morphological characteristics of U14 soccer players of different biological age were analyzed using a one-way ANOVA and Fischer LSD post hoc test. Significant differences were found between the subjects of same chronological age, but different biological age, especially in morphology. These results suggest that biological age significantly affects morphological characteristics, which was to be expected considering the age and the sensitive life stage. Maturation has less effect on motor skills because it doesn't depend on biological age as much as it is a result of training and repetition.
Keywords: soccer, morphological characteristics, motor abilities, maturation
Introduction
During a soccer match, soccer players perform a large number of different activities and movements, both with and without the ball, all the while switching between high and low-level intensity activities of undetermined duration and time of occurrence. Because of that, soccer can be described as a complex acyclical interval activity. So, for example, during a soccer match, top soccer players perform, on average, between 1200 and 1400 different changes of activity every 4-6 seconds (Reilly et al., 2000). From the moment they start playing soccer to the time they reach puberty, children undergo balanced growth and development. That period is ideal for acquiring soccer skills, as well as for the development of coordination, speed and balance. In puberty, the child experiences accelerated physical growth and development. The year the child experiences the largest increase in height serves as an indicator of their biological maturity and matches the year the child achieves maximum development of most of its fitness abilities. There is significant variation in the onset of puberty among children of the same chronological age. Therefore, the children who mature earlier (biologically older children) are physically superior to the rest of their peers and have a significantly better chance of being selected for the team. According to a group of authors (Helsen et al, 2005, Vincent and Glamser, 2006), individuals born at the beginning of the year have a better chance at being selected for the team, than those born later that year, because they are physically stronger and more experienced. The authors concluded that relative age has important implications for the selection of younger players. Further on, players of the same chronological age are characterized by individual differences in the stage of maturity, which is connected with the variation in functional capacity of young players and may influence their selection (Malina, Bouchard and Bar-Or, 2004). The result of a wrong selection is the likely loss of a significant number of soccer talents. In order to reduce the influence of biological age on the recognition and selection of talents, it is necessary to direct the efforts of coaches working with lower-age categories towards the building of a player and not towards achieving sports results, systematically evaluate the biological age of children and younger players and make use of fitness tests which are best suited for discerning the successful from the less successful players at a given age. The basic goal of this paper was to determine the differences in morphological features and motor capabilities of U14 players of different biological age.

84
Method
Participant sample
The participant sample comprises 45 young soccer players, members of the “Jozo Matošić” soccer school from Dubrovnik. They train soccer 4 times a week, and once a week they play a competition match. The participant sample is divided into two subsamples: 20 younger U14 players with an average age of 12.3 years and 25 pre-U14 players with an average age of 10.6 years. Biological maturity was estimated visually by classifying sexual maturity phases according to Tanner. Biological maturity was estimated by a pediatrician. The participants were divided into three groups according to their biological age (pre-puberty – corresponding to Tanner I, early puberty – corresponding to Tanner II, and mid-puberty – corresponding to Tanner III).
Variable sample
The variable sample is composed of 10 tests for the evaluation of anthropometric features, 7 tests for the evaluation of gross motor skills, 3 tests for the evaluation of specific motor skills and one test for the evaluation of functional capabilities. Anthropometric features were evaluated using the following tests: body height (HGT-cm), body weight (WGT-kg), chest circumference (CC-cm), upper-arm circumference (UAC-cm), forearm circumference (FAC-cm), calf circumference (CAC-cm), back skinfold thickness (BSFT-mm), abdominal skinfold thickness (ASFT-mm), upper arm skinfold thickness (UASFT-mm) and calf skinfold thickness (CASFT-mm). Gross motor skills were evaluated using the following tests: 10-meter dash (10 m-s), 20-meter dash (20 m-s), 60-meter dash (60 m-s), standing long jump (SLJ-cm), Sargent jump test (SJT-cm), the 9-3-6-3-9 (s) test and the zig zag test (s). Specific motor skills were evaluated using the following tests: 20-meter dash with a ball (20 m B-s), the 9-3-6-3-9 test with a ball (9-3-6-3-9 B-s) and the zig zag test with a ball (zig zag B-s). Functional capabilities were evaluated using a 1500-meter run test (1500 m-s).
Data processing methodology
After the preliminary processing procedure (arithmetic mean, standard deviation, minimum and maximum measurement values and the Kolmogorov-Smirnov data distribution normality test), issues concerning the goals of determining differences between soccer player groups and subsamples were analyzed with the one-way ANOVA technique and the Fischer LSD post hoc test. All analyses were done separately for the two participant age groups, and especially for each of the participant subsamples within the same age group. Statistica for Windows ver. 10.0 was used for data processing.
Results
Table 1 shows differences in morphological variables among soccer players of the same chronological (pre-U14), but of different biological age (pre-puberty, early puberty). It is evident that younger soccer players differ significantly in up to 7 of a total of 10 morphologic variables. They differ the most in body weight, and the least in forearm circumference. Other variables show no statistically significant differences among the observed soccer players.
Table 1. Analysis of differences in morphological variables among pre-U14 soccer players of different biological age (Mean – arithmetical mean, SD – standard deviation, Range – result range)
Pre-puberty (N = 14) Early puberty (N = 11) Variable Mean±SD Range Mean±SD Range WGT 31.86±4.05 27.00-42.00 40.45±5.89*** 33.00-49.00 HGT 140.71±2.95 136.00-145.00 149.82±5.15*** 140.00-160.00 BSFT 10.86±3.35 9.00-22.00 12.09±1.81 10.00-14.00 UASFT 12.79±3.19 10.00-22.00 16.00±3.58* 11.00-20.00 CASFT 15.29±2.67 13.00-22.00 17.09±2.30 14.00-20.00 ASFT 11.43±4.36 8.00-26.00 13.73±2.72 10.00-20.00 CC 64.71±3.20 61.00-73.00 68.82±3.76** 63.00-75.00 UAC 19.36±1.69 17.00-23.00 21.18±2.27* 17.00-25.00 FAC 18.50±1.34 17.00-21.00 20.18±2.09* 17.00-24.00 CAC 28.43±1.60 27.00-32.00 30.64±2.69* 26.00-34.00
*p<0.05; **p<0.01; ***p<0.001 – the significance of the differences among soccer players of different biological age

85
Table 2 shows the analysis of the differences among pre-U14 soccer players (divided into two biological age groups – pre-puberty and early puberty). It is evident that there are no statistically significant differences in motor skills between the observed soccer players of different biological age.
Table 2. Analysis of differences in motor skill variables among pre-U14 players of different biological age (Mean – arithmetic mean, SD – standard deviation, Range – result range)
Pre-puberty (N = 14) Early puberty (N = 11) Variables Mean±SD Range Mean±SD Range 10 m 2.46±0.23 2.20-2.80 2.46±0.14 2.30-2.70 1500 m 468.00±41.22 410.00-536.00 480.00±39.39 433.00-540.00 20 m 4.11±0.21 3.70-4.22 4.22±0.20 3.80-4.50 20 m F 5.01±0.55 4.20-4.93 4.93±0.33 4.50-5.60 60 m 11.24±0.66 10.20-11.63 11.63±0.72 10.30-12.40 9-3-6-3-9 10.77±0.51 9.80-11.40 11.04±0.36 10.50-11.50 9-3-6-3-9 F 13.96±1.11 11.70-15.60 14.06±0.81 12.50-15.20 SLJ 161.93±14.23 144.00-183.00 162.27±10.05 141.00-177.00 SJT 28.29±6.56 21.00-45.00 28.27±3.13 24.00-32.00 ZIG ZAG F 11.82±1.09 9.90-13.90 11.77±1.09 10.40-14.30 ZIG ZAG 8.26±0.43 7.40-9.00 8.33±0.30 7.80-8.80
*p<0.05; **p<0.01; ***p<0.001 – the significance of the differences among soccer players of different biological age
Table 3 shows results of the analysis of differences in morphological variables among soccer players of the same chronological but different biological age. It is evident that the biggest differences are found among younger U14 soccer players in pre-puberty and mid-puberty (in up to 6 out of 10 motor skill variables, with the most in weight, followed by height). The significance of differences among pre-U14 soccer players in pre-puberty and early puberty is evident in weight and chest circumference, while younger U14 soccer players in early puberty and mid-puberty differ significantly only in height.
Table 3. Analysis of differences in morphological variables among younger U14 players of different biological age (Mean – arithmetic mean, SD – standard deviation, Range – result range)
Pre-puberty (N = 7) Early puberty (N = 6) Mid-puberty (N = 7)
Variables Mean±SD Range Mean±SD Range Mean±SD Range WGT 39.33±7.89† 27.00-50.00 49.50±17.68* 37.00-62.00 52.86±8.19 43.00-66.00 HGT 150.67±8.02† 135.00-158.00 148.50±0.71 148.00-149.00 158.86±6.23¹ 151.00-168.00 BSFT 13.50±3.56 10.00-20.00 16.00±7.07 11.00-21.00 15.14±2.48 12.00-18.00 UASFT 16.17±3.66 10.00-20.00 18.00±8.49 12.00-24.00 19.14±1.68 17.00-22.00 CASFT 16.50±2.51 13.00-19.00 19.50±3.54 17.00-22.00 18.00±1.91 15.00-21.00 ASFT 14.50±3.73 10.00-21.00 16.50±6.36 12.00-21.00 15.71±2.29 13.00-19.00 CC 71.33±3.61† 67.00-76.00 80.50±12.02* 72.00-89.00 79.57±6.05 71.00-89.00 UAC 22.00±1.79† 19.00-24.00 24.00±5.66 20.00-28.00 25.57±2.30 22.00-29.00 FAC 21.50±1.38† 20.00-23.00 22.00±4.24 19.00-25.00 24.43±2.37 21.00-28.00 CAC 30.50±0.84† 30.00-32.00 34.00±7.07 29.00-39.00 34.57±2.07 33.00-38.00
*p<0.05 – the significance of the differences among soccer players in pre-puberty and early puberty; ¹p<0.05 – the significance of the differences among soccer players in early puberty and mid-puberty; †p<0.05 – the significance of the differences among soccer players in pre-puberty and mid-puberty
Table 4 shows results of the analysis of differences in motor skill variables among soccer players of the same chronological but different biological age. It is evident that younger U14 players in early and mid-puberty do not significantly statistically differ in any of the 11 motor skill variables. The significance of differences between pre-U14 soccer players in pre-puberty and early puberty are evident in the standing long jump variable, while younger U14 soccer players in pre-puberty and mid-puberty significantly differ also only in the standing long jump.

86
Table 4. Analysis of the differences in motor skill variables among younger U14 players of different biological age (Mean – arithmetic mean, SD – standard deviation, Range – result range)
Pre-puberty (N = 7) Early puberty (N = 6) Mid-puberty (N = 7)
Variables Mean±SD Range Mean±SD Range Mean±SD Range 10 m 2.35±0.21 2.20-2.50 2.25±0.18 2.10-2.60 2.27±0.18 2.00-2.50 1500 m 478.50±17.68 466.00-491.00 458.33±41.75 407.00-525.00 455.43±44. 380.00-515.00 20 m 4.05±0.21 3.90-4.20 3.98±0.26 3.60-4.20 3.89±0.18 3.60-4.10 20 m F 4.70±0.28 4.50-4.90 4.33±0.34 4.00-4.80 4.51±0.27 4.10-4.90 60 m 10.15±0.64 9.70-10.60 10.68±0.38 10.30-11.30 12.03±2.75 10.60-18.20 9-3-6-3-9 11.30±0.42 11.00-11.60 10.42±0.78 9.50-11.70 10.56±0.75 9.50-11.40 9-3-6-3-9 F 13.25±0.07 13.20-13.30 13.72±1.81 12.20-17.00 13.77±2.16 11.80-18.40 SLJ 155.50±12.02† 147.00-164.00 179.50±9.59* 171.00-195.00 180.00±19.07 165.00-208.00 SJT 28.50±0.71 28.00-29.00 33.33±4.08 29.00-40.00 30.00±7.02 22.00-42.00 ZIG ZAG F 11.65±1.06 10.90-12.40 11.05±1.53 9.80-13.50 11.23±1.27 10.30-14.00 ZIG ZAG 7.95±0.07 7.90-8.00 7.78±0.35 7.20-8.10 7.81±0.45 7.20-8.50
*p<0.05 – the significance of the differences among soccer players in pre-puberty and early puberty; ¹p<0.05 – the significance of the differences among soccer players in early puberty and mid-puberty; †p<0.05 – the significance of the differences among soccer players in pre-puberty and mid-puberty
Discussion
In general, the average height and weight values of pre-U14 and younger U14 soccer players are within reference limits for their age. However, at a closer glance, the average height and weight values of pre-U14 soccer players in pre-puberty (Tanner I) are significantly higher compared to American reference values (Centers for Disease Control and Prevention, 2000), and are above the 75th percentile line compared to the results of studies done hitherto. The average height and weight of younger U14 soccer players in mid-puberty (Tanner III) are also greater than the American reference values and are over the 75th percentile line (Centers for Disease Control and Prevention, 2000). According to the observation of soccer players in this research, it can be concluded that pre-U14 soccer players in pre-puberty and younger U14 soccer players in mid-puberty “stand out” from the above-mentioned reference values. The reasons for that lie in the fact that there are a considerable number of children who are maturing earlier among the observed soccer players. The analysis of differences in morphological variables among the pre-U14 soccer players of the same chronological but different biological age (pre-puberty, early puberty) showed that soccer players in early puberty have numerically higher values in all parameters compared to soccer players in pre-puberty, which is in line with the results of previous research (Figueredo et al., 2009). These differences are statistically significant in 7 out of a total of 10 morphological variables. Similarly, younger U14 soccer players in mid-puberty (Tanner III) have numerically higher values of measured morphological variables compared to soccer players of the same age group in pre-puberty and early puberty, and similar results were obtained in the study by Figueiredo et al. 2010, and by Malina et al. 2012. Children, and also soccer players, grow continuously until adulthood. However, the growth rate is not always the same. It varies, depending on the level of maturity. After the first 4-6 years of life, the average annual growth stabilizes around 5-7 cm. This period lasts until the onset of puberty. Along with a relatively stable growth, the period between six and roughly twelve years is also characterized by proportional body dimensions and an accelerated development of the nervous system. This period is therefore ideal for learning and perfecting various soccer skills. Onset of puberty is marked by a significantly accelerated growth of body dimensions. The increase of body dimensions is a result, among other things, of bone growth, which can explain the resulting differences. The analysis of differences in motor skill variables shows that there are significant differences among soccer players of the same chronological but different biological age only in subsamples of younger U14 players in the variable used to estimate explosiveness (standing long jump). It is evident that soccer players in early and mid-puberty are significantly better in manifesting explosiveness in comparison to soccer players in pre-puberty, and a 2012 study conducted by Vandendriessche et al. found similar results. During puberty, there are significant changes in body composition, especially in muscle mass and the amount of body fat. The onset of puberty is marked by a significant increase in the secretion of the sex hormone testosterone which stimulates muscle mass development. Rougly at the age of 12 (which corresponds to the age of younger

87
U14 soccer players) there is exponential growth of muscle mass and decrease in body fat percentage (Marković and Bradić, 2008). The above stated fact corroborates the results. It is well known that speed as a motor skill is composed of more than one relatively independent component. In soccer, however, speed is mostly observed as fast running – sprint speed. Observed thusly, speed has an identical development curve as the speed of movement direction change, or rather agility. The greatest increase in sprint speed and agility is achieved between year 5 and 9. It is assumed that these changes are largely connected with the increase in the frequency of movements. After that, both abilities develop at a somewhat slower pace until about 13-14 years of age. The achieved results were expected, and were similar to the results of former studies (Malina et al., 2000). The changes in body size, composition and functional capacity occur and increase through puberty and maturation (Malina, Bouchard and Bar-Or, 2004). The growth and maturation of young soccer players can influence the selection process. The evaluation of the biological age, or rather the maturity of young soccer players is important to us so that we can determine for each player whether he matures ahead of time, in time or with a delay. That way we can avoid “discarding” talents that mature later. Based on the evaluation of biological maturity, the coach can determine the maturation pace of each player. This information makes it significantly easier to interpret the differences in body build and the level of fitness abilities among peers in a team. What this means, is that the coach can now evaluate whether the physical superiority or inferiority of some players in relation to their peers is an indicator of their potential (talent) or a result of earlier or delayed maturation.
References
1. Malina, R.M., Bouchard, C., & Bar-Or, O. (2004). Growth, Maturation and Physical Activity. (2nd edition). Champaign, IL: Human Kinetics.
2. Malina, R.M., Peña Reyes, M.E., Eisenmann, J.C., Horta, L., Rodrigues, J., & Miller, R. (2000). Height, mass and skeletal maturity of elite Portuguese soccer players aged 11-16 years. Journal of Sports Science, 18(9), 685-93.
3. Malina, R.M., Coelho, E., Silva, M.J., Figueiredo, A.J., Carling, C., & Beunen, G.P. (2012). Interrelationships among invasive and non-invasive indicators of biological maturation in adolescent male soccer players. Journal of Sport Science, 30(15), 705-17.
4. Figueredo, A.J., .Goncalves, C.E., Coelho, E., Silva, M.J., & Malina, R.M. (2009). Youth soccer players, 11-14 years: maturity, size, function, skill and goal orientation. Annals of Human Biology, 36(1), 60-70.
5. Figueiredo, A.J., Coelho, E., Silva, M.J., Cumming, S.P., & Malina, R.M. (2010). Size and maturity mismatch in youth soccer players 11- to 14-years-old. Pediatric Exercise Science, 22(4), 596-612.
6. Marković, G., & Bradić, A. (2008). Nogomet-Integralni kondicijski trening. Udruga „Tjelesno vježbanje i zdravlje“.
7. Centers for Disease Control and Prevention (2000). National Center for Health Statistics CDC Growth Charts: United States.
8. Reilly, T., Williams, A.M., Nevill, A., & Franks, A., (2000). A multidisciplinary approach to talent identification in soccer. Journal of Sports Sciences, 18, 695–702.
9. Vincent, J., & Glamser, F.D., (2006). Gender differences in the relative age effect among US Olympic development program youth soccer players. Journal of Sports Sciences, 24, 405–13.
10. Helsen, W.F., Van Winckel, J., & Williams, A.M. (2005). The relative age effect in youth soccer across Europe. Journal of Sports Sciences, 23, 629–36.
11. Vandendriessche, J.B., Vaeyens, R., Vandorpe, B., Lenoir, M., Lefevre, J., & Philippaerts, R.M. (2012). Biological maturation, morphology, fitness, and motor coordination as part of a selection strategy in the search for international youth soccer players (age 15-16 years). Journal of Sports Sciences, 30(15), 1695-703.

88

89
RELATIONS BETWEEN BASIC AND FOOTBALL SPECIFIC MOTOR
ABILITIES AMONG FIRST LEAGUE FEMALE FOOTBALL PLAYERS
Petra Mandić Jelaska1, 2, Franjo Lovrić1, 3 and Luka Bjelanović1, 4 1 Ph.D. Student of Kinesiology, University of Split, Croatia
2 Fitness Club “Pink Panther”, Kaštel Stari, Croatia 3 Faculty of Natural Sciences and Mathematics, Mostar, Bosnia and Herzegovina
4 Rugby Club “Nada”, Split, Croatia
Abstract
The aim of this study was to determine relations between basic and football specific motor abilities among first league female football players. According to the goal of the research, a sample consisted of 70 Croatian first league female football players (21.7±1.3 yr) was used. Participants were measured in 11 basic motor abilities tests and a set of 7 tests for assessing football-specific motor abilities. Football-specific motor abilities were defined by a set of seven tests that have been shown to describe a football game in the context of five existing latent dimensions: precision of target shooting with the ball, ball handling, speed of ball handling, force of a leg kick, and speed of curvilinear running. By use of canonical correlation analysis, insight into the intensity (CanR=0.96, p=0.00) and structure of relations between basic motor and football specific motor variables was given. Results clearly indicate strong connections between basic and football-specific motor abilities in female football players of high competitive level and point to the necessity of parallel basic and specific motor abilities development among elite female football players.
Keywords: football specific motor tests, basic motor tests, canonical correlation, first league female football players
Introduction
Recent scientific researches clearly indicate that elite football requires strong and endurable athletes with exceptional motor and functional abilities, and a strong sense of improvisation and cooperation (Rhodes & Mosher, 1992; Krustrup et al., 2005; Mohr, Krustrup & Bangsbo, 2003, 2005; Andersson, 2010; Erceg, 2012). It is certain that, regardless of the gender, a set of biomotor characteristics and specific player's abilities to control the system and concept of the game, to control the pace and rhythm of the game as well as one’s own bioenergetic capacity and functional status during the game, is responsible for success in football (Gabrijelić et al., 1982; Bangsbo, Norregaard & Thorsoe, 1991; Andersson, 2010; Mandić Jelaska, Fiorentini & Bašić, 2011). Results of various researches of the most important factors responsible for success in football are not completely consistent, but it can be concluded that the most important factors are the functional and motor abilities: speed, explosive power, coordination, agility, precision and flexibility (Reilly, Bangsbo & Franks, 2000; Helgerud et al., 2001; Polman, et al., 2004; Mujika et al., 2009). It is doubtless that quality female football players must have adequately high levels of football-specific motor abilities which are manifested as performance skills of characteristic football elements (Mohr et al., 2007, 2008). Same authors state that motor knowledge, except the direct impact on the performance quality of specific motor tasks, indirectly affects the dimensions of anthropological status. Structure of morphological and motor characteristics of first league female football players and their impact on the estimated quality of the players was determined by authors (Mandić Jelaska, Katić & Jelaska, 2013) By use of factor analysis of 18 used morphological tests, existence of 3 significant latent dimensions that explain 64% of the total variability was shown. Factors were defined as transverse dimensionality of the skeleton and voluminosity, subcutaneous fat tissue and longitudinal dimensionality of the skeleton. In the area of basic motor abilities 4 factors were extracted: factor of movement regulation (agility/lower body explosiveness), muscle tone regulation factor, frequency of leg movement

90
factor, and factor responsible for the manifestation of basic strength, particularly of basic core strength. Two factors were isolated of football-specific motor abilities: football-specific efficiency and situational football coordination. Furthermore, two higher order factors, named morphological-motor factor and football-specific motor abilities factor were extracted. It is assumed that two extracted higher-order factors fully describe morphological and motor status of first league female football players. Finally, the linear regression results in latent space showed that the identified factors are very good predictors of female football players quality.
Studies indicate that football training and football-specific motor tests should be made as close as possible to situational reality (Mandić Jelaska, Miletić i Jelaska, 2012). This is very important mostly because it is often the case that players with excellent results in the tests of basic motor abilities do not manifest those abilities in situational conditions adequately. It should be underlined that there are very few scientific studies of relations between motor and football-specific motor abilities (Can, Yilmaz & Erden, 2004) of first league female football players, and that fact gives this research additional importance.
Method
Sample consisted of 70 Croatian first league female football players of average age 21.7 ± 1.3 years. All participants were examined in the same way, by the same officials. Athletes who had recently suffered from a serious injury were not included in this study.
Eleven tests of motor abilities were used for assessing basic motor status: standing long jump for assessing explosive power of horizontal jumping type, 20 meter sprint for assessing sprinting explosive power, throwing a 2 kg medicine ball from supine position for assessing throwing explosive power, arm plate tapping and foot tapping for assessing movement frequency, side steps for assessing movement agility, bent arm hang for assessing static strength, sit-ups for assessing repetitive strength, obstacle course backwards for assessing coordination, seated straddle stretch to assess flexibility and one leg standing for assessing coordination.
Football-specific motor abilities were defined by a set of seven tests that have been shown to describe a football game in the context of five existing latent dimensions: precision of target shooting with the ball, ball handling, speed of ball handling, force of a leg kick, and speed of curvilinear running3. Tests were selected due to greatest correlation with the extracted latent dimensions: precision of shooting the target with a leg ball kick, precision of shooting the target with a leg head kick, distance achieved by a leg kick, distance achieved by a head kick, running with a ball at right angles, hitting the wall with the ball and 20m sprint with the ball. It should be noted that the test were minimally modified due to their application to the population of female football players. Detailed description of all used football specific test can be found in (Mandić Jelaska, Katić & Jelaska, 2013). All measurements were performed 3 times.
Data analysis methods involved calculating descriptive statistical parameters: arithmetic mean (AM), standard deviation (SD), minimum (Min) and maximum (Max) result, skewness coefficient (Skew), kurtosis coefficient (Kurt) and empirical significance of Kolmogorov-Smirnov test. In order to analyze the structure of relations between basic and football-specific motor abilities canonical correlation analysis was applied.

91
Results
Table 1 shows the descriptive statistical parameters of basic motor variables for all members of used sample of female football players.
Table 1. Descriptive statistics of basic motor abilities (AM – arithmetic mean, SD – standard deviation, Min – minimal result, Max – maximal result, KS – significance of Kolmogorov-Smirnov test, Skew – coefficient of asymmetry, Kurt – coefficient of kurtosis)
Variable AM SD Min Max KS Skew Kurt
Standing long jump (cm) 1.89 0.16 1.58 2.30 p>.20 0.07 -0.35 Arm plate tapping (freq) 41.09 5.55 27.00 52.00 p>.20 -0.22 -0.09 20 m sprint (s)# 3.68 0.44 3.00 5.30 p<.10 1.39 3.26
Side steps (s)# 10.53 0.96 8.50 13.00 p>.20 -0.06 -0.31
Bent arm hang (s) 31.20 19.03 1.10 75.25 p>.20 0.30 -0.81
60 seconds sit-ups (freq) 51.74 9.57 23.00 68.00 p<.10 -0.68 -0.09 Obstacle course backwards (s)# 12.00 2.61 7.80 21.19 p<.15 1.44 3.04
Seated straddle stretch (cm) 75.34 11.78 48.00 98.00 p>.20 -0.21 -0.53
Foot tapping (freq) 23.70 1.94 18.00 27.00 p>.20 -0.73 0.25 One leg standing (s) 32.74 23.42 4.67 120.06 p>.20 1.64 3.39 Throwing a 2kg medicine ball (m) 6.24 0.87 4.11 7.90 p>.20 -0.34 -0.30
#variable with opposite metric orientation
In Table 2, descriptive statistic parameters of football-specific motor variables are presented. It can be seen that all variables are normally distributed, except hitting the wall with the ball (p<0.05), and have satisfactory value of means and relatively small standard deviations. It should be noted that authors did not find studies of motor status of female football players which have used this set of football-specific variables.
Table 2. Descriptive statistics of football-specific abilities (AM– arithmetic mean, SD – standard deviation, Min – minimal result, Max – maximal result, KS – significance of Kolmogorov-Smirnov test, Skew – coefficient of asymmetry, Kurt – coefficient of kurtosis)
Variable AM SD Min Max KS Skew Kurt
Precision of shooting the target with a leg kick (score)
8.53 3.95 1.00 15.00 p<.10 0.07 -1.17
Precision of shooting the target with a head kick (score)
8.24 3.88 2.00 15.00 p<.15 0.17 -1.27
Distance achieved by a leg kick (m) 39.39 11.38 22.00 58.00 p>.20 0.11 -1.21 Distance achieved by a head kick (m) 6.88 1.42 4.15 10.55 p>.20 0.20 0.12 Running with a ball at right angles (s)# 10.09 1.40 8.00 12.90 p>.20 0.31 -0.96
Hitting the wall with the ball (freq) 19.47 5.42 8.00 35.00 p<.05 0.46 0.27 20m sprint with the ball (s) # 4.11 0.54 3.10 5.60 p>.20 0.49 -0.07
#variable with opposite metric orientation
Furthermore, in table 3 results of canonical correlations significance testing are presented. In table 4, correlations of observed variables with extracted pairs of factors are given.
Table 3. Results of canonical correlations significance testing with successive roots removed (CanR – coefficient of canonical correlation, CanR2 - coefficient of canonical determination, Chi-Sqr – value of χ2 test, df – number of degrees of freedom, p – level of significance)
Roots removed CanR CanR2 Chi-Sqr df p
0 0.96 0.93 236.64 77 0.00 1 0.60 0.36 81.03 60 0.04

92
Table 4. Factor structures of basic motor and football specific variables (Root1, Root 2 – correlations of first/second canonical pair with measured motor variables)
Variable Root1 Root2 Variable Root1 Root2
Standing long jump 0.99 0.02 Precision of shooting the target
with a leg kick 0.99 0.11
Arm plate tapping 0.34 0.18 Precision of shooting the target
with a head kick 0.85 0.26
20 m sprint -0.40 0.18 Distance achieved by a leg kick 0.99 0.06
Side steps -0.97 -0.11 Distance achieved by a head kick 0.38 0.54
Bent arm hang 0.28 0.19 Running with a ball at right
angles -0.93 0.08
60 seconds sit-ups 0.20 0.13 Hitting the wall with the ball 0.37 0.35 Obstacle course backwards -0.35 0.05 20m sprint with the ball -0.43 -0.06
Seated straddle stretch 0.07 0.59
Foot tapping 0.43 0.57 One leg standing 0.17 0.17 Throwing a 2kg medicine ball
0.12 0.52
Discussion
It can be seen that all measured variables of basic motor abilities are normally distributed (table 1) and consequently that the observed variables are suitable for further parametric multivariate analysis. It is important to emphasize that from an insight into the researches it can be seen that there is lack of research on first league female football players who used the same set of basic and specific motor variables (table 2) therefore, calculated values that can be taken as referent ones. Results (table 3) indicate that only first two canonical pairs are significant with very high values of canonical correlation (0.96) and canonical determination (0.93). First factor of basic motor abilities test is highly determined with standing long jumps and side steps while first factor of football specific variables is highly correlated with precision variables, leg kick distance and running with a ball at right angles (Table 4). Consequently, first canonical pair points to the high dependence of fundamental football specific variables with explosive power and coordination. Second extracted canonical pair gives insight into very complex relations between muscle tone regulation and distance obtained by head kick.
Results of canonical correlation analysis clearly indicate very high level of connection between basic and specific motor abilities. Due to examinees sample used in this research, obtained results provide insight into the intensity and structure of relations between basic motor and specific motor variables of first league female football players in general. Results primarily stand out because of their possible applicability in planning and programming, as well as in longitudinal follow up and evaluation of progress in the context of sport-specific treatments in the population of first league female football players.
In future research, it would be of significant importance to further analyze playing position related differences of basic and specific motor abilities among elite female football players.
References
1. Andersson, H. (2010). The physiological impact of soccer on elite female players and the effects of active recovery training. Örebro University: Heinz Merten.
2. Andersson, H., Randers, M., Heiner-Møller, A., Krustrup, P., & Mohr, M. (2010). Elite female soccer players perform more high-intensity running when playing in international games compared to domestic league games. Journal of Strength and Conditioning Research, 24, 912-919.
3. Bangsbo, J., Norregaard, L., & Thorsoe, F. (1991). Activity profile of competition soccer. Canadian Journal of Sports Sciences, 16,110-116.

93
4. Can, F., Yilmaz, I., & Erden, Z. (2004). Morphological characteristics and performance variables of women soccer players. Journal of Strength and Conditioning Research, 18(3), 480–485.
5. Erceg, M. (2011). Funkcionalne osobitosti nogometaša različitih dobnih skupina. Doktorska disertacija. Split : Kineziološki fakultet.
6. Gabrijelić, M., Jerković, S., Aubrecht, V., & Elsner, B. (1982). Analiza pouzdanosti i valjanosti situaciono-motoričkih testova u nogometu, Kineziologija, 14(5), 149-160.
7. Helgerud, J., Engen, L.C., Wisloff, U., & Hoff, J. (2001). Aerobic endurance training improves soccer performance. Medicine and Science in Sports and Exercise, 33, 1925-1931.
8. Krustrup, P., Mohr, M., Ellingsgaard, H., & Bangsbo, J. (2005). Physical demands during an elite female soccer game: importance of training status. Medicine and Science in Sports and Exercise, 37, 1242-1248.
9. Mandić-Jelaska, P., Fiorentini, F., & Bašić, D. (2011). Doping, nutrition and championship ranking correlation in the Croatian female soccer. In: Proceedings Book of 6th International Scientific Conference on Kinesiology, Integrative Power Of Kinesiology. Opatija: Faculty of Kinesiology, 115-120.
10. Mandić Jelaska, P., Miletić, ð. i Jelaska, I. (2012). Objektivna procjena nogometnih znanja u nastavi tjelesne i zdravstvene kulture. 21. ljetna škola kineziologa Hrvatske - Intenzifikacija procesa vježbanja u područjima edukacije, sporta, sportske rekreacije i kineziterapije. Zagreb: Tiskara Zelina, 207-212.
11. Mandić Jelaska, P., Katić, R., & Jelaska, I. (2013). Morphological and motor characteristics of Croatian first league female football players, Collegium Antropologicum, Ahead of print.
12. Mohr, M., Krustrup, P., & Bangsbo, J. (2003). Match performance of high-standard soccer players with special reference to development of fatigue. Journal of Sport Sciences, 21, 439-449,
13. Mohr, M., Krustrup, P., & Bangsbo, J. (2005). Fatigue in soccer: A brief review. Journal of Sport Scences, 23, 593-599.
14. Mohr, M., Krustrup, P., Kirkendall, D., & Bangsbo, J. (2007) Differences in physical match performance at two levels in female soccer. Journal of Sports Science and Medicine, 6(10).
15. Mohr, M., Krustrup, P., Andersson, H., Kirkendal, D., & Bangsbo, J. (2008). Match activities of elite women soccer players at different performance levels. Journal of Strength and Conditioning Research, 22, 341-349.
16. Mujika, I., Santisteban, J., Impellizzeri, F.M., & Castagna, C. (2009). Fitness determinants of success in men's and women's football. Journal of Sports Sciences, 27(2), 107-14.
17. Polman, R., Walsh, D., Bloomfield, J., & Nesti, M. (2004). Effective conditioning of female soccer players. Journal of Sports Sciences, 22, 191-203.
18. Reilly, T., Bangsbo, J., & Franks, A. (2000). Anthropometric and physiological predispositions for elite soccer. Journal of Sports Sciences, 18, 669—83.
19. Rhodes, E., & Mosher, R. (1992). Aerobic and anaerobic characteristics of elite female university players. Journal of Sports Sciences, 10, 143-144.

94

95
DIFFERENCES IN PLAYING REVERSAL BALLS ON MATCHES OF
ТHE FINALISTS ON THE FOOTBALL WORLD CHAMPIONSHIP
2010
Nebojša ðošić
College of Vocational Studies, Subotica, Serbia
Abstract
The reversal ball is one of technical and tactical element which is performed in the attack phase of football game in all three zones of the field. The work represents an attempt of deeper understanding the structure of competitive activity in football game, what can have practical value in efficient programming in the preparation of football players. In the work are evidenced frequency of playing reversal balls per 7 games ( total of 14 ) played by the Representation of Spain and the Netherlands on this Championship. Here were represented the results related to playing of reversal balls with one touch i.e. „playing from the first“. In the processing of the data collected is applied the statistical software SPSS 15. For comparison of the evidenced frequencies received by observation of the matches of the two Representations recorded on DVD is applied the nonparametric Man Witni U test technique. On 14 observed games were in total observed 693 played reversal balls with one touch. Of this number the Representation of Spain played 398, and the Representation of the Netherlands 295. From six observed variables statistically significant differences were observed by two variables. And that when were played reversal balls with one touch to the same player from which the ball is received , and that in the zone of attack organization. Z value is – 1.994, and the significance level 0,046. The second variable by which is determined statistically significant difference is by playing of reversal balls with one touch to the same player from which the ball is received and that in the zone of final attack.
Keywords: reversal ball, FIFA World Cup 2010, the zone field
Introduction
The reversal ball is one of technical and tactical element which is performed in the attack phase of football game in all three zones of the field. As reversal ball are evidenced all balls that ranged in the opposite direction in relation to the opponent's goal, respectively the balls directed towards goals of the attacking team. In the literature and on Internet site dedicated to football topics can be fined also others names such as reverse pass or backward pass.
The work represents the attempt of deeper introduction of the structure of the competitive activity of football game, what can have a practical value for efficacious programming football player preparation. During a game players perform about 1100 different activities as : transition from standing in jogging , ball passing, changing of directions, jump , etc. ( Milanović, 2007 ) . In the work are evidenced frequency of playing reversal balls per 7 games ( total of 14 ) played by the Representation of Spain and the Netherlands on this Championship.
As on the occasion of different ways of playing the ball and the reversal ball can beplayed with one touch so-called ’’playing from the first ball ’’ , with two, three, four and more ball touches.
In the work are represented the results which are related to playing reversall balls ’’ from the first ball ’’. The usual field division in three zones is used : defense zone, organized attack zone and final attack zone. Average hit of the Barcelona football player Messi on the observed games of the Champions League in the season 2008/2009 was 3.10 per ball possession (ðošić, 2010). The reversal ball is played to the football player from which is the ball received or to third player in the imaginary triangle which
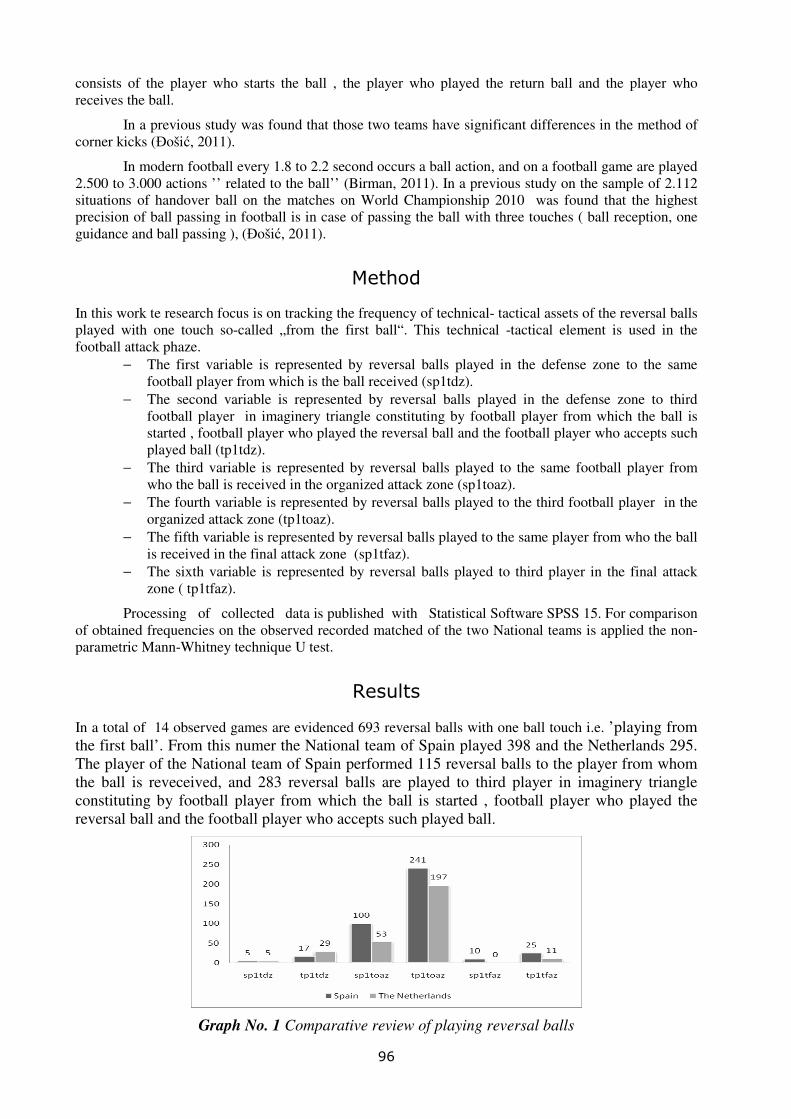
96
consists of the player who starts the ball , the player who played the return ball and the player who receives the ball.
In a previous study was found that those two teams have significant differences in the method of corner kicks (ðošić, 2011).
In modern football every 1.8 to 2.2 second occurs a ball action, and on a football game are played 2.500 to 3.000 actions ’’ related to the ball’’ (Birman, 2011). In a previous study on the sample of 2.112 situations of handover ball on the matches on World Championship 2010 was found that the highest precision of ball passing in football is in case of passing the ball with three touches ( ball reception, one guidance and ball passing ), (ðošić, 2011).
Method
In this work te research focus is on tracking the frequency of technical- tactical assets of the reversal balls played with one touch so-called „from the first ball“. This technical -tactical element is used in the football attack phaze.
− The first variable is represented by reversal balls played in the defense zone to the same football player from which is the ball received (sp1tdz).
− The second variable is represented by reversal balls played in the defense zone to third football player in imaginery triangle constituting by football player from which the ball is started , football player who played the reversal ball and the football player who accepts such played ball (tp1tdz).
− The third variable is represented by reversal balls played to the same football player from who the ball is received in the organized attack zone (sp1toaz).
− The fourth variable is represented by reversal balls played to the third football player in the organized attack zone (tp1toaz).
− The fifth variable is represented by reversal balls played to the same player from who the ball is received in the final attack zone (sp1tfaz).
− The sixth variable is represented by reversal balls played to third player in the final attack zone ( tp1tfaz).
Processing of collected data is published with Statistical Software SPSS 15. For comparison of obtained frequencies on the observed recorded matched of the two National teams is applied the non-parametric Mann-Whitney technique U test.
Results
In a total of 14 observed games are evidenced 693 reversal balls with one ball touch i.e. ’playing from the first ball’. From this numer the National team of Spain played 398 and the Netherlands 295. The player of the National team of Spain performed 115 reversal balls to the player from whom the ball is reveceived, and 283 reversal balls are played to third player in imaginery triangle constituting by football player from which the ball is started , football player who played the reversal ball and the football player who accepts such played ball.
Graph No. 1 Comparative review of playing reversal balls
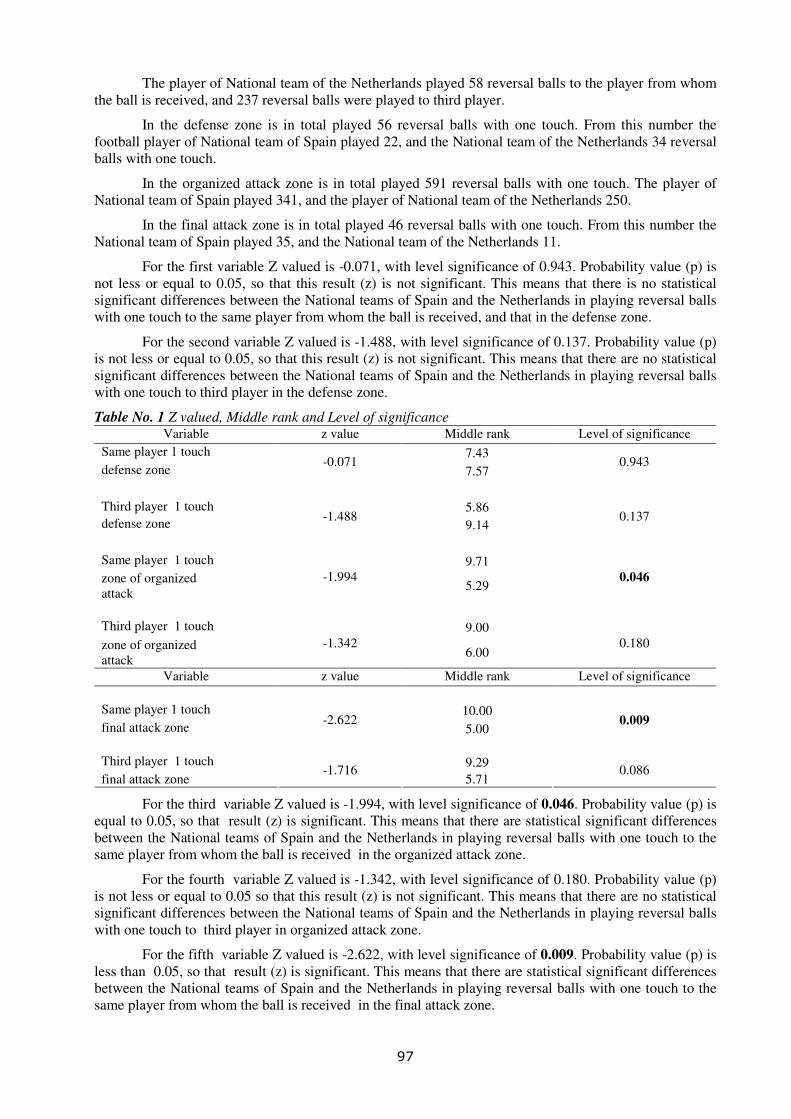
97
The player of National team of the Netherlands played 58 reversal balls to the player from whom the ball is received, and 237 reversal balls were played to third player.
In the defense zone is in total played 56 reversal balls with one touch. From this number the football player of National team of Spain played 22, and the National team of the Netherlands 34 reversal balls with one touch.
In the organized attack zone is in total played 591 reversal balls with one touch. The player of National team of Spain played 341, and the player of National team of the Netherlands 250.
In the final attack zone is in total played 46 reversal balls with one touch. From this number the National team of Spain played 35, and the National team of the Netherlands 11.
For the first variable Z valued is -0.071, with level significance of 0.943. Probability value (p) is not less or equal to 0.05, so that this result (z) is not significant. This means that there is no statistical significant differences between the National teams of Spain and the Netherlands in playing reversal balls with one touch to the same player from whom the ball is received, and that in the defense zone.
For the second variable Z valued is -1.488, with level significance of 0.137. Probability value (p) is not less or equal to 0.05, so that this result (z) is not significant. This means that there are no statistical significant differences between the National teams of Spain and the Netherlands in playing reversal balls with one touch to third player in the defense zone.
Table No. 1 Z valued, Middle rank and Level of significance Variable z value Middle rank Level of significance
Same player 1 touch 7.43 defense zone
-0.071 7.57
0.943
Third player 1 touch 5.86 defense zone -1.488
9.14 0.137
Same player 1 touch 9.71 zone of organized attack
-1.994 5.29
0.046
Third player 1 touch 9.00 zone of organized attack
-1.342 6.00
0.180
Variable z value Middle rank Level of significance Same player 1 touch 10.00 final attack zone
-2.622 5.00
0.009
Third player 1 touch 9.29 final attack zone
-1.716 5.71
0.086
For the third variable Z valued is -1.994, with level significance of 0.046. Probability value (p) is equal to 0.05, so that result (z) is significant. This means that there are statistical significant differences between the National teams of Spain and the Netherlands in playing reversal balls with one touch to the same player from whom the ball is received in the organized attack zone.
For the fourth variable Z valued is -1.342, with level significance of 0.180. Probability value (p) is not less or equal to 0.05 so that this result (z) is not significant. This means that there are no statistical significant differences between the National teams of Spain and the Netherlands in playing reversal balls with one touch to third player in organized attack zone.
For the fifth variable Z valued is -2.622, with level significance of 0.009. Probability value (p) is less than 0.05, so that result (z) is significant. This means that there are statistical significant differences between the National teams of Spain and the Netherlands in playing reversal balls with one touch to the same player from whom the ball is received in the final attack zone.

98
For the sixth variable Z valued is -1.716, with level significance of 0.086. Probability value (p) is not less or equal to 0.05 so that this result (z) is not significant. This means that there is no statistical significant differences between the National teams of Spain and the Netherlands in playing reversal balls with one touch to third player in in the final attack zone.
Discussion
This study revealed significant differences in the application of technical –tactical element in playing reversal ball by the National team of Spain and the Netherlands in case of playing ‘’from the first ball’’ to the same player from whom the ball is received in the organized attack zone, and in case of playing to the same player ‘’ from the first ball’’ in the final attack zone.
Playing of reversal balls in all zones is one of the characteristics of modern’s football game which is the best representative the World and European Champion National team of Spain.
The differences can be explained by the fact that the National team of Spain has a higher percentage of ball possession than their opponents and during this period appears this difference in number of playing technical-tactical element of reversal ball. In the final game against the National team of the Netherlands the relationship of ball possession was 56 % to 44 % in favor of the National team of Spain. Assumption is that there is a difference in the application of other technical-tactical elements in the game of the two National teams and this could be the target of future researches.
For the theory and practice of football game would be interesting to investigate whether there were statistically significant differences in the game of the two National teams, related to playing of reversal balls with two, three, four and more ball touches.
References
1. Birman, K. (2011). Football matrix. Belgrade: Laguna.
2. Bala, G., & Krneta, Ž. (2007). Application of elementary statistical methods in kinesiology. Novi Sad: Faculty of Sport and Physical Education.
3. ðošić, N. (2010). Possibility of measure of situational speed in competitive conditions by contact index. In I. Jukić, L. Milanović, C. Gergov, S. Šalaj & T. Trošt.Boboć (Eds.), Proceedings of international scientific symposium “Conditioning of athletes 2010” (211-214). Zagreb: Faculty of Kinesiology, University of Zagreb and Croatian Association of fitness trainer.
4. ðošić, N. (2011). Pass precision in football game depending on the number of touches in case of ball handover. International conference “Sports management”. Belgrade: Faculty of Sports management, ALFA University.
5. ðošić, N. (2012). Representation of reversal balls in modern football game. 5. International interdisciplinary scientific and professional conference “Educational and sport horizons” (book of abstracts). Subotica: High school of vocational education studies for teachers and coaches.
6. ðošić, N. (2012). Representation of reversal balls in Dutch football. 8. International conference - “Management in sport” (book in print). Belgrade: Faculty of Sports Management, Alfa University.
7. Milanović, D. (2007). Training theory. Zagreb: Faculty of Kinesiology.

99
MODELING OF TABLE TENNIS TRAINING ACCORDING
PHYSIOLOGICAL CHARACTERISTICS OF THE GAME
Zoran ðokić Faculty of Sport and Tourism, Novi Sad, Serbia
Abstract
The main purpose of this research is to compare table tennis training on national team level in Serbia with scientific facts, regarding physiological measurement of table tennis players during competition and training, in research avaliable all over the world in last period. The idea understands, does today table tennis practice is in order with scientific basis, and what the recommendations for further development of training process are. Research was done during seven days of senior National Team prepare in competing season (11 trainings).Training intensity and physiological loads, of worming up, specific table tennis training, and many balls training were the subjects of analyses.For achieving top results in high level table tennis is neccessary to put training into scientific basis order from the beggining of player’s carieer.
Keywords: table tennis, analyses, physiology, heart rate, training
Introduction
Success in table tennis in latest decade, for shore, is in correlation with implementing of science into training process, like in other sports.Today, it is not important how long you practice, success in sport is based on „how you practice“.The idea of research model must be guided to improve actual sports performance, evidence suggests that sport-science research is not currently informing sport-science practice as it should and that sport-science researchers need to consider a new approach(Bishop,2010).
The main purpose of this research is to compare table tennis training on National team level in Serbia with scientific facts, regarding physiological research of table tennis during competition and training. The idea is understanding, does today’s table tennis training is in order with scientific basis, and what are the recommandations for futher development of training process. For achieving top results in high level table tennis, nowdays, is neccessary to put training into scientific basis order from the beggining of player’s carieer.
Characteristics of the table tennis game
Table tennis is one of the most demanding game, which include very fast analyses of changes in the tactics and techniques of the opponent. Players’ cerebral cortex during play is in a tense state and his attention quite focused(ball speed up to100 km/h, 0.1 sec from stroke from one to the end of the other side of table, with revolution of the ball around 133 rev/sec...), he has only 0.2-0.4 sec to analyze the approaching ball and to react. Competitions often last from 3-4 days to a week, and includemany games. The load is heavy, and it always brings various effects (busy schedule, strong opponents, changes in diet and sleeping habits, a new environment and time difference…)(Guan,1992). It’s necessary for a player to be in very good physical and mental condition. In modern table tennis, real play in one set in top competition (Olympic Games) last 4.18±0.75 min, and match 22.5±5.56 min. Longest match last 38.41 min and shortest per 9 minutes. From round to round match time mostly is prolonged (Katsikatedils et al,2007). With changing rules (Djokic,2007)playing time increased from 3:52 min. to 4:02 min (38mm ball till 21 pts vs.40mm ball till 11 pts –(rally per point (without service)).

100
Physiological characteristics of table tennis
According (Kondric et al,2010): table tennis belong to the low-moderate group of sports, and requires significant energy from both the anaerobic and aerobic energy systems (Mitchell et al,1992). The most important ability for table tennis player is endurance. Top players have higher levels of endurance (Weber,1985). Endurance describes two separate but related concepts: muscular and cardiorespiratory endurance (Willmore,2004). For a table tennis player, endurance is the quality that allows player to sustain a high speed over the couple of top spin strokes with high rotation of the ball. This quality is muscle endurance, the ability of the shoulder muscle group to sustain high-intensity, repetitive movement.Muscular endurance is highly related to muscular strength and anaerobic development. On the other hand, cardiorespiratory endurance relates to the body as a whole. For a table tennis player, it means the ability to sustain prolonged activity in long table tennis competitions. Cardiorespiratory endurance is related to the development of the cardiovascular and respiratory systems and thus aerobic development.Most sports scientists regard VO2max, representing aerobic power, as the bestobjective laboratory measure ofmaximal cardiorespiratory endurance capacity(DeVries,1986). In table tennis these conditions arise only during training sessions and occasionally during long rallies – particularly when playing against a defensive player.We can speak of3 recognizable phases during the transition from low to maximal exercise level:1stphase of low intensity exercise mainly involves aerobic metabolism, characterized by small increases in ventilation and blood lactate levels similar to resting values (1-1.5 mmol); 2nd phase, or Aerobic Threshold (AerT–eg. (Skinner,1980)), is characterized by slight hyperventilation andincreased lactate levels of approximately 2 mmol/l.As the level of exercise increases further, ventilation rises considerably, and there is a steady increase in blood lactate levels to approximately 4 mmol/l. This 3rd phase is termed the Anaerobic Threshold (AnT).(Kasai et al,1994) measured oxygen consumption, ventilation, heart rate and blood lactate concentration during practices and games. Data showed that oxygen consumption, ventilation, HR and blood lactate during games are lower than during training. The main values in games were 30.7 ml/kg/min for ventilation, 142bpm mean for HRand 1.17mmol/l for blood lactate.Lundin (in Preuβ,1988) reported in 1972 that during a single table tennis play the HR lies between 160-180 bpm. Because the rests between two games usually last amaximum of one minute, the results in accumulated fatigue. At the constant pulse frequency of 160-180 bpm, this means that the player is constantly at the edge of preservation of anaerobic ability. Because of the high intensity, accumulation of lactic acid in blood is present. Epstein (in Preuβ,1988) reports of 1.29mmol/l to 1.56±0,53mmol/l in training and 1.24mmol/l to 1.84mmol/l in competitive games where the heart rate gets over 190 bpm. (Djokic,2004) reported increasing HR as the game unfolded. The average values of theHR during 6official competition matches were from 162 to 172 bpm. (Zhagatto et al.,2010) verify the physiological responses and the match characteristics in official tournaments. The [LAC] verified in matches was 1.8 mmol.L (±0.8), whereas the peak was 2.2 mmol.L (±0.8). The HR was 164 bpm (±14), corresponding to 81.2% (±7.4) of the predicted maximum HR. As characteristics of the matches, the DR corresponded to 3.4 sec (±1.7), rest time to 8.1 sec (±5.1), E:R to 0.4 (±0.2), TPT to 970.5 sec (±336.1), EPT to 44.3% (±23.7), and frequency of shots to 35.3 balls/min (±7.7). The results suggest that table tennis matches present the aerobic system as a principal output energy, the phosphagenic system being the most important during efforts.
Method
Subjects
Subjects of this research were senior Serbian National team player(22 years old), ranked in top 150 of the ITTF Ranking list.
Testing procedures
During 7 days of National team trainings using POLAR S-710 heart rate monitor with memory, all trainings were controlled and analyzed by POLAR PRECISION PERFORMANCE SW 3.0 SOFTWARE (Polar Electro Oy, Kempele, Finland). Total of 11 individual tranings were recorded and analyzed, from beginning to the end.

101
200 200
180 180
160 160
140 140
120 120
100 100
80 80
60 60
40 40
20 20
00:00 :00 0:20 :00 0:40 :00 1 :00 :00 1:20 :00 1:40 :00
HR [bpm ] HR [bpm ]
Time
Pers on
Ex erc is e
Sport
No te
Date
Ti me
Dura tio n
Se lec tion
Heart ra te av erage
Heart ra te m ax
Zoran Djok ic
Bas icUse
Runn in g
9:59 :17 AM
2/4/2 009
1:51 :43 .5
0 :00 :00 - 1:51:40 (1 :51 :40 .0 )
127 bpm
186 bpm
1 2 3 4 5 6 7 8 9 10 11 12 13
12 7 bp m
Cursor values:
Time: 0:00: 00
HR: 78 bpm
Calorie rate: 0 kcal/60min
Statistical methods
Basic descriptive statistic were use for analyzes of training.Standard statistical methods were used: Arithmetic middle, Standard Deviation, Variaiton (Max and Min results), Simple end relative Frequency.
Results
During training period of 7 days, for every training, training day, and whole training period, intensity was calculated.
Analyses of training intensity: Total analyzed time duration of 11 trainings were 1094 min, with average training duration of 99.5 min. Average HR per all training recorded was 118.6±9.36 bpm, and average maximal HR was 169.6±11.36bpm.
Graph 1 Training analyzes (POLAR PRECISION PERFORMANCE SW 3.0 SOFTWARE)
Average duration of active exercise is 9.5 min (8-10 min), usually 3-5 time per training (30-50
min). Average recorded HR was 147 bpm. Average duration of passive exercise is the same – 9.5 min, and average recorded HR was 115 bpm.
Table 1 Average and maximal HR per training
Training AVG HR MAX HR
1 127 186
2 105 152
3 121 178
4 128 172
5 106 153
6 121 178
7 128 170
8 106 153
9 125 186
10 110 168
11 128 170
HR 118,64 169,64
Active exercise
Passive exercise

102
In graph 1 and table 2 time duration in HR zones is showed.
Graph 2 time spent in HR zones
Table 2 HR zones analyses
Players spent most time of training in HR zone between 80-160 bpm, and in zone 120-190 in total duration of 425.2 min, or 38.9% of total training time.
Intensity of warming up: Pre training warm up, was part of all trainings. Average time for warm up was 8.75±1.30 min, and average HR was 125±13bpm.
Intensity of table tennis training: This part include just part of training on the table (table tennis warm up, table tennis exercise, service training, many ball training). Average time of table tennis training was 89±6.1 min, and average HR was 120±6.8 bpm.
Intensity of many balls – interval training: In 3 many ball training session, average duration of this part of training was 29±2.9 min, and average HR was 121.3±1.2 bpm.
Periodization cycles analyzes: With information about average HR and volume (duration) of trainings, is possible to analyze training period, in this case – intensity of microcycle, type , model...
HR Min %
70-80 10,7 0,98
80-90 80,4 7,35
90-100 169,2 15,46
100-110 216,9 19,83
110-120 191,6 17,51
120-130 138,1 12,62
130-140 99,7 9,12
140-150 74,4 6,81
150-160 69,0 6,31
160-170 36,2 3,31
170-180 7,12 0,65
180-190 0,5 0,05
0
50
100
150
200
70
-80
80
-90
90
-10
0
10
0-1
10
11
0-1
20
12
0-1
30
13
0-1
40
14
0-1
50
15
0-1
60
16
0-1
70
17
0-1
80
18
0-1
90
7
6
5
4
3
2
1

103
0
500
HR/min
HR 116 121 117 125 106 118 128
t 202 92.8 198 204 93 210 94
1 2 3 4 5 6 7
Graph 3 Microcycle analyzes (intensity and volume of training)
Discussion
Results of training intensity analyses showed low intensity of training withaverage HR 118.64 and maximal HR 169.64.(Djokic,2007) collect data from the National team of Serbia, and analyse table tennis training; the approximate value of the HR was 142 bpm. In purelytactical training when stress is placed on the precisionof performing and returning the serve, the average values of the HR were 152-156bpm.(Watanabe et al,1994) measured program of table tennis involving heart rate, blood lactate concentration and rating of perceived exertion (RPE) between Chinese national class players and Japanese university class players. As an expressed percentage of maximal O2, the exercise intensity of table tennis practice was 56-73% VO2max in all players, respectively. Chinese players showed lower exercise intensity than Japanese.
A top player should have a maximum oxygen uptake of at least 60ml/kg, and the anaerobic threshold should be 70-80% of this value. Research on the Swedentable tennis team (1970-1972) showed that values for VO2maxduring the game were 65 ml.kg-1.min.Serbian senior national team average VO2max value were 56.55 ml.kg-1.min (Djokic,2007).
Players spent most time of training in HR zone between 80-160 bpm, and in zone 120-190 in total duration of 425.2 min, in „quality training zone“ they spent third of total training time.
Like many other authors (Yuza et al,1992;Weber,1985;Kasaiet al.,1994), Djokic pointed out that HRdepended on the type of training, but more demanding training yielded heart rates in excess of those found in competition.
Average time for warm up in this analyzes were 8.75 min, and average HR was 125 bpm. Warm up was guided. At least 15-minute warm-up at an intensity of 60-70% VO2max is recommended to improve ROM and enhance subsequent anaerobic performance (Stewart at al,1998).
Table tennis training (warm up, exercise, service training, many balls training) last average 89 min, and average HR was 120 bpm.(Weber,1985) in 30 min of competitive training, Bundesliga players had an average of 159-164bpm. (Preuß,1988), tested the energy consumption during one typical training session. During training, the concentration of lactatein the substance was from 1.1±0,1mmol/l during rest to 2.6±1,0mmol/l after the load, while the rise during competition from 1.0±0,1mmol/l during rest to 2.0±0,7mmol/l after the load was not that high.
In 3 many ball training session, average duration of this part of training was 29 min, and average HR was 121.3bpm.During interval training, the values vary from 98-115bpm at the beginning and between 144-192bpm at the end of an interval (Weber,1982). In speed training (maximum intensity) where a series of 4-5 balls were projected rapidly followed by a short rest of 1-1.25 min, the heart rate at the beginning was 110-115bpm, while atthe end it was 168-192bpm. (Djokic,2003) also, analyzed HR during specific many ball training.During aerobic enduranceexercise average values of HR at the beginning were98–105–110bpm, andaverage values of HR at the end 144–156–168bpm. During anaerobic endurance exerciseaverage values of HR at the beginning were 105–110–120, and at the end175–180–185bpm. In speed many ball trainingvalues of HR in beginning were 100-110-115bpm, and at the end168–175–180-185bpm.(Preuβ,1988) analyzed data from multiball training and found that there is significantly higher lactate present in blood–from 1.1±0,2mmol/l during rest to 4.3±1,9mmol/l during training. These obvious by increased values are probably based on the special load structure of the

104
training form. We can conclude, that intensity of interval training, was also, low as well whole analyzed trainings.
Recommendations, considering all analyzed data,should be in direction, to increase warm up duration and intensity, table tennis training intensity and also, many ball training intensity. Players should spent much more time in training zone, near their aerobic and anaerobic threshold. Planning and organizing of training microcycle must be better, considering intensity of trainings.
Table tennis is specific sport, and for exercise prescription, we aremoreinterested in the levelof performance that can be maintained without fatigue, rather than the aerobic power (VO2max) available at the point of exhaustion.The information pertaining to the physiological profile and the characteristics of table tennis should be used by coaches planning physical training and specific exercise prescriptions aiming at achieving maximal sport performance.(Djokic,2007), pointed out that testing and measurement are the means of collecting information upon which subsequent performance evaluations and decisions are made. Effective functional diagnosis of athletes meanssuccess for the training program. Sport scientists have demonstrated the importance of endurance training for table tennis players. Nothing but great stamina enables players to bring their skills and tactics into full play. After competition table tennis players are often not only physically exhausted, but also highly tense in the mind, so great endurance performance is the most importantfactor in theirsuccess.We must always remember that we are talking about adaptations of individual table tennis players and that everyone doesn’t respond in the same manner. Several factors that can affect player response to aerobic and anaerobic training must be considered. Based on a research,modern table tennis is a sport that requires both sub-maximal and maximal work and this puts pressure on both the anaerobic and aerobic systems.
References
1. Bishop, D. (2008). An applied research model for the sport sciences. Sports Med., 38(3), 253-63.
2. DeVries, H.A.(1986). Physiology of Exercise. Dobuque, Iowa: Wm. C. Brown Publisher.
3. Djokić, Z.(2003). Specific interval training in table tennis. The 8th International Table Tennis Federation Sports Science Congress – The 3rd World Congress of Science and Racket Sports, pp 22, Paris,.
4. Djokic, Z. (2004). Heart rate monitoring of table tennis players. In: A. Lees, J.F. Kahn, & Maynard,W. (Eds.), Science and Racket Sports III. The proceedings of the Eighth International Table Tennis Federation Sports Science Congress and 3rdWorld Congress of Science and Racket Sports (p. 21-22). London and New York: Routledge.
5. Djokic, Z. (2007). Functional diagnostics of top table tennis players. In: M. Kondrič, G. Furjan-Mandić, (Eds), Proceedings book. 10th ITTF Sports Science Congress (p.168-174). Zagreb: Faculty of Kinesiology, CTTA, ITTF.
6. Djokic, Z. (2007). Testing, perfection and monitoring of motor abilities of table tennis players. In: M. Kondrič, G. Furjan-Mandić, (Eds.) Proceedings book. 10th ITTF Sports Science Congress (p.175-182). Zagreb: Faculty of Kinesiology, CTTA, ITTF.
7. Djokic, Z.(2007). ITTF scored a goal (changes of rules in table tennis during 2000-2003). In: M. Kondrič, G. Furjan-Mandić (Eds). Proceedings book. 10th ITTF Sports Science Congress (p.168-174). Zagreb: Faculty of Kinesiology, CTTA, ITTF.
8. Guan,Y. (1992). Functional Evaluation for Table Tennis Players. International Journal of Table Tennis Sciences, 1, 95-97.
9. Kasai, J., Dal Monte, A., Faccini, P., & Rossi, D.(1994). Oxygen consumption during practice and game in table tennis. International Journal of Table Tennis Sciences, 2, 120-121.
10. Katsikadelis, M., Pilianidis, T., & Vasilogambrou, A.(2007). Real play time in table tennis matches in the XXVIII Olympic games «Athens 2004». In: M. Kondrič, G. Furjan-Mandić, (Eds.). Proceedings book. 10th ITTF Sports Science Congress (p.94-98). Zagreb: Faculty of Kinesiology, CTTA, ITTF.
11. Kondric, M., Furjan-Mandic, G., Kondric, L., & Gabaglio, A.(2010). Physiological Demands and Testing in Table Tennis. International Journal of Table Tennis Sciences, 6,165-170.

105
12. Mittchel, J.H., Haskell, W.L., & Raven, P.B.(1994). Classification of sports. Medicine and Science in Sports and Exercise, 26(Supplement 10), 242-245.
13. Preu β, A. (1988). Die Energiebereitstellung im Tischtennis in Wettkampf-und verschiedenen Trainingsbelastungen. [Supply of Energy at Table Tennis–during Competition Loads and during Different Training Loads] Diplomarbeit. Köln: Deutsche Sporthochschule.
14. Stewart, I.B., & Sleivert, G.G. (1998). The effect of warm-up intensity on range of motion and anaerobic performance. J Orthop Sports Phys Ther., 27(2), 154-61.
15. Skinner, J.S., & McLellan, T.H.(1980). Transition from aerobic to anaerobic metabolism. Research Quarterly for Exercise and Sport, 51(1), 234 - 248.
16. Watanabe, M., Kitahara, T., Shu, J.Z., & Nagata, M.(1994). Exercise intensity of table tennis practice and games by heart rate, blood lactate concentration, and RPE. International Journal of Table Tennis Sciences, 2, pp.121.
17. Weber, K. (1982). Analyse der körperlichen Beanspruchung in den verschiedenen Rückschlagspielen unter dem Aspekt der Präventiv-und Leistungsmedizin. In: Andersen/Hagedorn: Training im Sportspiel.4. Int. Sportspielsymposium, 111-133.. Ahrensburg.
18. Weber, K.(1985). Reaktion und Adaptionen im Tennissport–eine sportmedizinische Analyse. Reaction and adaptation in tennis – a sports medicine analysis. Köln: DSHS.
19. Willmore, J.H. & Costill, D.L.(2004). Physiology of sport and exercise. Champaign, Il:Human Kinetics.
20. Yuza,N., Sasaoka, K.,Nishioka, N., Matsui,Y., Yamanaka, N., Ogimura, I., Takashima, N., & Mi-yasita, M.(1992). Game Analysis of Table Tennis in Top Japanese Players of Different Playing Styles. International Journal of Table Tennis Sciences, 1, 79-89.
21. Zagatto, A.M., Morel, E.A., & Gobatto, C.A.(2010). Physiological responses and characteristics of table tennis matches determined in official tournaments. J Strength Cond Res., 24(4), 942-9.

106
107
POSSIBILITY OF SUBJECTIVE EVALUATION OF DIFFERENT LOAD
INTENSTY IN AMATEUR BOXING TRAINING
Goran Kuvačić, Saša Krstulović and Hrvoje Karninčić Faculty of Kinesiology, University of Split, Croatia
Abstract
The aim of this research was to ascertain the possibility of subjective evaluation of different load intensities in amateur boxing training. It was assumed that there was a strong connection between the subjective evaluation of the load intensity and the perceived heart frequency in examinees, with different training load intensities. The sample of examinees in this research consisted of 10 boxers, of average age 21,4±2.2 years, with training experience of 4,9±1.3 years. All the examinees participate in competitions, in following weight classes: -75kg, -81kg, -91kg, +91kg. The sample of variables consisted of 10 measured parameters: the evaluation of subjective load intensity of an examinee (ESLI) in 5 points, and perceived heart frequency (HF)in 5 points of measuring, or, training phases. A modified Borg RPE subjective load intensity scale CR10, ranging from 0 to 10, was used in the evaluation of subjective intensity variables. To ascertain the actual presence of several levels of load intensity, the univariate variance analysis was used for repeated measuring with Fisher LSD test in post-hoc analysis. The insight into the results showed the three levels of load intensity: low, medium and high. The correlation analysis did not show significant relationship between the ESLI and HF variables in the measuring points. The low relation is explained by small number of examinees, relatively low variability of the RPE scale, and the application of only one parameter of objective load evaluation (HF). The research pointed out the importance of subjective evaluation of load intensity, which can be used as a good tool of training process planning and programming.
Keywords: amateur boxing, intensity, exertion, subjective load, scale
Introduction
Amateur boxing is a well-known martial Art in the world, which to a certain extent originated as a response to professional boxing in the 19th century, due to numerous moral controversies related to the professional boxers at the time. An improved protection and stricter rules soon led to great popularization of the sport throughout the world. The good side of amateur boxing is that both children and young people can engage in it without risking serious injuries. Head protection, impossibility of severe punches and reduction of the number of rounds significantly contributed to the increase in the number of young people engaged in amateur boxing these days. Today it’s also called Olympic boxing due to the fact the rules allow it to enter the competition at the Olympic Games. Amateur boxers do not fight for money, but prestige. Amateur bouts comprise three-minute rounds with a one-minute interval between them. Boxers use anaerobic and aerobic systems in their bouts. Boxing training is focused on aerobic, anaerobic and muscular capacity, strength durability and reactive strength. The sport is specific in comparison to other sports because the number of competitions within a year is limited. Each fighter has to be highly physically prepared in order to enter a fight. Throughout a year, most of the time is spent on planning and programming preparatory training units prior to a fight. One of the important elements of training periodization is certainly a subjective evaluation of load intensity, which is one of the best indicators of physical exertion (Borg, 1982). There is a variety of means to determine training intensity level. Some of those include Talk Test, Target Heart Rate Range and Borg’s Rate of Perceived Exertion (RPE) scale. RPE actually refers to our feeling of how hard our body is working. Although this is an exerciser’s subjective evaluation, there is a high correlation between RPE and actual heart frequency (Borg, 1998). An exerciser provides a numerical value on the scale from 6 to 20 which, afterwards multiplied by 10, results in a theoretical heart frequency. There are numerous researches on the subjective intensity

108
evaluation field; hence, Bonitch et al. (2005) studied the correlation between RPE and heart frequency in judo bouts. They revealed a statistically significant correlation existing between subjective evaluation of load intensity and heart frequency. They concluded that RPE, as an indicator of excretion, can be used in judo training planning and programming. Furthermore, Milanez and Lima (2001) investigated whether there is a correlation between heart frequency, measured lactate concentration and RPE-S in karate, where RPE-S is actually an evaluation of the whole training intensity. They also concluded that Borg’s scale is an efficient means of evaluating individual intensity levels. Inspired by all of the above listed, the author of this research found it interesting to carry out a similar research sampled on amateur boxers. The objective of this research is to determine the possibility of subjective evaluation of load intensity and perceived heart frequency of the examinee, at different training load intensities.
Method
The sample of examinees in this research consisted of 10 boxers, of average age 21.4 ± 2.2 years, with training experience of 4.9 ± 1.3 years. All the examinees participate in competitions, in the following weight classes: -75kg, -81kg, -91kg, and +91kg. During their career, they had at least 5 matches in amateur bouts. Prior to this examination, all were proven healthy and without any injuries. The sample of variables consisted of 10 measured parameters: evaluation of subjective load intensity of examinees during: warm up (ESLI1), specific boxing exercises (ESLI2), sparing (ESLI3), various boxing punches in the coach’s hands (ESLI4), and different types of strength exercises (ESLI5); perceived heart frequency during: warm up (HF1), specific boxing exercises (HF2), sparing (HF3), various boxing punches in the coach’s hands (HF4), different types of strength exercises (HF5).For the ESLI variables evaluation (evaluation of subjective load intensity), a modified Borg’s RPE scale for evaluating subjective intensity CR10 was used, with a scale ranging from 0 to 10.
The RPE scale overview: 0 Rest 1 Minimal intensity 2 Very small intensity 3 Small intensity 4 Sub-medial intensity 5 Moderate intensity 6 Moderate intensity 7 High intensity 8 Very high intensity 9 Sub-maximal intensity
10 Maximal intensity
For the HF variable evaluation (heart frequency), a Suunto Monitor System heart frequency monitor, produced in Finland, was used. During the research, the examinees woreSuuntoDualBelts for sensing heart frequency. The acquired data was read out on a Lenovo portable computer screen by using telemetry system, i.e. Suunto PC Pod remote data transmission technology. All the examinees were given instructions before the examination, i.e. training. The training consisted of five parts: warming up, performing specific boxing exercises, undergoing bout simulation (sparing), demonstrating various punches in the coach’s hands (focusers), and undergoing different types of strength exercises. During each of these training parts, a measurer approached the examinee and registered the value of the subjective evaluation of load intensity given by the examinee himself. At the very same moment ESLI was registered, another measurer registered the heart frequency value the examinee himself was unable to see. Hence, the ESLI and HF variables were obtained at five measuring points. In accordance with the objective, for all the variables the parameters of descriptive statistics were calculated; arithmetic mean (AS), standard deviation (SD), minimal (Min) and maximal result. For purpose of testing normality of the variable distribution, the empiric significance was calculated using a Kolmogorov-Smirnov test. For determining the statistically significant differences in variables for evaluating heart frequency at five measuring points, an ANOVA for repeated measuring with Fisher’s LSD test in post-hoc analysiswas used. A Pearson’s coefficient of correlation, for determining the correlation between variables for estimating the subjective load intensity evaluation and variables for heart frequency evaluation, was calculated, too.

109
Results and Discussion
Table 1. The results of the descriptive statistic parameters; arithmetic mean (AS), standard deviation (SD), minimal (Min) and maximal (Max) result, Kolmogorov-Smirnov test (K-S).
AS SD Min Max max D AS SD Min Max max D
ESLI1 2.9 0.56 2 4 0.37 HF1 137.0 9.79 123 151 0.16
ESLI2 50 0.81 4 6 0.20 HF2 170.9 7.01 159 182 0.19
ESLI3 7.3 0.67 6 8 0.27 HF3 182.5 5.62 176 192 0.19
ESLI4 8.0 0.66 7 9 0.30 HF4 186.5 4.85 180 193 0.17
ESLI5 4.4 0.96 3 6 0.23 HF5 137.7 7.70 128 151 0.14
The limit value of K-S test for N=10 is 0,40 p=0,05.
In Table 1 we can see the results of the descriptive statistic parameters: arithmetic mean (AS), standard deviation (SD), minimal (Min) and maximal (Max) result, and Kolmogorov-Smirnov test (max D) of the variables for estimating the subjective intensity evaluation and the variables for the heart frequency evaluation. The results show that the average ESLI value at the first measuring point is the lowest (2.9), which is logical considering the fact this was the beginning of the training, i.e. warming up. On the other side, the highest ESLI value is noted at the fourth measuring point (8.0), at the part of the training in which the examinees were required to present different types of punches in the coach’s hands (a combination of direct, cross and uppercut punches). The minimal result the examinees provided during the entire measurement is 2, and the maximal is 9. The average heart frequency values changed at similar dynamics, hence the average value and the highest average HF value were also registered at the first and the fourth measuring points (137 and 186.5 bpm). Throughout the overall measurement, the minimal HF value registered was 123, while the maximal value was 193 bpm. By contrast, Guidetti (2002) noted the average maximal heart frequency of 188 bpm during the sparing phase. The K-S test results show that all the variables are normally distributed.
Line Plot ( 8v*10c)
ESLI
HF1TM 2 TM 3 TM 4 TM 5 TM2
3
4
5
6
7
8
9
130
140
150
160
170
180
190
Graph 1. A graphical overview of the average values of the subjective evaluation of load intensity and heart frequency.
Graph 1 shows the average values of the subjective evaluation of load intensity and heart frequency at all five measuring points. We can see the HF gradually increasing from the first to the fourth measuring point, and abruptly decreasing at the fifth point. The same goes for the ESLI values. In order to ascertain there are five different load intensity ‘’classes’’, we are going to employ an uninvariate analysis of variance analysis for repeated measuring with Fisher’s LSD test in post-hoc analysis.

110
Table 2. The results of ANOVA for repeated measuring with Fisher’s LSD test in post-hoc analysis. HF1 HF2 HF3 HF4 HF5
HF1
HF2 0.00
HF3 0.00 0.00
HF4 0.00 0.00 0.20
HF5 0.82 0.00 0.00 0.00
Table 2 shows the results of the ANOVA for repeated measuring with Fisher’s LSD test in post-hoc analysis. This analysis was aimed to ascertain whether there are any statistically significant differences in the perceived heart frequencies of the examinees at the five measuring points as objective measures of load intensity. The results show that there is a statistically significant difference in load intensity at the first three measuring points. Furthermore, Table 2 shows that there is no statistically significant difference between the third and fourth point, although both ESLI and HF values are higher at the fourth point. There is also no statistically significant difference between the first and the last measuring point. According to the above listed results, it may be concluded that, on the basis of the perceived heart frequency, there were three different levels of load intensity: low, medium and high. Low working intensity was present at the beginning of the exercise and at the end of the training, i.e. during warm up and strength exercises; medium working intensity during the specific boxing exercises, and high working intensity during sparing and punching the coach’s hands.
Table 3. The correlation of the variables in establishing subjective evaluation of load intensity and variables for evaluating heart frequency.
ESLI1 ESLI2 ESLI3 ESLI4 ESLI5
HF1 0.44
HF2 0.45
HF3 0.31
HF4 -0.07
HF5 0.23
Table 3 shows the correlation of the variables for establishing subjective evaluation of load intensity and variables for evaluating heart frequency. The coefficient of the correlation ranges from 0.45 at the second measuring point to -0.07 at the fourth measuring point. At the first two measuring points (the parts of the training when the examinees warmed up and performed some specific boxing exercises) we can see a relatively high, yet not statistically significant, correlation between the ESLI and HF. At the third measuring point, a high-intensity sparing, that correlation is somewhat lower (0.31), while at the fourth point (various punches at the focusers), the noted correlation is inconsiderable (-0.07). During the strength exercise (the fifth measuring point), the correlation between the ESLI and HF grows (0.23), however, it is still relatively low and statistically insignificant. The acquired results in general suggest there is a low correlation between the perceived heart frequencies and the examined sportsmen’s subjective evaluation of load intensity. It is assumed that such results are acquired due to several reasons: a) a lesser sensitivity of the RPE scale in comparison with the HF scale, where, at the particular measuring points, the examinees mainly grouped into two figures of the load scale, while the range was significantly higher with the heart frequency values; b) a relatively small sample of examinees also contributed to the lesser variability of the results, and consequently, to the lesser possibility of acquiring a statistical significance in the implemented analysis; c) heart frequency is just one of the load intensity indicators, however, it is clearly preferable to take other parameters (such as blood lactates) into account in such researches. It is also possible to assign the extremely low coefficient of correlation at the fourth point to accumulated exhaustion of the examinees which appeared at the end of the training. Namely, at the third point, i.e. part of the training, the examinees underwent sparing, i.e. one-on-one fighting. The intensity of the sparing was high, and the already tired examinees were unable to objectively evaluate the load intensity at the next part of the training, where they practiced punching their hands at the focusers, again subjected to high intensities. Travlos and Marisi (1996) acquired similar results in which the correlation between the ESLI and HF grew as the training intensity waned. Similar patterns can probably be applied on the fifth measuring point. Although the load intensity is almost as identical as in the first

111
point, i. e. warming up, the examinees failed to successfully evaluate the load intensity level at the final training part, where they performed different strength exercises.
Conclusion
The objective of this research was to ascertain the possibility of subjective evaluation of different load intensities in amateur boxing training. The paper pointed out the significance of subjective evaluation of load intensity, which can be applied as a useful tool in training process planning and programming. The analysis of the descriptive statistical measuring parameters enabled us to conclude that the heart frequency ranged from 123 to 193 bpm, and that the examinees provided values from 2 to 9 on the scale for subjective evaluation of load intensity. In order to actually ascertain the existence of several levels of load intensity, we used a uninvariate analysis of variance for repeated measuring with Fisher’s LSD test in post-hoc analysis. By gaining an insight into the results, we indentified three levels of load intensity; low, medium and high. Low working intensity was present at the beginning and at the end of the training; medium working intensity during some specific boxing exercises, and high working intensity during sparing and kicking the coach’s hands. The correlation analysis did not ascertain any significant correlation between the ESLI and HF variables. The highest correlation between them existed at the initial part of the training, i.e. warming up, and at performing some specific boxing exercises, while the lowest correlation manifested at the part of the training where the examinees, after undergoing sparing, had to demonstrate different punches at the coach’s hands. Such low correlation can be explained by a small sample of examines, by a relatively low variability of the RPI scale, by applying only one objective load intensity evaluation parameter (HF), and by the examinees’ exhaustion at the last two measuring points.
References
1. Bonitch, J., Ramirez, J., Femia, P., et al. (2005.) Validating the relation between heart rate and Perceived Exertion in a judo competition. Medicina Dello Sport, 58, 23-28.
2. Borg, G. (1982). Psychophysical base of perceived exertion. Medicine and Science in Sport and Exercise, 14, 377-381.
3. Guidetti, L., & Musulin, A. (2002.) Physiological factors in middleweight boxing performance. Journal of Sports medicine and physical Fitness, 42, 309-314.
4. Milanez, V.F., Spiguel Lima, M.C., Gobatto, C.A., et al. (2011). Correlates of session-rate of perceived exertion (RPE) in a karate training session. Science and Sports 26, 38-43.
5. Travlos, A.K., & Marisi, D.Q. (1996). Perceived exertion during physical exercise among individuals high and low in fitness. Perceptual Motor Skills, 2, 419-423.

112

113
CONDITIONALITY OF MAXIMUM OXYGEN UPTAKE OBTAINED BY
DIFFERENT EXERCISE MACHINES WITH TRAINING LOAD SETUP
USING GROSS MOTOR SKILL TESTS
Marko Erceg, Igor Jelaska and Boris Maleš
Faculty of Kinesiology, University of Split, Croatia
Abstract
The aim of this study was to determine the conditionality of relative maximum oxygen uptake obtained (R VO2max) by using three different exercise machines with training load setup (treadmill, cycle ergometer and Orbitrek elliptical trainer) while utilizing a gross motor skill test. In accordance with the study aim, a sample of 19 female students was used. A progressive exercise protocol was applied until the exhaustion of participants had set in. Relative maximum oxygen uptakes obtained from utilized exercise machines were set as dependent variables for a multiple regression analysis with forward algorithm of variable selection. The following gross motor skill tests were set as independent variables: side steps (MKUS), hexagon test (HEX), standing long jump (MSDM), throwing a medicine ball (MBML), number of push-ups performed until exhaustion set in (MSKL), number of sit-ups in 60 seconds (MTRB), balance on two feet with closed eyes (MBAP2Z), balance on one foot with open eyes (MBAU10), arm plate tapping (MBTAP) and foot taping (MBTAN).
Results indicate statistically significant (p<0.01) and relatively strong (R2=0.65-0.92) predictive power of the selected gross motor skill variable set (additionally reduced by forward variable selection algorithm for entry into a model) and unambiguously show that a set of applied motor skill variables can be used in scientific and professional practice as a good predictor of the relative maximum oxygen uptake.
Keywords: relative maximum oxygen uptake, Orbitrek, cycle ergometer, treadmill, regression analysis
Introduction
Diagnostic procedures in sports are carried out with the aim of determining the athlete’s initial state, evaluating the effects achieved in individual sports preparation cycles and planning and programming further training process course. Modern training process diagnostics represents a series of procedures which identify, evaluate and explain individual characteristics of an athlete by testing or measuring certain traits and abilities. The complete diagnostic procedure should include measurement and evaluation of morphological, functional, biochemical, biomechanical, motor, mental and social characteristics of the athlete and of his or her specific abilities and proficiencies which enable successful performance of technical and tactical elements. Functional diagnostics provides a detailed overview of the current state of the individual and the entire team. It also enables the observation and control of the training process, and the option of making comparisons to other teams. Moreover, the evaluation of functional abilities can provide data on specific physiological and biochemical reactions during training and competitive activities in a particular branch of sports (Meyer et al., 1996). The most frequently used aerobic energy capacity assessment parameters in scientific and professional practice are the absolute and relative maximum oxygen uptake (VO2max, VO2max /kg), whereas lactate concentration in blood is the most frequently used parameter in anaerobic capacity assessment (Svedahl & MacIntosh, 2003; Christopher & Rhodes, 1993). The most frequently used training load setup exercise machines are the cycle ergometer and the treadmill, even though lately specific ergometers for individual sports (rowing, kayaking, cross-country skiing...) which truly reproduce the dynamic movement stereotype specific for each sport are also increasingly used. The test is generally performed until the exhaustion of the participant sets in, unless there are contraindications or limiting factors (Rowland, 1996). In addition to the two standard training

114
load setup exercise machines, an Orbitrek exercise machine (thus far rarely used as a measurement instrument in sports scientific and professional practice) was used to evaluate functional characteristics of students in this research. Therefore, the aim of the research was to determine and explain the correlation of a set of gross motor skill variables and the relative maximum oxygen uptake, measured on three different training load setup exercise machines.
Method
The participant sample comprised 19 female students of the Faculty of Kinesiology at the University of Split who were tested on 3 different exercise machines: Orbitrek exercise machine, cycle ergometer and a treadmill. In so doing, relative maximum oxygen uptake variables were measured on each individual exercise machine using a progressive exercise protocol, until participant exhaustion set in. The participants were also evaluated in 14 gross motor skills tests: side steps (MKUS), hexagon test (HEX), standing long jump (MSDM), medicine ball throw (MBML), tapping with hands and feet (MKRBNR), push-ups (MSKL), number of sit-ups in 60 seconds (MTRB), standing lengthwise on both feet on a balance bench with closed eyes (MBAP2Z), standing lengthwise on one foot on a balance bench with open eyes (MBAU10), arm plate tapping (MBTAP) and foot taping (MBTAN),
Initially, all variables were subjected to the test of normal distribution by means of a Kolmogorov-Smirnov test, and descriptive statistical parameters (namely, arithmetic mean, standard deviation, minimum and maximum results) were calculated. Multiple regression analysis and the utilization of a forward variable selection algorithm for entry into a model enabled a separate analysis of relative maximum oxygen uptake dependence on motor skill variables on all observed exercise machines. Multiple correlation coefficient (R), multiple determination coefficient (R2) and the associated significance were calculated.
Results and Discussion
Table 1 contains descriptive statistics results of observed motor skill variables and the relative maximum oxygen uptake on different training load setup exercise machines.
Table 1 Descriptive statistic parameters of the maximum oxygen uptake variables on all 3 observed exercise machines and motor skill variables (AM - arithmetic mean, Min - minimum result, Max – maximum result, SD – standard deviation, KS-p – empirical significance of the Kolmogorov-Smirnov test)
AM Min Max SD KS-p R VO2max -O
42.93 30.72 52.5 7.28 p > .20
R VO2max -B
39.88 29.62 53.7 7.01 p > .20
R VO2max -P
46.17 34,35 64.7 7.80 p > .20
MKUS 9.76 8.14 11.0 0.69 p > .20 HEX 11.37 7.60 14.5 1.41 p > .20 MSDM 1.99 1.70 2.2 0.14 p > .20 MBML 8.41 6.70 10.0 1.01 p > .20 MKRBNR 9.30 6.00 14.7 2.24 p > .20 MSKL 19.95 10.00 31.0 7.66 p > .20 MTRB 40.00 20.00 58.0 9.44 p > .20 MBAP2Z 4.20 1.88 10.6 2.47 p < .15 MBAU10 5.76 1.98 20.1 4.57 p < .20 MBTAP 38.58 35.00 42.0 2.48 p > .20 MBTAN 47.00 39.00 68.0 6.55 p > .20
It is important to point out that all variables have a distribution for which it can be said it does not deviate significantly from the normal distribution (Table 1).
Moreover, by taking standard deviations and minimal and maximum results of observed variables into consideration, it can be noted that the female student sample used was relatively heterogeneous.

115
Table 2. Regression analysis results when utilizing a forward variable selection algorithm for entry into a model for the criterion variables of maximum relative oxygen uptake on all observed exercise machines. (Regression coefficients assigned to standardized variables – Beta, significance of beta coefficients – p, multiple correlation coefficient – R, multiple determination coefficient – R2, multiple correlation coefficient significance– p)
R VO2max Orbitrek R VO2max Cycle ergometer R VO2max Treadmill Beta p Beta p Beta p Intercept MKUS 0.58 0.01 0.59 0.19 HEX -0.44 0.04 -0.33 0.11 MSDM 0.24 0.17 0.47 0.01 MBML 0.50 0.02 0.52 0.04 0.25 0.11 MKRBNR -0.33 0.04 MSKL 0.21 0.23 MTRB 0.77 0,01 0.33 0.13 0.89 0.00 MBAP2Z 0.81 0.00 0.51 0.00 MBAU10 -0.20 0.20 0.55 0.00 MBTAP -0.58 0.01 MBTAN 0.27 0.10 0.17 0.23 R 0.96 0.80 0.92 R2 0.92 0.65 0.84 p 0.00 0.01 0.00
It is important to note that in order to get a clearer picture of the correlation between observed variables a forward variable selection algorithm for entry into a model (Jelaska, Erceg & Kuna, 2011) was used. When viewing table 2, it can be observed that the maximum oxygen uptakes on all exercise machines were determined by motor skills (p<0.01, R2=0.65-0.92). Therefore, we can conclude that VO2max is highly determined by predictors arising from the motor skill set. Table 1 shows that the participants had the highest maximum oxygen uptake levels scores on the treadmill, a bit lower scores on the Orbitrek exercise machine, and the lowest ones on the cycle ergometer, which almost completely coincides with previous research results (Sedlock, 1992; Mays et al., 2010). In addition to that, results from table 2 indicate that the maximum oxygen uptake while exercising on Orbitrek statistically significantly affects as much as 7 out of 11 predictor variables, namely the assessment variables: strength of the torso (MBML, MTRB), agility (MHEG, MKUS), coordination (MKRBNR) movement frequency (MTAP) and balance (MBAP2Z). Previously obtained results are to be expected considering the Orbitrek operating mode - the elliptic movement dynamic itself requires good coordination at high frequencies. On the treadmill, 4 out of 11 predictors statistically significantly indicate the maximum oxygen uptake: both balance assessment variables, MBAP2Z and MBAU10, as well as the body and torso strength assessment variables, MTRB and MSDM. It is obvious that balance plays an important role at the treadmill, probably because running on the same spot feels somewhat unnatural, and because of this, processes for maintaining balance are additionally activated. Only one variable statistically significantly influences maximum oxygen uptake on the cycle ergometer, and that is the shoulder girdle and torso strength assessment variable, MBML. The differences and similarities between the exercise machines can be defined within the scope of their specificities, i.e. movements carried out during the performance of an exercise. Whereas Orbitrek and cycle ergometer require strength of the torso which is extremely important in order for task execution to be economical and continuous, the treadmill requires a highly developed balance as opposed to the other two exercise machines. The difference between Orbitrek and cycle ergometer exercise machines is most evident in coordination and hand movement frequency: Obitrek is more demanding in these aspects. This was to be expected, since Orbitrek exercise actively utilizes arms, and the movements themselves are much more complex than those used during cycle ergometer exercise.
Modern sports technologies assuredly aim to develop functional abilities of athletes, so there is need for the improvement of training process modality and methods which would then improve these required properties. One of the possible approaches to satisfying high standards is the option of using training load setup exercise machines in an advanced manner, as kinesiological operators. It needs to be emphasised that the main limitation to this research is a relatively small sample as opposed to the number of variables measured, as well as a relatively heterogeneous participant sample that obscured certain

116
results. For future research it would be wise to homogenize the participant sample in order to facilitate interpretation of results and increase the deduction capability.
References
1. Christopher E.R., & Rhodes, E.C. (1993). Relationship between the lactate and ventilatory thresholds during prolonged exercise. Sport Medicine, 15(2), 104-115.
2. Jelaska, I., Erceg, M., & Kuna, D. (2011). Comparation of variable selection algorithms in regression model in kinesiological research. Physical education in 21. century - pupils competencies, 211-217. Zagreb: HKS.
3. Mays, R.J., Boer, N.F., Mealey, L.M., Kim, K.H., & Goss, F.L. (2010). A comparison of practical assessment methods to determine treadmill, cycle, and eliptical ergometer. J Strength Cond Res., 24(5), 1325-1331.
4. Meyer, K., Stengele, E., Westbrook, S., Beneke, R., Schwaibold, M., Gornandt, L., Lehmann, M., & Roskamm, H. (1996). Influence of different exercise protocols on functional capacity and symptoms in patients with chronic heart failure. Medicine and Science in Sports and Exercise, 28(9), 1081-1086.
5. Rowland, T.W. (1996). Developmental Exercise Physiology. Champaign IL: Human Kinetics.
6. Sedlock, D.A. (1992). Postexercise energy expenditure following cycle ergometer and treadmill exercise. Journal of Applied Sport Science Research, 6,19-23.
7. Svedahl, K., & Macintosh, B.R. (2003). Anaerobic Threshold: The Concept and Methods of Measurement. Canadian Journal of Applied Physiology, 28(2), 299-323.

117
INFLUENCE OF EXTRAVERSION-INTROVERSION ON THE
BALANCE OF THE STUDENTS FROM THE FACULTY OF SPORT
AND PHYSICAL EDUCATION
Jelena Obradović, Milan Pantović and Mila Vukadinović Faculty of Sport and Physical Education, University of Novi Sad, Serbia
Abstract
A group of three motor ability tests for balance, in addition to the EPQ questionnaire, were applied on the sample of 190 students (aged approximately 19 +/- 6 months) from the Faculty of Sport and Physical Education in Novi Sad. The goal of the research was to determine the influence of extraversion-introversion as a personality trait on balance as a motor ability. Factor analysis and Categorical regression were applied to determine the influence of extraversion-introversion on balance as well. Observing an individual influence of EPQ test for the evaluation of extraversion-introversion on the performance efficiency: Standing stork test (SST), the test of standing on one foot transversely to the bench for balance with open eyes (SOFTB) and the test standing on one foot longitudinally to the bench for balance with open eyes (SOFLB), we can notice that the biggest influence of extraversion-introversion has been made by the standing stork test, while other two tests did not make any important statistical influence. The results of research showed that extraversion-introversion as a personality trait had a great impact on the expression of balance as a general factor of motor skills.
Keywords: EPQ questionnaire, adolescents, motor ability.
Introduction
Balance is defined as the ability to control the balanced position with the analysis of the data which are obtained by visual and kinesthetic receptors (Sekulić and Metikoš, 2007). In order to maintain balance it is necessary to have the coordinated functioning of the vestibular apparatus, visual analyzer and proprioceptive sensation (Jertec, 2011). The basic division of balance (Tkalčić, 1987) as a motor ability includes two categorizations: balance with open and closed eyes, as well as static and dynamic balance.
Many scientists have been interested in the connection between the motor and conative space of a person for quite some time. Madić (2003, 2004); Cox (2005); Tubić (2009); Hrysomallis (2010); Margaret et al. (2010); Ibrahim, Heard and Blanksby (2011); Douris et al. (2011) claim that there is a connection between a chosen type of sport and personal traits, which leads us to the conclusion that there is a mutual influence of sport and personal traits.
Characteristics or personal traits are basic units of the structure of somebody’s personality which, according to Olport (Tubić, 2004), represent predispositions to react to different types of stimuli and situations in a similar or the equivalent way.
Hans-Jurgen Eysenck formulated the personality theory. His personality system is defined by four dimensions: extroversion-introversion, neuroticism-stability, psychoticism and intelligence (Eysenck, 1976). Every dimension of personality has certain characteristics which make it authentic.
Psychological research has proved that people who show more tendencies towards extroverted behavioral patterns more frequently choose to participate in sports activities and they are more successful. Namely, the contents of sports activities on one hand and demands which athletes face constantly on the other make a selection among people. Those who are ready to invest greater effort (both physical and psychological), take a risk and show that they are more endurable, physically active and ready to stay in the field of sport are extroverts. Introverted people can be more frequently found in lower levels of competitions, as well as individual sports (Tubić, 2009).

118
The aim of this research is to establish whether there is an influence of extraversion-introversion on the balance of the students from the Faculty of Sport and Physical Education.
Method
The testing was done on the sample of 190 second-year students from the Faculty of Sport and Physical Education in Novi Sad (137 men and 53 women) aged 19 +/- 6 months.
For the evaluation of balance as a motor ability the following tests were used: standing on one foot transversely to the bench for balance with open eyes (SOFTB) and standing on one leg longitudinally to the bench for balance with open eyes used (SOFLB) by Metikoš, Prot, Hofman, Pitar and Oreb (1989). In addition, there was the standing stork test (SST) taken from Hastad and Lacy (1998).
For the evaluation of the extraverted-introverted (E-I) dimension of a personality (E-I) EPQ (Eysenck Personality Questionnaire) was used, taken from Eysenck (1976).
Basic statistical parameters for every individual variable were obtained by descriptive statistics. The Kolmogorov-Smirnov test was chosen for the analysis of the normality of distribution.
Categorical regressive analysis was used for the analysis of the influence of personality traits (extraversion- introversion) of the students from the Faculty of Sport and Physical Education on their balance, while the general balance factor was established by the Factor analysis.
Results
The results of Kolmogorov-Smirnov tests show that there is a statistically significant deviation from the normal Gauss distribution in the tests: standing on one foot transversely to the bench for balance with open eyes, standing on one leg longitudinally to the bench for balance with open eyes, standing stork test and E-I test.
In the case of the tests: standing on one leg longitudinally to the bench for balance with open eyes (SOFLB), standing stork tests (SST) and E-I test the Skewness values are negative for the students of both sexes, which indicates the increased grouping of the results in the zone of higher values. More students can stand longer on one foot longitudinally to the bench for balance with open eyes and in the standing stork test, while the results of the E-I tests show that those students belong to the extraverted type of personality more frequently than to the introverted one. In the case of the test standing on one foot transversely to the bench for balance with eyes open (SOFTB) the value of Skewness is positive, which shows that a large number of students cannot stand on a bench for balance for a long time. The Kurtosis values in the tests standing on one leg transversely to the bench for balance with open eyes (SOFTB), standing stork tests (SST) and E-I test are positive and accordingly it can be concluded that the students are quite homogenous, while in the test standing on one leg longitudinally to the bench for balance with open eyes (SOFLB) there are various results, which indicates that students are heterogeneous (Table 1).
Table 1. Basic descriptive statistical data and statistical significance of the Kolmogorov-Smirnov test of the students of both sexes from the Faculty of Sport and Physical Education.
Skewness Kurtosis variables N min max AM SD
Stat. Std.e. Stat. Std.e. K-S (sig)
SOFLB 190 53 600 428.9 196.2 -0.57 0.17 -1.29 0.35 0.00
SOFTB 190 21 854 141.6 186.0 2.27 0.17 4.27 0.35 0.00
SST 190 58 600 505.4 163.4 -1.45 0.17 0.56 0.35 0.00
E-I 190 5 21 15.9 3.18 -1.03 0.17 0.96 0.35 0.00
Legend: N – number of examinees; min- minimum value; max – maximum value; AM – arithmetic mean; SD – standard deviation; Skewness – asymmetric distribution; Kurtostis – homogeneous distribution; K-S statistical significance of Kolmogorov-Smirnov test

119
In the Table 2 it can be noticed that there is no statistically significant influence of extraversion-introversion as a personality trait on balance, which can be noticed in certain motor tests when the whole sample is observed.
Table 2. Categorical regression of the students of both sexes from the Faculty of Sport and Physical Education
S.Coeff. variables R
β Std.er. F p
SOFLB 0.16 0.01 0.70 0.54 0.81
SOFTB 0.96 -0.96 0.76 1.60 0.20
SST 0.13 -0.13 0.16 0.69 0.40
Legend: R – value of multiple correlation; β – β coefficient of regression; Std.er. – standard error; F – F value; p – the level of statistical significance of the influence (0.01)
According to Skewness values it can be concluded that a larger number of female students achieved lower scores in the test standing on one foot transversely to the bench with open eyes (SOFTB), while in the tests E-I, standing on one foot longitudinally to the bench with open eyes (SOFLB) and standing stork tests (SST) they achieved a higher score. On the scale E-I they are marked as extraverted. Kurtosis value is negative in the test standing on one foot transversely to the bench with open eyes (SOFTB), so the students are heterogeneous. In the tests standing on one foot longitudinally to the bench with open eyes (SOFLB), standing stork test (SST) and E-I the value of Kurtosis is positive which implies that the values achieved by all female students are approximately the same. The values of Kolmogorov-Smirnov test show that in the tests standing on one foot transversely to the bench with open eyes (SOFTB) and E-I there is no statistically significant deviation from the normal Gauss distribution, while in the tests standing on one foot longitudinally to the bench with open eyes (SOFLB) and standing stork tests (SST) there is a statistically significant deviation from the normal distribution (Table 3).
Table 3. Basic descriptive statistical values and statistical significance of Kolmogorov- Smirnov test of female students from the Faculty of Sport and Physical Education.
Skewness Kurtosis variables N min max AM SD
Stat. Std.e. Stat. Std.e. K-S (sig)
SOFLB 53 89 600 496.46 157.87 -1.23 0.33 0.12 0.65 0.00
SOFTB 53 21 854 302.52 259.47 0.71 0.33 -0.83 0.65 0.74
SST 53 85 600 492.48 185.34 -1.36 0.33 0.56 0.65 0.00
E-I 53 8 20 15.8 2.84 -0.82 0.33 0.96 0.65 0.31
Table 4 represents the influences of extraversion-introversion of female students on their balance which is expressed in motor tests. It can be noticed that there is no statistically significant influence of E-I on the balance in the standing stork test (p=0.41), standing on one foot transversely to the bench for balance (p=0.13) and standing on one foot longitudinally to the bench for balance (p=0.62).
Table 4. Categorical regression of female students from the Faculty of Sport and Physical Education S.Coeff.
variables
R β Std.er. F P
SOFLB 0.89 -0.89 1.80 0.34 0.62
SOFTB 0.20 -0.20 0.13 2.31 0.13
SST 0.13 -0.13 0.16 0.67 0.41
The analysis of the table 5 which shows the central and dispersive parameters of the tests of balance and personal traits of male students showed that there is a statistically significant deviation from the normal distribution in the tests standing on one foot transversely to the bench with open eyes (SOFTB), standing on one foot longitudinally to the bench with open eyes (SOFLB) and standing stork test (SST), while in the tests E-I there is no statistically significant deviation from the normal Gauss distribution. The value of Skewness in the tests standing on one foot longitudinally to the bench with

120
open eyes (SOFLB), standing stork tests (SST) and E-I is negative which represents grouping of the results towards the zone of higher values. In the tests standing on one foot transversely to the bench with open eyes (SOFTB) the value of Skewness is positive which implies that the students were standing on one foot longitudinally on the bench for balance with open eyes for a shorter period of time. The value of Kurtosis in the tests standing on one foot transversely to the bench with open eyes (SOFTB), standing stork test (SST) and E-I is positive and big which means that students are increasingly heterogeneous. In the test standing on one foot transversely to the bench with open eyes (SOFTB) the value of Kurtosis is significantly high, which can also be seen from the value of minimum and maximum. In contrast to these tests, the test standing on one foot longitudinally to the bench with open eyes (SOFLB) showed the increased homogeneity.
Table 5. Basic descriptive statistical data and statistical significance of Kolmogorov-Smirnov test for male students from the Faculty of Sport and Physical Education.
Skewness Kurtosis variables N min max AM SD
Stat. Std.e. Stat. Std.e. K-S (sig)
SOFLB 137 53 600 402.10 203.73 -0.35 0.20 -1.53 0.65 0.00
SOFTB 137 22 600 80.85 96.01 4.33 0.20 19.86 0.65 0.00
SST 137 58 600 512.72 152.87 -1.52 0.20 0.93 0.65 0.00
E-I 137 5 21 15.90 3.28 -1.09 0.20 1.14 0.65 0.10
In table 6 for male students there is no statistically significant influence of E-I on balance in the tests standing on one foot longitudinally to the bench for balance (0.57), standing on one foot transversely to the bench for balance (0.76) and standing stork test (0.99).
Table 6. Categorical regression of male students from the Faculty of Sport and Physical Education S.Coeff.
variables
R β Std.er. F p
SOFLB 0.04 0.04 0.07 0.31 0.57
SOFTB 0.39 -039 0.12 0.09 0.76
SST 0.00 0.00 0.09 0.00 0.99
Factor analysis showed the general factor of balance for men and women.
In Table 7 there is no statistically significant influence of E-I on the general balance factor for both male and female students.
Table 7. Categorical regression of the general balance factor S.Coeff.
variables
R β Std.er. F Sig
Both sexes 0.07 -0.07 0.08 0.95 0.33
Female stud. 0.26 -0.26 0.12 2.93 0.09
Male stud. 0.17 0.01 0.93 0.03 0.85
Discussion
The results of this research are identical with the results obtained by Ibrahim, Hear and Blanksby (2011) and they agree about the existence of the general balance factor. The lack of past papers from this area of study leads us to conclude that the influence of balance as a motor ability on personal traits in this case of extraversion-introversion is not available.
According to the obtained results it can be concluded that there is no statistically significant influence of extraversion-introversion on the general balance factor for male students (p=0.85), female students (p=0.09) and both sexes (0.33). A larger number of male students takes part in a collective or

121
direct sport. More extraverted students achieve better results in maintaining balance positions (postures), which is confirmed by the research: Obadov, 1998; Stojanović, Milenkoski and Stojanović, 2011; Schurr, Ashley and Joy, 1977; according to: Weinberg and Gould, 2010; Paillard and Noe, 2006. Above mentioned claims according to (β=0.01) match the research, however those values in this case do not show any statistical significance (p=0.85).
Analyzing male and female students individually for the influence of E-I on balance in specific motor tests it can be concluded that in the case of male students there is no statistically significant influence of extraversion-introversion on balance in the tests: standing stork test, standing on one foot transversely to the bench with open eyes and standing on one foot longitudinally to the bench with open eyes. In the case of female students it can also be noticed that there is no statistically significant influence of E-I on balance in the tests: standing stork test, standing on one foot transversely to the bench with open eyes and standing on one foot longitudinally to the bench with open eyes.
It is very difficult to divide athletes in this stadium in two groups: extraverted and introverted (Silva and Weinberg, 1984). According to the sports pyramid of personality-ability (John and Silva, 1984; according to: Cox, 2005) the students from the Faculty of Sport and Physical Education belong to a certain group of students. In this group, more precisely in the initial phase of taking up a sport, which our students belong to, athletes are very heterogeneous and have different personality traits. Taking into account that the athletes are heterogeneous and that they have no defined personality traits these results show that there is no statistically significant influence of extraversion-introversion as a personality trait on balance as a motor ability.
Students in this age are actually in the late adolescent period. In the case of women it finishes around the age of 21, while men finish their full growth and development at the age of 25. Motor abilities change, first of all depending on the lifestyle and specific training, while individual differences in this period are very big (Nićin, 2000). The results obtained in this research confirm those statements. In the test standing on one foot longitudinally to the bench with open eyes the students of both sexes are quite heterogeneous, which can be seen in the Table 1. In the period of adolescence it seems unreal to determine the time during which the maximum balance is expected to show, since being successful in this activity is preconditioned by experience, concentration, control of muscle tension and other factors (Nićin, 2000).
It can be concluded that in the case of the students from the Faculty of Sport and Physical Education at this age, who were included in the sample of athletes, there is no statistically significant influence of extraversion-introversion on balance as a motor ability. In order to obtain different results in this field of research different age, population and a significantly bigger sample should be examined.
References
1. Cox, H.R. (2005). Psihologija sporta. Jastrebarsko: Naklada Slap.
2. Douris, P.C., Handrakis, J.P., Gendy, J., Salama, M., Kwon, D., Brooks, R., Salama, N., & Southard, V. (2011). Fatiguing Upper Body Aerobic Exercise Impairs Balance. Journal of Srength & Conditioning Research, 25, 3299-3305.
3. Eysenck, H.J. (1976). The Measurement of Personality, editor.
4. Hastad, D., & Lacy, A. (1998). Measrument and evaluation in physical and exercise science. Boston.
5. Hrysomallis, C. (2010). Balance ability and athletic performance. Exercise and Active Living, School of Sport and Exercise Science. Victoria, Australia: Institut of Sport.
6. Ibrahim, H., Heard, NP., & Blanksby, B. (2011). Exploring the general motor ability construct. Perceptual and Motor Skills, 113(2), 491-508.
7. Jertec, N. (2011). Razlike u sposobnosti ravnoteže s obzirom na spol kod djece predškolske dobi. Zbornik radova 20. ljetna škola kineziloga republike hrvatske. Poreč.
8. Madić, D. (2003). Relacije konativnih karakteristika i uspešnosti u vežbanju na spravama. Zbornik radova sa Naučnog skupa povodom Novosadskog maratona. Novi Sad: Novosadski maraton.

122
9. Madić, D. (2004). Uloga crta ličnosti u motoričkim testovima u kojima je važana sposobnost suprostavljanja zamoru. Zbornik radova sa Naučnog skupa povodovm Novosadskog maratona. Novi Sad: Novosadski maraton.
10. Margaret, J.T., Matthews, T.D., Murray, M., Raalte, J.V., & Jensen, B.E. (2010). Psychological Correlates of Performance in Female Athletes During a 12-Week Off-Season Strength and Conditioning Program. Journal of Strength & Conditioning Research, 24, 619-628.
11. Metikoš, Prot, Hofman, Pitar i Oreb (1989). Mjerenje bazičnih motoričkih dimenzija sportaša. Zagreb: Fakultet za fizičku kulturu.
12. Obadov, S.(1998). Osobine ličnosti džudista kao faktor njihove sportske uspešnosti (Magistarski rad). Novi Sad: Fakultet fizičke kulture.
13. Sekulić, D., & Metikoš, D. (2007). Osnove transformacijskih postupaka u kineziologiji. Split: Kineziološki fakultet.
14. Silva, J.M., & Weinberg, R.S. (1984). Psichological fundations of sport. Campaing: Human Kinetiks.
15. Stojanović, T., Milenkoski, J., & Stojanović, N. (2011). Konativne karakteristike odbojkaša različitog nivoa kvaliteta. Sport i zdavlje, 6(1), 67-71.
16. Tkalčić, S. (1987). Struktura ranoteže (Doktorska disertacija). Zagreb: Fakultet za fizičku kulturu.
17. Tubić, T. (2004). Psihologija i sport. Novi Sad: Fakultet fizičke kulture.
18. Tubić, T. (2009). Psihologija sporta-autorizovane bleške sa seminara za instruktore skijanja. Novi Sad.

123
INFLUENCE OF BACKGROUND MUSIC ON PHYSICAL
PERFORMANCE
Artan Shyti and Egreta Peja Institute for Sport Research, Sport University of Tirana, Albania
Abstract
Background and Aim: We live in a time when technology has brought us closer to music than ever before, enshrining its role in our emotional and social lives. The proposed benefits of music in exercise, sport and other physical activity contexts (e.g., physiotherapy rehabilitation) have intrigued researchers for over 40 years. Yet there are still some inconsistencies remaining. If no strict music selection protocol is applied, it remains uncertain if and to what extent background music influences physical performance as well as physiological traits like the heart rate and the rating of perceived exertion. The aim of this study is to illuminate these inconsistencies. Data Collection and Method: Consenting participants exercised on a cycleergometer following an incremental exercise protocol designed to alter the workload according to time. Heart rate and velocity were recorded every second. At the end of each step, just before workload increment, participants were asked to indicate their perception of effort by reporting a number from the Borg’s Rating of Perceived Exertion Scale. The exercise testing was carried out in two different sessions, with and without background music. Conclusion: Background music has positive influences on both physical performance and physical capacities. Discussion: The results of this study provide further support for the use of background music during physical activity sessions. For people who enjoy their chosen physical activity because it is a stress outlet, a social outgoing, a time for oneself the exercise is often enough but for others listening to music is a simple tool to keep oneself engaged in the activity and motivated to continue.
Keywords: Background music, exercising
Introduction
We live in a time when technology has brought us closer to music than ever before, enshrining its role in our emotional and social lives (DeNora & Bergh). The proposed benefits of music in exercise, sport and other physical activity contexts (e.g., physiotherapy rehabilitation) have intrigued researchers for over 40 years (Costas I. Karageorghis & David-Lee Priest). According to the available scientific evidence, music captures attention, raises spirits, triggers a range of emotions, alters or regulates mood, evokes memories, increases work output, heightens arousal, induces states of higher functioning, reduces inhibitions and encourages rhythmic movement (Terry & Karageroghis). Yet there are still some inconsistencies remaining. If no strict music selection protocol is applied, it remains uncertain if and to what extent background music influences physical activity traits like duration and pace as well as physiological traits like the heart rate and the rating of perceived exertion. The aim of this study is to illuminate these inconsistencies
Method
Participants
The study was carried out in a laboratory setting at the Institute for Sport Research part of the Sport University of Tirana. Participant selection was carried out among students of this university. The 60 selected participants were male, aged from 19 to 27 and native speakers of Albanian. All participants in this study reported previous use of music during exercising.
124
Design and Data Collection
This is a prospective controlled study. The exercise testing that is described below is carried out in two different sessions i.e. with and without background music, by a single group of participants. Participants in this study exercised on a cycleergometer following an incremental exercise protocol designed to alter the workload according to time. The programmed sequence of workload began with 100 Watt and increased by 25 Watt every 3 minutes, up to 175 Watt. The applied exercise protocol automatically terminated based on either the passage of 12 minutes or in exceeding the heart rate alarm value, which was preset to 220 – age. Heart rate and velocity were recorded every second. At the ending of each step, just before workload increment, participants were asked to indicate their perception of effort by reporting a number from Borg Scale for Rating Perceived Exertion. The second session with background music took place, on average 7 days after the first one without background music. Music for the second session was self-selected from personal favorite playlists or by zapping through radio stations. Music was played on a CD player and it was introduced at the same moment as the participants began pedaling.
Methodological limitations
1. We applied no music selection protocol on this study. Participants were responsible for music selection, music volume and music change in relation to the task.
2. The results of this study are not context – dependent because self – selected music was used as background
3. Participants showed signs of distraction while changing music in relation to the task. This might have influenced their overall performance.
Data Analysis
Data were processed with the SPSS statistical package using the t-Test: Two-Sample Assuming Unequal Variances. Four general themes (time duration, speed, rating of perceived exertion and heart rate) were found to be descriptive of the exercise testing with and without background music. In what follows, gathered data is described in detail along with the variables derived from the t-Test.
Results
Based on gathered data it resulted that relative to the control condition (exercise testing without background music), music has positive effects on physical performance by increasing time spent exercising and mean exercise speed as well as on physical capacities at the low and moderate exercise intensities. We didn’t observe any statistically significant improvements in heart rate values and reported ratings of perceived exertion at high exercise intensities. The interpretation of results is based on the estimated mean difference between data obtained from exercising with background music and without background music. It resulted that while exercising with background music, the average RPE and heart rate values were reduced with respectively 10% and 1,9% compared to exercising without background music. Due to these effects a better physical performance was attained. Exercising with background music was associated with a 5,6% increase in time spent exercising and a 2,4% increase in average speed of pedaling. It should be noted that we didn’t apply any music selection protocol while exercising. Participants were responsible for music choices and settings.
Theme 1: Time duration
Table 1.1: Time Duration of both Sessions of the Exercise Testing Time duration Without Background Music
(absolute number) With Background Music
(absolute number) t ≤ 7 min 20 11 7 min < t ≤ 8 min 2 1 8 min < t ≤ 9 min 8 7 9 min < t ≤ 10 min 4 10 10 min < t ≤ 11 min 1 8 11 min < t ≤ 12 min 25 23

125
Table 1.2: t-Test for Time Duration Data Without Background Music With Background Music Mean 96.5 102 Variance 12177.5 8291.6 Hypothesized Mean Difference 0 df 10 t Stat -0.09416 P(T<=t) one-tail 0.463419 t Critical one-tail 1.812461 P(T<=t) two-tail 0.926838 t Critical two-tail 2.228139
Estimated Mean Difference = (102 – 96.5) / 96.5 = 0.056
Theme 2: Pacing
Table 2.1: Pacing of both Sessions of the Exercise Testing Speed Without Background Music
(absolute number) With Background Music
(absolute number) ≥ 90 rpm 4 5 80 – 89 rpm 18 17 70 – 79 rpm 21 27 60 – 69 rpm 10 8 50 – 59 rpm 7 3
Table 2.2: t-Test for Speed Data Without Background Music With Background Music Mean 904 926 Variance 362642.5 606130 Hypothesized Mean Difference 0 Df 8 t Stat -0.04998 P(T<=t) one-tail 0.480682 t Critical one-tail 1.859548 P(T<=t) two-tail 0.961364 t Critical two-tail 2.306004
Estimated Mean Difference = (926 – 904) / 904 = 0.024
Theme 3: Rating of Perceived Exertion (RPE)
Table 3.1: Rating of Perceived Exertion Data from both Sessions of the Exercise Testing RPE = 6 – 10 RPE =11 - 14 RPE = 15 - 17 RPE = 18 - 20
Workload Without music
(abs. nr.)
With music
(abs. nr.)
Without music
(abs. nr.)
With music
(abs. nr.)
Without music
(abs. nr.)
With music
(abs. nr.)
Without music
(abs. nr.)
With music
(abs. nr.) 100 Watt 48 51 12 9 0 0 0 0 125 Watt 30 32 14 16 6 8 0 0 150 Watt 0 0 8 5 14 35 18 19 175 Watt 0 0 0 0 0 0 30 41
Table 3.2: Average RPE Data from the Exercise Testing
Average RPE Without Background Music (absolute number)
With Background Music (absolute number)
RPE = 6 – 10 15 29 RPE = 11 - 14 26 23 RPE = 15 - 17 19 8 RPE = 18 - 20 0 0

126
Table 3.3: t-Test for Rating of Perceived Exertion Data Without Background Music With Background Music Mean 209.25 187 Variance 28060.91667 22134.66667 Hypothesized Mean Difference 0 df 6 t Stat 0.198621958 P(T<=t) one-tail 0.424558876 t Critical one-tail 1.943180274 P(T<=t) two-tail 0.849117751 t Critical two-tail 2.446911846
Estimated Mean Difference = (187 – 209.25) / 209.25 = - 0.1
Theme 4: Heart Rate
Table 4.1: Heart Rate Data from both Sessions of the Exercise Testing ≤ 60% HRmax 60% - 70%
HRmax 70% - 80%
HRmax 80% - 90% HRmax 90% - 100%
HRmax
Workload Without music
(abs nr)
With music (ab nr)
Without music
(abs nr)
With music (ab nr)
Without music
(abs nr)
With music (ab nr)
Without music
(abs nr)
With music (absnr)
Without music
(abs nr)
With music (ab nr)
100 W 50 15 10 21 0 24 0 0 0 0 125 W 13 20 18 30 19 10 10 0 0 0 150 W 0 0 0 0 3 0 11 31 16 18 175 W 0 0 0 0 0 0 2 0 28 41
Table 4.2: Average Heart Rate Data from the Exercise Testing Average HR Without Background Music
(absolute number) With Background Music
(absolute number) HR≤ 60% HRmax 5 16 60%HRmax - 70% HRmax 53 39 70%HRmax - 80% HRmax 2 5 80%Fkmax - 90% HRmax 0 0 90%HRmax - 100% HRmax 0 0
Table 4.3: t-Test for Heart Rate Data Without Background Music With Background Music Mean 834 818 Variance 2600480 1297220 Hypothesized Mean Difference 0 df 7 t Stat 0.018122 P(T<=t) one-tail 0.493024 t Critical one-tail 1.894579 P(T<=t) two-tail 0.986047 t Critical two-tail 2.364624
Estimated Mean Difference = (818 – 834) / 834 = - 0.019

127
Discussion
Although the number of studies investigating the effects of music on physical activity has swelled considerably, we decided to take such an initiative because we felt that scientific research studies by applying strict music selection protocols might not show the real influence of music on physical activity in everyday life. That is why we chose to apply no music selection protocol in this study. Participants were responsible for music selection, music volume and music change in relation to the task. There were no rigid criteria for being part of this study. The only required criterion for the participants was previous use of music during exercising. Physiological arousal was measured by heart rate. The psychophysical effects of music, which concern the subjective perception of physical effort and fatigue, were assessed by the Borg’s Ratings of Perceived Exertion (RPE) scale. Physical performance was assessed based on changes of pace and duration of physical activity in sessions with and without background music. We chose to play music on a CD player because participants in the study reported it, as the most common used tool to listen to music while exercising. Participants were asked to make their music selections as they did while exercising. They chose both personal favorite playlists and zapping through radio stations.
After completing the session with background music, participants were interviewed regarding their music selections. They reported shifting to faster music when greater effort to complete the task was required. This finding correlates with the assertion that the more arousal a situation requires, the more preference will be afforded to stimulative music (Rendi & Szabo). Anyway, although music may change how one interprets or responds to sensations of high exertion, it does not have the power to alter the perceptions of fatigue when exercising at a very high intensity (Hardy & Rejeski). As a matter of fact from our data analysis it resulted that relative to the reported values of RPE during the session without background music, music reduced RPE only at the low and moderate exercise intensities but not at the high ones. According to Karageorghis, it is not possible to distract exercisers from the fatigue induced by high-intensity exercise but music can change their perception of this fatigue toward a more positive evaluation. In fact the average RPE values reported during exercising with background music were approximately 10% lower than those reported during the control session, without background music. We observed more moderate improvements in the average heart rate values compared to average RPE values because exercising to music can’t modify the acknowledged predominance of physiological as opposed to psychological cues at higher intensities (Pujol & Langenfeld). Music selections among participants showed great variability regarding rhythm, melody, pitch, harmony and interval. According to John Sloboda, a pre-eminent music psychologist, music’s influence is entirely contingent upon the listening context and the experiences and preferences of the listener. A personal association can occur when a piece of music reminds an exerciser about an aspect of their own lives that is emotionally significant (Priest & Karageorghis).
Based on the above mentioned findings, we recommend self-selected music to promote increased exercise adherence. For people who enjoy their chosen physical activity because it is a stress outlet, a social outgoing, a time for oneself the exercise is often enough but for others listening to self-selected music is a simple tool to keep oneself engaged in the activity and motivated to continue.
References
1. DeNora & Bergh, 2009 in Costas I. Karageorghis & David-Lee Priest (2012): Music in the exercise domain a review and synthesis (Part I), International Review of Sport and Exercise Psychology, 5:1, 44
2. Costas I. Karageorghis & David-Lee Priest (2012): Music in the exercise domain a review and synthesis (Part I), International Review of Sport and Exercise Psychology, 5:1, 44
3. Karageorghis,2008; Lucaccini & Kreit, 1972; Terry & Karageroghis, 2011 in Costas I. Karageorghis & David-Lee Priest (2012): Music in the exercise domain a review and synthesis (Part I), International Review of Sport and Exercise Psychology, 5:1, 45
4. Pujol & Langenfeld (1999) in Costas I. Karageorghis & David-Lee Priest (2012): Music in the exercise domain a review and synthesis (Part I), International Review of Sport and Exercise Psychology, 5:1, 53

128
5. Rendi & Szabo, 2008 in Costas I. Karageorghis & David-Lee Priest (2012): Music in the exercise domain a review and synthesis (Part I), International Review of Sport and Exercise Psychology, 5:1, 50
6. Sloboda 2008 in Costas I. Karageorghis & David-Lee Priest (2012): Music in the exercise domain a review and synthesis (Part I), International Review of Sport and Exercise Psychology, 5:1, 47- 48
7. Priest & Karageorghis, 2008 in Costas I. Karageorghis & David-Lee Priest (2012): Music in the exercise domain a review and synthesis (Part I), International Review of Sport and Exercise Psychology, 5:1, 46
8. Karageorghis et al, 2009 in Costas I. Karageorghis & David-Lee Priest (2012): Music in the exercise domain a review and synthesis (Part I), International Review of Sport and Exercise Psychology, 5:1, 48
9. Hardy & Rejeski, 1989 in Costas I. Karageorghis & David-Lee Priest (2012): Music in the exercise domain a review and synthesis (Part I), International Review of Sport and Exercise Psychology, 5:1, 48

129
VALIDITY OF DIFFERENT KINEMATICAL METHODS FOR
ASSESING KNEE ANGLE DURING CYCLING
Borut Fonda1 2, Nejc Sarabon2 3 and François-Xavier Li1 1 University of Birmingham, School of Sport and Exercise Sciences,
Birmingham, United Kingdom 2 S2P, Science to Practice, Ltd., Laboratory for Motor Control and Motor Behaviour,
Ljubljana, Slovenia 3 University of Primorska, Science and Research Centre, Institute for Kinesiology Research,
Koper, Slovenia
Abstract
Bike fitting is an important process to adjust the geometry of the bike to the needs of the cyclist. Seat height is usually the first parameter altered in the procedure. The most common bike fitting method to set the seat height is based on the knee angle when the pedal is in its lowest position, i.e. bottom dead centre (BDC). Knee angle between 25 and 35 degrees when pedal is in the BDC has been linked to a reduction of knee injuries. Bike fitting guidelines do not specify what method to measure knee angle should be used.However, there may be large variations between the methods used, e.g. between dynamic or static measurement. Therefore, the aim of this study was to compare three dynamical methods among each other and against static measure. Thirteen trained cyclists performed three 3-minute trials at different seat heights according to knee angle in BDC measuredwith a static goniometer (25°, 30° and 35°). 13 Thirteen infrared cameras (Vicon system, 250 Hz), high-speed camera (300 Hz), and dynamic goniometer (1000Hz) were used to measure the knee angle during pedaling when pedal was in BDC. Statistically significant differences were found among all three dynamical methods. All three methods have also been found to be substantially different compared to the static measure. In conclusion different kinematic methods induce variation inknee angle measurement. Bike fitting experts should take into account the method used when interpreting knee angle as a parameter in seat height adjustment.
Keywords: 2D kinematics, 3D kinematics, goniometers, static measurement
Introduction
Bike fitting is an important process to adjust the geometry of the bike to the needs of the cyclist. Optimal bicycle rider position may be considered as a position in which a numberof variables – suchas exercise economy, mechanical/metabolic efficiency, and comfort –interactin a complex manner to minimise resistive forces and maximum bicycle velocitywhile at the same time reduce the risk of injury occurrence (Iriberri, Muriel, & Larrazabal, 2008).Based on these variables, numerous methodologies have been proposed to set the bicycle geometry (Burke, 1994, 2002, 2003; Holmes, Pruitt, & Whalen, 1994; Iriberri et al., 2008; Nordeen-Snyder, 1977).
Seat height is usually the first parameter set in the procedure of bike fitting. Various methods have been proposed to do that. The first method is to set the seat height (seat height defined as a distance between the pedal axle and top of the seat) at 109% of inseam(Hamley & Thomas, 1967) or as recently revised, at108.6–110.4% of inseam (Ferrer-Roca, Roig, Galilea, & García-López, 2012). Second one is toset the seat height(seat height definedas a distance between the centre of the bottom bracket and top of the seat)at 88.3% of inseam(LeMond & Gordis, 1990). The third method is to set seat height by placing the heel of the foot on the pedal and extension-locking the knee with thepedal at the bottom of the stroke when cyclist is sitting on the seat.In order to minimize the risk for injury occurrence, Holmes et al. (1994) proposed to set the seat height to the level where knee angle, when the pedal is in its lowest position, i.e. bottom dead centre (BDC), is between 25 and 35 degrees.

130
Peveler, Bishop, Smith, Richardson, and Whitehorn (2005) showed that these methods vary significantly among each other. To ensure that the knee angle falls within the 25-35° knee angle,authors recommend direct knee angle measurements.Based on these recommendations, numerous studies on biomechanics of cycling at different seat heights used knee angle as standardization of the seat height(Bini, 2012; Bini, Hume, & Crofta, 2011; Bini, Tamborindeguy, & Mota, 2010; Peveler, Pounders, & Bishop, 2007). Furthermore, even commercially available bike fitting systems are using knee angle as a parameter based on which the seat height is set.
Although range for knee angle has been well defined for optimal seat height, the method of knee angle measurements has not yet been specified. Knee angle can be measured statically, when rider puts the pedal in the BDC and the assessor measures the knee angle with standard manual goniometer, or dynamically by using 2D video analysis, electrogoniometer or 3D kinematics. Therefore, the aim of this study was to compare three dynamical methods among each other and against the static measure. Our hypothesis was that methods provide significantly different results.
Method
A total of 13 subjects ([mean ± SD] age 23.3 ± 2.8 years, body weight 71.6 ± 6.9 kg, body height 179.8 ± 6.1 cm) were recruited from University’s cycling club. The cyclists’ fitness level ranged from recreational to trained (riding between 5 and 20 hours per week). Before participation each subject signed an informed consent form which was approved by the University of Birmingham ethical committee.
Subjects were required to visit the laboratory on two occasions. The first involved an incremental test to exhaustion in order to determine maximal aerobic power. Subjects started pedalling at 100 W at self-selected cadence higher than 60 rpm. Resistance was increased by 25 W every 1 min, until the subject reached volitional exhaustion or cadence dropped below 60 rpm. Maximal aerobic power was noted as the highest power output at which pedalling was maintained for at least 30 s. This test was performed to standardize the intensity for the second occasion.
The second test was performed at least 48 h after the incremental test. After the warm up (5 min at 150 W, self-selected cadence), each subjected completed three 5-min trials with different seat heights at 65 % of maximal aerobic power. Seat height was adjusted according to the knee angle when the pedal was in the BDC. Saddle heights corresponded to knee angle values of 25° (LOW), 30° (MID) and 35° (HIGH) measured with standard manual goniometer. Subjects were instructed to maintain constant cadence and to adapt their body position as they would in real life conditions.
Both test sessions were performed on the electro-magnetically braked cycle ergometer (Lode Excalibur Sport, Lode, Groningen, NL). In the second test, 3D data were captured using a Vicon MX motion analysis system (Oxford Metrics Ltd., Oxford, UK) with 13 cameras recording with a sampling rate of 250 Hz and calibrated with residual error less than 1 mm. Retro-reflective markers were attached with double-sided adhesive tape by the same tester to limit inter-tester variability and were placed over the greater trochanter, the lateral femoral condyle, and the lateral malleolus. Further, reflective markers were placed on the pedal spindle and crank centre of the bicycle ergometer to identify crank position during post-processing. One high-speed camera recording with a sampling rate of 300 Hz (Casio Exilim Pro EX-F1, Dover, NJ, USA) waspositioned perpendicular to the subjects from a distance of 4 m. Electrogoniometer (Biometrics Ltd., Newport, UK) operating at a sampling rate of 1000 Hz was attached with double sided adhesive tape to the right leg with one side attached to the middle of the shank (line between lateral malleolus and head of fibula) and with other to the middle of the thigh (line between lateral femoral condyle and greater trochanter). Synchronization between Vicon system and goniometer was established through A/D card (National Instruments, Austin, TX, USA).
Analyses of 3D kinematic data were performedusing custom written algorithms (MATLAB, MathWorks, Natick, MA, USA). 3D Kinematic data were low-pass filtered using a fourth-order Butterworth filter with a cut-off frequency of 12 Hz. Knee angles for each trial were obtained by dividing data into individual crank cycles using the BDC pedal position determined as the point at which the pedal reflective marker reached its minimal vertical position, i.e. 180°. Knee angle from 2D kinematic data, when pedal was in the BDC position, was extracted (Kinovea 0.8.15). Data from the goniometer were acquired and analysed with custom written software (Labview, National Instruments, Austin, TX, USA). Crank angle from 3D kinematic data has been up-sampled to 1000 Hz and merged with knee angle data

131
from the goniometer in order to calculateknee angle when pedal was in the BDC position. For each trial and each method, the average of 15 consecutive cycles was taken forfurther analysis from each kinematic method. All data is presented here as mean ± standard deviation. Two-way repeated measures ANOVA was used to test for method (3) x seat height (3) interaction and differences among methods at different seat heights. Statistical analysis was performed using SPSS V.20 (IBM Corporation, Somers, NY) with levels of significance set to p < 0.05.
Results
Methods were statistically significantly different at different seat heights (main effect: F = 26.113; p = 0.000;η2
partial = 0.731) with statistically significant interaction (F = 4.449; p = 0.005; η2partial = 0.681). Post
hoc comparisons revealed that electrogoniometer substantially underestimated the knee angle and showed significantly lower angle values compared to 2D and 3D kinematic methods at all seat heights (Figure 1). 2D and 3D kinematics were statistically significantly different only at the LOW seat height (p = 0.019).
Figure 1: Knee angle when the pedal is in bottom dead centre (BDC) measured with 2D kinematics with high-speed camera (black columns), 3D kinematics with Vicon system (striped column), and electric goniometer (white columns). Dashed horizontal lines represent the angle based on which the seat height has been set with static goniometer. * =Bonferronipost hoc (p < 0.05).
All knee angles data measured with dynamic methods were substantially different compared to static measures which were used to set the seat height. Static measure underestimates the knee angle compared to 3D and 2D kinematics, while overestimates the knee angle compared to electrogoniometer.
Discussion
The aim of this study was to compare three dynamical methods to assess knee angle during cycling at different seat height among each other and against a static measure. We have confirmed our hypothesis by showing that methods vary significantly when compared among each other. Furthermore, all methods were substantially different when compared to static goniometer measurement.
Bike fitting experts are using different methodological approaches when setting the seat height. It is generally agreed, that dynamical methods provide better, more realistic, and more exact results than static methods do. Study by Ferrer-Roca et al. (2012) compared a static (anthropometric measurements)
132
vs. a dynamic method (2D analysis) to adjust the seat height. They concluded that seat height was outside of the recommended range (106–109% of inseam length) in 56.5% of the subjects. Furthermore, inappropriate knee flexion angles using the dynamic method were observed in 26% of subjects. Therefore, in order to set the seat height according to knee angle, direct measurements of knee angles should be adopted instead of equations based on anthropometric data.
We have shown that even direct knee angle measurements can vary when using different methods. One could suspect that 3D kinematics is the most valid method in assessing movement kinematics since it is taking into account movement in three–dimensional space. One big advantage is also automatic tracking by using retro-reflective markers which reflect infra-red light and is therefore more precise than 2D analysis with high-speed camera where examiner needs to manually click on the anatomical spot to measure the angle or electrogoniometer which is more susceptible to skin movement artefact.
Electrogoniometers are being regularly used in clinical practice and were found to provide accurate and reliable measure of knee angles when using standardised protocol (Piriyaprasarth, Morris, Winter, & Bialocerkowski, 2008; Rowe, Myles, Hillmann, & Hazlewood, 2001). However, to the authors’ knowledge, studies using electrogoniometers to measure knee angle during cycling have not been previously published. We have observed that electrogoniometer significantly underestimates the knee angle when the pedal is in the BDC, compared to 3D kinematics and 2D kinematics using Vicon system and high-speed camera, respectively. 2D analysis with high-speed cameras has been frequentlyused in human movement analysis before introducing novel 3D systems. In fact, the vast majority of cycling studies on bike fitting have been using 2D kinematics with high-speed camera (Ericson, 1986; Nordeen-Snyder, 1977).Our results also indicate that using reasonably priced high-speed camera and open source software for post-hoc analysis do not provide the same results on knee angle compared to more expensive 3D kinematic systems.
Since we have shown that dynamic methods for bike fitting vary significantly, future research should focus on establishing guidelines for each method separately in order to provide scientific recommendations to bike fitting experts. Research should also focus on other methodological aspects of bike fitting methods, such as reliability and accuracy.
Acknownledgements
Author would like to acknowledge the support of Slovene Human Resources Development and Scholarship Fund.
References
1. Bini, R. (2012). Patellofemoral and tibiofemoral forces in cyclists and triathletes: effects of saddle height (Vol. 1).
2. Bini, R., Hume, P., & Crofta, J. (2011). Effects of saddle height on pedal force effectiveness. Procedia Engineering, 13(0), 51-55. doi: 10.1016/j.proeng.2011.05.050
3. Bini, R., Tamborindeguy, A., & Mota, C. (2010). Effects of saddle height, pedaling cadence, and workload on joint kinetics and kinematics during cycling. Journal of Sport Rehabilitation, 19(3), 301-314.
4. Burke, E. R. (1994). Proper fit of the bicycle. Clinics in Sports Medicine, 13(1), 1-14.
5. Burke, E. R. (2002). Serious Cycling - 2nd Edition (2 ed.). Human Kinetics.
6. Burke, E. R. (2003). High-Tech Cycling - 2nd Edition (2 ed.). Human Kinetics.
7. Ericson, M. (1986). On the biomechanics of cycling. A study of joint and muscle load during exercise on the bicycle ergometer. Scandinavian Journal of Rehabilitation Medicine. Supplement, 16, 1-43.
8. Ferrer-Roca, V., Roig, A., Galilea, P., & García-López, J. (2012). Influence of Saddle Height on Lower Limb Kinematics in Well-Trained Cyclists: Static Vs. Dynamic Evaluation in Bike Fitting. The Journal of Strength & Conditioning Research, 26(11), 3025-3029.

133
9. Hamley, E. J., & Thomas, V. (1967). Physiological and postural factors in the calibration of the bicycle ergometer. The Journal of Physiology, 191(2), 55P-56P.
10. Holmes, J. C., Pruitt, A. L., & Whalen, N. J. (1994). Lower extremity overuse in bicycling. Clinics in Sports Medicine, 13(1), 187-205.
11. Iriberri, J., Muriel, X., & Larrazabal, I. (2008). The Bike Fit of the Road Professional Cyclist Related to Anthropometric Measurements and the Torque of de Crank (P242) The Engineering of Sport 7 (pp. 483-488).
12. LeMond, G., & Gordis, K. (1990). Greg LeMond's Complete Book of Bicycling: Perigee Books.
13. Nordeen-Snyder, K. S. (1977). The effect of bicycle seat height variation upon oxygen consumption and lower limb kinematics. Medicine and Science in Sports, 9(2), 113-117.
14. Peveler, W., Bishop, P., Smith, J., Richardson, M., & Whitehorn, E. (2005). Comparing Methods for Setting Saddle Height in Trained Cyclists. Journal of Exercise Physiology Online, 8(1).
15. Peveler, W., Pounders, J., & Bishop, P. (2007). Effects of saddle height on anaerobic power production in cycling. J Strength Cond Res, 21(4), 1023-1027. doi: 10.1519/r-20316.1
16. Piriyaprasarth, P., Morris, M. E., Winter, A., & Bialocerkowski, A. E. (2008). The reliability of knee joint position testing using electrogoniometry. BMC Musculoskelet Disord, 9, 6.
17. Rowe, P. J., Myles, C. M., Hillmann, S. J., & Hazlewood, M. E. (2001). Validation of Flexible Electrogoniometry as a Measure of Joint Kinematics. Physiotherapy, 87(9), 479-488.

134

135
EFFECT OF PLYOMETRIC TRAINING ON CHANGES IN THE LEVEL
OF SPEED SKILLS AND AGILITY OF FOOTBALL PLAYERS
Tibor Balga and Eugen Laczo Faculty of Physical Education and Sports, Comenius University.
Bratislava, Slovakia
Abstract
The aim of our work was to investigate the effect of specific plyometric training on changes in the level of speed skills and agility of football players. Our research proceeded as one group time-gradual experiment. Thirteen young football players, the members of OFK club Dunajská Lužná, participated in this study. 6-week plyometric training program was applied during the experimental period. At the same time the structure of sports performance has been recorded during control and experimental period to register the content of football trainings. 4 variables were used for measurements of speed skills and agility. Basic statistic methods and Wilcoxon T-test were used to process and evaluate the data. The results have shown positive effect of 6-week plyometric training on speed skills and agility.
Keywords: plyometrics exercises, speed skills, agility, football.
Introduction
After watching champions league, European or world championships matches one could see that those players who promoted the game to a substantially higher speed level achieve the highest score. Speed thus becomes an important performance factor. Because football players perform lots of cyclic and acyclic movements (with and without the ball) during the game, the quality of these actions needs to be maximal.
Speed skills belong to the most distinguished characteristics of football and nowadays there is a growing demand among youth professional football teams for the improvement of players’ speed skills. The players perform explosive movements such as kicks, attacks, jumps, sprints and rotations which require strong and fast muscles of lower extremities.
There are various means of improving the speed skills. Plyometrics seems to be a very effective method of training for strength, speed and mainly explosive skills. This type of training is based on extending and shortening and is characterised by an abrupt deceleration (eccentric contraction) followed by an as fast as possible change of direction (concentric contraction). This principle is applied within sports that integrate running, jumping and changing the direction of motion into the natural movements (Vanderka, 2006). Considering the fact that soccer requires these explosive movements and speed skills, plyometrics is a very suitable training method.
Miller et al. (2006) found out found out a statistically significant positive effect of plyometrics training on performance of 3 agility tests (T-test, Illinois agility test, Force plate test). In English-speaking countries these tests represent a tool for diagnosing the reaction skills (‘testy agility’ in Slovak) and they are also used to test speed skills wit a change of movement direction. Because multiple changes of movement direction during running of high intensity is typical of football, we used T-test for diagnosing this speed skill.

136
Method
We used a one-group time sequential experiment with one experimental factor which lasted 12 weeks (fig. 1). 13 football players of OFK Dunajská Lužná youth team (mean age 15,54 years; mean height 177,7 ± 14 cm; mean weight 67,70 ± 6,27 kg) participated in this study.
Fig. 1 : Research situation model.
Experimental factor of this study was a 6-week plyometrics training of lower extremities. The training contained horizontal and vertical countermovement jumps, either repeated or performed after single jump off, lasting approximately 20 to 25 minutes.
The subjects followed the training 3 times per week. The study consisted of 18 training units of plyometrics. The plyometric exercises were always performed at the beginning of the training unit - right after the warm-up.
The plyometrics training consisted of the following exercises: 1) Cycled Split Squat Jump 2) Squat jump 3) Double Leg Knee Tuck Jump 4) Single Leg Vertical Power Jump 5) Double Leg Vertical Power Jump 6) Ankle Hops 7) Single Leg Speed Hop 8) Skater Bounds (metkalfy) 9) Alternate Leg Bunding 10) Lateral Obstacle Jump 11) Front Obstacle Jump 12) Reactive Jumps, Sprint 13) Box Jumps 14) jump-skip obstacles
The experimental period was preceded by a control one which started after the initial measurements and lasted 6 weeks. The control period was a typical football training during which the players concentrated mainly on the development of playing actions and combinations as well as on the strengthening of torso muscles. To get the empirical data we used methods of measuring, testing and recording of the training of general and specific training markers. For the purpose of diagnosing those speed skills which are typical of soccer match we used 50m run, 30m run, 10 x 5m shuttle run and T-test.
The results were analysed by the basic logical methods (analysis, synthesis, deduction and induction). The empirical data from pre-, mid- and post-measurements were processed and analysed by means of basic statistical characteristics and comparative analysis (nonparametric Wilcoxon T-test). The significance level was set at p ≤ 0,01 and p ≤ 0,05.

137
Results
The speed skills of control and experimental period differed among the tests used. Table 1 shows the statistical characteristics of performance markers during speed skills tests.
Table 1 : Statistical characteristics of performance markers during speed skills tests
50 m run 30 m run 10 x 5 m shuttle run T-test agility
(s) (s) (s) (s)
t0 t1 t2 t0 t1 t2 t0 t1 t2 t0 t1 t2 Me 7,26 6,98 6,86 4,57 4,53 4,31 17,01 16,67 16,13 11,80 11,61 11,23 X 7,247 7,096 6,824 4,572 4,491 4,345 17,17 16,74 16,04 12,00 11,75 11,35 Vr 1,41 1,63 1,28 0,72 0,77 0,61 1,83 1,51 1,06 1,96 1,68 1,25
Xmax 7,89 7,89 7,39 4,92 4,92 4,70 18,25 17,61 16,58 13,06 12,65 12,03 Xmin 6,48 6,26 6,11 4,20 4,15 4,09 16,42 16,10 15,52 11,10 10,97 10,78
50 m sprint: The performance of 50 m sprint improved significantly (p ≤ 0,01) after the 6-week training at the end of control and experimental period. Figure 2 shows statistically significant (p ≤ 0,05) difference between the increments of control and experimental period which proves the effect of the experimental factor on development of this skill.
Fig. 2 : Comparison of the average increments during 50m run.
30 m sprint: The performance of 30 m sprint improved significantly (p ≤ 0,01) during both control and experimental period. The increments depicted in figure 3 show that the effect of the experimental factor is more pronounced during 30m run. The average performance improvement was 0,082s in case of the control period and 0,146s in case of the experimental period.
Fig. 3 Comparison of the average increments during 30m run.
Acceleration speed is typical of middle field players playing around excessive vertical line, so called excessive halfbacks, as well as of offensive players. Using Wilcoxon T-test we found statistically significant differences between the increments of control and the increments of experimental period (p ≤

138
0,05) and so we can conclude that the experimental factor was effective in the improvement of acceleration speed.
10 x 5m shuttle run: Fig. 4 depicts the difference between the increments at the end of control and experimental period. The increments after the experimental period were statistically higher than the increments after the control period (p ≤ 0,01). Our experimental factor showed a positive effect also on this type of exercise. Soccer players perform activities of maximal exercise intensity with multiple changes of running direction almost all the time during the game.
Fig. 4 : Comparison of the average increments during 10 x 5 m shuttle run.
T-test agility : Also T-test proved statistically significant improvement (p ≤ 0,01) of speed skills after both control and experimental period. The comparison of initial and final measurements of both periods shows improvement of average performance. However the overall increments at the end of experimental period were better than after the control period.
Fig. 5 : Comparison of the average increments during T-test agility.
The average improvement after the control period was 0,252s and the average increments during the experimental period were more pronounced - 0,398 s. Using Wilcoxon T-test we found statistically significant differences between the increments of control and experimental period (p ≤ 0,01).
Discussion
The results prove our experimental factor, consisting of plyometric exercises, to be an effective tool for improving the level of speed skills. In case of 50m and 30m run there was 5% statistical significance between the increments after control and experimental period and in case of shuttle run and T-test we found out 1% statistical significance between the increments after control and experimental period.
The improvement of the T-test performance as a result of plyometric training is similar to the results of Miller et al. (2006). They did a typical two-group experiment as they included various plyometric exercises into 2 training units. In each training unit the subjects performed 90 to 140 repetitions of these exercises. Similarly the works of Adams et al. (1992) and Shaji, Isha (2009) show speed skills and agility improvements.

139
We conclude that the results of our study prove its hypothesis and it is mainly because of the involvement of specific plyometric training programme into the experimental training period. We assume that the positive effect is the result of proprioceptive and neuromuscular adaptation, the use of flexible spring system and the increase of strength gradient.
The results of our study show that plyometric exercises are effective in the development of speed skills and agility in football players.
References
1. Adams, K., O´Shea, J.P., O´Shea, K.L., & Climstein, M. (1992). The effects of six weeks of squat, plyometrics, and squat-plyometric training on power production. Journal of Applied Sport Science Research, 6(1), 36–41.
2. Horička, P. (2009). Plyometrické cvičenia ako prostriedok rozvoja odrazovej výbušnosti. In Športový edukátor Univerzita Konštantína Filozofa v Nitre, 2, 2, 43-51.
3. Laczo, E. (2004). Uplatnenie metódy plyometrie na rozvoj výbušnej sily v jednoročnom tréningovom cykle. In Zborník prednášok zo vzdelávacích aktivít národného športového centra, (136-139). Liptovský Mikuláš : GRAFON dtp štúdio.
4. Miller, G.M., Herniman, J.J., Ricard, M.D. Cheatham, C.C., & Michael, T.J. (2006). The effects of 6-week plyometric training program on agility. Journal of Sports Science and Medicine, 5(3), 459-465.
5. Shaji, J., & Isha, S. (2009). Comparative analysis of plyometric training program and dynamic stretching on vertical jump and agility in male collegiate basketball player. Al Ameen Journal of Medical Science, 2(1), 36–46.
6. Vanderka, M. (2006). Teoretické východiská a možnosti využitia plyometrie v kondičnej príprave športovcov. In Atletika 2006, (196-206). Bratislava: ICM Agency.
7. Zemková, E., Hamar, D. (2004). Výskokový ergometer v diagnostike odrazových schopností dolných končatín. Bratislava: Peter Mačura – PEEM.

140

141
WHOLE-BODY CRYOTHERAPY FOR RECOVERY AFTER
PLYOMETRIC EXERCISE
Borut Fonda1,2 and Nejc Sarabon1,3
1 S2P Ltd., Laboratory for Motor Control and Motor Behaviour, Ljubljana, Slovenia 2 School of Sport and Exercise Sciences, University of Birmingham, United Kingdom
3 University of Primorska, Science and Research Centre, Institute for Kinesiology Research, Koper, Slovenia
Abstract
The purpose of this study was to examine the effects of whole-body cryotherapy (WBC) on pain and performance parameters during the 5-day recovery period after intensive plyometric exercise. Eleven male subjects completed a bout of plyometric exercise for the hamstring muscles on two separate occasions (control and experimental condition) separated by 10 weeks. The experimental condition consisted of WBC every day during the recovery period. WBC included single 3-minute daily exposures to low temperatures (-140 to -195 °C) in the cryo-cabin. During the recovery period, subjects were tested for perceived pain sensation, maximal isometric torque production and maximally explosive isometric torque production. There was a significant interaction between the control and WBC conditions for: maximal torque production, and the rate of torque development. Pain and performance measures indicated substantial differences between the WBC and the control condition after the exercise. Results of this study are supportive to the use of WBC for recovery enhancement after strenuous training.
Keywords: EIMD, DOMS, regeneration, performance
Introduction
After unaccustomed exercise, a sensation of discomfort within skeletal muscle, accompanied by a decrease in muscle force, range of motion and physical performance, can appear in elite or novice athletes (Proske & Morgan, 2001). This sensation also referred to as delayed onset muscle soreness is one of the most common recurrent forms of sports injury and is associated with exercise-induced muscle damage (EIMD).
The question of whether to use any recovery modality when a muscle has been damaged after strenuous exercise has been repeatedly addressed (Barnett, 2006; Bleakley et al., 2012) though the data on which modality to use for recovery is inconclusive. Cryotherapy has gained increasing popularity as a means of improving recovery after strenuous training (Barnett, 2006; Bleakley et al., 2012; Leeder, Gissane, van Someren, Gregson, & Howatson, 2012). It can be administered in a number of different ways (locally or more generally) and is frequently purported to reduce symptoms that are apparent following a damaging bout of exercise. Recently, a new form of cryogenic therapy, called whole-body cryotherapy (WBC), has been offered to athletes as an alternative to cold water immersion or other cold exposure (Banfi, Lombardi, Colombini, & Melegati, 2010). WBC involves exposing minimally dressed participants to very cold air (-110 °C), either in a specially designed chamber for a short period of time, or in a specially designed cabin, in which the head and hands are not exposed. In sports medicine, WBC has gained wider acceptance as a method to improve recovery from muscle injury.
To the authors’ knowledge, only the studies by Costello, Algar, and Donnelly (2012) and Hausswirth et al. (2011) examined the effects of WBC on performance measures (isometric muscle strength) after EIMD. They reported inconsistent results of WBC as a recovery modality after damaging exercise. Therefore, the aim of the present study was to examine the effects of WBC on biochemical markers, pain and performance parameters during a 5-day recovery period after a damaging plyometric

142
exercise. It has been hypothesized that WBC would have beneficial effects on muscle recovery after such an exercise bout.
Method
Eleven healthy young male adults (age [mean ± SD] 26.9 ± 3.8 years, height 184.5 ± 7.7 cm, and weight 90.5 ± 3.8 kg)who were regularly involved in moderate physical activity (agility and endurance) participated in this study. The interview, during which the details of the study were presented, was carried out prior to the start of the experiment. The study was approved by the Slovenian Medical Ethics Committee (Approval no. 108/01/12) and all subjects signed a statement of informed consent at enrolment.Subjects were randomly assigned into two groups and exposed to a crossover study design. The experiment was performed on two separate occasions whereby one group undertook the WBC condition (experimental condition) in the first session, while the other group did not use the recovery modality (control condition). After ten weeks, on the next occasion, the groups were changed and the second group performed the WBC, while the first group underwent the control condition.
One day before the damaging exercise, subjects were tested for baseline values. The next day each subject performed a bout of plyometric exercise consisting of drop jumps and leg curls (i.e. damaging protocol). Damaging protocol consisted of five sets of 10 drop jumps from a 0.6 m box with an emphasis on hip flexion-extension movement (range of motion ~100°) were performed. Subjects were instructed to execute active amortization and maximally explosive push-off. Drop jumps were followed by five sets of 10 repetitions of bilateral leg curls (75% of concentric 1RM) in the prone-lying position (hips at 20° flexion). Leg curl range of motion was ~90°, with fast eccentric-concentric coupling at ~10° knee flexion angle. Finally, an additional set of 10 repetitions of eccentric leg curls (130% of concentric 1RM; 3-second eccentric action with manually assisted lift) was performed in the same position. The series of drop jumps and leg curl exercises were separated by one-minute breaks. During the WBC condition subjects performed the WBC one hour after the damaging exercise and at the same time of the day for the next six days. For each WBC a subject was exposed for three minutes to low temperatures (from -140 to -195 °C) using a cryo-cabin (model: Space Cabin; Criomed, Ltd, Kherson, Ukraine). The feet were protected with warm shoes, while the hands and head were not exposed. The subjects were instructed to turn around continuously in the cabin as recommended by the manufacturer. All dependent variables were taken after the WBC.
Perceived pain sensation was assessed using a 10 cm visual analogue scale from 0 to 10, with 0 indicating no pain and 10 indicating severe pain. Precision of the scale was 1 centimeter. Maximal torque production and explosive contractions were performed on a static knee flexion measurement dynamometer bench (S2P Ltd., Ljubljana, Slovenia). Subjects were positioned prone on the bench with hip flexion of 45° and knees fixed at 60° of flexion. All tests were performed bilaterally. Custom-made software developed in LabVIEW 2010 (National Instruments, Austin, Texas, USA) was used for acquisition and analysis of the signals. The force signal was acquired at 1000 Hz and 20 Hz low-pass filtered (2nd order Butterworth).For the voluntary maximal torque production, the peak average torque on a one-second time interval was calculated. Maximally explosive contractions of knee flexion were performed to evaluate the rate of torque development in the first 200 ms (start of torque rise at 3% of peak). Out of the three repetitions the repetition with the highest value was used for later analysis.Descriptive statistics were used for variables of pain sensation. Differences in other measured variables between conditions and trials were analyzed with 2-way repeated measure ANOVA (Treatment (2) x Time (7)), using treatment as the inter-subject factor and time as the intra-subject factor. Bonferronipost hoc tests were performed for each parameter to test for significant change for each day compared to baseline values and for significant change between groups for each day separately. The level of significance for all tests was set at p < 0.05. All statistical analyses were performed using the IBM SPSS statistics 19.0 software (Armonk, NY, USA).

143
Results
Absolute data for all dependent variables are presented in Table 1. There were no statistically significant changes in baseline values between the two conditions for any of the measured parameters. A substantial difference was observed between the conditions for pain sensation during rest and during squat. Values of both pain sensation tests differed substantially between the control and WBC condition 1 to 72 hours after the exercise. At all of these time points pain values for the WBC condition were lower compared to the control condition, with the differences peaking at 48 hours after the exercise. There was a statistically significant interaction between the conditions for maximal torque production (F = 2.321; p = 0.044) and rate of torque development (F = 2.663; p = 0.023). Statistically significant differences in the rate of torque development between the control and WBC condition were evident 24 hours after the exercise (p = 0.012).
Table 1. Changes in pain sensation, maximal torque and maximally explosive torque, reported as mean (standard deviation).
Control WBC p-value
Pain rest [cm] Baseline 0.0 (0.0) 0.0 (0.0) N/A 1h 0.8 (0.9) 0.1 (0.3) N/A 24h 1.7 (1.2) 0.5 (0.5) N/A 48h 1.9 (1.2) 0.8 (0.7) N/A 72h 1.3 (0.7) 0.2 (0.6) N/A 96h 0.2 (0.4) 0.0 (0.0) N/A 120h 0.1 (0.3) 0.0 (0.0) N/A Pain squat [cm] Baseline 0.0 (0.0) 0.0 (0.0) N/A 1h 2.3 (1.7) 0.8 (1.1) N/A 24h 4.4 (1.6) 2.6 (1.2) N/A 48h 4.7 (2.1) 2.8 (1.7) N/A 72h 3.1 (1.7) 1.5 (1.3) N/A 96h 0.8 (1.0) 0.4 (0.5) N/A 120h 0.4 (0.5) 0.4 (0.5) N/A Max torque [Nm] TE p = 0.000 TE p = 0.032 Time × Group = 0.044 Baseline 215 (41) 195 (35) 0.101 1h 187 (48)* 178 (37) 0.446 24h 180 (43)* 180 (44) 0.431 48h 185 (45)* 194 (52) 0.408 72h 198 (45)* 203 (45) 0.604 96h 197 (37)* 200 (44) 0.725 120h 203 (45) 208 (43) 0.503 RTD 200 ms [Nm/s] TE p = 0.000 TE p = 0.116 Time × Group = 0.023 Baseline 718 (114) 686 (129) 0.376 1h 645 (132)* 604 (128) 0.305 24h 586 (133)* 655 (143) 0.012 48h 604 (145)* 659 (174) 0.021 72h 635 (104)* 688 (169) 0.131 96h 661 (121)* 695 (136) 0.194 120h 676 (102)* 706 (150) 0.306
RTD, rate of torque development TE, time effect within group; * p ≤ 0.05 Bonferronipost hoc paired t-test compared to Baseline Time x Group, interaction

144
Discussion
The present study examined the efficiency of repeated WBC to enhance recovery from EIMD. In line with the research hypothesis, the WBC protocol used in this study showed some enhancements in the recovery process following the damaging exercise as compared to the referent recovery in the control condition.
According to Warren, Lowe, and Armstrong (1999), perceived pain sensation parameters should be discouraged for the purpose of quantifying EIMD and/or functional impairment. Nevertheless, pain inhibits motor cortex excitability (Cheong, Yoon, & Lee, 2003) and, together with inhibitory effects originating from groups III/IV afferents(Bottas, Miettunen, Komi, & Linnamo, 2010), reduces the maximal voluntary neuromuscular activation (Graven-Nielsen, Lund, Arendt-Nielsen, Danneskiold-Samsøe, & Bliddal, 2002). This could explain the drop in performance measuresalso in the present study. A tendency towards enhanced recovery in the WBC condition was evident for maximal isometric torque production, which could be explained by reduced nociceptive signaling. The ability to develop high forces/torques over short time intervals underlies sport-specific movement requirements such as speed, agility and quickness. It has been reported that a rapid increase in motor unit discharge rates and a high incidence of discharge doublets in the early phase of explosive contraction play a crucial role in the rate of torque development (Van Cutsem, Duchateau, & Hainaut, 1998).
In our study, rate of torque development recovered significantly faster in the WBC condition compared to the control condition. In line with the above-mentioned neurophysiology, this could probably be explained by the decrease in III and IV afferents inhibitory effects and reduced intra-cortical inhibitory circuits (Cheong et al., 2003). It has been reported (Pournot et al., 2011) that multiple WBC exposures can enhance recovery by decreasing the acute phase inflammatory response after damaging exercise with release of anti-inflammatory cytokines and blocked pro-inflammatory cytokines, thus contributing to its beneficial role in muscle tissue protection from secondary muscle damage.
To the authors’ knowledge, the present study is the first study performed using a cryo-cabin and not a cryo-chamber, as used in the majority of the previously published studies (Banfi et al., 2010; Banfi et al., 2009; Costello et al., 2012; Hausswirth et al., 2011; Pournot et al., 2011). The main difference between the cabin and the chamber is in the type of exposure and the temperature. In the present study we used temperatures between -140 and -195 °C, while in the cryo-chambers used in other studies (Banfi et al., 2010; Banfi et al., 2009; Costello et al., 2012; Hausswirth et al., 2011; Pournot et al., 2011; Wozniak, Wozniak, Drewa, Mila-Kierzenkowska, & Rakowski, 2007), the mean temperature used was approximately between -110 and -140°C.
The results of the present study provide promising results for the use of WBC as a technique to enhance functional recovery after EIMD. WBC hastens the recovery from EIMD by limiting the loss of maximal isometric torque production, explosive torque production and subjective sensations of pain.
References
1. Banfi, G., Lombardi, G., Colombini, A., & Melegati, G. (2010). Whole-body cryotherapy in athletes. Sports Medicine, 40(6), 509-517.
2. Banfi, G., Melegati, G., Barassi, A., Dogliotti, G., Melzi d’Eril, G., Dugué, B., & Corsi, M. M. (2009). Effects of whole-body cryotherapy on serum mediators of inflammation and serum muscle enzymes in athletes. Journal of Thermal Biology, 34(2), 55-59.
3. Barnett, A. (2006). Using recovery modalities between training sessions in elite athletes: does it help? Sports Medicine, 36(9), 781-796.
4. Bleakley, C., McDonough, S., Gardner, E., Baxter, G. D., Hopkins, J. T., & Davison, G. W. (2012). Cold-water immersion (cryotherapy) for preventing and treating muscle soreness after exercise. Cochrane Database of Systematic Reviews (Online), 2, CD008262.

145
5. Bottas, R., Miettunen, K., Komi, P. V., & Linnamo, V. (2010). Disturbed motor control of rhythmic movement at 2 h and delayed after maximal eccentric actions. Journal of Electromyography and Kinesiology, 20(4), 608-618.
6. Cheong, J. Y., Yoon, T. S., & Lee, S. J. (2003). Evaluations of inhibitory effect on the motor cortex by cutaneous pain via application of capsaicin. Electromyography and Clinical Neurophysiology, 43(4), 203-210.
7. Costello, J. T., Algar, L. A., & Donnelly, A. E. (2012). Effects of whole‐body cryotherapy (−110 °C) on proprioception and indices of muscle damage. Scandinavian Journal of Medicine & Science in Sports, 22(2), 190-198.
8. Graven-Nielsen, T., Lund, H., Arendt-Nielsen, L., Danneskiold-Samsøe, B., & Bliddal, H. (2002). Inhibition of maximal voluntary contraction force by experimental muscle pain: a centrally mediated mechanism. Muscle & Nerve, 26(5), 708-712.
9. Hausswirth, C., Louis, J., Bieuzen, F., Pournot, H., Fournier, J., Filliard, J.-R., & Brisswalter, J. (2011). Effects of Whole-Body Cryotherapy vs. Far-Infrared vs. Passive Modalities on Recovery from Exercise-Induced Muscle Damage in Highly-Trained Runners. PLoS One, 6(12).
10. Leeder, J., Gissane, C., van Someren, K., Gregson, W., & Howatson, G. (2012). Cold water immersion and recovery from strenuous exercise: a meta-analysis. British Journal of Sports Medicine, 46(4), 233-240.
11. Pournot, H., Bieuzen, F., Louis, J., Fillard, J.-R., Barbiche, E., & Hausswirth, C. (2011). Time-Course of Changes in Inflammatory Response after Whole-Body Cryotherapy Multi Exposures following Severe Exercise. PLoS One, 6(7).
12. Proske, U., & Morgan, D. L. (2001). Muscle damage from eccentric exercise: mechanism, mechanical signs, adaptation and clinical applications. The Journal of Physiology, 537(Pt 2), 333-345.
13. Van Cutsem, M., Duchateau, J., & Hainaut, K. (1998). Changes in single motor unit behaviour contribute to the increase in contraction speed after dynamic training in humans. The Journal of Physiology, 513(1), 295-305.
14. Warren, G. L., Lowe, D. A., & Armstrong, R. B. (1999). Measurement tools used in the study of eccentric contraction-induced injury. Sports Medicine, 27(1), 43-59.
15. Wozniak, A., Wozniak, B., Drewa, G., Mila-Kierzenkowska, C., & Rakowski, A. (2007). The effect of whole-body cryostimulation on lysosomal enzyme activity in kayakers during training. European Journal of Applied Physiology, 100(2), 137-142.

146

147
ASSESSMENT OF BALANCE USING DIFFERENT SITTING TASKS
AND RELATIONSHIP TO THE STRENGTH OF TRUNK MUSCLES
Andrej Panjan1 and Nejc Sarabon1,2 1 S2P, Laboratory for Motor Control and Motor Behaviour, Ljubljana, Slovenia
2 UP, Science and Research Centre, Institute for Kinesiology Research, Koper, Slovenia
Abstract
Trunk dynamic stability (i.e. balance) is considered to play an important role in unloading of the spinal structures and protecting from the development of back pain. In order to objectively evaluate balance abilities of the trunk, specific balance tests, which accentuate the role of the lumbo-pelvic region, should be used. The aim of this study was to assess the sensitivity of different balance tests on stable and unstable surface while sitting. Additionally, we were interested in the relation between trunk strength and trunk dynamic balance function. Forty-eight healthy subjects were included. Balance tests encompassed two static tests (parallel stance and sitting on stable surface, both with eyes closed) and two dynamic tests (sitting on unstable surface using tilt board and wobble board, both with eyes opened). Strength tests included trunk extension, flexion, lateral flexion and rotation. A force plate was used for balance tests and a custom built trunk dynamometer was used for isometric strength tests. Repeated measures ANOVA with post hoc t-tests was used to assess differences among balance tests, while Pearson’s correlation coefficient was used to measure relation between strength (general index of trunk strength) and balance parameters (wobble board test). Statistically significant differences (p < 0.05) were found among all balance tests for all parameters (centre of pressure velocity, amplitude and frequency). Pearson’s correlation coefficients between trunk strength and trunk dynamic balance parameters were very low (-0.24 < r < 0.15). In conclusion, balance parameters are sensitive to the different balance tasks on stable and unstable surface while sitting. Low strength-balance correlation coefficients indicate that the stabilization of trunk is not related to the maximal force production capacity of the trunk muscles. Results suggest primary importance of neural mechanisms for the control of balance during sitting, while the role of muscle strength seems to play a minor role.
Keywords: static balance, dynamic balance, strength.
Introduction
There is a constant need to stabilize the trunk during daily activities. Balance can be lost by the effect of gravity, causing loss of upright balance when the body oscillates away from the ideal vertical position.Additionally, unstable support surface or other external forces can cause the loss of balance (Benvenuti, 2001).The body can reestablish balance by reactive reflexive control or by anticipating the loss of balance and preprograming the corrections (Mergner, 2010). During upright standing balance tasks balance is mainly maintained through the involvement of ankle musculature. When the oscillation increases the hips and trunk become more involved (Winter, Patla, Ishac, & Gage, 2003). However the effect of low back pathologies has been shown to be less obvious in standing balance tests (Mazaheri, Coenen, Parnianpour, Kiers, & Van Dieën, 2013). Consequently sitting balance tasks have been used for the purpose of assessing the stabilizing function of the trunk in back pain related conditions(Thrasher et al., 2010; van Nes, Nienhuis, Latour, & Geurts, 2008).
Trunk muscles have been shown to be more involved during sitting balance tasks as compared to the upright stance (Masani et al., 2009). Additionally, coordination of pelvis and trunk have been shown to be affected by low back pain during sitting balance (Van Daele et al., 2009), and therefore, justification of using the sitting balance tests was warranted. However, the literature is limited in reports on metric characteristics of this method. Van Daele et al. (2007) reported on reliability of the method. But no studies dealt with the sensitivity aspects of the centre-of-pressure related variables of the sitting balance

148
tests. The first goal of this study was to assess sensitivity of different balance tests on a stable and unstable surface while sitting.
Trunk dynamic stability (i.e. balance) is considered to play an important role in unloading of the spinal structures and protecting from the development of back pain. In sports and clinical practice strength-stability relationship has been stressed, however, these estimations are poorly supported by research evidence. Therefore, in this study we were interested in thecorrelation between the strength of the trunk and the trunk dynamic balance function.
Method
Forty-eight healthy subjects from general populationwere included (age 42.0 ± 14.0 years, body height 170.6 ± 9.0 cm, body mass 72.5 ±13.0 kg). After explaining the purpose and potential risks of the study, a written informed consent was obtained. The study was approved by the National Medical Ethics Committee. Before performing the tests, the whole procedure was presented in details to each subject and two 20-second accommodation trials were used to minimize learning effect.
Balance tests encompassed one static test (sitting on a stable surface, with eyes closed) and two dynamic tests (sitting on an unstable surface i.e. tilt board and wobble board, both with eyes open). In case of all the three balance tests the subject was sitting with 90° angle at hips and knees and sustaining the upright posture of the trunk.Strength tests included trunk extension, flexion, lateral flexion and rotation while subject was sitting. Each subject performed three repetitions of each test. The subject was instructed to stand or sit as still as possible for 60 s while performing balance tests, and to pull as hard as possible for 3 s while performing strength tests. Appropriate rest intervals (60 s for balance tests and 30 s for strength tests) were between repetitions. Each subject performed two accommodation trials before the test started.
A force plate (Kistler Instrumente AG, Switzerland) was used for balance tests and a custom built trunk dynamometer (S2P Ltd., Slovenia) was used for isometric strength tests.Data for balance tests was acquired using the MARS software (S2P Ltd., Slovenia) at sampling rate of 1000 Hz. Signals were filtered with low-pass 10 Hz Butterworth filter, second-order. Velocity (V)in both directions(medial-lateral (ml) and anterior-posterior (ap)) and in the plane (t), amplitude (A) and frequency (F) parameters in both directions were calculated from CoP.For each parameter the average of three repetitions was used for further analysis.
Data for isometric strength tests was acquired with the ARS for Dynamometry software (S2P Ltd., Slovenia) at sampling rate of 1000 Hz. Signals were filtered with 20 ms moving average window. Maximal voluntary contraction on 1 s window was calculated for each strength test. Average of three repetitions was usedto calculate the general index of trunk strength (TSI) (average ofmaximal voluntary contraction z-values for each strength test).
Analysis of variance for repeated measures with post-hoc t-tests was used to assess differences among balance tests, while Pearson’s correlation coefficient was used to measure relation between strength (TSI) and balance parameters (wobble board test); between static (sitting) and dynamic balance while sitting (wobble board test); and between both dynamic balance tests while sitting (tilt and wobble board test). PASW Statistics 18 software was used for all statistical analyses.
Results
Statistically significant differences (p< 0.05) were found among all balance tests for all parameters (center of pressure velocity, amplitude and frequency). Excluding the parallel stance test, statistically significant differences (p< 0.001) were found among all other balance tests for all parameters (Table 1).

149
Table 1. Descriptive statistics (mean value (standard deviation)) and differences between balance tests. Sitting on the stable surface (SS), sitting on the wobble board (WB), sitting on the tilt board (TB), p < 0.001 (*).
Paired t-test Parameter SS WB TB RANOVA
SS-WB SS-TB WB-TB
Vt 7.30 (0.25) 14.84 (0.47) 12.35 (0.34) * * * *
Vap 6.40 (0.23) 10.52 (0.31) 9.42 (0.23) * * * *
Vml 2.43 (0.09) 8.22 (0.32) 6.05 (0.27) * * * *
Aap 1.17 (0.04) 3.04 (0.15) 2.63 (0.13) * * * *
Aml 0.57 (0.03) 5.73 (0.30) 1.57 (0.07) * * * *
Fap 0.72 (0.06) 0.24 (0.01) 0.19 (0.01) * * * *
Fml 0.55 (0.04) 0.28 (0.01) 0.86 (0.03) * * * *
Figure 1. Scatterplots with regression lines for: (A) Wobble board Vtotal and Strength, (B) Wobble board Vtotal and Sitting Vtotal, and (C) Wobble board Vtotal and Tilt board Vtotal.

150
Pearson’s correlation coefficients between trunk strength and trunk dynamic balance parameterswere very low (-0.24<r < 0.15). Similarly were low Pearson’s correlation coefficients between static and dynamic balance parameters while sitting (-0.26< r < 0.17).Better relation was observed between the two dynamic balance tests, especially for velocity and amplitude parameters (0.13<r < 0.76). The highest values of Pearson’s correlation coefficient were observed for total velocity andvelocity in anterior-posterior direction between the wobble and tilt board test.
Discussion
This study confirmed sensitivity of most frequently used balance parametersto differences insitting balance tasks (stable/unstable support surface and difference in the number of rotation axis). Weak correlations between static and dynamic balance tests were observed, suggesting differences in the anticipatory balance control between the two balance modalities.Low correlation betweenstrength and balanceof the trunk indicates thatthe stabilization of trunk is not related to the maximal force production capacity of the trunk muscles.Altogether, results of this study suggest, neural mechanisms are of primary importance for the control of balance during sitting, while the role of muscle strength seems to play a minor role.
Researchersstudying low back pain and trunk stabilization functionsare interested in specific balance tests accentuating the involvement of the lumbo-pelvic and spinal region. Standing balance tests have been shown not be able to adequately address trunk stabilizing control(Mazaheri et al., 2013). As an alternative sitting balance tests have been applied, to studies of trunk stabilization. However no reports on the sensitivity of these tests are known in theliterature. Our study showed that common CoP parameters are sensitive to differences in the static or dynamic sitting balance tests. Additionally balance disturbances in a single or multi axis affects balance differently.
Our study showed important differences between static and dynamic siting balance tasks. During static sitting, the balance control seems to be more accurately controlled. The amplitude as well as velocity of CoP movement was lower. In the contrary the frequency was much higher during static sitting balance tasks. Interestingly m-l frequency on TB, where only minor instability of the support surface was present,was also higher. One can speculate that the stable support enables more active balance control. According to the model of balance control (Mergner, 2010), anticipation of body sway is of primary importance affecting the nature of balance. During balancing on unstable support surface, the balance controlling mechanisms might adapt to the biomechanical characteristics of the support surface. Due to the higher inertia of the support surface and slower rotational velocities the system might adapt slower corrective strategies, resulting in increased amplitude and decreased frequency of CoP sway.
An important observation of our study was the lack of correlation between balance and strength. This results are in agreement withreports of some other researchers (Handrigan et al., 2012) who reported low strength-balance correlations for the trunk. As proposed by (Galli et al., 2011)only significant decrease in strength might affect body sway. Based on the above observations and the literature reports strength does not affect balance in healthy individuals. As the low amplitude body sway results in small inertial force, the corrective actions don’t require any significant muscle activation. It can be speculated, that the sensory-motor integration is of primary importance for stabilizing the body during upright posture.
Future research work should focus on the sensitivity of balance tests used in this study in different groups of patients suffering by spine pathologies.
Acknowledgements
The operation is being part financed by the European Social Fund of the European Union. The operation is implemented in the framework of the Operational Programme for Human Resources Development for the Period 2007-2013, Priority axis 1: Promoting entrepreneurship and adaptability, Main type of activity 1.1.: Experts and researchers for competitive enterprises.Nejc Sarabon would like to acknowledge the support of: (i) the Slovenian Research Agency, grant no. L5―4293, and (ii) Comenius University in Bratislava, Faculty of Physical Education and Sports – project MOBIL.

151
References
1. Benvenuti, F. (2001). Physiology of Human Balance. Advances in Neurology, 87, 41–51.
2. Galli, M., Cimolin, V., Vismara, L., Grugni, G., Camerota, F., Celletti, C., … Capodaglio, P. (2011). The effects of muscle hypotonia and weakness on balance: a study on Prader-Willi and Ehlers-Danlos syndrome patients. Research in developmental disabilities, 32(3), 1117–1121.
3. Handrigan, G. A., Berrigan, F., Hue, O., Simoneau, M., Corbeil, P., Tremblay, A., & Teasdale, N. (2012). The effects of muscle strength on center of pressure-based measures of postural sway in obese and heavy athletic individuals. Gait & posture, 35(1), 88–91.
4. Masani, K., Sin, V. W., Vette, A. H., Thrasher, T. A., Kawashima, N., Morris, A., … Popovic, M. R. (2009). Postural reactions of the trunk muscles to multi-directional perturbations in sitting. Clinical biomechanics (Bristol, Avon), 24(2), 176–182.
5. Mazaheri, M., Coenen, P., Parnianpour, M., Kiers, H., & Van Dieën, J. H. (2013). Low back pain and postural sway during quiet standing with and without sensory manipulation: A systematic review. Gait & posture, 37(1), 12–22.
6. Mergner, T. (2010). A neurological view on reactive human stance control. Annual Reviews in Control, 34(2), 177–198.
7. Thrasher, T. A., Sin, V. W., Masani, K., Vette, A. H., Craven, B. C., & Popovic, M. R. (2010). Responses of the trunk to multidirectional perturbations during unsupported sitting in normal adults. Journal of applied biomechanics, 26(3), 332–340.
8. Van Daele, U., Hagman, F., Truijen, S., Vorlat, P., Van Gheluwe, B., & Vaes, P. (2009). Differences in balance strategies between nonspecific chronic low back pain patients and healthy control subjects during unstable sitting. Spine, 34(11), 1233–1238.
9. Van Daele, U., Huyvaert, S., Hagman, F., Duquet, W., Van Gheluwe, B., & Vaes, P. (2007). Reproducibility of postural control measurement during unstable sitting in low back pain patients. BMC musculoskeletal disorders, 8, 44.
10. Van Nes, I. J. W., Nienhuis, B., Latour, H., & Geurts, A. C. H. (2008). Posturographic assessment of sitting balance recovery in the subacute phase of stroke. Gait & posture, 28(3), 507–512.
11. Winter, D., Patla, A., Ishac, M., & Gage, W. (2003). Motor mechanisms of balance during quiet standing. Journal of Electromyography and Kinesiology, 13(1), 49–56.

152

153
INTER- AND INTRA-SESSION REPEATABILITY OF SOME MVC
RELATED PARAMETERS MEASURED BY AN ISOMETRIC KNEE
DYNAMOMETER
Jernej Rosker1, 2 and Nejc Sarabon1, 2, 3 1UP, Science & Research Centre, Institute for Kinesiology Research, Koper, Slovenia
2 S2P, Laboratory for Motor Control and Motor Behaviour, Ljubljana, Slovenia 3 LBI, Institute of Electrical Stimulation and Physical Rehabilitation, Vienna, Austria
Abstract
Isometric strength measurements of the knee in elderly people have been used in clinical and research practice. For the purpose of the international project MOBIL-IR on mobility in elderly a portable isometric knee dynamometer has been developed. This study assessed intra- as well as inter-session repeatability of the peak torque and peak toque derived parameters measured on a novel portable isometric knee dynamometer. Twenty-two healthy subjects participated in the study (age 28.6 ± 6.4 years, height 171.2 ± 10.0 cm, weight 69.9 ± 11.1 kg). Each subject performed three maximal isometric knee extensions with each leg and bilaterally, on two separate days. Contra-lateral strength imbalance and bilateral deficit were calculated from peak torque measurements. Inter-class correlation coefficient (ICC), typical error and coefficient of variation were calculated. Highest ICC for intra-session and inter-session repeatability was observed for peak torque measurements (0.97 to 0.99), followed by contra-lateral strength imbalance (0.59) and bilateral deficit (0.87). Generally inter-session reliability (ICC 0.56 to 0.99) was lower compared to intra-session reliability (ICC 0.59 to 0.99). Highest coefficient of variation was observed for contra-lateral strength imbalance (45% to 56%) and bilateral deficit (-215% to -78%) respectively and lowest for peak torque (5.7% to 9.2%). This study confirmed the novel isometric dynamometer measurements to be reliable. The isometric dynamometer has been successfully implemented for measuring strength in elderly.
Keywords: Muscle strength, isometrics, dynamometry, repeatability.
Introduction
Assessing knee musculature strength has enabled identification of injury risks (Croisier, Ganteaume, Binet, Genty, & Ferret, 2008), as well as monitoring progress in knee injury rehabilitation (Ageberg, Roos, Silbernagel, Thomeé, & Roos, 2009) in young and elderly. Strength tests have become an indispensable part of rehabilitation, prevention and diagnostics.
Two most commonly used methods for measuring knee musculature strength are isokinetic and hand-held dynamometry(Cates & Cavanaugh, 2009).The advantage of isokinetic dynamometry over hand-held dynamometry is thatit enables muscle strength assessment under concentric, eccentric or isometric muscle contraction modes (Rochcongar, 2004). On the contrary the hand-held dynamometry is much more affordable, mobile and simple (Van der Ploeg, Oosterhuis, & Reuvekamp, 1984). Although hand-held dynamometry enables only isometric strength testing, validity of the results was confirmed by high correlation with isokinetic testing results (Deones, Wiley, & Worrell, 1994). As a consequence of manual force sensor fixation and poorer positioning of the subject, the measurements are dependent on tester’s strength and expertise. Consequentlyinter-session and inter-tester variability can be decreased (Lu, Hsu, Chang, & Chen, 2007).
Peak torque presents themain parameter derived from the force-time signal. Reliability of the peak torque measurements has been shown to differ between different methods, being slightly higher for isokinetic than for hand-held dynamometry. Other peak torque derived parameters, such as contra-lateral strength imbalance (CLI), proved to be less reliable (Impellizzeri, Bizzini, Rampinini, Cereda, &

154
Maffiuletti, 2008). Possible cause can be higherinter-trial variability of the peak torque measurements. There are no reports on the reliability of bilateral deficit (BLD) measurements, limiting its applicability to rehabilitation practice.
For thepurposes of research projects, focusing on changes in neuromuscular function with aging, aportable isometric knee dynamometer was designed. The purpose of this study was to evaluate the inter-trial and intra-trial reliability of the Peak torque, CLI and BLD derived from the isometric dynamometer.
Methods
Subjects
Twenty-two young healthy adults (age 28.64 ± 6.44 years, height 171.22 ± 9.97 cm, weight 69.85 ± 11.14 kg) participated in the study. Neurological and musculoskeletal injuries/diseases were used as exclusion criteria.After explaining the study protocol, each subject signed an informed consent form, approved by National Medical Ethics Committee.
Study protocol
Two sessions,separated by two to ten days, were attended by the subjects. Following a 5-minute warm-up on acycloergometer, subjects were positioned into the isometric dynamometer shown in Figure 1 (knees at 60° of flexion, hips at 90° flexion, knee axis aligned with the axis of the lever arm, hips fixed with a strap). The task was to produce highest possible torque sustained for three seconds. Each subject performed three repetitions separated by 20-second rest intervals. Each subject performed three different types of maximal knee extension task in a random order; (i) left knee extension, (ii) right knee extensionand (iii) bilateral knee extension. Prior to each task, the subjects performed three warm up repetitions with sub-maximal intensity (~50%, maximal torque). At the second session, maximal knee extension measurements for a subject were performed at the same time of the day and in the same order as on the first visit.
Figure 1: Isometric dynamometer. The device encompasses an adjustable sit (1), leaver arm (2), force sensor (3) and a rigid aluminium frame (4).
Instrumentation
The adjustable dynamometer (Figure 1) allowed proper positioning of the subjects, regardless of differences in anthropometrics. A strain gauge based force sensor (model Z6FC3-200 kg, HBM, Darmstadt, Germany)was attached between the frame and the leaver armmeasuring torque during knee extension. The signal processing and quantification was done using the custom built software (ARS dynamometry, S2P ltd., Ljubljana, Slovenia). Alow-pass (20Hz) 2nd order Butterworth filter was used. Average torque was calculated on the one-second time interval on the maximal stationary part of the torque signal (peak torque). CLI and BLD were calculated, using peak torque measured during the left,

155
right and bilateral maximal knee extension task. CLI was calculated as a ration between peak torque of the non-dominant and dominant leg. BLD was calculated as a ratio in peak torque during bilateral knee extension and the sum of left and right knee extension.
Data analysis
The three trials of the first visit were used to calculate intra-session repeatability. Average of three trials in each session was used to calculate inter-session repeatability. Interclass correlation coefficient (ICC) was used for repeatability analysis. Additionally, typical error, coefficient of variation and descriptive statistics were calculated (level of statistical significance set at 0.05). All statistical analyses were made with SPSS (PASW statistics 18, IBM, Chicago, USA).
Results
Results of intra-session repeatability analysis are shown in table 1.Intra-session repeatabilityof peak torque during all three knee extension tasks and BLD was very good,in contrast to moderate inCLI. Coefficients of variation for peak torque were small in all tasks.Exceptions are CLI and BLD, where significantly higher coefficients of variation were observed.
Table 1: Intra-session repeatability.Averages and standard deviation for individual trials are presented in first three columns. Coefficient of variation (CV%) and typical error (TE) are shown for the following knee extension tasks; peak torque during left maximal knee extension (PTL). right maximal knee extension (PTR) and bilateral knee extension (PTB)
Parameter Trial 1 Trial 2 Trial 3 Mean score Range TE CV% ICC
PTL [N] 187±71 187±64 184±61 186±66 98 - 395 11.7 6.3 0.99
PTR [N] 182±69 186±61 187±57 185±62 99 - 365 10.6 5.7 0.99
PTB [N] 353±120 347±117 349±113 350±117 198 - 698 17.8 5.1 0.99
CLI [%] 11.3±7.3 8.9±7.3 9.6±7.1 9.9±7.2 0.0 - 26.7 5.4 54.6 0.59
BLD [%] -2.9±11.1 -6.5±8.8 -5.6±9.6 -5.0±9.9 -25.9 - 22.7 5.4 -106.0 0.87
Results of inter-session repeatability analysis are presented in table 2. Inter-session repeatabilityalso proved to be higher for peak torque in all of the three knee extension tasks as compared to CLI and BLD. Coefficient of variation for peak torque measurements, were slightly higher on average for inter-session compared to intra-session analysis. Contrary, coefficient of variation for CLI and BLD was slightly smaller in inter-session compared to intra-session analysis.
Table 2: Inter-session repeatability.Averages and standard deviation for individual trials are presented in first two columns. Typical error (TE) and coefficient of variation (CV%) are shown for the following knee extension tasks; peak torque during left maximal knee extension (PTL), right maximal knee extension (PTR) and bilateral knee extension (PTB).
Parameter Visit 1 Visit 2 Mean score Range TE CV% ICC
PTL_avg [N] 186±64 184±60 185±62 106 – 363 15.2 8.2 0.97
PTR_avg [N] 185±61 184±60 185±61 111 – 363 12.9 7.0 0.98
PTB_avg [N] 350±116 338±108 345±112 216 – 670 17.1 5.0 0.99
CLI_avg [%] 8.6±6.2 7.1±5.9 7.9±6.1 0.2 - 26.7 3.6 45.0 0.77
BLD_avg [%] -5.1±8.6 -7.9±6.5 -6.3±7.8 -21.8 - 9.9 5.0 -78.8 0.73
156
Discussion
The isometric dynamometer used in this study enabled peak torque measurements with excellent reliability. Intra-session reliabilitywas slightly higher than inter-session reliability. Peak torque derived parameters (CLI and BLD) on the contrary had significantly lover reliability as well as higher coefficient of variation. Our results suggest that care should be taken when interpreting changes in CLI and BLD as a result of conditioning or deconditioning, as measuring error might be significant.
Reliability of a strength measuring method is important for its validity. Intra-session repeatability of isometric dynamometer used in this study was comparable to the repeatability ofisokinetics (Carvalho et al., 2011) and a similar to isometric force measuring device (Colombo et al., 2000). Inter-session repeatability of peak torque proved to be very good, but lower than intra-session reliability. The high inter-session reliability could be a result of standardization of the measurement setup (standardization of joint angles, torso position and leaver arm length).
Measurement error is an important aspect of reliability. Different values for inter-session coefficients of variation have been reported for isokinetics (0.1% to 13.3%) (Carvalho et al., 2011) and hand-held-dynamometry (reaching as high as 27.3%) (Koblbauer et al., 2011). Our isometric dynamometry had comparable coefficient of variation to isokinetics and lower coefficient of variation as compared to hand-held-dynamometry. Slightly lover coefficients of variation were observed for the inter-session than for the intra-session repeatability. From practical perspective,low coefficient of variation is an indicator of higher accuracy to conditioning or deconditioning of the muscular system.Changes in peak torque measurements with isometric dynamometry used in this study, that are lower than 10.1% for inter-session and 6.3% for intra-session comparisons, can be considered as a measurement error.
CLI is a common parameter in knee rehabilitation and prevention strength assessment. According to our study, inter-session reliability of CLI was acceptable. Intra-session reliability however was moderate, with a high coefficient of variation. In rehabilitation and clinical practice care should be taken when interpreting CLI. As observed in our study, CLI higher as 12.1% can be considered a measurement error. BLD has a potential in rehabilitation practice, but is scarcely reported in literature. Based on our results, BLD proved to have very good intra-session repeatability. However inter-session repeatability was moderate. This suggests caution should be taken in clinical practice due to lover reliability.
The isometric dynamometer and the data analysis approach proved to be of sufficient reliability for further use in research of changes in functional abilitieswith aging.
References
1. Ageberg, E., Roos, H. P., Silbernagel, K. G., Thomeé, R., & Roos, E. M. (2009). Knee extension and flexion muscle power after anterior cruciate ligament reconstruction with patellar tendon graft or hamstring tendons graft: a cross-sectional comparison 3 years post surgery. Knee surgery, sports traumatology, arthroscopy: official journal of the ESSKA, 17(2), 162–169.
2. Carvalho, H. M., Coelho E Silva, M. J., Ronque, E. R. V., Gonçalves, R. S., Philippaerts, R. M., &Malina, R. M. (2011). Assessment of reliability in isokinetic testing among adolescent basketball players. Medicina (Kaunas, Lithuania), 47(8), 446–452.
3. Cates, W., & Cavanaugh, J. (2009).Advances in rehabilitation and performance testing. Clinics in Sports Medicine, 28(1), 63–76.
4. Colombo, R., Mazzini, L., Mora, G., Parenzan, R., Creola, G., Pirali, I., &Minuco, G. (2000). Measurement of isometric muscle strength: a reproducibility study of maximal voluntary contraction in normal subjects and amyotrophic lateral sclerosis patients. Medical engineering & physics, 22(3), 167–174.
5. Croisier, J., Ganteaume, S., Binet, J., Genty, M., & Ferret, J.-M. (2008). Strength imbalances and prevention of hamstring injury in professional soccer players: a prospective study. The American journal of sports medicine, 36(8), 1469–1475.

157
6. Deones, V. L., Wiley, S. C., & Worrell, T. (1994).Assessment of quadriceps muscle performance by a hand-held dynamometer and an isokinetic dynamometer. The Journal of orthopaedic and sports physical therapy, 20(6), 296–301.
7. Hopkins, W. (2000).Measures of reliability in sports medicine and science. Sports Medicine, 30(1), 1–15.
8. Impellizzeri, F. M., Bizzini, M., Rampinini, E., Cereda, F., &Maffiuletti, N. A. (2008). Reliability of isokinetic strength imbalance ratios measured using the Cybex NORM dynamometer. Clinical physiology and functional imaging, 28(2), 113–119.
9. Koblbauer, I. F. H., Lambrecht, Y., Van der Hulst, M. L. M., Neeter, C., Engelbert, R. H. H., Poolman, R. W., &Scholtes, V. A. (2011). Reliability of maximal isometric knee strength testing with modified hand-held dynamometry in patients awaiting total knee arthroplasty: useful in research and individual patient settings? A reliability study. BMC musculoskeletal disorders, 12, 249.
10. Lu, T.-W., Hsu, H.-C., Chang, L.-Y., & Chen, H.-L. (2007). Enhancing the examiner’s resisting force improves the reliability of manual muscle strength measurements: comparison of a new device with hand-held dynamometry. Journal of rehabilitation medicine: official journal of the UEMS European Board of Physical and Rehabilitation Medicine, 39(9), 679–684.
11. Rochcongar, P. (2004). Isokinetic thigh muscle strength in sports: a review. Annales de réadaptationet de médecine physique: revue scientifique de la Sociétéfrançaise de rééducationfonctionnelle de réadaptation et de médecine physique, 47(6), 274–281.
12. Van der Ploeg, R. J., Oosterhuis, H. J., & Reuvekamp, J. (1984). Measuring muscle strength.Journal of neurology, 231(4), 200–203.

158

159
MEASUREMENTS OF POSTURAL REFLEX REACTIONS TO
SUDDEN LOADING OF THE HANDS: A RELIABILITY STUDY
Matej Voglar1 and Nejc Sarabon1, 2 1 University of Primorska, Science and Research Centre Koper, Institute for Kinesiology
Research, Koper, Slovenia 2 S2P, Laboratory for Motor Control and Motor Learning, Ljubljana, Slovenia
Abstract
Many studies have documented an association between low back pain and suboptimal sensory-motor function of the trunk, manifested as disturbance in muscle activation patterns. One of frequently used approaches to assess reflex muscle activation of the trunk is a sudden loading test. Reliability of the measurements was previously reported for measurements with application of perturbation directly to the trunk in witch pelvis and lower limbs were fixated. The purpose of this study was to assess reliability of sudden loading test in more functional manner.
Twenty-four healthy subjects participated in the intra-session study and 13 of them repeated the test protocol to determine inter-session reliability. Each subject performed 40 repetitions of sudden loading of the hands. Activation of rectus abdominis, obliquusexternus, obliquusinternus, multifidus at level L5, and erector spine at level L1 was recorded on the right side of the body with surface electromyography.
Averaging of 18 consecutive trials was necessary to achieve excellent intra session (ICC > 0.75) and god inter-session (ICC > 0.60) reliability in most of the analyzed muscles.
Reliability results in this study were comparable to the levels reported previously for less functional tests with pelvis fixation. Averaging more consecutive repetitions, than used in previous studies, would be recommended. Our future goal is to develop easy to use test, for objective evaluation of trunk neuro-muscular function, aimed to guide low back pain rehabilitation and prevention practice. Therefore easier and faster signal processing would have practical value.
Keywords: posture, reflex responses, motor control.
Introduction
In the 1970s researchers started to describe the concept of spinal stability. Panjabi (1992), one of the pioneers in the field of spinal stabilization, defined three sub-systems of spinal stabilization namely passive, active and control subsystem.These subsystems, although conceptually separate, are functionally interdependent. Without active support the spine is very unstable and buckles under low axial loads. Co-contraction of muscles increases spine stiffness and thus assures stability.But, co-activation is a short-term solution as it increases compressive forces, is metabolically inefficient and can restrict normal motion(McGill, 2001). Instead, muscle activity is maintained low and when stability is perturbed adequate reflexive muscle activation is necessary.
When the muscle is lengthened, due to sudden perturbation, the stretch reflex activates motoneurons to resist its lengthening (Santos et al., 2011). Those postural reflex responses (PRRs) have been shown to be delayed in subjects with LBP(Radebold, Cholewicki, Panjabi, & Patel, 2000). Similarly, studies that included experimentally induced LBP in previously asymptomatic subjects have shown that pain itself can influence timing of automatic onset of trunk muscles(Hodges, Moseley, Gabrielsson, & Gandevia, 2003; Moseley, Nicholas, & Hodges, 2004).On the other hand,Cholewicki et al. (2005) showed that PRRs can be delayed in subjects with no history or current back pain and they showed that PRR latencies are among the best predictors of future spine injury. Although cause-

160
consequence relationship is not clearly defined, the postural responses to sudden perturbations associate with theoccurrence of LBP and impaired responses are evident inchronic or recurrent LBP.
Reliability of PRRs measurements was previously assessed only with perturbations applied directly to the trunk and with pelvis fixated (Santos et al., 2011; Vera-Garcia, Brown, Gray, & McGill, 2006). In the current study measurements were performed in more functional manner as no pelvis fixation was used and perturbations were applied to the hands. Hand loading is mirroring everyday situations andit has been previously shown that the same load applied to the hands elicits greater responsive activation of trunk muscles compared to direct trunk loading (McMulkin, Woldstad, & Hughes, 1998).Therefore the aim of this study was to determine the minimal number of averaged repetitions needed, to achieve acceptable intra-session and inter-session reliability of measurements of PRRs to sudden hand loading.
Method
Participants
Twenty-four healthy volunteers (15 male; 9 female) participated in the study of intra-session reliability (28.6 (5.8) years, 173.8 (6.9) cm, and 73.0 (10.5) kg). To assess inter-session reliability 13 subjects (29.1 (5.2) years, 176.1 (7.6) cm, and 77.4 (9.9) kg )repeated the test protocols after 1 to 3 weeks. Regular physical activity, history of neurological diseases, major orthopedic lesions, vestibular, and visual disturbances were used as exclusion criteria. The study was approved by the National Medical Ethics Committee and the participants gave their informed consent prior to enrollment.
Tasks and Procedures
Before test 5 min standardized warm up and 5 introductory trials were performed. Participants were barefooted and asked to place their feet at the hip-width (we marked the position for repositioning between sets). Participants were constantly reminded to maintain their normal posture and to stand relaxed with their elbows 90° flexed and palms slightly touching the weight handle (Figure 1). After the load release, participant’s task was, to return and settle into the initial position, as quickly as possible. The load was normalized to 8% of the individuals’ body mass.For the purpose of sudden loading, a custom made, electromagnet based, quick release mechanism was produced. Computer synchronized this mechanism with subjects heart beat to avoid electric cardiac activity (ECK) artifacts in EMG signal.Trials were triggered in random manner every 5 to 12 s. Altogether 40 repetitions in 4 sets of 10 repetitions were performed with 1 min breaks between sets, during which participants sat.
Figure 1. Measurements setup for assessment of postural reflex reactions to sudden unexpected loading of the hands.

161
Electromyography
Electrical activity of 5 trunk muscles was measured with surface EMG. Signals were 3,000x amplified (Biovision, Weherheim, Germany), and sampled at 10,000 Hz. Raw EMG signals were analog-to-digital converted (USB-6343, National Instruments, Texas, USA), visually inspected for noise detection in real time and stored on computer for later analysis. Self-adhesive pairs of electrodes were used, placed with 2 cm center-to-center distance. EMG of rectus abdominis (RA), obliquus externus (OE), multifidus at level L5 (MF), erector spine at level L1 (ES) and obliquus internus (OI) were recorded on the right side of the body. Skin preparation and electrode placement was done according to SENIAM recommendations (Hermens, Freriks, Disselhorst-Klug, & Rau, 2000). As this standard does not include recommendations for abdominal muscles, electrodes were placed in accordance with previous study (Radebold et al., 2000). An additional pair of electrodes was placed for ECG detection, with one electrode in the region of xifoid process of sternum and other on the 1/3 of left ribcage arc. Reference electrode was positioned on the area of right great trochanter.
Signal Processing
Signals were10-1000 Hz band-pass filtered, RMS transformed, and 10 Hz low-pass filtered to get a linear envelope. Automatic activation detection was performed with 25 ms sliding window. Activation was detected when signal increased by two standard deviation from baseline activity (50 ms before perturbation). PRRs onset times were calculated as a delay from mechanism release to trunk muscle activation. All signals were later manually inspected and corrected when activation was obviously incorrectly detected by computer due to EMG artifacts. When there was no activation of the investigated muscle or activation was not within detection limits, a trial signal was not used for analysis.
Statistical Analyses
For statistical analyses, SPSS 18.0 software (SPSS Inc., Chicago, USA) was used. The retest correlation was assessed using a two-way mixed model of intraclass correlation coefficient (ICC) described by Shrout and Fleiss (1979) and standard error of measurement (SEM) was calculated. Reliability was interpreted as: poor (ICC 0.00- 0.40); fair (ICC 0.40-0.59); good (ICC 0.60-0.74) or excellent (ICC 0.75-1.00)(Fleiss, 1999). Excellent intra-session and good inter-session reliability in all analyzed muscles was the goal criteria when recommendations about the number of trials were made.
Results
Measurements of postural reaction to sudden loading reached excellent intra-session reliability of the results with 18 repetitions averaged in most of the analyzed muscles. Exception was muscle OE which reached relative plateau just below threshold of excellent reliability. With similar but opposite trend SEM decreased below 8 ms for all analyzed muscles (Figure 2).
Figure 2. Intra-session intraclass correlation coefficients (ICC) and standard errors of measurement (SEM) of multiffidus (MF), erector spinae at level L1 (ES), rectus abdominis (RA), obliqusexternus (OE)
and obliqusinternus (OI) muscles.

162
Measurements of back extensors showed excellent inter-session reliability after averaging only 4 consecutive trialsand were higher than in flexors muscles. Although good inter-session reliability of measurements was reached after 8 repetitions averaged for RA and OE muscle, as much as 24 repetitions was needed in measurements of OI muscle. Relative plateau of SEM was reached after averaging 17 repetitions in al analysed muscles except in OI muscle (Figure 3).
Figure 3. Inter-session intraclass correlation coefficients (ICC) and standard errors of measurement (SEM) of multiffidus (MF), erector spinae at level L1 (ES), rectus abdominis (RA), obliqusexternus(OE)
and obliqusinternus (OI) muscles.
Discussion
Averaging of 18 trials provided excellent intra-session reliability of measurements in sudden loading paradigm for all the analyzed muscles except for OE muscle, which reached plateau (ICC> 0.7) after averaging 13 repetitions. In trunk extensor muscles, somewhat surprisingly, excellent inter-session reliability of the measurements was reached already after averaging 2 and 4 repetitions for MF and ES, respectively. This was probably not coincidental because excellent reliability was sustained throughout additional repetitions averaged. More repetitions needed for excellent intra-session reliability of the measurements might be consequence of adaptations to sudden unexpected loading that can occur during the first few trials (Skotte et al., 2004). Although more repetitions were required to achieve good inter-session reliability of the measurement in the OI muscle, averaging of at least 18 consecutive repetitions would be recommended in sudden loading paradigm. The main reason for lower ICC was probably relatively low inter-subject variability, compared to other sources of variance(Santos et al., 2011). Reliability of measurements in most of the analyzed muscles improved when more repetitions were averaged.
Compared to a direct trunk loading paradigm, reaction times were considerably longer in this study. We can assume that longer latencies were mainly originating from the activation of hand muscles needed for the transfer of a perturbation from hands to the trunk. Latencies in the present study were comparable to the latencies reported in other studies that applied perturbations over the hands (Brown, Haumann, & Potvin, 2003; Gregory, Brown, & Callaghan, 2008). Of additional importance for practical use of this paradigm are results of the study byLeinonen et al. (2007) in which authors showed that response latencies of arm muscles are not changed in subjects with LBP. Therefore, time needed to transfer the mechanical perturbationfrom the hands to the trunk, should not be delayed in subjects with LBP.
Even though excellent inter-session reliability of the measurements was reached early in some muscles, an additional benefit of averaging higher number of consecutive trials was that none of the analyzed muscles showed poor reliability, as this was the case in prior studies ENREF 2 (Cholewicki et al., 2005; Santos et al., 2011). At the same time SEM was reduced which is of particular importance when evaluating intra-individual changes (Santos et al., 2011).
In this study muscles were only assessed on the right side of the body and according to previous study of Santos et al. (2011) some additional improvement in reliability of results could be expected when averaging homologous muscle pairs bilaterally. After automatic computer recognition of muscle

163
activation onset we performed a manual check of the activation. This process was time consuming, potentially subjective and requires an experienced investigator.
To conclude in order to assure optimal reliability of PRRs measurements to sudden hand loading at least 18 consecutive repetitions should be averaged. Testing in more functional unrestrained posture with perturbation applied to the hands resulted in similar reliability of measurements as reported in previous studies. At the same time this testing protocol was easy to perform, was less time consuming because no fixations were needed and the equipment needed was mobile. Our future goal is to achieve completely automatic detection of trunk muscle activation that would have additional practical value and would enable the use of such protocols in daily clinical practice.
Acknowledgment
NejcSarabon would like to acknowledge the support of the Slovenian Research Agency, grant no. L5―4293.
References
1. Brown, Haumann, & Potvin. (2003). The responses of leg and trunk muscles to sudden unloading of the hands: implications for balance and spine stability. Clinical Biomechanics (Bristol, Avon), 18(9), 812-820.
2. Cholewicki, Silfies, S. P., Shah, R. A., Greene, H. S., Reeves, N. P., Alvi, K., & Goldberg, B. (2005). Delayed trunk muscle reflex responses increase the risk of low back injuries. Spine, 30(23), 2614-2620.
3. Fleiss, J. L. (1999). Design and Analysis of Clinical Experiments: Wiley.
4. Gregory, D. E., Brown, S. H. M., & Callaghan, J. P. (2008). Trunk muscle responses to suddenly applied loads: do individuals who develop discomfort during prolonged standing respond differently? Journal of Electromyography and Kinesiology: Official Journal of the International Society of Electrophysiological Kinesiology, 18(3), 495-502.
5. Hermens, H. J., Freriks, B., Disselhorst-Klug, C., & Rau, G. (2000). Development of recommendations for SEMG sensors and sensor placement procedures. Journal of Electromyography and Kinesiology: Official Journal of the International Society of Electrophysiological Kinesiology, 10(5), 361-374.
6. Hodges, Moseley, Gabrielsson, & Gandevia. (2003). Experimental muscle pain changes feedforward postural responses of the trunk muscles. Experimental Brain Research. Experimentelle Hirnforschung. Expérimentation Cérébrale, 151(2), 262-271.
7. Leinonen, V., Airaksinen, M., Taimela, S., Kankaanpää, M., Kukka, A., Koivisto, T., & Airaksinen, O. (2007). Low back pain suppresses preparatory and triggered upper-limb activation after sudden upper-limb loading. Spine, 32(5), E150-155.
8. McGill, S. M. (2001). Low back stability: from formal description to issues for performance and rehabilitation. Exercise and Sport Sciences Reviews, 29(1), 26-31.
9. McMulkin, M. L., Woldstad, J. C., & Hughes, R. E. (1998). Torso loading via a harness method activates trunk muscles less than a hand loading method. Journal of Biomechanics, 31(4), 391-395.
10. Moseley, G. L., Nicholas, M. K., & Hodges, P. W. (2004). Does anticipation of back pain predispose to back trouble? Brain: a journal of neurology, 127(Pt 10), 2339-2347.
11. Panjabi. (1992). The stabilizing system of the spine. Part I. Function, dysfunction, adaptation, and enhancement. Journal of Spinal Disorders, 5(4), 383-389.
12. Radebold, A., Cholewicki, J., Panjabi, M. M., & Patel, T. C. (2000). Muscle response pattern to sudden trunk loading in healthy individuals and in patients with chronic low back pain. Spine, 25(8), 947-954.

164
13. Santos, B. R., Larivière, C., Delisle, A., McFadden, D., Plamondon, A., & Imbeau, D. (2011). Sudden loading perturbation to determine the reflex response of different back muscles: a reliability study. Muscle & nerve, 43(3), 348-359.
14. Shrout, P. E., & Fleiss, J. L. (1979). Intraclass correlations: uses in assessing rater reliability. Psychol Bull, 86(2), 420-428.
15. Skotte, J. H., Fallentin, N., Pedersen, M. T., Essendrop, M., Strøyer, J., & Schibye, B. (2004). Adaptation to sudden unexpected loading of the low back--the effects of repeated trials. Journal of Biomechanics, 37(10), 1483-1489.
16. Vera-Garcia, F. J., Brown, S. H. M., Gray, J. R., & McGill, S. M. (2006). Effects of different levels of torso coactivation on trunk muscular and kinematic responses to posteriorly applied sudden loads. Clinical Biomechanics (Bristol, Avon), 21(5), 443-455.

165
ASSESSEMENT OF ISOMETRIC TRUNK STRENGTH – THE
RELEVANCE OF BODY POSITION AND RELATIONSHIP BETWEEN
PLANES OF MOVEMENT
Andrej Kocjan1 and Nejc Sarabon1, 2 1UP, Science and Research Centre, Institute for Kinesiology Research, Koper, Slovenia
2S2P, Laboratory for Motor Control and Motor Behaviour, Ljubljana, Slovenia
Abstract
The aim of the study was to assess the differences in maximal isometric trunk extension and flexion strength during standing, sitting and kneeling. Additionally, we were interested in correlations between sagittal, frontal and transverse plane trunk strength. To achieve the objectives of the study, a custom built multidirectional trunk dynamometer was developed. Sixty healthy subjects (24 male, 36 female; age 41.3±15.1 yrs; body height 170.0±9.3 cm; body mass 72.7±13.3 kg) performed maximal voluntary isometric strength of the trunk flexor and extensor muscles in standing, sitting and kneeling position. The subjects also performed lateral flexion and rotations in the sitting position. Each task was repeated three times and average of maximal forces was used for data analysis. RANOVA with post-hoc testing (Sidak) was applied to the flexion and extension data. Alpha was set at p < 0.05. The highest average force for trunk extension was recorded in sitting posture (910.5 ± 271.5 N), followed by kneeling (834.3 ± 242.9 N) and standing (504.0 ± 165.4 N), compared with flexion, where we observed the opposite trend (508.5 ± 213.0 N, 450.9 ± 165.7 N and 443.4 ± 153.1 N respectively). Significant interaction effects were found for all extension positions (p< 0.0001) and between sitting/standing (p = 0.018) and kneeling/standing (p = 0.033) flexion exertions. The extension/flexion ratio for sitting was 2.1±0.4, for kneeling 1.9±0.4, followed by standing, where motion forward approximately equals motion backward (1.1±0.6). Trunk sagittal-transverse strength showed the strongest correlation, followed by frontal-transverse and sagittal-frontal plane correlation pairs(R² = 0.830, 0.712 and 0.657). The baseline trunk isometric strength data provided by this study should help in further strength testing diagnostics, more precisely in prevention of patients at risk of low back disorders.
Keywords: isometric trunk strength, dynamometry, low back pain
Introduction
Trunk strength plays an important role from different aspects – related to health and physical performance. Most researchers who compared healthy subjects´ trunk strength in different planes of movement found the greatest strength in sagittal extension (Smith,Mayer, Gatchel and Becker, 1985), followed by sagittal flexion, side bendings (Guzik,Keller, Szpalski, Park in Spengler, 1996) and rotations with the smallest force output (Beimborn and Morrissey, 1988). When low back pain (LBP) patients and healthy controls were compared, different conclusions have been reported. Nouwen, Akkerveeken and Versloot (1987) found different muscle activity of abdominal and back muscles during dynamic contractions of sagittal flexion only. On the contrary, Ng, Richardson, Parnianpour and Kippers (2002) found decreased isometric muscle strength in all planes of trunk movement in LBP subjects. Back in 1980McNeill, Warwick, Andersson and Schultzfound a deficit of isometric trunk extensor muscles in LBP subjects, while later studies (Leino, Aro and Hasan, 1987) did not confirm the importance of trunk isometric strength as a predictor of low back troubles. Because of different patterns in lumbo-pelvic motion in sagittal plane in LBP subjects (Esola, McClure, Fitzgerald and Siegler, 1996) and significantly higher compression forces on the lumbar spine during axial rotations (McGill, 2007), movements in sagittal and transverse planes are among the most investigated. Data byMcGill et al.(2003) suggested that in contrast to a single plane strength analysis, perturbed flexion-extension ratio is related to back

166
problems. Additionally, McGill (2007) suggested greater extensor than flexor strength influence in LBP patients, on the other hand, Lee et al. (1999) found an opposite trend in those people with back troubles.
While often studied independently, trunk and hip muscles act functionally together. Some studies compared static flexion and extension strength in relation to hip joint position. Keller and Roy (2002) found out higher values of extension-flexion ratio with increased hip flexion. Gallagher (1997) showed decreased peak torque of trunk extensors in kneeling compared to standing body position, in contrast with another study (Graves, 1990), where they found peak torque values of trunk extensors in full hip flexion.
Measurement of trunk muscles functions is an essential tool to get an insight into muscle strength and endurance. Although different approaches exist (static, isoinertial, isokinetic), isometriccomputerized dynamometry offers good reliability (Azghani, Farahmand, Meghdari, Vossoughi and Parnianpour, 2009), relatively cheap testing and a good pelvic fixation. Despite brand and protocol differences between various dynamometers, Demoulin et al. (2008) demonstrated significant inter-systemcorrelations of absolute maximal voluntary contractions (MVCs) values. The aim of this study was to assess trunk flexion and extension strength in different positions of hip joint in sagittal plane. Our second objective was to compare correlations in trunk strength between all three planes of trunk movement.
Method
Subjects
Sixty healthy adults (24 male, 36 female) volunteered for the study. Their age, body height and body mass were: [mean (standard deviation)]41.3 (15.1) years, 170.0 (9.3) cm and 72.7(13.3) kg, respectively. Participants with acute or chronic LBP, or systemic neurological disease were excluded. Subjects were informed about the study protocol before the beginning of the experiment and confirmed their voluntary participation by signing the informed consent. The study was approved by the National Medical Ethics Committee.
Measurement techniques
A multi-purposedynamometer was custom developed (S2P Ltd., Ljubljana, Slovenia)to measure isometric trunk strength in all three planes of trunk exertion. Maximal force was recorded via forcesensor (Z6FC3 – 200 kg, HBM, Darmstadt, Germany), which was traction loaded, depending on movement direction.Subjects were instructed to perform three maximal voluntary isometric contractions, towards trunk flexion and extension in standing, kneeling and sitting position. Additional testing contains both side bandings and rotations in sitting position.A single contraction gradually increased over ~2 seconds, followed by ~3 seconds of MVC. Rest periods between individual contractions were ~15 seconds long, while rest periods between different tests were ~5 min long. All subjects were verballyencouraged to exert their maximal effort.A rigid strap was tightly fastened across the pelvic girdle to achieve good fixation. Another strap was used and placed at chest level to counteract trunk muscle moments in sagittal and frontal planes of movement exertions. To restrain the torque of trunk rotators we moved the strap and placed it across a single shoulder. Knees were fixed on mid tibial level by an adjustable support bar.
Signal processing and statistical analysis
Custom software (LabView 2011, Austin, USA)was used for signal processing. Maximal force was evaluated as the peak value within one second time interval. An average of three repetitions was included into the further statistical analysis. Repeated-measures ANOVA was used to compare values for each position of flexion and extension movements. Sidak post-hoc test was applied to assess possible statistical differences between the positions. Pearson’s correlation was used to study relationship between trunk strength in different planes of movement.Alpha was set atp < 0.05. Statistical analyses were done in SPSS (SPSS statistics 19, IBM, New York, USA).

167
Results
The effect of body position on the amplitude of force during flexion and extension movements and their ratio is shown in Figure 1. The highest forcefor trunk extension was recorded in sitting posture (910.5 ± 271.5 N), followed by kneeling (834.3 ± 242.9 N) and standing (504.0 ± 165.4 N). The opposite trend was observed for trunk flexion (508.5 ± 213.0 N, 450.9 ± 165.7 N and 443.4 ± 153.1 N, for standing, kneeling and sitting, respectively). Significant interaction effects were found in all extension positions (p < 0.01), and between sitting/standing (p = 0.018) and kneeling/standing (p = 0.033) flexion exertions.
The extension/flexion ratio for sitting was 2.1 ± 0.4, for kneeling 1.9 ± 0.4, followed by standing, where motion forward approximately equals motion backward (1.1 ± 0.6). Significant interaction effects were found in all body positions (p < 0.01).
Figure 1. Comparison of trunk flexion and extension maximal voluntary contractions (MVCs) in different positions of the hip joint in sagittal plane and their force ratio. * represents significant differences between body positions. P < 0.05.
An assessment of correlations between trunk movements in all three planes is shown in Figure 2. Trunk strength in sagittal-transverse plane showed the strongest correlation, followed by frontal-transverse and sagittal-frontal plane correlation pairs (R² = 0.830, 0.712 and 0.657, respectively).
Figure 2. Pearson´s correlation of trunk maximal voluntary contractions(MVCs) in different planes of trunk movement in sitting position.
Discussion
Two main findings were observed in the present study. First, trunk isometric extension strength in sagittal plane increased with decreased hip joint flexion. An opposite trend was identified during the same pattern of flexion movement. Second, while testing the relationships of strength between various planes of trunk exertions, we found the strongest correlation between sagittal and transverse plane.
Force assessment on the thoracic level is a result of a complex integration of trunk, pelvic and hip muscles. Iliopsoas muscle originates from the lumbar spine and consequently influences the final torque output during trunk forward bending. Despite our effort, we could not reach 100% pelvic fixation, which led to some antero-posterior pelvic tilt during trunk exertions. The initial pelvic rotation and lumbar spine position were different in each subject during sitting, kneeling and standing position.Deviations between the highest and the lowest torque differences during flexion/extension movements might be a result of different hip muscles activity. Differences among the three body positions (sitting, kneeling and standing) were more pronounced for trunk extension (44.7%) than for flexion (12.8%).We can suppose that different moment arms and muscle lengths (relative to the length in neutral position) change in

168
accordance to hip positions. They were higher in hamstrings and gluteus maximus than in their antagonist muscles. Long head of biceps femoris, semitendinosus and semimembranosus are all biarticular muscles. Because of that, their maximal torque production is highly dependent on hip and knee joint positions. In our case we observed large angle variations of these joints during different tasks. On the other side, the most powerful hip flexor, the iliopsoas muscle, is monoarticular with less moment arm length variations during various positions of trunk flexion (Carman and Milburn, 2004). The latter fact and iliopsoas´ relatively short length can be associated with reduced force alterations during various hip positions. Although some biarticular hip flexors exist, their contribution to overall torque production is lower than hamstrings´ contribution. Rectus femoris, sartorius and tensor fasciae latae muscles have smaller cross-sectional area than hamstrings.
The strongest strength correlation between sagittal and transverse plane can be associated with similar muscle mass involved during these two movements and more developed intermuscular coordination between these planes. Although, the prime movers during axial rotation are the external and the internal oblique muscles, some degree of rectus abdominis can be detected during trunk rotation. Incorrect trunk action with too much trunk flexion during rotation task might be a reason for an elevated activity of rectus abdominis. In contrast, when movements in frontal and sagittal plane were compared, more strength oscillations were observed. Subjects´ ideas of the proper movement performance might have the strongest influence on their trunk lateral flexion performances. In daily life, trunk functional movements are performed mostly in sagittal and transverse plane or they are a combination of both. Because of these reasons, motor programs and associated intermuscular coordination in these planes of trunk exertions are developed the most.
One of the limitations of our study could be the reliability of trunk strength measures. Some low back patients can express some discomfort if they are assessed in a single trunk angle only. Robinson,Greene, O'Connor, Graves in MacMillan (1992) examined isometric trunk extension strength in seven degrees body positions. They found different levels of test-retest reliability between various angles, with measures of reliability being the lowest in the most extended positions.
Although, different studies lead to different conclusions, pelvic fixation and lumbar support could be problematic in the present study. Namely, Graves et al. (1994) showed a significant improvement of static trunk isolated extensor´s strength after dynamic resistance training, in conditions of good pelvic and tight fixation only. It seems that the same tension of pelvic fixation is required for all subjects to achieve optimal spinal muscles targeting. The same might be true for knee and feet support during trunk lateral flexion, because our dynamometer construction did not allow sufficient fixation for lower extremities during frontal plane strength assessment.
ACKNOWLEDGMENT
Nejc Sarabon would like to acknowledge the support of the Slovenian Research Agency, grant no. L5―4293.
References
1. Azghani, M.R., Farahmand, F., Meghdari, A., Vossoughi, G., & Parnianpour, M. (2009). Design and evaluation of a novel triaxial isometric trunk muscle strength measurement system. Proc Inst Mech Eng H, 223 (6), 755-66.
2. Beimborn, D.S., & Morrissey, M.C. (1988). A review of the literature related to trunk muscle performance. Spine, 13 (6), 655-60.
3. Carman, A.B., & Milburn, P.D. (2005). Dynamic coordinate data for describing muscle–tendon paths: a mathematical approach. J Biomech, 38 (4), 943-51.
4. Demoulin, C., Grosdent, S., Crielaard, J.M., Jidovtseff, B., Smeets, R., Verbunt, J., & Vander- Thommen, M. (2012). Muscular performance assessment of trunk extensors: a critical appraisal of the literature in the book. Low Back Pain, 145-165.
5. Esola, M.A., McClure, P.W., Fitzgerald, G.K., & Siegler, S. (1996). Analysis of lumbar spine and hip motion during forward bending in subjects with and without a history of low back pain. Spine, 21 (1) 71-8.

169
6. Gallagher, S. (1997). Trunk Extension Strength and Muscle Activity in Standing and Kneeling Postures. Spine, 22, 1864-72.
7. Graves, J.E., Pollock, M.L., Carpenter, D.M., Leggett, S.H., Jones, A., MacMillan, M., & Fulton, M. (1990). Quantitative assessment of full range-of-motion isometric lumbar extension strength. Spine, 15 (4), 289-94.
8. Graves, J.E., Webb, D.C., Pollock, M.L., Matkozich, J., Leggett, S.H., Carpenter, D.M., Foster, D.N., & Cirulli, J. (1994). Pelvic stabilization during resistance training: its effect on the development of lumbar extension strength. Arch Phys Med Rehabil, 75 (2), 210-5.
9. Guzik, D.C., Keller, T.S., Szpalski, M., Park, J.H., & Spengler, D.M. (1966). A biomechanical model of the lumbar spine during upright isometric flexion, extension, and lateral bending. Spine, 15,21 (4), 427-33.
10. Keller TS, Roy AL. Posture-Dependent Isometric Trunk Extension and Flexion Strength in Normal Male and Female Subjects. J Spinal Disord Tech 2002; 15(4):312-8.
11. Lee, J.H., Hoshino, Y., Nakamura, K., Kariya, Y., Saita, K., & Ito, K. (1999). Trunk muscle weakness as a risk factor for low back pain. A 5-year prospective study. Spine, 24 (1), 54-7.
12. Leino, P., Aro, S., & Hasan, J. (1987). Trunk muscle function and low back disorders: A ten-year follow-up study. J Chronic Dis 40 (4), 289-96.
13. McGill, S. (2007). Low back disorders. Champagne. Human Kinetics.
14. McGill, S., Grenier, S., Bluhm, M., Preuss, R., Brown, S., Russell, C. (2003). Previous history of LBP with work loss is related to lingering deficits in biomechanical, physiological, personal, psychosocial and motor control characteristics. Ergonomics 46 (7), 731-46.
15. McNeill, T., Warwick, D., Andersson, G., Schultz, A. (1980). Trunk strengths in attempted flexion, extension, and lateral bending in healthy subjects and patients with low-back disorders. Spine, 5 (6), 529-38.
16. Ng, J.K., Richardson, C.A., Parnianpour, M., & Kippers, V. (2002). EMG activity of trunk muscles and torque output during isometric axial rotation exertion: a comparison between back pain patients and matched controls. J Orthop Res, 20 (1), 112-21.
17. Nouwen, A., Van Akkerveeken, P.F., & Versloot, J.M. (1987). Patterns of muscular activity during movement in patients with chronic lowback pain. Spine, 12 (8), 777-82.
18. Robinson, M.E., Greene, A.F., O'Connor, P., Graves, J.E., & MacMillan, M. (1992). Reliability of lumbar isometric torque in patients with chronic low back pain. Phys Ther, 72 (3), 186-90.
19. Smith, S.S., Mayer, T.G., Gatchel, R.J., & Becker, T.J. (1985). Quantification of lumbar function. Part 1: Isometric and multispeed isokinetic trunk strength measures in sagittal and axial planes in normal subjects. Spine, 10 (8), 757-64.

170

171
DIFFERENCES IN THE LEVELS OF REPETITIVE STRENGTH OF
YOUNG FOOTBALLERS
Miroslav Smajić1, Dejan Madić1, Slavko Molnar1, Goran Dimitrić1, Bogdan Tomić2 and Saša Radosav1
1 Faculty of Sport and Physical Education, University of Novi Sad, Serbia 2 Sport’s Academy, Belgrade, Serbia
Abstract
Training viewed as a transformation process requires a player’s great effort under difficult conditions, as well as extremely developed abilities and characteristics necessary for achieving success in football. In order to preserve a good quality of football, which has evidently fallen due to disorganized or failed systematic selection, special attention should be given to work with younger age categories of footballers. The mission of science in this matter is to determine particular principles and rules of transformation processes of anthropological characteristics important for football, while the training technology should find the most optimal training contents (aids, methods, and loads) for transformation of the above characteristics.
The purpose of this research is to determine differences in the levels of repetitive strength of young footballers.
The research sample included 120 footballers of different age categories from the football club “Vojvodina” (30 under 12s (11.5±0.5), 30 under 14s (13.5±0.5), 30 under 16s (15.5±0.5), and 30 under 18s (17.5±0.5). For the evaluation of the level of repetitive strength of young footballers tests push-ups and sit-ups were applied. Testing the significance of differences between young footballers at different age categories, as well as deviation from expected values, was calculated by the t-test and univariate analysis of variance (ANOVA).
According to the obtained results we can conclude that average results show general tendency of improving the results of younger towards older age categories (with the exception of in the push-up test where U12s have better average results than the U14s). The measuring of variability indicates that in the push-up test U18s are most homogeneous and most heterogeneous are U14s, while in the sit-up test most homogeneous are U18s and U12s are most heterogeneous. In the push-up test, there are statistically significant differences between U14s and U18s (level of significance p=0.05), while in other age categories differences of arithmetic means are not statistically significant and in the sit-up test there are no statistically significant differences between the different age categories.
Keywords: differences, levels, repetitive strength, young footballers.
Introduction
Training viewed as a transformation process requires a player’s great efforts under difficult conditions, as well as extremely developed abilities and characteristics necessary for success in football. In order to preserve a good quality of football, which has evidently fallen due to disorganized or failed systematic selection, special attention should be given to work with younger age categories of footballers. The mission of science in this matter is to determine particular principles and rules of transformation processes of anthropological characteristics important for football, while the training technology should find the most optimal training contents (aids, methods, and loads) for transformation of the above characteristics (Bompa, 2006).
Today’s level of the development of football requires a high level and rhythm of game, exquisite fitness and the level of technique in movements which depends on a number of motor abilities and effort invested on behalf of a footballer during every training (Ostojić, 2006).

172
Contemporary football game and increased demands to achieve top results impose the necessity to take a high quality expert and scientific approach, not only in the case of selection of future footballers, but also in the application of training technologies in working with younger categories.
The contemporary training technology in working with younger football selections includes making training programmes which will be completely adjusted to the characteristics of a certain age and individual abilities of every footballer and as such add to the optimal development of all characteristics and abilities which define anthropological status of an individual in all phases of development. Past research has showed that human characteristics and abilities are most efficiently developed when the dynamics of the training process matches the dynamics of the natural development of certain characteristics and abilities. A large number of researchers agree with that fact (Gajić, 1985, Matvejev, 2000, Malacko, 2002, Spamer et al. 2002, Višnjić et al. 2004, Joksimović, 2006) who point out that the periods of ontogenesis, when the most significant dynamics of development of certain characteristics and abilities is naturally achieved, are most convenient for the development of assumptions necessary for the establishment for certain motor knowledge. That is the reason why in the past years there has been an increased interest in including children and adolescents in sports activities, since the process of growing up, according to some studies (Aoron et al. 1995, Drabik 1996, Markus et al. 2000, Malacko 2002, Stewart et al. 2004), is especially sensitive to the possibility of expressing negative influences.
In that context it is necessary to know and determine the role of motor abilities as a special subsystem of a football game (Joksimović, 2005). Taking into account the demands of contemporary football game and players’ position in a team, together with the fact that a player has to be able to fulfill such demanding tasks, it is certainly necessary to possess a high quality motor structure with the motor abilities which give a certain advantage in a game (Smajić et al., 2008). The analysis of component structure offers significantly bigger possibilities to manage and lead training technologies in football, as well as in the selection of future generations. At the same time, such analysis can offer monitoring of the functions of connections between every subsystem inside a football game (Radosav et al., 2003; Bajrić, 2009).
Strength is certainly one of the most important motor abilities. It is defined as an ability of a person to overcome the resistance coming from outside and oppose it by muscle tension (Zatsiorsky, 1975).
The time when the training of strength was an obstacle in football practice is long gone, first of all because of the development of too much body mass and limited movements, which, supposedly, had a negative influence on footballers’ technique and agility. The training of strength has the greatest potential of all activities to prevent injuries (Kramer and Fleck, 1993).
Past research of motor abilities has proved not only the existence of strength as a dimension of motor space, but also the accession in the opinion that strength is one of basic abilities which is vital for efficient functioning of a human system in doing different motor tasks. There is no motor action which does not, at least partially, depend on strength (Čabrić, 1970, Kurelić et al., 1975).
Studies which deal with manifested strength are numerous and various. Recently there have been many efforts to find the adequate methods and techniques for development and improvement of strength.
According to a large number of studies, strength can be divided into three groups according to the type of action: explosive, repetitive and static.
Dynamic strength, or the ability to develop muscle forces which allow the repetition of certain simple movements included in lifting and moving the weight of a certain load or the body itself, or the ability to repetitively move a load or body, with overcoming the resistance by isotonic muscle contractions is called repetitive strength.
Repetitive strength of football players is very important, as well as other abilities since it has been proved that it has a great importance as one of the dominant motor abilities in movement structures in football (Talović, 2001).
The purpose of this research is to determine differences in the levels of repetitive strength of young footballers.

173
28.3
25.1
30.632.1
0
5
10
15
20
25
30
35
11.5±0.5years
13.5±0.5years
15.5±0.5years
17.5±0.5years
Age
Push-ups (number) mean values
Method
The research sample included 120 footballers of different age categories from the football club “Vojvodina”, consisting of 30 U12s (11.5±0.5), 30 U14s (13.5±0.5), 30 U16s (15.5±0.5), and 30 u18s (17.5±0.5). For evaluation of the level of repetitive strength of young footballers tests pushup and abdominals were applied. Testing the significance of differences between young footballers in different age categories, as well as the deviation from expected values was calculated by “t-test” and the univariate analysis of variance (ANOVA).
Results
According to the obtained results (Table 1 and Graph 1) it can be concluded that the results are different for different age categories. The lowest average values are present in the group of U14s and the highest in the group of U18s.
All groups share a big non-homogeneity in this variable. However, the most homogeneous is the group of boys aged 13.5±0.5.
The results obtained by implementing the t-test make us conclude that the differences between arithmetic means are statistically significant in the case of U14s and U16s on the level of significance p=0,05.
ANOVA analysis showed that the variability between groups (MSbg=278,675) is bigger than the variability inside groups (MSwg=80,42155), as well as the existence of statistically significant differences between groups.
Table 1. Basic descriptive statistical parameters in the test push-ups
AGE CATEGORIES N x MIN MAX S V (%) t
11.5±0.5 YEARS 30 28,30 12,00 50,00 9,53 33,68
13.5±0.5 YEARS 30 25,10 10,00 42,00 9,71 38,67
15.5±0.5 YEARS 30 30,60 18,00 52,00 7,62 24,90
17.5±0.5 YEARS 30 32,10 15,00 50,00 8,86 27,61
** statistically significant on the level p=0,05
Graph 1. The level of repetitive strength in the test push-ups
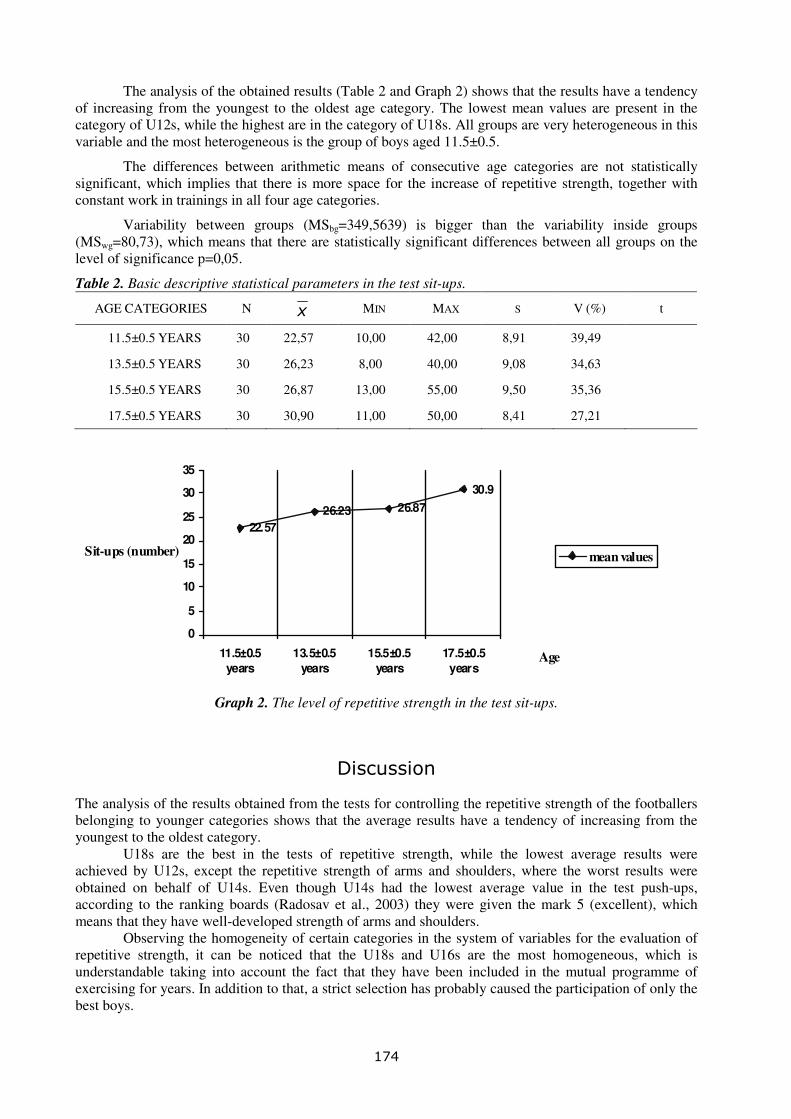
174
22.57
26.23 26.87
30.9
0
5
10
15
20
25
30
35
11.5±0.5
years
13.5±0.5
years
15.5±0.5
years
17.5±0.5
yearsAge
Sit-ups (number) mean values
The analysis of the obtained results (Table 2 and Graph 2) shows that the results have a tendency of increasing from the youngest to the oldest age category. The lowest mean values are present in the category of U12s, while the highest are in the category of U18s. All groups are very heterogeneous in this variable and the most heterogeneous is the group of boys aged 11.5±0.5.
The differences between arithmetic means of consecutive age categories are not statistically significant, which implies that there is more space for the increase of repetitive strength, together with constant work in trainings in all four age categories.
Variability between groups (MSbg=349,5639) is bigger than the variability inside groups (MSwg=80,73), which means that there are statistically significant differences between all groups on the level of significance p=0,05.
Table 2. Basic descriptive statistical parameters in the test sit-ups.
AGE CATEGORIES N x MIN MAX S V (%) t
11.5±0.5 YEARS 30 22,57 10,00 42,00 8,91 39,49
13.5±0.5 YEARS 30 26,23 8,00 40,00 9,08 34,63
15.5±0.5 YEARS 30 26,87 13,00 55,00 9,50 35,36
17.5±0.5 YEARS 30 30,90 11,00 50,00 8,41 27,21
Graph 2. The level of repetitive strength in the test sit-ups.
Discussion
The analysis of the results obtained from the tests for controlling the repetitive strength of the footballers belonging to younger categories shows that the average results have a tendency of increasing from the youngest to the oldest category.
U18s are the best in the tests of repetitive strength, while the lowest average results were achieved by U12s, except the repetitive strength of arms and shoulders, where the worst results were obtained on behalf of U14s. Even though U14s had the lowest average value in the test push-ups, according to the ranking boards (Radosav et al., 2003) they were given the mark 5 (excellent), which means that they have well-developed strength of arms and shoulders.
Observing the homogeneity of certain categories in the system of variables for the evaluation of repetitive strength, it can be noticed that the U18s and U16s are the most homogeneous, which is understandable taking into account the fact that they have been included in the mutual programme of exercising for years. In addition to that, a strict selection has probably caused the participation of only the best boys.

175
However, it can be seen that in the test sit-ups all age categories are very heterogeneous and the differences in the training levels between the categories are not statistically significant, which can indicate that there was a certain imperfection in the measuring instruments or measurements, taking into account that the differences in the results are numerically visible or a high level of the development of this dimension was reached.
The obtained results are very similar to the ones obtained in one of the previous studies of repetitive strength of abdominals, evaluated by a similar test- sit-ups in 30 seconds. It was established that it has the greatest dynamics of increase in the case of six graders (aged 13±0.5) and that increase slowly starts to go down after that age (Džibrić et al., 2012).
When we evaluate the result in accordance with the boards for evaluation (Radosav et al., 2003) we can see that all four age categories have the mark 5 (excellent), which means that the strength of their abdominals is well developed.
In some previous studies, it was also confirmed that the effects of training make the positive influence on the development of repetitive strength of young players. The results of one study showed the results which were similar to the ones obtained in the research which was implemented earlier. In the coming period special attention should be paid to the development of repetitive strength of abdominals due to the fact that the results did not show the expected progress (Rakočević, 1996).
The level of repetitive strength of young athletes was also monitored in other sports. Accordingly, during one research the level of repetitive strength of young tennis players was observed, where, similarly to this research, there was a constant trend of increasing or improving the results (Neljak and Vučetić, 2003).
References
1. Aaron DJ, Dearwater SR, Anderson R, Olsen T, Kriska AM, i Laporte RE. (1995). Physical activity and the initiation of high-risk health behaviors in adolescents. Med Sci Sports Exerc, 27, 1639–1645.
2. Bajrić, O. (2008). Efekti trenažnih transformacionih procesa morfoloških karakteristika, motoričkih sposobnosti, situaciono – motoričkih sposobnosti i uspešnosti u igri nogometaša uzrasta 14 do 16 godina (Doktorska disertacija). Sarajevo: Fakultet sporta i tjelesnog odgoja.
3. Bompa, T. (2006). Teorija i metodologija treninga. Zagreb: Nacionalna i sveučilišna knjižnica.
4. Čabrić, M. (1970). Razvoj snage u sportu. Beograd: Partizan.
5. Drabik, J. (1996). Children i Sports Training. Vermont: Stadion Publichig Companz.
6. Džibrić, Dž., Mehinović, J., Malović, Z., Ćejvanović, I. (2012). Praćenje dinamike razvoja odreñenih antropoloških dimenzija kod učenika viših razreda osnovne škole. Sport Mont, 6 (34,35,36), 247-253.
7. Gajić, M. (1985). Osnovi motorike čoveka. Novi Sad: Fakultet fizičke kulture.
8. Joksimović, A. (2005). Efekti modela treninga mladih fudbalera na razvoj eksplozivne snage (Doktorska disertacija). Niš: Fakultet fizičke kulture.
9. Joksimović, A. (2006). Uticaj antropometrijskih mera na rezultatsku efikasnost voñenja lopte po pravoj liniji na 20 metara. Nacionalni skup sa meñunarodnim učešćem „Fis Komunikacije 2006“. Niš: Fakultet sporta i fizičkog vaspitanja.
10. Kraemer, W.J., & Fleck, S.J. (1993). Strength training for young athletes. Champaign, IL: Human Kinetics.
11. Kurelić N., Momirović, K., Stojanović, M., Radojević, Ž. i Viskić-Štalec, N. (1975). Struktura i razvoj morfoloških i motoričkih dimenzija omladine. Beograd: Institut za naučna istraživanja. Fakultet za fizičku kulturu.
12. Malacko, J. (2002). Sportski trening. Novi Sad: Fakultet fizičke kulture.
13. Marcus BH, Dubbert PM, Forsyth LH, McKenzie TL, Stone EJ, Dunn AL, Blair SN. (2000). Physical activity behavior change: issues in adoption and maintenance. Health Psychol, 19 (1), 32–41.

176
14. Matvejev, L.P. i Ulaga, S. (2000). Osnovi suvremenog sistema sportivnoj trenirovki. Moskva: FIS.
15. Neljak, B. i Vučetić, V. (2003). Orijentacijske vrednosti rezultata nekih testova za procenu motoričkih sposobnosti tenisera. U Kondicijska priprema sportaša (str. 578-581). Zagreb: Zagrebački velesajam.
16. Ostojić, S. (2006). Profilisanje vrhunskog fudbalskog sportiste. Sportska medicina, 6(2): 5-15.
17. Radosav, R., Molnar, S., Smajić, M. (2003). Teorija i metodika fudbala. Novi Sad: Fakultet fizičke kulture.
18. Rakočević, T. (1996). Efikasnost primene aktivnosti za razvoj repetitivne snage u manifestaciji situacione preciznosti početnika u fudbalu. [The efficiency of application activities for development of repetitive strength in the manifestation situational of precision a beginner in football] (Doctoral dissertation). Novi Sad: Faculty of Physical Education.
19. Smajić, M., Radoman, M., Molnar, S. (2008). Struktura bazično motoričkih sposobnosti fudbalera uzrasta 10 – 12 godina. Sport Mont, 6 (15,16,17), 553-556.
20. Spamer, E.J. i Caetzee, M. (2002). Varijable koje razlikuju talentirane od manje talentiranih mladih sportaša – komparativna studija. Kineziologija, 34(2), 141-152.
21. Stewart JA, Dennison DA, Kohl HW, Doyle JA. (2004). Exercise level and energy expenditure in the Take 10! Inclass physical activity program. J Sch Health, 74, 397–400.
22. Talović, M. (2001). Efekti programa na poboljšanje motoričkih i funkcionalnih sposobnosti kao i nekih elemenata tehnike nogometaša (Doktorska disertacija). Sarajevo: Fakultet za fizičku kulturu.
23. Višnjić, D., Jovanović, A. i Miletić, K. (2004). Teorija i metodika fizičkog vaspitanja. Beograd: Fakultet sporta i fizičkog vaspitanja Univerziteta u Beogradu.
24. Zatsiorsky, V.M. (1975). Science and Practice of Strenght Training. Champaign Illionis: Human Kinetics.

177
FACTORIAL VALIDITY OF MOTOR TESTS FOR ASSESSING
EXPLOSIVE STRENGTH
Ivan ðinić, Ilona Mihajlović and Miloš Petrović Faculty of Sport and Physical Education, University of Novi Sad, Serbia
Abstract
Over the past several decades, researches with subject involving reduction of a large number of motor variables with aim to define a part of psychosomatic status had become more and more frequent. The sample of 120 male pupils that were attending 7th grade of elementary schools in Municipality of Bogatić, Serbia were subjected to measurements of motor abilities with the battery of fifteen tests for assessing explosive strength. Metric characteristics of all tests were good and satisfactory and the results of factor analysis transformed system of fifteen manifest variables into the model of two factors interpreted in the sense of topology structure as: explosive strength of lower extremities and explosive strength of upper extremities. The highest factorial validity had test Medicine ball put from a laying back position (0,97), lower but relatively homogeneous correlation with two explosive factors had tests Standing long jump (0,94), Sergeant jump test (0,92) and Sprint 20 m from a running start (-0,89).
Keywords: factorial validity, explosive strength, metric characteristics, jumps ability, throws ability, sprint.
Introduction
Over the past several decades, researches with subject involving reduction of a large number of motor variables with aim to define a part of psychosomatic status had become more and more frequent. Condensation of motor variables, which manifest motor abilities, enables process of following motor development, discovering the sensitive periods, controlling the effect of motor skills on every other aspect of behavior and managing of motor development.
Power is commonly defined as an ability that enables any individual maximal acceleration of its own body, part of it, object or partner in activities of throwing and pushing, jumping, hitting and sprinting (Milanović, 2005). This motor ability is familiar with every movemnets where entire body, a part of it or object extend its motion due to a given impulse or initial acceleration. Explosive strength is one of the determinants of success in all activities that requires manifestation of maximal muscular force in minimal amount of time (Newton & Kreamer, 1994). Therefore, explosive strength is important factor in those activities where is crucial to deliver great acceleration to a whole body, its part or an object. For that kind of activities, a number of simple tests which involve sprinting, horizontal or vertical jumping or throwing are constructed. In these tests, output of manifestation is registered in numerical values, usually in meters or seconds (Marković, 2005).
In present everyday science and research practice as far as in classes with students, the most common test for assessing the explosive strength was standing long jump. However, besides standing long jump, it is necessary to use other tests for evaluating all types of explosive strength (jumping, throwing and pushing, sprinting and hitting) in as many tests as it is possible to get complete information of this motor ability.
Topology of strength was a subject of Rarrick’s research in1947. Hutto (1938) indicates that there are several components of explosive strength alike Verkhoshanski & Tatyan (1983). Factorial validity was subject of investigation in study of Marković et al. (2004). They have examined reliability and factorial validity of seven tests for evaluating explosive power on sample of 93 subjects, and the results of the research indicated that the most reliable and valid tests for assesing of motor factor explained as explosive strength factor were Countermovement jump (CMJ) and Squat jump (SJ), but other tests had

178
relatively homogeny correlation with the extracted factor. Interesting is the study of Cumbee and Harris (1953) in terms of topological separation of explosive strength factors – on arms and legs (as per Kurelić et al., 1975). Novak et al. (2008) in their paper quote 4 modalities of explosive power (as per Milanović, 2005) and those are: throw or push, jump, hit and sprint types of explosive power. Gajić, Kalajdžić, Nićin & Bala (1981) analyzed structure of lower extremities explosive power on the sample of 1278 boys and girls aging 11 to 15 years. The results indicated on existence of five latent dimensions that were extracted from manifestation of 30 motor tests that were used to assess explosive power of lower extremities. Those factors are: ability to display considerable force in explosive movements in which the body is projected into distance, ability for conducting frequent movements with lower limbs, explosive strength of hip flexors, explosive strength of plyometric type in projection of body into distance and ability for rapid manifestation of effective force for activating lower extremities.
Method
Subjects
The sample of 120 male pupils, aging 13 to 14 years, that were attending 7th grade of elementary schools ,,Mika Mitrović’’(Bogatić), ,,Vuk Karadžić’’ (Badovinci), ,,Laza K. Lazarević’’ (Klenje), ,,Nikola Tesla’’ (Dublje), ,,Cvetin Brkić’’ (Glušci) and ,,Janko Veselinović’’ (Crna Bara). All subjects that were subdued the testing did regular medical inspection. The pupils who did not pass the medical test and could not attend the classes of PE were not tested.
Metric instruments
Authors constructed battery of 15 composite tests for testing explosive power of entire body, for which they believed that assess this motor ability: 5 jumps (Standing long jump, Sergeant jump test, Triple standing jump, Standing long jump back and Jump forward from a push-up position), 6 throws of 5 kg medicine ball (Medicine ball put forward from a standing position, Medicine ball put backward from a standing position, Medicine ball put forward from a standing position with a stride, Medicine ball put from a laying-back position, Medicine ball put from chest from a standing position and Medicine ball put from a knelling position) and 4 sprints (Sprint 20 m from a standing position, Sprint 30 m from a standing position, Sprint 20 m from a running start and Sprint 30 m from a running start).
Most of the applied tests are standardized and well known metric instruments which metric characteristics and factorial validity were tested in number of previous studies, but in this research the aim was to inspect its characteristics on different age category (13 to 14 years old boys). Most of the tests are Metikoš and al. (1989) described in details and test Jump forward from push-up position was constructed by Madić (2002). Testing procedure was applied three times a week and in every school, the data was taken in the same given order. The dynamic of motor testing was two tests in one class of 45 minutes. Between two tests, there were a plenty of time to rest.
Statistical analysis
Results of the battery of composite tests comprised of three items were analyzed with usual descriptive statistics. For further analysis, the mean of all three items of composite tests was used. Factorial validity of manifest variables was analyzed with factor analysis using factorization of cross-correlation matrix with keeping the main components by applying Kaiser – Gutmman criterion and promax transformation.
Results
For determination of factorial validity, factor analysis used the results of the mean of three items from the battery of 15 metric instruments. Metric characteristics of all tests were good and satisfactory and the results of factor analysis transformed system of fifteen manifest variables into the model of two main components for further analysis. The result of oblique rotation using promax criterion is pattern matrix – A (Table 1) which contains parallel projections of variables on two factors (coordination of vectors on factors).

179
Table 1. Pattern matrix - A and correlation of factors Variables A1 A2
1. Standing long jump
2. Sergeant jump test
3. Triple standing jump
4. Standing long jump back
5. Jump forward from a push-up position
6. Medicine ball put forward from a standing position
7. Medicine ball put backward from a standing position
8. Medicine ball put forward from a standing position with a stride
9. Medicine ball put from a laying-back position
10. Medicine ball put from chest from a standing position
11. Medicine ball put from a knelling position
12. Sprint 20 m from a standing position
13. Sprint 30 m from a standing position
14. Sprint 20 m from a running start
15. Sprint 30 m from a running start
(0,94)
(0,92)
(0,85)
(0,87)
(0,84)
0,09
0,18
-0,33
0,12
0,04
(0,84)
(-0,83)
(-0,73)
(-0,89)
(-0,73)
-0,09
-0,18
0,09
-0,01
0,04
(0,88)
(0,77)
(0,68)
(0,97)
(0,94)
0,04
-0,11
-0,23
0,02
-0,22
Correlation of factors 0,69
The highest parallel projection on first factor has variable Standing long jump. Very high correlations with the first factor have all sprint variables (minus sign in front means that better scores are the ones with lowest results – inverse metric). Considering saturation of factor with variables, this configuration of latent dimension may be interpreted as explosive strength of lower extremities. The most dominate projection on the structure of second factor have throwing variables, so this factor can be interpreted as explosive strength of upper extremities.
Factorial validity of tests for assessing the explosive strength is determined by level of correlation of variables and two factors. The highest level of correlation has variable Standing long jump (0.94), a somewhat lower Sergeant jump test and Sprint 20m from a running start. It is clear that this factor is comprised of sprinting and jumping variables. As far as the factorial validity of upper extremities is concerned, the highest level of correlation have Medicine ball put from a laying-back position (0.97), while a little lower level of saturation have all other throwing variables. Thus, this directs onto conclusion that Standing long jump and Medicine ball put from a laying-back position may be used as represents of both factors of explosive strength. It is clear that factor analysis of the test battery for assessing explosive strength divided explosive strength in terms of topology.
Discussion and conclusion
Next conclusions may be extracted based on the results of factor analysis: 1) Representative system composed of 15 variables for assessing explosive strength is factorized into latent two dimensional model, topologically explained as explosive strength of lower extremities and explosive power of upper extremities; 2) Further analysis gave a conclusion that explosive strength of lower extremities is comprised of explosive strength of jumping and sprinting type.
Factorial validity concluded that the most valid tests for assessing different types of explosive power were: Standing long jump, Sprint 20 m from a running start and Medicine ball put from a laying-back position. It is not surprising that these tests are the most common metric instrument in number of studies as a mean of measuring explosive strength and strength in general.

180
Picture 1 Types of explosive strength
Results extracted with different statistical analysis were expected. However, it must be underlined that exact aim of study had a very few researches. Researches that discus about topology of explosive strength are done in back in 1947 by Rarrick. . Hutto (1938) indicates that there are several components of explosive strength alike Verkhoshanski & Tatyan (1983). Nevertheless, these researches did not investigate topology of explosive strength, but only briefly gave their attitudes and other researches results.
Domain of strength is a subject of high priority of kinesiology experts, and the authors had a similar researches in studies of Cumbee and Harris (1953) in terms of topological separation of explosive strength factors – on arms and legs (as per Kurelić et al., 1975). In Milanović et al. study (2005), they analyzed explosive strength of hitting type, as well. Based on everything said and written, it is clear that the results of this research should be supplemented and confirmed with more sophisticated battery of tests and apparatus for registering the results of measuring the tests for assesing explosive strength.
References
1. Cumbee, F.Z., Harris, C.W. (1953). The Composite Criterion and its Relation to Factor Analysis. Research Quarterly, 28, 127-129.
2. Gajić, M, Nićin. ð., Kalajdžić, J., Bala, G. (1981). Struktura eksplozivne snage donjih ekstremiteta [The structure of explosive strength of lower extremities]. Novi Sad: Fakultet fizičke kulture [Faculty of physical culture].
3. Hutto, L.E. (1938). Measurement of the Velocity and Athletics Power in High School Boys. Research Quarterly, 9, 109-111.
4. Kurelić, N., Momirović, K., Stojanović, M., Šturm, J., Radojević, D., Viskić-Štalec, N. (1975). Struktura i razvoj morfoloških i motoričkih dimenzija omladine [The structure and development of the morphological and motor dimensions of youngsters] Beograd: Institut za naučna istraživanja Fakulteta za fizičko vaspitanje. [Institute for Scientific Researches of Faculty of Physical Education].
5. Matveev, L.P. (1981). Fundamentals of sports training. Moscow: Progress Publishers.
6. Metikoš, D., Prot, F., Hofman, E., Pintar, Ž., Oreb, G. (1989). Mjerenje bazičnih motoričkih dimenzija sportaša [Measuring basic motor dimensions of athletes]. Zagreb: Fakultet za fizičku kulturu [Faculty for physical culture].
7. Marković, G. (2005). Utjecaj skakačkog i sprinterskog treninga na kvantitativne i kvalitativne promjene u nekim motoričkim i morfološkim obilježjima. [Effects of sprint and plyometric training on motor and morphological characteristics], Doktorska disertacija [PhD Dissertation], Zagreb: Kineziološki fakultet [Faculty of kinesiology].
8. Markovic, G., Dizdar, D., Jukić, I., Cardinale, M. (2004). Reliability and factorial validity of squat and countermovement jump tests. J Strength Cond Res., 18(3), 551-555.
9. Milanović D., I. Jukić, D., Vuleta (2005): Metodološki pristup znanstvenim istraživanjima u sportskim igrama [Methodological approach of science researches in sport games]. Homo Sporticus, 2, 91-100.
THROWING AND PUSHING
JUMPING HITTING SPRINTING
EXPLOSIVE STRENGTH

181
10. Momirović, K. (2001). RTT11G: Program za analizu metrijskih karakteristika kompozitnih mernih instrumenata koji se sastoje od malog broja replikacija istog zadatka. Tehnički izveštaj [RTT11G: Program for analyzing metric characteristics of composite metric instruments which consist of a small number of the same task replication], Beograd: Institut za kriminološka i sociološka istraživanja [Institute for crime and social research].
11. Newton, R. U., Kraemer, W. J. (1994). Developing explosive muscular power: Implications for a mixed methods training strategy. Strength & Conditioning, 16(5), 20-31.
12. Novak, D., Neljak, B., Sporiš, G. (2008). Mogućnosti dijagnostike i razvoja eksplozivne snage putem nastave tjelesne i zdravstvene kulture [Possibilities of explosive strength diagnostic and development methods through the Physical Education]. Kondicijski trening, 6(1), 56-64.
13. Rarick, L. (1947). An analysis of the Speed Factor in Simple Athletics Activities. Research Quarterly, 8, 89-93.
14. Savić, Z., Pantelić, S., Ranñelović, N. (2008). Transformacija u snazi ruku i nogu nakon realizacije programa aktivnosti u prirodi [Transformation in arms and legs strength after realization of outdoor activities program]. Glasnik Antropološkog društva Srbije, 43, 573-580.
15. Verkhoshanski, Y., & Tatyan, V. (1983). Speed-strength preparation of future champions. Soviet Sports Review, 18, 166–170.

182

183
DIFFERENCES IN THE VERTICAL JUMPING POWER OF FOOTBALL
AND VOLLEYBALL PLAYERS
Dragan Doder1, Branko ðukić1, Živko Kalentić1, Nenad Sudarov1 and DejanViduka2
1 Provincial Institute of Sport and Sport Medicine, Novi Sad, Serbia 2 Spescom-Consulting d.o.o. Novi Sad
Abstract
Explosive strength is equally important for the success in football and volleyball games. Explosive strength in jumping is estimated by vertical jump from crouch with modern diagnostic apparatus which allows an exact measurement of various parameters that are valued component of explosive strength. The aim of the research is to assess vertical jump explosive strength in the sample of 32 athletes (14 soccer players and 18 volleyball players), aged 14-17 years, and then applying multivariate statistical methods and univariate analyzes of variance (MANOVA / ANOVA) in variables of two foot jump without preparation (CJ), jump with both feet with the preparation (CMJ) and the maximum jump with preparation (CJ max) determine statistically significant differences between athletes in mentioned sports games. Multivariate statistical significance of differences between arithmetic means of football players (Mf) and volleyball players (Mo) obtained at the level of .00 (p= .00), and univariate procedures statistically significant differences exists only in relation to the maximal jump (CMJ), also at the level of .00 (p= .00). On the basis of obtained results it can be concluded that the statistically significant differences in the assessment of vertical jump explosive strength, exist primarily because of differences in morphological characteristics (body height and body weight) and situational movement structures (technical and tactical elements).
Keywords: explosive strength, football, volleyball, differences, vertical jump.
Introduction
The explosive power is defined as the ability to engage the maximum of energy in one movement, in the shortest time possible (Malacko and Doder, 2008). The explosive power is an important factor in activities which need to achieve great acceleration of the body mass, or masses of individual body parts or of some external objects. This primarily implies to activities such as: jumps (jumping in basketball, handball and volleyball, athletics jumping events, etc.), (Newton and Kreamer, 1994).
Testing protocols of the explosive jumping power typ, i.e. of so-called isoinercial dynamometry, are conducted with tests in the form of vertical jumps, with or without a load, on the force measurement platform. Tests and their combinations estimate different forms of the explosive power of different jumping types, therefore each sport and its specifics dictate the test choice thus providing the most precised picture of a sportsman. (Čanaki, 2009, Ivanovic, et.al. Wisloff et al 1998, Fry et. al. 1991).
One of the most important preconditions for successful football or volleyball play is the high level of the explosive power of the lower extremities (Lolić, Bajrić, Lolić, 2011). Volleyball game structure demands from a player the performance of maximum jumps, while football players often conduct actions with quick change of direction, as well as the individual maximum jumps in certain segments of defense and offense play. Many authors who researched the area of the explosive power of the lower extremities proved that there are differences in the display of motoric abilities among the sportsmen of different sports branches (Krsmanović and Krulanović, 2008; Brodt, Wagner and Heat, 2008). The aim of this study is to establish the differences of the explosive power of the lower extremities between sportsmen who are playing football and volleyball.

184
Method
This research was conducted in the diagnostic center of the Provincial Institute for Sport and 32 sportsmen from the Provincial of Vojvodina were involved. They were divided in two groups according to the criteria of which sport they play 18 football players and 14 volleyball players were the sample of this research. All the subjects were male, 14 to 17 years of age.
Table 1. The basic parameters of subjects Parameters Mf (N=18) Mv (N=14)
A 15,38±1,20 15,86±0,86 BH 176,57±6,83 190,71±7,06 BM 67±9,27 78,79±10,86
Legend: Mf – male football players(N=(18); Mv – male volleyball players(N=14); A - age; BH – body height (cm); BM - body mass (kg)
The estimation of the lower extremities explosive power is tested with the motion tests: the maximum jump with preparation (Maximal Counter Movement Jump – CJ max), the jump with both feet without preparation (Squat Jump – SJ) and the jump with both feet with preparation (Counter Movement Jump – CMJ), and they were conducted on the tensoplatform “Fitro Jumper” in the testing cabinet of the Provincial Institute for Sport and Medicine in Novi Sad.
Each variable has the following statistic central and dispersive parametres calculated: M - arithmetical value, Min - minimal value, Max - maximal value and S - standard deviation. The normality of distributions were tested with Sk - skjunis and Ku - kurtosis.
The statistical method of multivariate analysis of variance and univariate analysis of variance (MANOVA/ANOVA) were used for establishing the arithmetical values of applied variables between football and volleyball players.
Multivariate testing of the nul-hypothesis which says that the group centroids are equal to the common centroid (GENERAL MANOVA), is conducted with: λ-Wilks' lambd test, F-relationship, and p-statistical significance <.05. Univariate statistical significance of the diifferential of arithmetical values according to variables is calculated with the F-test and p-statistical significance <.05. Data are processed with the SPSS 17 software.
Results
Analyzing the Table 1, it is clear that variables the maximum jump with preparation (CJ max), the jump with both feet without preparation (SMJ) and the jump with both feet with preparation (SJ) do not differ from the normal values (Sk), which shows that this is a well conducted measurement process.
Table 2: Basic statistic parameters and their discrimination Subjects M S min max Sk Ku CJ max
Football players 35,93 4,67 27,3 46,1 .02 .05 Valleyball players 39,46 4,04 32,8 45,2 -.21 -.92 SMJ Football players 30,35 4,14 22,7 37,5 -.07 -.59 Valleyball players 31,86 4,07 21,9 39,1 -.61 1.86 SJ Football players 28,34 3,86 18,5 34,4 -.75 .49 Valleyball players 28,66 3,15 24 35,2 .59 -.08
Legend: M – arithmetical value; S – standard deviation, Min – minimal value; Max – maximal value; Sk - skjunis; Ku - kurtosis; *the normality of the variable distribution: CJ max (maximum jump with preparation), SMJ (jump with preparation) and SJ (jump without preparation).

185
0
10
20
30
40
CJ max 35.93 39.46
CMJ 30.25 31.86
SJ 28.34 28.34
football players volleyball players
Graph1: Maximum jump with preparation (CJ max), jump with both feet without preparation (SMJ) and jump with both feet with preparation (SJ).
Table 3: Statistical parameters of univariate and multivariate analysis of variance (ANOVA/MANOVA) Variables Mf Mv F p CJ max 35,93 39,46 8,49 .00 SMJ 30,35 31,86 1,59 0.22 SJ 28,34 28,66 .01 0.76
λλλλ = .01 F = 14, 28 p = .00*
Legend: Mf –football players; Mv – volleyball players. Variables: CJ max (maximum jump with preparation), SMJ (jump with preparation), SJ (jump without preparation) Univariate and multivariate values: λλλλ - Wilk's lambd; F - test; p – statistical significance < .05
Table 3 shows that multivariate statistical significance between arithmetical values of football players (Mf) and volleyball players (Mv) is on the level .00 (p=.00), while the statistic significance gained only with univariate methods and only in maximum jump with preparation (CJ max) variable is on the level .00 (p=.00), and that is in favor of sportsmen who play volleyball. In the variables jump with both feet with preparation (SMJ) and jump with both feet without preparation (SJ) the arithmetical values are not statistically significant.
Discussion
The differences in the vertical jumping explosive power is confirmed by the researches of the authors (Krsmanović and Krulanović, 2008: Brodt, Wagner and Heat, 2008), who also concluded that volleyball players 14 -17 years of age have better explosive power of the lower extremities compared to football players of the same age. The early selection, i.e. trenage process of volleyball players because of its specifics is based more on the development of the explosive power of the lower extremities of the vertical jumping type. The trenage process in football, apart from improvements of the technical-tactic elements, is based more on the development of those motoric abilities which are dominant in this sport. (Molnar, Popović, Doder, Joksimović, 2009; Molnar, Doder, Popović, Smajić, 2010). Considering that these are adolescent sportsmen and that their entire motoric abilities are still developing (Nićin, 2000, Savić, Doder, Molnar, Doder, R, Babiak; 2010 Molnar, Smajić, Doder, 2009), it is justified to represent all motoric abilities important for football equally on trainings (Radosav, 1997; Molnar, Popović, Doder, 2010).

186
Conclusion
It can be concluded based on the research results that legs’ explosive power manifestation of the vertical jumping type of the sportsmen tested, show significant statistical differences. The differences in favor of volleyball players can be explained as the result of the differences in the situational movement structures (both technical and tactic elements) of the volleyball comparing to football play. The early selection and the trenage process technology in volleyball influenced that results of the research show that volleyball players have better explosive power of the lower extremities compared to football players.
References
1. Čanaki, M., Šoš, K., Vučetić, V. (2009). Dijagnostika eksplozivne snage tipa skočnosti-«kistler quattro jump. Zagreb: Kineziološki fakultet, Sportsko dijagnostički centar (www.bib.irb.hr/).
2. Brodt, J. V., Wagner, D. R., Heath, E. M. (2008). Countermovement Vertical Jump With Drop Step is Higher Than Without in Collegiate Football Players, Journal of Strength & Conditioning Research, 22(4), 1382-1385.
3. Fry, A.C., Kraemer, W.J., Weseman, C.A., Conroy, B.P., Gordon, S.E., Hoffman, J.R. (1991). The effects of an off-season strength and conditioning on starters and non-starters in women’s intercollegiate voleyball. J Appl Sport Sci Res, 5, 174-81.
4. Krsmanović, B. i Krulanović, R: (2008). Antropometrijske karakteristike i motoričke sposobnosti učenika starih 17 godina različitog sportskog usmerenja. Glasnik Antropološkog društva Srbije, 43, 182-193.
5. Lolić, V., Bajrić, O., Lolić, D. (2011). Struktura motoričkog prostora fudbalera kadetskog uzrasta. Sportske nauke i zdravlje, 1(2), 152-156.
6. Malacko, J. i Doder, D. (2008). Tehnologija sportskog treninga i oporavka. Novi Sad: Pokrajinski zavod za sport.
7. Molnar, S., Smajić, M. i Doder, D. (2009). Komparacija morfoloških karakteristika polaznika škole fudbala. Glasnik Antropološkog društva Srbije, 44, 201-206.
8. Molnar, S., Popović, S., Doder, D. & Joksimović, A. (2009). Designing a battery of the tests for assessing, monitoring and forecasting the results of the enrollees at the football. Kinesiologia Slovenica, 15(3), 13-28.
9. Molnar, S., Popović, S. & Doder, D. (2010). Comparation some motoric abilities two generation of football school players. Sport Mont, 21-22(6), 64-68.
10. Molnar, S., Doder, D. Popovic, S., Doder, R. & Smajić, M. (2010). Diagnostic validity of the tests for assessing and monitoring football-playing abilities in boys. Homo Sportikus, 12(1), 12-16.
11. Newton, R. U., Kraemer, W. J. (1994). “Developing Explosive Muscular Power: Implications for a Mixed Methods Training Strategy”. Strength and Conditioning Journal, 16(5), 20-31.
12. Nićin, ð. (2000). Antropomotorika-teorija. Novi Sad: Fakultet fizičke kulture.
13. Radosav, R.(1997). Fudbal. Novi Sad: Fakultet fizičke kulture.
14. Savić, B., Doder, D., Molnar, S., Doder, R. i Babiak, J.(2010). Funkcionalne sposobnosti mladih fudbalera i dece koja se ne bave sportom. Glasnik Antropološkog društva Srbije, 45, 437-436.
15. Wisloff U, Helgerud J, Hoff J. (1998). Strength and endurance of elite soccer players. Med Sci Sports Exerc., 30, 462-7.

187
DIFFERENCES BETWEEN LOWER LIMB EXPLOSIVE STRENGTH
OF MEN AND WOMEN ATHLETES WHO ARE ENGAGED IN
VARIOUS SPORTS Živko Kalentić1, Dragan Doder1, Branislav Strajnić1, Vojin Jovančević1, Nenad Sudarov1,
Goran Glamočić1 and Borut Pistotnik2
1 Provincial Institute for Sport and Medicine of Sport, Novi Sad, Serbia 2 Faculty of Sport, University of Ljubljana, Slovenia
Abstract
Common characteristic of successful athletes who are involved in tennis, athletics (sprint and jumping disciplines) and martial arts (judo, boxing, savate and kick boxing) is high level of the lower extremities explosive power expression. In the above mentioned sports are often performed fast movements, changes of direction and swift reaction from the spot as well as in movement, and the absence of explosive power would mean slower and less efficient performance of these elements as well as more possibilities of athletes injuries. The aim of this study is to establish whether among men and women athletes who are engaged in various sports differences of explosive strength of the lower extremities exist or not. Mentioned ability was analyzed using motion tests "Maximum jump with preparation" (Maximal Counter Movement Jump), on FITRO tenzoplatform "Fitro jumper". We tested 98 athletes from Vojvodina autonomy region, divided into two groups according to sex criteria, and in three subgroups according what sport they perform. Sample consisted of 17 tennis players (10 boys and 7 girls), 25 athletes (11 boys and 14 girls) and 56 involved in martial arts (34 boys and 22 girls). All subjects were from 14 to 16 years old. Testing was conducted in the laboratory for motor skills testing in Provincial Institute of Sports and Sports Medicine in Novi Sad. Central and dispersial parameters of whole sample were calculated by descriptive statistics, while the differences between the explosive power of the lower extremities among athletes in relation to sex and to the sport were analyzed by multivariate analysis of variance (MANOVA). Individual differences of explosive strength of lower limbs between athletes involved in various sports were analyzed by univariate analysis of variance (ANOVA). Results of multivariate analysis of variance (MANOVA) showed a statistically significant difference between tested athletes according to sex criteria (p = .00) and the criteria of engaging sport (p = .00) in the expression of the explosive power of the lower extremities. Individually,men athletes are statistically significantly different also in all three moving tests (p = .00), while female athletes differ only in moving test "Squat jump" - a jump with both feet without preparation (p = .03 ), and in other tests there was no difference in the expression of analized movement ability. The existence of differences can be explained by fulfilling specific training requirements which different sports require from athletes, as well as different levels of explosive power development that athletes conduct during training. The lack of statistically significant differences in all moving tests between girls engaged in various sports can be explained by the high level of heredity of analysed movement ability - explosive power.
Keywords: lower extremities explosive power, tennis, athletics, martial arts
Introduction
Explosive power is ability to perform fast movements with a constant load, and should not be affected by tiredness, with the goal of overcoming space in a short time (sprint), overcoming long-distance or height (jumps), as well as an ejection or kick of some ''object '' as far or as high speed (throws, kicks, punches). This is in big percent inborn ability, so it is necessary to influence on it from an early age. As such, the explosive force is one of the determinants for success in all activities that require muscular expression of maximum force in the shorter time possible (Newton and Kreamer, 1994.).

188
Testing protocols of explosive jumping power type, so-called. isoinercial dynamometry, are conducted with tests in the form of vertical jumps, with or without a load, on the platform for force measurment. Tests evaluate different forms of explosive strength/jumping ability type , so specifics of each sport dictate the test choice in order to obtain more complete picture of athlete (Čanaki, 2009).
Explosive power is an important factor in the activities in which strong acceleration of the body mass is needed, to mass of individual body parts and to external objects. This is primarily related to activities such as: jump (jumping in basketball, handball and volleyball, athletics jumping events, etc..) (Newton and Kreamer, 1994). Also, explosive power has an impact on the prevention of injuries (Faigenbaum and Schram, 2004.), as well as the general improvement of physical capacities (Faigenbaum 1993, the American Academy of Pediatrics, 2001).
In tennis, the explosive force manifests itself during the performance of almost all shots and is required for optimal movement of players on the field. Quality of changing direction movements performance, start and start acceleration and timely preparations for the shots depends on the concentric-eccentric muscle work (Antekolović, 2010).
In athletics, the importance of explosive power is priceless, especially in sprint and jumping events. Its greatest impact is at the start or in first 30m from the starting blocks (Tellez and Doolittle, 1984 by Bračič, 2010). This stage requires from athlete to explosively and quickly transforms acyclic motion (block reflection) to cyclic (sprint) (Čoh, Peharec and Bacic, 2007 by Bračič, 2010).
In martial arts explosive power is one of the most important motion abilities and with the speed of individual movement ability is ultimately responsible for all defensive and offensive actions (Sertić, 2004; Kuleš, 1998 by Sertić, 2008). Largest influence on the results in judo fights for children (and in adults, but in reverse order) have the following abilities: coordination and few types of strength, some of which are primary explosive and maximal strength (Lucic, 1988; Sertić, 1994 by Sertić, 2006).
A number of authors who research the area of man movement came to the conclusion that there are significant differences in the expression of the explosive power of the lower extremities between subjects involved in different sports (Drum, Stankovic, Drum, Dimic, Bednarik and Wheeler, 2010; Vračan, 2006 , Sertić, 2010).
The aim of this study was to determine whether between sportsmen and women, who conduct in different sports, exist differences in expression of explosive strength of the lower limb extremities.
Method
We tested 98 athletes from Vojvodina autonomy region, divided into two groups according to sex criteria, and in three subgroups according what sport they perform. Sample consisted of 17 tennis players (10 boys and 7 girls), 25 athletes (11 boys and 14 girls) and 56 involved in martial arts (34 boys and 22 girls). All subjects were from 14 to 16 years old.
The assessment of explosive strength of the lower extremities is done based on motion tests: maximum jump with preparation (Maximal Counter Movement Jump - MESCMJmax), jump with both feet without preparation (Squat Jump - MESSJ) and jump with both feet with preparation (Counter Movement Jump - MESCMJ) on tensoplatform "Fitro jumper" in the testing cabinet of Provincial Institute of Sports and Sports Medicine in Novi Sad.
Maximum jump with preparation (MESCMJmax) is performed so that the initial position of athlete is arms forward (for maximum jump height). During lowering in the squat athlete perform arms backward. Maximum reflection is followed and hands swing through arms adducted position over arms forward on to arms up position. The test assesses the eccentric-concentric component of jump explosiveness (jump height measured in centimeters).
Two feet jump from halfsquat with no preparation (MESSJ) derived from standing upright. Athlete's hands are tied at the hips (for maximum isolation during the jump). From a standing position athlete goes down into halfsquat, where stays for 2 seconds. The following is maximum vertical jump and landing with a slight knee flexion. The test assesses the concentric component of jump explosiveness (jump height was measured in centimeters).

189
Jump with both feet with preparation from halfsquat (MESCMJ). During the conduct of this test all phases of jump are related, ie. no break in the moment of changing direction. Athlete is standing upright for a few seconds, and his hands are tied at the hips (for maximum isolation during the jump). After that he goes down into halfsquat and immediately performes maximum vertical jump. The following is soft landing with a slight knee flexion. The test assesses the eccentric-concentric component of jump explosiveness (jump height was measured in centimeters)..
Central and dispersial parameters of the entire sample were calculated by descriptive statistics, while the differences between the explosive power of lower extremities among athletes, in relation to sex and to the sport, were analyzed by multivariate analysis of variance (MANOVA). The differences between the explosive power of the lower extremities among athletes involved in various sports were analyzed by univariate analysis of variance (ANOVA).
Results and Discussion
Table 1. Central and dispersion parameters of the entire sample Variable N MIN MAX AS SD MESSJ (jump with no preparation) tenis, athletics, martial arts 98 14.80 47.90 24.99 5.22
MESCMJ (jump with preparation) tenis, athletics, martial arts 98 16.20 48.00 27.44 5.63
MESCMJmax (maximum jump with preparation) tenis, athletics, martial arts 98 17.60 52.80 32.90 7.03
N - number of respondents, MIN - minimum value of the results, MAX - maximum value of the results, AS – mean results, SD - standard deviation
Table 1 shows the central and dispersion parameters from whole observed sample. The table shows that the total number of respondents was 98, and that the range between the minimum and maximum values of the results in all three tests are large. This means that there is no sense to observe respondents of both sexes together, because to the existence of a large range contributing maximum results of male population and minimal results of female population.
Table 2. Results of multivariate analysis of variance (MANOVA) according to gender criteria - the entire sample
N Variable
M W F p
MESSJ 55 43 11.71 .00 MESCMJ 55 43 15.87 .00
MESCMJmax 55 43 22.87 .00
λ=.03 F=906.04 p=.00
Results of multivariate analysis of variance of whole observed sample (Table 2) showed that there was no statistically significant difference between subjects divided into subsamples according to the criteria of sex (p = .00, λ = .03). The results show that it is justified, that the entire sample can be divided into subsamples according to sex criteria.
Table 3. Multivariate and univariate analysis of variance results in female athletes compared to the sport (MANOVA / ANOVA)
Variable N AS F p Tenis 7 22.43 Athletics 14 25.51
MESSJ
Martial arts 22 21.70 3.85 .03
Tenis 7 24.07 Athletics 14 27.49
MESCMJ
Martial arts 22 23.82 3.05 .06
Tenis 7 28.76 Athletics 14 32.26
MESCMJmax
Martial arts 22 27.84 2.65 .08
λ=.03 F=380.10 p=.00

190
Results of multivariate analysis of variance (MANOVA) in females (Table 3) show that, in the overall system of variables, there was a statistically significant difference (p = .00) among respondents who are engaged in various sports. And for the individual sports, differences were observed only in the test with both feet jump from halfsquat (MESSJ p = .03) in favor of runners (AS = 25.51), while in other tests we did not find statistically significant differences.
Table 4. Multivariate and univariate analysis of variance results in athletes compared to the sport (MANOVA / ANOVA)
Variable N AS F p
Tenis 10 23.51 Athletics 11 33.02
MESSJ
Martial arts 34 25.28 16.57 .00
Tenis 10 27.01 Athletics 11 34.77
MESCMJ
Martial arts 34 28.21 8.58 .00
Tenis 10 32.32 Athletics 11 42.87
MESCMJmax
Martial arts 34 34.23 11.81 .00
λ=.03 F=628.50 p=.00
Results of multivariate analysis of variance (MANOVA) in boys (Table 4) show that, in the overall system of variables, there is statistically significant difference between the subjects involved in different sports (p = .00). Also, looking at individual sports, differences were found in all tests: two feet jump from halfsquat with no preparation (p = .00 MESSJ, AS = 33.02), jump from halfsquat with preparation (p = .00 MESCMJ, AS = 34.77) and maximum jump with preparation (p = .00 MESCMJmax, AS = 42.87) in favor of the athletes involved in athletics.
The main objective of sprinters, and jumpers in athletics is to achieve the best result possible in one attempt, or to manifest maximum explosive force at one moment, without repeating it. Tennis players and athletes involved in martial arts, explosive strength, although one of the dominant motion capabilities is not crucial to achieve the best possible result - victory. In addition to motion capabilities and high level of technical knowledge, for good result in these sports, it is necessary that the athlete knows the tactics of their sport. For this reason, the training should be designed in such a way that a large part of the macro cycle and microcycle focuses on work on the development of technical and tactical elements. This fact can be explained by differences in the expression of explosive power in favor of the athletes involved in athletics, in which the achievement of results, largely depending on the explosive power of the lower extremities.
Conclusion
The study was conducted on 98 patients of both sexes, involved in athletics (sprint and jumping events), tennis and martial arts (kung fu, judo and kickboxing), showed that in the expression of the explosive power of the lower extremities, vertical jumping ability type, there were statistically significant differences between subjects in relation of gender. But for the girls statistically significant differences were observed only in the test with both feet jump from halfsquat with no preparation (MESSJ) in favor of the athletes involved in athletics, and for the boys there are statistically significant differences in all three tests, in favor of athletes. Differences in favor of the athlete, are explained by the fact that the training itself, and competition in the sprint events, are closely linked to the development of explosive power, which is one of the deciding factors for success. In other sports training itself, in addition to developing explosive power, a large part of its time is dedicated working on technique and tactics, and the specific tasks of chosen sport.

191
References
1. American Academy of Pediatrics, (2001). Strength Training, Weight and Power Lifting, and Body Building by Children and Adolescents. Pediatrics, 86 (5), 801-803.
2. Antekolović, Lj. i Žufar, G. (2010). Kondicijska priprema tenisača s aspekta održavanja razine eksplozivne snage. Zagreb: 8 meñunarodna konferencija Kondicijska priprema sportaša. str. 157-168.
3. Bračič, M., Peharec,S., Bačić, P. i Čoh, M. (2010). Biomehanička dijagnostika starta najboljih slovenskih sprintera. 8 meñunarodna konferencija Kondicijska priprema sportaša, str. 177-184.
4. Bubanj, S., Stanković, R., Bubanj, R., Dimić, A., Bednarik, J., & Kolar, E. (2010). Razlike u vertikalnom skoku izvedenom odskokom sa jedne i sa dve noge. Facta universitatis - series: Physical Education and Sport, 8(1), 89-95.
5. Čanaki, M., Šoš, K. i Vučetić, V. (2009 ). "Dijagnostika eksplozivne snage tipa skočnosti-«kistler quattro jump»", Zagreb: Kineziološki fakultet, Sportsko dijagnostički centar (www.bib.irb.hr/).
6. Faigenbaum, A. D. (1993). Strenght Training: A Guide For Teachers and Coaches. Strenght & Conditioning Journal, 17 (2), 28-32.
7. Newton, R.U., & Kraemer, W.J. (1994). Developing Explosive Muscular Power: Implications for a Mixed Methods Training Strategy. Strength and Conditioning Journal, 16 (5), 20-31.
8. Sertić, H., Segedi, I. i Segedi, S. (2008). Analiza nekih dimenzija snage u judu, karateu i boksu. Zagreb: 6. meñunarodna konferencija Kondicijska priprema sportaša, str.141-144.
9. http://www.hrks.hr/skole/13_ljetna%20skola/72-Sertic.pdf
10. http://hrks.hr/skole/15_ljetna_skola/44.pdf
11. http://www.hrks.hr/skole/15_ljetna_skola/38.pdf

192

193
ANALYSIS OF THE JUDO OLYMPIC TOURNAMENT FOR MEN,
LONDON 2012 RETROSPECTIVE
Patrik Drid, Tatjana Trivić, Slavko Obadov and Sandra Vujkov Faculty of Sport and Physical Education, University of Novi Sad, Serbia
Abstract
The aim of this paper was to analyze technical characteristics of the male judo athletes, participants of the Olympic tournament in London 2012. The analysis included all bouts for 233 judokas in seven weight categories (254 contests). The EJU (European Judo Union) database „Match Analysis Process” was used in analysis. The following indices were found in throwing techniques: dominance of hand throwing techniques, Te-waza (38%), following leg techniques, Ashi-waza (33%), devoted techniques, Sutemi-waza (15%), side techniques, Koshi-waza (11%), and with a lowest participation – counter techniques (3%). The floor was dominated with holding grips, Osaekomi-waza with 63%, following with arm-locks with 27% and choking techniques with a 10% share. The ratio between scoring techniques in the standing position and on ground floor was 83 to 17%. There were 51 easier injuries reported. Efficiency was not high in judo, for 82 % of segment-representing tactic for grip, and only 18% was scoring techniques. With overall 36 different techniques used with men, Judo is a technical sport.
Keywords: Tachi-waza, Ne-waza, efficiency, injuries
Introduction
Judo belongs to a group of polystructural sports, which is dominated by acyclic movements. Those movements in a bout are carried out and restricted in direct confrontation with the opponent, where the main goal of that movement represents opponent’s symbolic destruction (Sertic & Linda, 2003; Obadov, 2005). During the bout often occurs that athlete’s attempt to throw the opponent does not succeed, thus the cause should be looked for in errors during the technique implementation, or perhaps in training with the same partners that have already been used to that kind of attack and, therefore, often defend themselves successfully. Technique in judo represents a system of rational movements and specialized actions manifested through different knowledge levels, such as automated movements (throwing techniques), conditional automated movements (fake movement actions – feints) as well as certain parts of complex movement (combined techniques) (Dragic, 1996).
Throwing techniques in judo consists of: Arm techniques (Te-Waza); Leg techniques (Ashi-Waza); Side techniques (Koshi-Waza); and Sacrificial throwing (Sutemi-Waza). Controlling techniques (Ne-waza) are composed of following: holding grips (Osaekomi-waza); arm-locks and choking techniques. In addition, some authors arm throwing techniques separates into two groups: Shoulder (Kata-waza) and arm throwing techniques (Te-waza). It is necessary from Tori (i.e. judoka that performs throwing technique) to get the opponent out of balance in order to successfully perform arm throwing technique, because dominance characteristic for this kind of technique arrives from arm and shoulder strength.
On the other hand, leg techniques are frequently used in preparation for the execution of a large number of throws and throw combinations. When performing leg throws, Tori is often forced to balance on one leg, which requires judokas good self-balance in order to efficiently implement throw. Depending on contact between Tori and Uke (i.e. judoka that technique is performed on) as well as on variation of executing techniques, leg throwing techniques are divided into seven groups: by sweeping (Barai), by mowing (Gari), foot-lock throwing (Sasae), coupling leg throw (Gake), wheel leg throw (Guruma), leg overthrow (Otoshi), and leg counter-throw (Gaeshi). To perform a good leg technique from judoka is required a sense of a good timing to attack at the moment when Uke is transferring his balance from one leg to another.

194
Successful realization of the side throwing technique requires contact establishment between the hip of Tori and Uke’s abdomen. The main characteristic of side throws is that Tori always performs his throws towards front and to side, whereas the prerequisite for placing a good side technique is well performed Kuzushi (unbalancing the opponent). Depending on body position and part of the body that dominates in exchanging energy between Tori and Uke, side techniques are divided into two groups: over side hip throws and techniques of hip outbreak with assistance of leg.
The aim of this paper was to analyze technical characteristics of the male judo athletes, participants of the Olympic tournament in London 2012.
Method
The analysis included all bouts for 233 judokas in seven weight categories (254 contests). The EJU (European Judo Union) database „Match Analysis Process” was used in analysis.
Results and Discussion
In Table 1 are presented fifteen most frequently used throwing techniques during the Olympic Judo tournament competition in men, London, 2012.
Table 1. Nage-waza techniques (London, 2012) (EJU) Techniques Without point Yuko Waza-ari Ippon Total
Morote seoi nage 183 15 12 12 222 Uchi mata 123 6 5 4 138 Harai goshi 56 2 3 7 68 Yoko tomoe 63 1 1 - 65 Ippon seoi nage 58 2 1 1 62 Ko uchi gari 50 2 3 2 57 O uchi gari 45 8 - - 53 Sumi gaeshi 46 4 2 - 52 Eri seoi nage 39 3 1 2 45 Tai otoshi 27 3 1 5 36 O soto gari 26 2 - 3 31 Tomoe nage 31 - - - 31 Sode curikomi goshi 23 3 2 2 30 Kata guruma 25 2 - 1 28 Uki waza 17 3 2 1 23
The following indices were found in throwing techniques: dominance of hand throwing techniques: Te-waza (38%), following leg techniques: Ashi-waza (33%), devoted techniques: Sutemi-waza (15%), side techniques: Koshi-waza (11%), and with a lowest participation – counter techniques (3%).
Chart 1. Division of throwing techniques by group of techniques (EJU)

195
In Table 2 are presented ten most frequently used controlling techniques (Ne-waza) during the Olympic Judo tournament competition in men, London, 2012.
Table 2. Ne-waza techniques (London, 2012) (EJU) Techniques Without point Yuko Waza ari Ippon Total
Juji gatame - - - 9 9 Kuzure kesa gatame - 1 1 4 6 Hon kesa gatame 3 1 - 1 5 Yoko shiho gatame - - - 5 5 Shime waza - - - 4 4 Kuzure kami shiho gatame - - 1 2 3 Ushiro kesa gatame - - 2 1 3 Kata gatame - - - 2 2 Kuzure yoko shiho gatame - - 1 - 1 Kuzure tate shiho gatame - - - 1 1
The floor was dominated with holding grips: Osaekomi-waza with 63%, following with arm-locks with 27% and choking techniques with a 10% share.
Chart 2. Division of controlling techniques by group of techniques (EJU)
Table 3 is showing ratio of scoring throwing techniques (Nage-waza) with controlling techniques (Ne-waza).
Table 3. Ratio of scoring throwing techniques with controlling techniques (London, 2012) (EJU) Sector Yuko Waza ari Ippon Total
Nage waza 79 48 61 188 Ne waza 2 6 30 38
The ratio between scoring techniques in the standing position and on ground floor was 83 to 17%.

196
Chart 3. Ratio between scoring techniques in the standing position and on ground floor (EJU)
Koshi-waza technique group efficiency was 34%, Te-waza 29%, Ashi-waza 27%, Sutemi-waza 10% and with controlling techniques 66%. Overall efficiency was 25%, including counter techniques with 33%. Efficiency was not high in this competition, for 82 % of segment is representing tactic for grip, and only 18% was scoring techniques.
There were 51 easier injuries reported, with a highest rate of face (49%) and hand (17%) injuries.
Chart 4. Medical overview London 2012 (EJU)
Conclusion
Judo sport is characterized through specific throwing and controlling techniques. During a single match judoka needs to show a number of various technique actions, thus the physiological demand of each match is high (Franchini i saradnici, 2003; Drid i saradnici, 2009; Trivic et al., 2009; Franchini et al., 2011).
Judoka tries at the right moment to use an opponent's weakness with quick, powerful and explosive action. Many authors describe judo as explosive sport with large reserves of anaerobic capacity requirements, that should be backed up with good aerobic characteristics (Callister et al, 1991; Takahashi, 1992). This anaerobic system provides judokas short, quick and explosive power outbursts during the

197
match, whereas aerobic system contributes to judokas ability to withstands a stress during the match as well as to recover in a short periods of reduced effort.
Movement structure of judo sport is considered to be highly demanding for the majority of judokas muscle groups (Thomas i saradnici, 1989; Franchini i saradnici, 2005). High level of different strength, power, speed and flexibillity are essential for success in judo. Based on different researches (Banovic, 2001; Franchini et al, 2001a; Franchini et al, 2001b; Radja et al, 2011) it can be assumed that the three motor-functional abilities are important for success in judo: power, coordination and aerobic-anaerobic endurance.
Data on technical-tactical readiness of some outstanding athletes of the world acting at various competitions allow creating a “model of the champion” to which the athletes must aspire during the trainings and competitions (Tabakov, 2009).
With overall 36 different techniques used with men at the Olympic Judo tournament competition (London, 2012), judo can be defined as technical sport. The representation of certain judo technique efficiency in this competition is not very high. However, if the comparison would be done with similar sports, the efficiency is very high compared to them. Results given in this analysis may lead to misguided conclusion that the judo techniques are ineffective taking into account statistical reports obtained in this analysis. This kind of conclusion would be out of context, even if considering that judo is a defensive sport since the counter-attack techniques demonstrated the greatest efficacy here. It is far from the real picture, because judo is very dynamic, with a lot of different techniques, where during entire time in match attacks of both competitor interchanges. Taking into consideration that currently analyzed athletes represent world’s finest competitors in judo, it is very logical that their level of ducking attack (avoidance) is very high. Very often a large number of attacks does not always bring judoka direct points, but often leads to opponents’ punishment due inaction, and thus gaining an advantage. In addition, one should take into account that a large number of unsuccessful attempts is a result of throwing opponent and contact to ground with a parts of the body that are not scored (Kinsa).
Elite judoka has to know, understand and has to be able to apply a large number of techniques, as well as to be able to defend himself from various techniques. Only top level prepared judoka, in terms of technical-tactical and all other aspects of overall sports training is able to withstand extremely demanding bouts and tournaments, such as Olympic championship.
In London, 2012 Olympic tournament for men is noticeable dominance of arm throwing techniques, with a highest number of attempts and fair efficacy. Particularly are noticeable low techniques, implemented from knees, that are quite difficult to counter-attack. These kinds of techniques leads judges and referees in a position to penalize less active judokas, indicating that “half-real” technique could lead to advantage. New competition rules that forbid grasps to lower parts of judo-gi (pants of kimono, legs) have contributed to this kind of actions.
References
1. Banović, I. (2001). Possible judo performance prediction based on certain motor abilities and techical knowledge (skills) assessment. Kinesiology, 33(2), 191-206.
2. Callister, R., Callister, R.J., Staron, R.S., Fleck, S.J., Tesch, P., Dudley, G.A. (1991). Physiological characteristics of elite Judo athletes. Int J Sports Med, 12, 196–203.
3. Dragić, B. (1996). Džudo za obrazovanje trenera. Novi Sad: Fakultet fizičke kulture.
4. Drid, P. Maksimovic, N., Matic, R., Obradovic, B., Milosevic, Z., & Ostojic, S. M. (2009). Fitness profiles of elite female judokas of the Serbian national team. Medicina Dello Sport, 62(3), 251-263.
5. European Judo Union (2012). EJU: Match Analysis Process. Available et: http://www.eju.net/news/?mode=showNewsItem&id=1823
6. Franchini, E., Takito, M.Y., Cavinato, C.C., Matheus, L., Bertuzzi, R.C.M., & Vieira, D.E.B. (2001a). Relationship Between Morphological, Physiological and Technical Variables in High Level College Judo Players. 2nd IJF World Judo Conference Munich, Germany.

198
7. Franchini, E., Takito, M.Y. Dal Molin Kiss, M.A.P., & Sterkowicz, S. (2001b). Physical Fitness and Anthropometric Differences Between Elite and Nonelite Judo Players. 2nd IJF World Judo Conference Munich, Germany.
8. Franchini, E., Takito, M.Y., Nakamura, F.Y., Matsushigue, K.A., & Kiss, M.A. (2003). Effects of recovery type after a judo combat on blood lactate removal and performance in an intermittent anaerobic task. J Sports Med Phys Fitness, 43, 424-431.
9. Franchini, E., Takito, M.Y., Kiss, M.A., & Sterkowicz, S. (2005). Physical fitness and anthropometric differences between elite and nonelite judo players. Biol Sport, 22, 315-328.
10. Franchini, E., Del Vecchio, F.B., Matsushigue, K.A., & Artioli, G.G. (2011). Physiological profiles of elite judo athletes. Sports Medicine, 41(2), 147-66.
11. Obadov, S. (2005). Džudo. Novi Sad: Fakultet fizičke kulture.
12. Radjo, I., Mekic, A., Drapsin, M., Trivic, T., Kajmovic, H., & Drid, P. (2011). Isokinetic strength profile of shoulder rotators and thigh muscle torques in elite judokas and soccer players. TTEM, 6(3), 631-635
13. Sertić, H,. i Lindi, H. (2003). Kondicijska priprema judaša. U: D.Milanović, I.Jukić (ur.) Kondicijska priprema sportaša, Zbornik radova meñunarodnog znastveno-stručnog skupa, Zagreb, 21-22.02.2003., 367-374. Zagreb: Kineziološki fakultet Sveučilišta u Zagrebu; Zagrebački športski savez.
14. Tabakov, S. (2009). Index analysis of technical-tactical preparedness of olympic games 2008 judo champions (men). EQOL, 1(1), 5-14.
15. Takahashi, R. (1992). Power training for judo: plyometric training eith medicine balls. International Journals of Sports Medicine, 14(2), 6-71.
16. Thomas, S.G., Cox, M.H., Legal, Y.M., Verde, T.J., & Smith, H.K. (1989). Physiological profiles of the Canadian National Judo Team. Can J Sport Sci, 14, 142–147.
17. Trivic, T., Drid, P., Obadov, S. (2009). Aerobic capacity of male judokas in comparison with university students of the Faculty of Sport and Physical Education. Archives of Budo, 5, 143-146.

199
EVALUATION OF THE TECHNICAL AND TACTICAL ASPECT IN
JUDO OLYMPIC TOURNAMENT FOR WOMEN
Tatjana Trivić, Slavko Obadov, Sandra Vujkov, Željko Krneta and Patrik Drid Faculty of Sport and Physical Education, University of Novi Sad, Serbia
Abstract
The aim of this paper was to analyze technical and tactical characteristics of the female judo athletes, participants of the Olympic tournament in London 2012. The analysis included all bouts for 154 judokas in seven weight categories (175 contests). The EJU (European Judo Union) database „Match Analysis Process” was used in analysis. The following indices were found in throwing techniques: dominance of leg techniques, Ashi-waza (38%), following hand throwing techniques, Te-waza (32%), side techniques, Koshi-waza (18%), devoted techniques, Sutemi-waza (8%), and with a lowest participation – counter techniques (4%). The floor was dominated with holding grips, Osaekomi-waza with 47%, following with arm-locks with 30% and choking techniques with a 23% share. The ratio between scoring techniques in the standing position and on ground floor was 85 to 15%. Efficiency was not high in judo, for 82 % of segment-represented tactic for grip, and only 18% was scoring techniques. With overall 33 different techniques used with women, Judo is a technical sport.
Keywords: female judokas, techniques, competition
Introduction
Modern judo is an Olympic sport with a variety of throwing, pinning, choking, and arm lock techniques to subdue an opponent (Sertić, 2004). The sport related value of judo competitor is a results of technical skills, level of motor abilities (strength, speed and endurance), and which are in the majority of cases, of superior function - tactical skills (Lech and Sterkowicz, 2004). During the training process, many of elite judokas can demonstrate a variety of techniques, but in competition terms, they are able to realize only a few which can bring them a victory. Studies about technical and tactical aspects of judo explored which techniques were applied in specific tournaments (Sikorski et al., 1987; Sterkowicz and Koziol, 1994).
Judo is a technical and tactical sport complex that takes place in various conditions. All judo techniques (wazas) are classified into three main categories: throwing techniques (nage waza), grappling techniques (katame waza) and striking techniques (atemi waza). Of these, throwing techniques represent some of the most dynamic and compelling aspects of this world-famous martial art in booth gender and without proper physical and tactical preparation, judokas are not able to implement techniques during the match.
At the Olympic Games in Tokyo for the first time technical elements of judo fight (Doi, 1971) were analyzed. Technical and tactical combat elements were analyzed in a tournament in order to gain insight on the applied techniques (Branco, 1797; Brown & McMurray, 1996; Sterkowicz & Maslej, 1998). In addition, some of the surveys (Hamana et al., 1994; Sterkowicz, 1998), dealt with the analysis of the technical and tactical elements in combat athletes of both genders. Research on women participation in judo competition, was first undertaken in the Department of Combat Sports at the Academy of Physical Education in Cracow (Sterkowicz and Kesek, 1983).
The objective of this paper is an attempt to evaluate and determined efficiency of technical and tactical structure of a female judo match during the Olympic tournament in London 2012, as well as to compare relations between nage and ne waza techniques.

200
Method
All fights in all weight categories for female judokas were analyzed during the Olympic tournament in London. The analysis included all bouts for 175 female judokas in seven weight categories. For the purpose of analysis it was used the EJU (European Judo Union) database „Match Analysis Process” (European Judo Union, 2012). Acording to traditional judo classification the techniques were grouped in the following categories: Te-waza (hand techniques of throwing in standing position), Koshi-waza (loin techniques of throwing in standing position), Ashi-waza (foot and leg techniques of throwing in standing position), Sutemi-waza (throwing in the lying position), counter, Osaekomi-waza (holdings), Kansetsu-waza (bending the joints), and Shime-waza (strangulations).
Results
The total number of nage waza tehnics during the Olympic tournament in London was 823 techniques. From total number of throws, female judokas used 33 different techniques from the official list of International Judo Federation (IJF).
Table 1. The most frequently used techniques during the Olympic tournamet in London. Techniques No score Yuko Waza ari Ippon Total
Uchi mata 121 8 7 7 143 Ippon seoi nage 92 8 3 1 104 Morote 95 2 3 - 100 Harai goshi 54 4 6 3 67 O uchi gari 37 1 6 5 49 Ko uchi gari 22 6 3 4 35 Sode tsuri 25 1 1 - 27 Sumi gaeshi 22 3 2 - 27 O soto otoshi 16 2 1 3 22 Tai otoshi 16 2 1 2 21
Based on the results (table 1) it can be seen that female judokas from all weight categories applied the most often the uchi mata throws from ashi waza group of techniques. Ipon seoi nage was dominated in te waza group of techniques, harai goshi was the most frequently throw from koshi waza group and sumi gaeshi was used the most frequently as a sacrifice technique.
Te waza: 263
Koshi waza: 146
Ashi waza: 314
Sutemi waza: 68
Counter: 32
Figure 1. Nage waza throws during Olympic tournament in London.

201
According to database „Match Analysis Process” (Figure 1) it can be seen that during the Olympic games in London female judokas used most frequently leg techniques (38%). Next were the arm techniques (32%), hip techniques (18%), sacrifice technique (8%) and only 4% of counter. Based on the results (Figure 1), women's participation in judo contest less frequently executed sacrifice throws (with a fall) and counter with domination in techniques with a low risk.
Kwantsetsu, 9
Shime, 7
Osaekomi, 14
Figure 2. Frequency of techniques in ne waza positions during Olympic tournament in London.
In general, most effective group of holds (47%) were kuzure kesa gatame with total number of 7 holds, next were elbow joint locks (30%), mainly kwantsetsu and juji gatame and strangulation techniques (23%) with dominated sankaku and shime strangle.
Table 2. Number of scored actions used by the female judokas
Sector Yuko Wazari Ippon Total
Nage waza 67 56 43 166 Ne waza 1 2 27 30
The scores for technical actions included yuko, wazari and ippon. Female judokas (Table 1) were more effective in nage-waza actions, in which higher number for action were scored with yuko, while in ne waza position ipon was the most common scored point.
Figure 4. Frequency of nage and ne waza techniques, during Olympic tournament in London
According to figure 4. the female judokas were most effective in nage waza position (85%) in compared with ne waza (15%). Total number of scored techniques in nage waza was 166 and 30 in ne waza position.

202
Table 3. Percent of actions and penalties
With results Without results Shido Hantsoku make 198 (18%) 885 (82%) 214 5
Most of action (82%) was without score and only 18% from total number of actions was with awarded points. Lot of attack was done to break the grip and to avoid the penalties. During the Olympic tournament in London, penalties make up a large proportion of the scores in female judokas (table 3).
Discussion
Women’s judo appeared as a demonstration sport at the Seoul Olympic Games (1988), and joined to the Olympic program of the games in Barcelona (1992).
Year’s observations of competitions and their analysis aimed at finding a way of raising the efficiency of fights and improving in competitors’ training (Boguszewski, 2010; Sterkowicz and Francini 2001). Authors of these studies analyzed the most efficient techniques applied during competitions and pointed at developmental directions of the technical-tactical preparation seeking means of raising the efficiency of training of judo competitors. Some important changes were introduced to judo sport rules in 2009 and 2010. Before these changes, competitors with poor techniques but physical well trained could successful compete and win in judo tournaments (Adam et al., 2011).
During the Olympic game in London, the most efficient techniques were uchimata and seoi nage throws, which along with the kesa gatame hold are in the first ten dominant techniques in all weight categories, for female judoka analyzed in this research. A return to the style of the fight took place where attacks with leg throws, such as uchimata, osoto gari, ouchi gari and kouchi gari were frequent and efficient. Competitors fighting in a deeply stooped position had a greater opportunity to get hold of legs (Iatskevich, 1999), which can be seen in figure 1. With overall 33 different techniques used in female judokas Judo can be interpreted as a technical sport.
Strangulation and joint lock belongs to the techniques in the case of which, like locks Kansetsu-waza, there are no gradation in the awarded points; a successfully applied technical element being rewarded solely by Ippon. The average value score for attack by holds on the ground (osae komi) was mainly awarded with Ippon, one Yuko and two wazari holds (Table 2). This fact indicates that after applied holds opponent on the mat, opponent cannot get away from holding position. Higher levels of motor fitness are not absolute necessary to win in a direct bout (Kalina et al., 2005), and tactical skiils especially in international tournament are also important as a technical skills. Judokas involves the application of different methods to gain points. The competitors may also win when penalties are scored for the opponent, which is quite common during the competition. In medal fights during the tournaments, penalties constitute even more than 50% of all points awarded (Boguszewski and Boguszewska, 2005). During the tournament value of judges’ penalties were very high (214) with 5 penalties of disqualification (Table 3). In the course of the actual fight, the contestants attacked, defended themselves, countered their opponents' attacks, broke their defense, or awaited their opponent's attacks. From all attacks (Table 3), most of them were in order to break the grip (82%), and only 18% were awarded with scores. The effectiveness of offensive actions, which was the case in this research is relatively minor and hardly ever exceeds 25% (Boguszewski, 2007) which was also the case during the Olympic tournament in London. Mainly score in nage waza position (85%), was awarded with yuko (67 attack), the next were wazari score (56), and finally as a score of a direct win Ippon (43).
When the women's participation in judo contest was viewed from this angle it was verified that they not only less frequently executed sacrifice throws (with a fall) and more often used holding techniques on the ground, but also important was the frequent application of ashi-waza and te-waza techniques.

203
Conclusion
In the light of the research about technical and tactical aspect of judo, fight in female judokas and their participation in London Olympic Tournament (2012) some remarks and conclusions can be formulate:
a) With overall 33 different techniques used in female judokas Judo can be interpreted as a technical sport.
b) There is a need for increasing practice of counter attacks against uchi-mata and seoi-nage techniques, as a dominant technique during London Olympic Tournament 2012.
c) The effectiveness of offensive actions with Ipon scores in nage waza position was relative low, so female judokas should increase throws without only breaking the holds and with better values of efficiency in attack and defense.
References
1. Adam, M., Smaruj, M., & Tyszkowski, S. (2011). The diagnosis of the technical-tactical preparation of judo competitors during the World Champions (2009 and 2010) in the light of the new judo sport rules. Archives of Budo, 7, 5-9.
2. Boguszewski, D. (2007). Dynamika walk finalistow Mistrzostw Polski w judo w latach 2005-2006 [Dynamics of fights of Polish Judo Chmpionships finalists in 2005-2006]. In: Kuder A, Perkowski K, Sledziewski D, editors. Proces doskonalenia treningu i walki sportowej [Process of improvement in sports struggle], 4, 112-115. Warszawa: AWF.
3. Boguszewski, D. (2010). Technical fitness training of judokas – finalists of top world tournaments in the years 2005-2008. Journal of Combat sports and Martial Arts, 2(2), 109-114.
4. Boguszewski, D., & Boguszewska, K. (2006). Dynamics of judo contests performed by finalists of European Championships (Rotterdam). Archives of Budo, 2, 40-44.
5. Branco, J.C. (1979). A observacao no judo – recolha efectuada nos campeonatos nacionais de 1979 (por categoria de peso). Ludens, 3(4), 30-52.
6. Brown, C., & McMurray, G. (1996). Olympic judo statistics – Tehnique utilization and effectiveness. Available at: http://www.engr.orst.edu/~odoms/statistics.htm, 4/3/97.
7. Doi, M. (1971). Analiza walk na Igrzyskach Olimpijskich w Tokio. Biuletyn Kodokanu 1967, 7 (W:) Judo, Biblioteka Trenera, PKOI, Warszawa, 3.
8. European Judo Union (2012). EJU: Match Analysis Process. Available et: http://www.eju.net/news/?mode=showNewsItem&id=1823
9. Hamana, J., Nose., Sakai, K., Suzuki, W., & Tanaka, M. (1994). Analytical Study of Judo Competitors. Bulletin of the Assocation for the Scientific Studies on Judo, Kodokan, Report VII, p. 73.
10. Iatskevich, A. (1999). Russian Judo. London: Ippon Books.
11. Kalina, R.M., Chodała, A., Dadeło, S., Jagiełło, W., Nastula, P., Niedomagała, W. (2005). Empirical basis for predicting success in combat sports and self-defence. Journal of Kinesiology, 37, 64-73.
12. Lech, G., & Sterkowicz, S. (2004). The commencement age of training and its effects on technical preferences and achievements attained by judo contestants. Human Movement, 5(1), 42-47.
13. Sertić, H. (2004). Osnove Borilačkih Sportova. Kineziološki fakultet: Zagreb.
14. Sikorski, W., Mickiewicz, G., Majle, B., & Laksa, C. (1987). Structure of the contest and work capacity of the judoist. Proceedings of the International Congress on judo – Contemporary Problems of Training and Judo Contest, 58-65. Poland.

204
15. Sterkowicz, S. (1998). Differences in the schooling tendencies of men and women precticing judo (based on the analysis of the judo bouts during the 1996 olympic games). USJI National Judo Conference – International Research Symposium, 14-15. Colorado Springs, CO, USA: United States Olympic Training Center.
16. Sterkowicz, S., & Francini, E. (2001). Variations of techniques applied by Olympic and World Championships Medalists. Munich Germany: The Second International Judo Federation World Judo Conference.
17. Sterkowicz, S., & Kêsek, M. (1983). Charakterystyka dzialañ podczas I Miêdzynarodowego Turnieju Judo Kobiet (Wloclawek 1983). Sport Wyczynowy, nr 7, p. 19.
18. Sterkowicz, S., & Koziol, J. (1994). Analysis method for fights tactics in judo. Annuals of Cracow Academy of Physical Education, 113-133.
19. Sterkowicz, S., & Maslej, P. (1998). An evalution of the tehnical and tactical aspect of judo matches at the senior level. International Judo Coaches Alliance Site. Available at: http://www.judoamerica.com/ijca/sterkowicz/index.html.

205
DIFFERENCES IN INDICATORS OF CONDITIONAL PREPARATION
OF GRAPPLING AND GRECO-ROMAN STYLE WRESTLERS
Valdemar Štajer and Dragan Marinković Faculty of Sport and Physical Education, University of Novi Sad, Serbia
Abstract
Introduction. Conditioning preparations is a complex and comprehensive process of implementing various programs for the development and maintenance of functional, motor abilities and morphological characteristics of athletes (Milanović, Jukić, Šimek, 2003). The aim of this study was to determine whether there is a significant qualitative differences in the basic skills and conditioning in the area of motor and functional abilities of wrestlers from two types of wrestling styles: Grappling and Greco-Roman style.
Material and methods. Sample consisted of 34 wrestlers who were divided in two groups with equal number subjects (17) and were divided by style of wrestling: Greco-Roman group (1) and Grappling group (2). Sample of measuring instruments for the assessment of motor and functional abilities of subjects were a battery of 11 field tests from which we get 15 variables.
Results. Multivariate analysis of variance in the area of motor abilities showed no statistically significant difference between the analyzed groups, and Univariate analysis of variance determined that there was no statistically significant difference between the groups. Multivariate analysis of variance in the area of functional abilities for the tested examined groups were not statistically significant. Univariate analysis of variance showed no statistically significant differences in tested groups.
Conclusions. Familiarity with basic conditioning in the area of motor and functional abilities and by using a battery of tests that can determine at which level their athletes are, wrestling coaches and conditioning coaches will be able to better plan and are programmed workouts for their athletes.
Keywords: grappling style, greco-roman style, motor and functional abilities.
Introduction
Conditioning preparations is a complex and comprehensive process of implementing various programs for the development and maintenance of functional, motor abilities and morphological characteristics of athletes. Main task of the fitness and conditioning program is to improve athletic performance through general, basic and specific skills training programs needed for the successful performance of athletes in competition and in everyday training (Milanović, Jukić, Šimek, 2003). Wrestling belongs poly structural group of sports characterized with acyclic movements. Wrestling is a sport characterized by numerous and various movements of the whole body or parts, and performed in different directions with variable intensity and pace (Marić, Baić and Cvetković, 2007). Kraemer, Vescovi and Dixon (2004) stated that the most important skills in wrestling are: dynamic strength and isometric strength, anaerobic and aerobic endurance, explosive power, agility and flexibility. In the Greco-Roman style of wrestling, wrestlers are allowed to use only hands and upper body for the implementation of techniques, and the strength of the lower extremities is of great importance to perform techniques. The match begins in a standing position, and can be carried out to the par terre. Grappling or "submission wrestling" is a style of wrestling where the wrestlers are allowed to use their hands, feet and whole body to implement their techniques. In this style of wrestling, wrestlers are permitted to use throwing techniques, overthrowing their opponent, choking and leverage on an opponent. The fight takes place mostly on the par terre, although the wrestlers begin the match in a standing position. Direct kicks are not allowed in these styles of wrestling. Grappling as a style of wrestling, which is from 2006. year under the auspices of FILA (International Federation of Amateur Wrestling), is associated with a significant role as a base of mixed martial arts - MMA (Mixed

206
Martial Arts), as well as personal self-defense. Grappling represents the evolution in wrestling styles, which has emerged as combination of techniques used from brazilian jiu-jitsu, freestyle wrestling, greco-goman style wrestling, sambo and judo (Cirkovic, Jovanovic, Kasum, 2010). The aim of this study was to determine whether there is a significant qualitative differences in the basic skills and conditioning in the area of motor and functional abilities of wrestlers from two types of wrestling styles grappling and Greco-Roman style in favor of the Greco-Roman style wrestlers.
Method
Sample consisted of 34 wrestlers who were divided in two groups with equal number subjects (17) and were divided by style of wrestling: Greco-Roman group (1) a group of wrestlers from greco-roman style of wrestling with average: age 22.88 ± 3.84; sports experience length 10:12 ± 5.66, 76.76 ± body weight and body height 13:16 175.23 ± 7:22 and Grappling group (2) a group of wrestlers from grappling style of wrestling average: 26.59 ± 3:54 of age; sports experience length 6:12 ± 6.76, 85.10 ± body weight and body height 8.88 177.89 ± 6:11. They came from the wrestling club "Novi Sad", Novi Sad (10 wrestlers), wrestling club "Proleter" in Zrenjanin (7 wrestlers), wrestling club „Omladinac“ from Zrenjanin (8 wrestlers) and brazilian jiu-club-jitsu grappling club "Family Fight Team" from Novi Sad (8 wrestlers). In the sample entered subjects who were able to correctly do the tasks set in the tests, as well as participants and medal winners at the national, international competitions in these sports disciplines.
Sample of measuring instruments for the assessment of motor and functional abilities of subjects were a battery of 11 field tests from which we get 15 variables. For the evaluation of the motor abilities we used: one-repetition maximum (1RM) test to evaluat absolut strength for lower and upper body extremities through squat and bench press, for muscular endurance was used leg press, bench-press, sit-up-s for 60 seconds, push-up-s for 60 seconds. For leg press we used double user weight on machine to estimate the number of repetitions. Bench-press was estimated with user weight. Isometric strength was estimated using the handgrip test for the dominant and non dominant hand. Assessment of the flexibility of the lower back and upper thigh was tested using two test "deep forward bend," standing on a bench and „V-sit sit and reach test“. For evaluation of functional capacity is used: indicator of aerobic capacity-relative oxygen consumption (ml/min/kg)-( VO2max /BW) by using Multi-Satage Fitness Test (MSFT). Indicators of anaerobic capacity are produced using the Running Srint based Anaerobic Test (RAST) and the indicators are: average muscle power-(Ave. Power (Watts)), maximum muscle power-(Max. Power (Watts)), minimum muscle power-(Min. Power (Watts)), Index of fatigue (fatigue index (watt / sec)) (Sudarov, 2007).
Data are reported using descriptive statistics including mean values, standard deviation minimum and maximum values. Data analyses were conducted using the SPSS.20 computer software. The level of p<0.05 was considered significant. Multivariate analysis of variance (MANOVA) and univariate analysis of variance (ANOVA) were used for analyzing the differences between groups.
Results
Basic descriptive statistics for motor abilities and functional abilities of two groups of wrestlers are shown in Table 1.
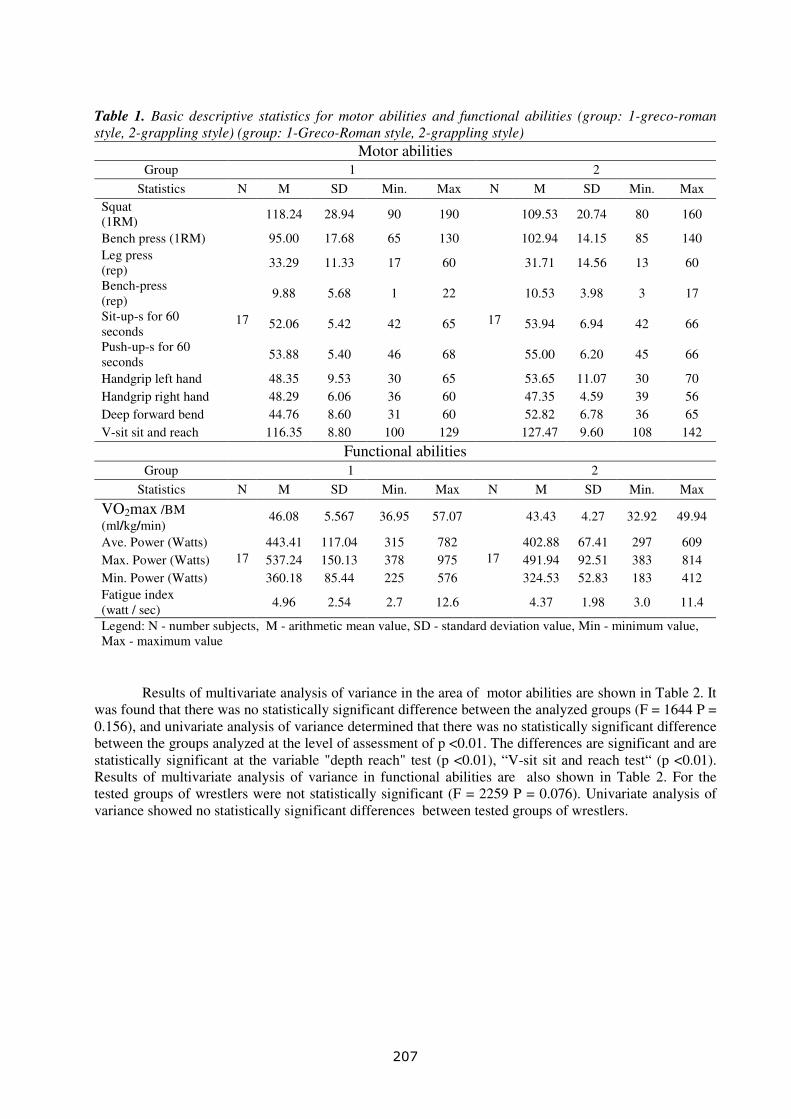
207
Table 1. Basic descriptive statistics for motor abilities and functional abilities (group: 1-greco-roman style, 2-grappling style) (group: 1-Greco-Roman style, 2-grappling style)
Motor abilities Group 1 2
Statistics N M SD Min. Max N M SD Min. Max Squat (1RM)
118.24 28.94 90 190 109.53 20.74 80 160
Bench press (1RM) 95.00 17.68 65 130 102.94 14.15 85 140 Leg press (rep)
33.29 11.33 17 60 31.71 14.56 13 60
Bench-press (rep)
9.88 5.68 1 22 10.53 3.98 3 17
Sit-up-s for 60 seconds
52.06 5.42 42 65 53.94 6.94 42 66
Push-up-s for 60 seconds
53.88 5.40 46 68 55.00 6.20 45 66
Handgrip left hand 48.35 9.53 30 65 53.65 11.07 30 70 Handgrip right hand 48.29 6.06 36 60 47.35 4.59 39 56 Deep forward bend 44.76 8.60 31 60 52.82 6.78 36 65 V-sit sit and reach
17
116.35 8.80 100 129
17
127.47 9.60 108 142
Functional abilities
Group 1 2
Statistics N M SD Min. Max N M SD Min. Max
VO2max /BM (ml/kg/min)
46.08 5.567 36.95 57.07 43.43 4.27 32.92 49.94
Ave. Power (Watts) 443.41 117.04 315 782 402.88 67.41 297 609 Max. Power (Watts) 537.24 150.13 378 975 491.94 92.51 383 814 Min. Power (Watts) 360.18 85.44 225 576 324.53 52.83 183 412 Fatigue index (watt / sec)
17
4.96 2.54 2.7 12.6
17
4.37 1.98 3.0 11.4
Legend: N - number subjects, M - arithmetic mean value, SD - standard deviation value, Min - minimum value, Max - maximum value
Results of multivariate analysis of variance in the area of motor abilities are shown in Table 2. It was found that there was no statistically significant difference between the analyzed groups (F = 1644 P = 0.156), and univariate analysis of variance determined that there was no statistically significant difference between the groups analyzed at the level of assessment of p <0.01. The differences are significant and are statistically significant at the variable "depth reach" test (p <0.01), “V-sit sit and reach test“ (p <0.01). Results of multivariate analysis of variance in functional abilities are also shown in Table 2. For the tested groups of wrestlers were not statistically significant (F = 2259 P = 0.076). Univariate analysis of variance showed no statistically significant differences between tested groups of wrestlers.

208
Table 2. The result of multivariate analysis of variance-MANOVA for motor abilities and functional abilities and differences between the groups (group: 1-Greco-Roman style, 2-grappling style) (group: 1-greco-roman style, 2-grappling style)
Motor abilities
Group M F p
Squat (1RM)
1 2
118.24 109.53
1.017 0.321
Bench press (1RM) 1 2
95.00 102.94
2.091 0.158
Leg press (rep)
1 2
33.29 31.71
0.126 0.725
Bench-press (rep)
1 2
9.88 10.53
0.148 0.703
Sit-up-s for 60 seconds
1 2
52.06 53.94
0.776 0.385
Push-up-s for 60 seconds
1 2
53.88 55.00
0.314 0.579
Handgrip left hand 1 2
48.35 53.65
2.233 0.145
Handgrip right hand 1 2
48.29 47.35
0.260 0.613
Deep forward bend 1 2
44.76 52.82
9.203 0.005
V-sit sit and reach 1 2
116.35 127.47
12.396 0.001
F= 1.644 p= 0.156
Functional abilities
Group M F p
VO2max /BM (ml/kg/min)
1 2
46.08 43.43
2.416 0.130
Ave. Power (Watts)
1 2
443.41 402.88
1.531 0.225
Max. Power (Watts)
1 2
537.24 491.94
1.122 0.298
Min. Power (Watts)
1 2
360.18 324.53
2.141 0.153
Fatigue index (watt / sec)
1 2
4.959 4.365
.579 0.452
F=2.259 p= 0.076
Legend: N - number subjects, M - arithmetic mean value, F-the relationship and p-F-statistically significant relations

209
Conclusions
In diagnostics of fitness and conditioning readiness objective is to determine the level of functional and motor abilities and morphological characteristics of athletes for the purpose of defining "good" and "bad" side of his preparedness (Milanovic and associates, 2003). Statistically significant difference between the greco-roman style and grappling styles wrestlers are distinct and statistically significant in the area of motor abilities in test "deep forward bend," (p <0.01), „V-sit sit and reach“ test (p <0.01). In the area of functional abilities there are not differences. The differences found can be explained by the fact that wrestlers in grappling perform their techniques of throwing, choking and leverage on an opponent with greater amplitude than wrestlers in Greco-Roman style. As a result, the muscles of the grappling wrestlers must be more mobile in the area of hip and pelvis. It is seen positively, otherwise their results in the fight will be limited. Their flexibility in this region is above average compared to similar fighters in martial arts (Andreato, Moraes, Gomes, Esteves, Andreato, Franchini, 2011). Based on the hypothesis and research objectives, we can conclude that the results obtained by measurements did not show a significant difference in favor of the wrestlers involved in Greco-Roman wrestling in the basic skills and conditioning that are present in both style of wrestling is expressed through the motor and functional ability, and thus hypothesis can not be accepted as correct. Functional aerobic capacity VO2max /BM (mi / kg / min) of both style are poorly developed, which indicates that their capacity for rapid and effective recovery to the next fight has been reduced and limited (Horswill, Scott, Gale, 1989; Horswill, Miller, Scott, Smith, Welk, Handel, 1992). Possibilities of generalization of this study to the entire population of wrestlers who are of wrestling with these styles is limited by the number of respondents to the survey N = 34, a bigger problem represents a number of athletes who are actively and regularly involved in in this styles of wrestling. Familiarity with basic conditioning in the area of motor and functional abilities and by using a battery of tests that can determine at which level their athletes are, wrestling coaches and conditioning coaches will be able to better plan and are programmed workouts for their athletes.
References
1. Ćirković, Z., Jovanović, S., Kasum, G. (2010). Borenja. Beograd: Fakultet Sporta i Fizičkog Vaspitanja, Univerzitet u Beobradu.
2. Horswill, .A., Scott, J.R., & Galea P. (1989). Comparison of maximum aerobic power, maximum anaerobic power, and skinfold thickness of elite and nonelite junior wrestlers. International Journal of Sports Medicine, 10(3), 165–168.
3. Horswill, C.A., Miller, J.E., Scott, J.R., Smith, C.M., Welk, G., & Van Handel, P. (1992). Anaerobic and aerobic power in arms and legs of elite senior wrestlers. International Journal of Sports Medicine, 13(8), 558–561.
4. Kraemer, W.J., Vescovi, J. D., & Dixon, P. (2004). The Physiological Basis of Wrestling: Implications for Conditioning Programs. Strength & Conditioning Journal, 26(2), 10-15.
5. Marić, J., Baić, M. i Cvetković, Č. (2007). Primjena hrvanja u ostalim sportovima. Zagreb: Kineziološki fakultet, Sveučilišta u Zagrebu.
6. Milanović, D., Jukić, I. i Šimek, S., (2003). Kondicijska priprema sportaša. U D. Milanović i I. Jukić (ur.), Zbornik radova meñunarodnog znanstveno-stručni skupa Kondicijska priprema sportaša (str. 10-19). Zagreb: Kineziološki fakultet Sveučilišta u Zagrebu; Zagrebački športski savez.
7. Sudarov, N. (2007). Testovi za procenu fizičkih performansi. Novi Sad: Pokrajinski zavod za sport.
8. Vidal Andreato, L., Franzol de Moraes, S.M., Lopes de Moraes Gomes, T., Del Conti Esteves, J.V., Vidal Andreato, T., & Franchini, E. (2011). Estimated aerobic power, muscular strength and flexibility in elite Brazilian Jiu- Jitsu athletes. Science & Sports, 26(6), 329-337.

210
211
THE EFFECT OF TRAINING PROGRAM OF POWER PERSISTENCE
OF SOME FUNCTIONAL VARIABLES AND PERFORMANCE IN THE
SNATCH LIFT FOR FEMALE LIFTERS
Ismael Mawlood Salih Soran- University, Erbil, Iraq
Abstract
The research aims to recognize the differences between the preceding and the posterior tests of the experimental and the control groups in some functional variables and performance of the snatch lift, the number of the successful lifts and the differences of the posterior tests between the two groups in the research sample included (10) female lifters (intentional restricted sample) of youth category from Erbil province team of 17-20 years old. The sample was divided, using the intentional method, into two groups; the experimental which included (5) lifters and the control group which included (5) lifters as well. They were divided according to their performance of the lifts (sitting snatch lift and stable snatch lift).The researcher conclusions that the suggested training program achieved a significant progress in a number of the successful snatch lifts for the benefit of the posterior tests. The suggested training program did not achieve a significant progress in these variables (performing the snatch lift, the functional variables, heart pulse, contractive pressure and the stretching pressure). Keywords: performance. snatch lift. female
Introduction
In the recent years, the weight lifting sport witnessed a development in the achievements and performance as a result of developing the physical and functional abilities through modernizing the training methods for (female lifters). "The weight lifting is characterized with power and speed during the performance and the execution of the lifts. That requires from the female lifter to have a high level of power and speed" (Sarhank A. Abd Allah, 2006). In addition to power persistence, the female lifter should have a high muscular and nervous harmony that enables the lifter to lift three times of her weight through organizing the work of the muscles by organizing the power of any muscle contraction. This power depends on the neurotic signals in order to use the (motor-units) that are active in changing the speed and the persistence of the muscle contraction that represents the real muscular capacity that plays a great role in executing the kinetic duty when performing the snatch lift. It is very necessary to allocate a part of the training program to make the lifter shorten the intervals between repetitions and work in the state of the oxygen deficiency (energy deficiency) in order to provide a muscular and functional harmony on the levels of blood circulation and respiratory systems to speed up recovery between the repetitions.
The research aims at: 1. The differences between the preceding and the posterior tests of the experimental and the control groups in some functional variables and performance of the snatch lift, the number of the successful lifts. 2. The differences of the posterior tests between the two groups in some functional variables and performance of the snatch lift, the number of the successful lifts.
Method
The researcher used the experimental curriculum because it is appropriative to the goals of the research. The research sample included (10) female lifters (intentional restricted sample) of youth category from Erbil province of 17-20 years old. The sample is divided intentionally into two groups, experimental and control groups. Each group included (5) lifters. They are divided according to their performance of the lift (sitting lift and stable lift). After that, the two groups are divided using lot method. The preceding tests were carried out on the experimental and control groups in the weight lifting hall of Erbil sport club. All

212
the sample individuals attended the tests. The tests were carried out as follows: Weight measure: the female lifter stands straight on the balance wearing only the suit. She should halt movement and talking and she should look straight. The researcher recorded the weight and the lifter name in a registration form to the nearest 50 grams. Length measure: the lifter stands straight with her back on the wall. Her head straight and legs parallel. The tester put a ruler on the lifter's head for measurement and then recording the length in the form. Measuring the functional variables during intervals: the researcher directed the lifters to relax on chairs for 20 minutes in order to get high accuracy when measuring the functional variables of the research. Heart pulse per minute measure: to measure the rate of the pulse per minute during the rest time, the method of feeling the pulse of carotid artery in the neck is used and then count the heart beats for 15 seconds. The resulted number is multiplied by 4. The results of the study made by (Yassin T.M.A. Al-Hajjar, 1996) were depended. This study assured the 15X4 method is more appropriate than the other ones. Measuring respiration per minute during rest time: while making this test, the tested person sits on a chair for 2 minutes. The person is informed that the test is for measuring the pulse. The wrist of the person is held as if there is a measurement for the pulse. But instead of counting the beats, the number of times of the chest moves during inhalation per minute is counted. Measure blood pressure: in order to measure the blood pressure, the indirect method was used. It was measured by the sphygmomanometer.
The achievement tests: these tests are carried out in two days. The first day, the test of the legal (sitting snatch lift) is carried out. Giving a rest time for two minutes between the lifts, whether the lift is successful or not. Directly after that, the functional variables are measured. The second day, the test of stable snatch lift is carried out. A rest time for two minutes between the lifts is given for the lifter, whether the lift is successful or not.
Results
Table (1) Shows the differences between the preceding the posterior tests of the experimental group in the functional variables after the attempt
Statistical indicators Preceding test Posterior test Functional variables
T calculated value
Pulse/minute 139.32 13.341 147.342 5.341 1.876 Respiration/minute 32.598 1.435 32.543 1.456 5.678*
Contraction pressure/ml. mercury 43.35 1.324 44.343 6.541 1.344
From table (1), the researcher attributes the significant difference that the experimental group achieved in the number of the respiration times to that the short rest periods between the attempts in the muscular persistence training by following the method of the periodical training can cause the non-recovery after the exercises, and the exercises that follow. This will result in to the accumulation of the acid and this will increase the acidity after concentrating the hydrogen ions. The decrease in blood (ph) will motivate the respiration receptors in the brain. That will lead to the increase in the number of respiration times to find a way of work of the vital organizers to balance the blood (ph). (Gerald & Nicholas, 1984) assured that when there is a decrease in the blood (ph) which means an increase in acidity, that will result in motivating the respiration receptors in the spinal cord, which will, in turn, result in an increase in the respiration times in order to increase the (ph) and bring it back to its normal state" the repetition of this process for many times in the special training units of the power persistence will result in increasing the adjustment of the working muscles that are responsible for respiration. Thus, these muscles will be ready to increase the respiration times through increasing the inhale times to bring in the most possible quantity of the oxygen and also increasing the number of exhale to bring out the carbon dioxide, especially that the posterior test of the achievement showed an increase in the weight of the (snatch) lift which led to an increase in the number of respiration times when compared to the weight of the preceding test because of the adjustment that occurred in the respiratory system. The training of power persistence is characterized by the many repetitions with an appropriate intensity more than the maximum power. One of the main reasons, in addition to the increase of the acidity, are the signals that are emitted from the joint and muscular receptors that exist in the legs and the arms joints and the working muscles. These signals are sent to the respiratory system to give the signal. There is a need to increase the oxygen quantity for the working muscles and these muscles need to cast the carbon dioxide that results from the metabolism of the working muscles. The center of the respiration system send signals to (inhale center, exhale center, abionistic center and neumotask center) in order to increase the air in the lungs through increasing the number of inhale and exhale times and this will result into an adjustment in the respiratory system to increase the number of the respiration times with each new pressure on this system. (Guyton,

213
1986) assures that one of the factors, that causes the increase in the number of respiration times during exercises, is the neurotic signals that comes from the receptors of the working muscles and the automatic receptors of the joints which send neurotic signals to motivate the work of the respiratory system. (Yassin T.M.A. Al-Hajjar, 1994) assures that these receptors are more sensitive for the changes tha occur in the partial pressure of the oxygen (PO2) and less sensitive for the changes that occur in the partial pressure of the carbon dioxide (PCO2). When (PO2) decreases, these receptors are motivated and send neurotic pulse to the inhale center to increase the rate of respiration".
Table (2) Shows the differences between the preceding the posterior tests of the control group in the functional variables after the attempt
Statistical indicators Preceding test Posterior test Functional variables
T calculated value
Pulse/minute 148.432 9.234 149.234 10.543 1.023 Respiration/minute 36.544 2.343 38.324 1.234 0.567
Contraction pressure/ml. mercury 132.453 6.323 132.231 5.324 1.234 Stretch pressure/ml. mercury 67.323 10.231 64.354 8.546 3.243
The researcher attributes the decrease in the stretch pressure of the control group in the posterior test to that most of the training curriculum for this group is traditional and that their training of the maximum power applies a pressure on the arterial circulation more than the pressure that the persistence exercises does. This pressure results in an increase in the arterial resistance during the process of lifting which results from the decrease in the blood flow in the arteries. This process is followed by a high blood flow after the attempt and resistance, the thing that results in arterial extension (Vasodilatation). This will result to less blood that flows back to the heart and this results in a decrease in the stretch pressure. (Larry, 1981) and (Samia A. Al-Jawad, 1983) refer to that the reason of the low stretch pressure after the athletic effort is an decrease in the arterial resistance because of the arterial extension of the working muscles. This low resistance leads to more blood flows from the arteries into the blood vessels of the muscles with a slight decrease in the stretch pressure". Review and discussion of the posterior tests between the experimental and control groups in functional variables .
Table (3) Shows the differences between the preceding tests of the experimental and the control groups in the functional variables after the attempt
Statistical indicators
Experimental group Control group
Functional variables T calculated value
Pulse/minute 143.243 3.234 144.542 3.546 1.433 Respiration/minute 36.233 2.354 37.453 2.343 0.887
Contraction pressure/ml. mercury
148.345 8.546 146.453 7.456 0.554
Stretch pressure/ml. mercury 51.233 6.542 52.231 4.333 1.234
Review and discussion of the achievement results of the control group
Table (4) Shows the differences between the preceding and posterior tests of the control group in the achievement variables after the attempt
Statistical indicators Preceding test Posterior test Lifts
T calculated value
Sitting snatch lift 113.234 22.331 117.544 20.122 6.323* Stable snatch lift 116.299 23.433 117.444 19.667 1.230
(Al-Mandalawi, Qasim, 2002) assures that "the high load affects the maximum power". The researcher attributes the significant differences of the stable snatch lift performance to the control group. Perhaps, the control group, in most of the training curriculum, practicing the maximum power the thing that led to an improvement of the achievement in the variable of (sitting snatch lift). Review and discussion of the achievement of the experimental and control groups in the posterior tests.
Table (5) Shows the differences between the experimental and control groups in the achievements of the posterior tests
Statistical indicators Experimental group Control group Lifts performance
T calculated value
Sitting snatch lift 119.121 18.333 118.443 19.344 1.656 Stable snatch lift 121.244 19.332 119.000 20.144 0.234
Review and discussion of the achievement variables results of the successful lifts number of the experimental group
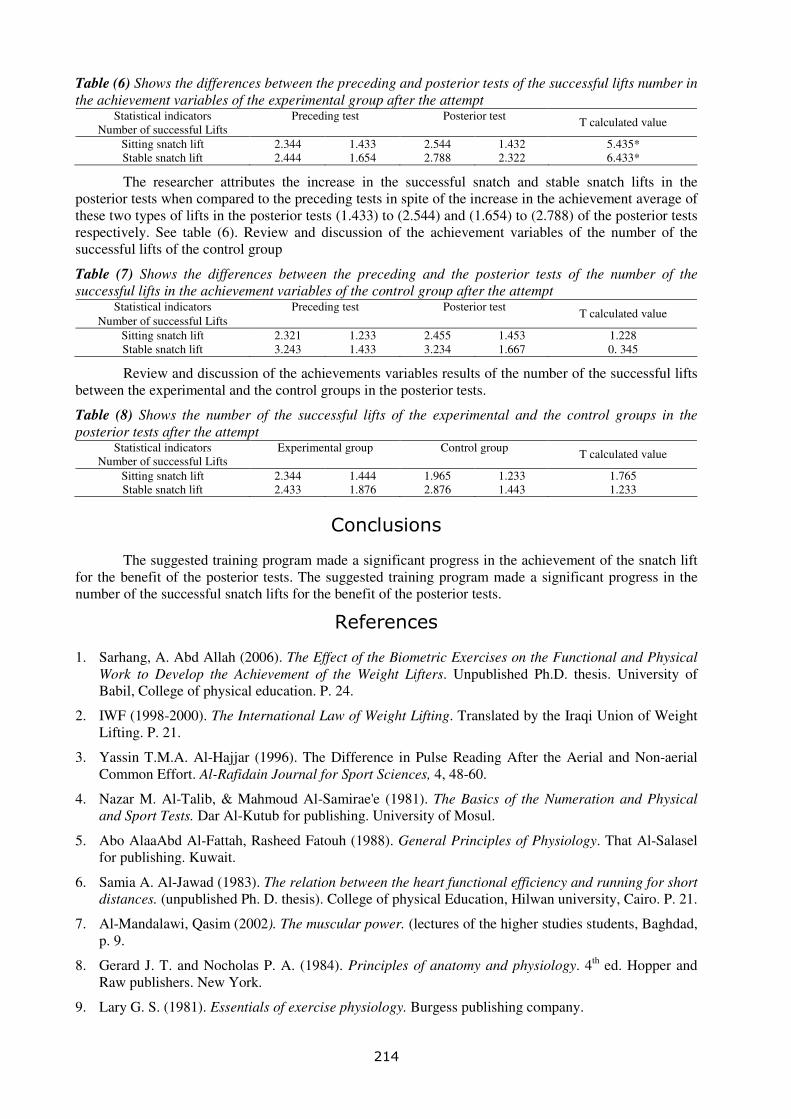
214
Table (6) Shows the differences between the preceding and posterior tests of the successful lifts number in the achievement variables of the experimental group after the attempt
Statistical indicators Preceding test Posterior test Number of successful Lifts
T calculated value
Sitting snatch lift 2.344 1.433 2.544 1.432 5.435* Stable snatch lift 2.444 1.654 2.788 2.322 6.433*
The researcher attributes the increase in the successful snatch and stable snatch lifts in the posterior tests when compared to the preceding tests in spite of the increase in the achievement average of these two types of lifts in the posterior tests (1.433) to (2.544) and (1.654) to (2.788) of the posterior tests respectively. See table (6). Review and discussion of the achievement variables of the number of the successful lifts of the control group
Table (7) Shows the differences between the preceding and the posterior tests of the number of the successful lifts in the achievement variables of the control group after the attempt
Statistical indicators Preceding test Posterior test Number of successful Lifts
T calculated value
Sitting snatch lift 2.321 1.233 2.455 1.453 1.228 Stable snatch lift 3.243 1.433 3.234 1.667 0. 345
Review and discussion of the achievements variables results of the number of the successful lifts between the experimental and the control groups in the posterior tests.
Table (8) Shows the number of the successful lifts of the experimental and the control groups in the posterior tests after the attempt
Statistical indicators Experimental group Control group Number of successful Lifts
T calculated value
Sitting snatch lift 2.344 1.444 1.965 1.233 1.765 Stable snatch lift 2.433 1.876 2.876 1.443 1.233
Conclusions
The suggested training program made a significant progress in the achievement of the snatch lift for the benefit of the posterior tests. The suggested training program made a significant progress in the number of the successful snatch lifts for the benefit of the posterior tests.
References
1. Sarhang, A. Abd Allah (2006). The Effect of the Biometric Exercises on the Functional and Physical Work to Develop the Achievement of the Weight Lifters. Unpublished Ph.D. thesis. University of Babil, College of physical education. P. 24.
2. IWF (1998-2000). The International Law of Weight Lifting. Translated by the Iraqi Union of Weight Lifting. P. 21.
3. Yassin T.M.A. Al-Hajjar (1996). The Difference in Pulse Reading After the Aerial and Non-aerial Common Effort. Al-Rafidain Journal for Sport Sciences, 4, 48-60.
4. Nazar M. Al-Talib, & Mahmoud Al-Samirae'e (1981). The Basics of the Numeration and Physical and Sport Tests. Dar Al-Kutub for publishing. University of Mosul.
5. Abo AlaaAbd Al-Fattah, Rasheed Fatouh (1988). General Principles of Physiology. That Al-Salasel for publishing. Kuwait.
6. Samia A. Al-Jawad (1983). The relation between the heart functional efficiency and running for short distances. (unpublished Ph. D. thesis). College of physical Education, Hilwan university, Cairo. P. 21.
7. Al-Mandalawi, Qasim (2002). The muscular power. (lectures of the higher studies students, Baghdad, p. 9.
8. Gerard J. T. and Nocholas P. A. (1984). Principles of anatomy and physiology. 4th ed. Hopper and Raw publishers. New York.
9. Lary G. S. (1981). Essentials of exercise physiology. Burgess publishing company.

215
SOME MEASURING CHARACTERISTICS OF THE TEST
"CIRCULAR KICK" – MAVASHI GERI
Žarko Kostovski1, Zoran Mašić2, Nina Ðukanović3, Vesela Kostovska4 and Zorica Kostovska5
1 University St. Cyril and Methodius, Faculty for Physical Culture, Skopje, Macedonia 2 College of Business Economics and Entrepreneurship, Belgrade, Serbia
3 High School of Medicine ”Milutin Milanković”, Belgrade, Serbia 4 University “Sv. Kliment Ohridski”, Faculty for Security-Forensic Science, Bitola, Macedonia
5 State University in Tetovo, Faculty for Physical Culture, Tetovo, Macedonia
Abstract
There was conducted a research on the target sample of 30 respondents supreme karate athletes with the main objective to establish some measurement features of the new constructed test. The survey was conducted in the Republic of Macedonia, on a representative sample of respondents at the age over 18 years, male. During the survey on the sample of respondents was applied 1 (one) manifest specific-motor variable (new constructed composite test), characteristic for karate sport. With applying the Hotteling procedure there was established a factor validity of the test, and with that were also established the latent dimensions of the same, where the significant main component is determined according to the Kaiser-Gutman criterion. Analyzing the research results, conclusions can be drawn concerning the measurement characteristics of the applied test and before all the reliability, sensitivity and factor validity of the same.
Keywords: karate, factor validity, Hotteling procedure, latent dimensions
Introduction
Major development of karate as a sport requires modern approaches, concepts, forms, activities and procedures in training the latest karate technologies, especially concerning the structure of anthropological features, their correlations and specific impacts on athletic performances. In addition, it is necessary to establish the diagnosis and the validity of the instruments used for modelling, diagnosis, planning, programming and monitoring of the effects of training process operationalization (Doder, Malacko, Stanković, & Doder, 2011).
In order to conduct better kinesiology researches, in it is necessary to be used good measuring instruments for registration and measuring the motor abilities and also for planning, programming, following and monitoring of the athletes’ training process (Kostovski, 2004).
Some knowledge about the motor skills development level can be obtained by assessing various manifestations registered with appropriate motor tests, so-called measuring instruments. Since human motor skills are measured indirectly, the complete measuring procedure must be standardized, and motor tests (measuring instruments) should be characterized with satisfactory measurement characteristics such as: validity, reliability, sensitivity, accuracy and so on. In this case, the obtained results in a motor ability with a sample of respondents could be compared with the results obtained with another sample of respondents of the same capacity (Kostovski & Georgiev 2009a).
Under good measuring instruments requires “possessing of satisfactory measuring characteristics of the instrument”. In concern of the bigger part of recent researches in karate sport, as measuring instruments there were applicable variables with good and satisfying measuring characteristics, established on a youth or high school respondents’ sample etc. The aforementioned conclusions point out the need for the constructing and defining tests with higher level of satisfactory measuring characteristics for assessment of the karate athletes’ specific motor dimensions.

216
Some measurement instruments that showed as "good" for a population or sample, are not necessary "good" for other population or sample. Especially in a case when examinees are of different ages, different sex or have other different characteristics. According to this research problem, there is a need for constant checking of the measurement characteristics of the tests. In this regard Костовски (2004) conducted a research to determine the measurement characteristics of some standards and specific motor tests in karate athletes of a different chronological age.
However, for a test to be valid and applicable it has to be reliable too. Knowledge of specific requirements in karate can help coaches, and even athletes to optimize the training program (Chaabène et. al., 2012).
Method
A small number of researchers have been undertaken that refer to establishing tests for evaluation of some specific motor characteristics with karate athletes. Given the fact, there is a need for conducting new researches that reffers to establishing tests for assessment of karate athletes’ specific motor characteristics.
Based on these considerations, the main objective of this study are karate senior athletes’ the measuring characteristics of motor tests from the specific motor space. The basic aim of this research is to establish the measuring characteristics (validity, reliability and sensitivity) of the applied test.
The research was covered with 30 karate athletes, standard and potential representatives from Macedonia, at the age of +18, defined as karate athletes-seniors. The research was realized on a target sample of male participants.
In this research on the sample of participants was applied 1 manifest specific motor variable for evaluating of the specific karate frequency of the lower extremities’. Circular kick on bag MAVASHI GERI.
The test is performing in sport gym, in the gym where karate athletes have their training. For performing the test there must be a punching bag attached to the wall, and stopwatch with which the measure men will measure the time. The participant stands in front of the bag in characteristically fighting pose "fu- do daci" on a distance which define himself according to the length of his leg. The sportsman task is to perform correct as much as possible more strokes "mavashi geri" with the effective leg in 10 seconds. The measure men stands on the side, turns on the stopwatch when the participant will start with the performance of the test and count the correct performed strokes in time of 10 seconds. The test is repeated 4 times with break between every repetition.
The data's obtained from the manifested specific motor test, were processed with the necessary statistical methods which are in function of the goals and tasks of this research. The data's are processed using a statistic program package, Excel 5 and Statistic for Windows.
For the purpose of this research, for the specific motor test, or for the composite assessment, there were calculated the following basic central and dispersive statistical parameters: arithmetic's mean (M), standard deviation (SD), minimal (Min), and maximal (Max) score. Based on symmetry of the distributions of the result it has been evaluated that some test represent easier or harder motor task for the participants (Skew.), and from the roundness of the distribution of the results it have been determine the homogeneity of the results in the same test (Kurt.). The normal distributions of the results have been presented through Kolmogoro-Smirnof method. The sensitivity as measuring performance was determined by the relationship between the mean and standard deviation. For determent of the correlation between the items there was calculated Pierce coefficient of correlation (r). Factor validity of the variables was determined with the Hotelling procedure, and there were calculated the latent dimensions of the variables, were the main components were determined by Kaiser-Guttmann criteria, and there were obtained: item projections of the main component (H), values of the isolated characteristic square root (λ) and contribution of the isolated characteristic square roots in the explanation of the total variability of the variance expressed in percents (%). Inter validity of the items was determined by the item projections of the first main component, or by the isolated characteristic square root (H). The mutual subject of the measure was determined by the value of the characteristic square root (λ). To determine the reliability there were calculated more coefficients and indexes of reliability, including: Cronbach index for

217
reliability, calculated by the item projections with the first main component (Cronbach–ά), Spearman-brown coefficient of reliability (rn) - calculated on the base of middle correlations between composites measures for each test individually, and interclass correlation coefficient for every test individually (ICC).
Results
In Table 1, are presented the central and dispersive statistical parameters of circular stroke with leg. Analyzing the values of the means of the four of the applied item of this variable, we can conclude next: in the first item there were achieved high results in relation with the rest three items, where there is moderate decline of the numbers of repetitions per unit time, as for the fourth item there is a slightly bigger value. All of the four values represent the real condition of the stability in terms of performing the treated test, and the small positive change which appears in these two items must be result of the motivation of the athletes, in performing of the first and fourth attempt to give their maximum. The test possesses relatively good discrimination, on which indicates the value of the variability, or the standard deviations.
According to the Kolmogorov-Smirnoff method, we cannot conclude statistical significant differing of the same (max D.).
Table 1. Basic statistical parameters of the test Stroke with leg on beg – MAVASHIGERI (MAVASI) Val. N Mean Min Max Std.Dev. Skew Kurt max D p
MAVASI1 30 10,667 5,000 17,000 2,845 ,613 ,030 ,193 p < ,20 MAVASI2 30 9,933 5,000 16,000 2,703 ,659 -,180 ,202 p < ,15 MAVASI3 30 9,767 5,000 16,000 2,569 ,827 ,735 ,164 p > .20 MAVASI4 30 9,967 5,000 17,000 2,632 ,841 ,725 ,177 p > .20
According to the tilt of the distribution of the results in the items, we can conclude that this test represents relatively easy task for the treated sample of participants (the mean of the four items is in the zone of middle results). For the four items of this test there was determined normal distribution of the results. The obtained results were expected in terms of the target sample of participants with longer training experience and defined technique of performance. The values of the correlation coefficient between the items are very high, positive and statistically significant with values of .91 to .97
Table 2. Matrix of item intercorrelation of the test Stroke with leg on bag – MAVASHI GERI (MAVASI) MAVASI1 MAVASI2 MAVASI3 MAVASI4 MAVASI1 1,00 MAVASI2 ,97 1,00 MAVASI3 ,95 ,94 1,00 MAVASI4 ,95 ,92 ,91 1,00
λ 3.821 % 95.528
In this variable there was determined that the all four items have mutual subject of measure, and relatively higher homogeneity of this variable, indicating on the value of the isolated characteristic square root of the first main component λ =3.821 and explains 95.528 % of the total variability of the variance. The reliability coefficients (Cronbach α = .984 and Spearman-Brown = .984) are very high and
Table 3. Hotelling procedure. Table 4. Reliability coefficient
Cronbach α = .984
SB2 = .984 IK = .945
H
MAVASI1 .982 972
MAVASI2 .963 954
MAVASI3 .942 904 MAVASI4 .934 907

218
with satisfying values, as for the inter correlation which is .945. According to Bukvić (1982) every reliability coefficient with value bigger than .80 indicates to high reliability of the tests, and values bigger than .90 indicates on very high reliability. According to the above mentioned for the variable ″Mavashi Geri″, we can say that: the test features with high degree of sensitivity and satisfying reliability coefficient. Also the test is simple for application and easy for explanation.
Discussion
On the sample of participants was applied 1 (one) manifest specific motor variable (newly constructed composed test), characteristic for the karate sport. The research was conducted on target sample of 30 participants (karate athletes), males from Macedonia, at the age of + 18 (karate athletes-seniors). The obtained results from the research lead us to the following conclusions which concern the measuring performance of the applied variable and before all, the factor validity, sensitivity and reliability of the same.
- The test ″Mavashi Geri″ features with high degree of sensitivity and satisfying reliability coefficients, which means that the eventual error in the measurements is very small.
- The reliability coefficients (Cronbach α = .984 and Spearman-Brown = .984) are very high and with satisfying values, as for the inter correlation which is .945. Also the test is simple for application and easy for explanation.
- The test evaluates the motor dimensions defined as specific karate frequency of the lower extremities.
- From the obtained results, the test should be recommended in the training technology and selection of the karate athletes in the test battery for evaluating of the specific karate frequency of the lower extremities (until constructing a new test).
Reference
1. Bukvić, A. (1982). Načela izrade psiholoških testova, [Principals of psychological tests.], Beograd: Zavod za udžbenike i nastavna sredstva.
2. Chaabène, H., Hachana, Z., Attia, A., Mkaouer, B., Chaabouni, S., & Chamari, K. (2012). Relative and absolute reliability of karate specific aerobic test (ksat) in experienced male athletes. Biolo. Sport, 29, 211-215.
3. Doder, D., Malacko, J., Stankovik, V., & Doder, R (2011). Predictor validity of morphological and basic motor variables for assessment and monitoring of the karate punch with the lead arm (oi-tsuki). Biolo. Sport, 28, 265-270.
4. Koletić, Z. (1992). Metrijske karakteristike situaciono motoričkih testova u karate, [Metric characteristics of situational motor tests in karate], Diplomski rad, Zagreb: Fakultet za fizičku kulturu Sveučilišta u Zagrebu.
5. Koropanovski, N., Dopsaj, M., & Jovanovic, S. (2008). Characteristics of Pointing Actions of Top Male Competitors in Karate at World and European level. Brazilian Journal of Biomotoric. 2 (4), 241 – 251.
6. Костовски Ж. (2004). Мерни карактеристики на моторните и специфицно моторицките тестови кај карате спортисти од разлицна хронолошка возраст, [Measuring features of motor and specific motor tests in karate athletes from different chronological age], Doctorial Dissertation, Skopje.
7. Костовски Ж. (2005). Утврдуванје на мерните карактеристики на одредени специфично моторни тестови за проценунување на специфична карате-координација, кај карате-спортистки помлади кадетки., [Determining the measurement characteristics of certain specific motor tests for assessment of specific karate coordination in younger female karate athletes-cadets], Физичка култура, 2, 115-118.

219
8. Kostovski, Ž., & Georgiev, G. (2009). Relijabilnost primenjenih testova za procenu specifične karate koordinacije kod vrhunskih karatista sa različite hronološke uzrasti. [Test reliability for assessment the appropriateness of specific coordination in elite karate athletes with different chronological ages]. Zbornik naučnih i stručnih radova "Sport i zdravlje", II Medjunarodni simpozijum sport i zdravlje (pp. 127-130). Tuzla: Fakultet za tjelesni odgoj i sport.
9. Kostovski, Ž., & Georgiev, G. (2009). Validnost testova za procenu specifične karate koordinacije kod 12 i 14 godišnjih karatista. [Validity tests for the assessment of the specific karate coordination at 12 and 14 years old karate athletes]. Zbornik naučnih i stručnih radova "Sport i zdravlje", II Medjunarodni simpozijum sport i zdravlje " (120-126). Tuzla: Fakultet za tjelesni odgoj i sport.
10. Kostovski, Ž., & Georgiev, G, (2009). Measure characteristics of motor tests for assessing rhythmic structure and explosive strength with karate athletes and non-athletes at the age of 12. Sport scientific and practical aspect, Tuzla.
11. Kostovski, Ž., Zeljković, M., Ibri, L., Soklevska, E., & Zaborski, B. (2012). Validity, reliability and sensitivity of the test stroke with leg mae geri [Valjanost, pouzdanost i osjetljivost testa udarac nogom - mae geri]. SportLogia, 8(2), 269–277.
12. Sertić, H., Vidranski, T., Segedi, I. (2010). Terenski testovi za procjenu specifičnih Motoričkih sposobnosti karatista., [Field tests for the assessment of specific motor skills karate athletes]. Zbornik radova 8. godišnja meñunarodna konferencija Kondicijska priprema sportaša (pp. 223-226). Zagreb.

220

221
THE EXERCISE INTENSITY OF HUNGARIAN A-LEVEL
MOTOCROSS ATHLETES
Vári Beáta and Nagy Arnold Gyula Juhász Faculty of Education, Institute of Physical Education and Sport Sciences,
University of Szeged, Hungary
Abstract
Motocross (MX) is an off-road motorsport, which sport physiological effects are not slightly investigated and discovered by sport science. This type of racing needs high technical skills, mental and physical fitness as well. The MX athletes have higher cardiovascular load during a 30 minutes race than a professional cyclist during a time trial. There are numerous Hungarian A-level MX athletes who spend great amount of time training for national and international races. But do they have the same exercise intensity as the world greatest MX athletes? Twelve A-level MX athletes agreed to partake in our study, who were 16-28 year old males, racing in MX2 (250ccm 4T) or MX1 (450ccm 4T). The data collection took place on two events of the Hungarian National Motocross Championship in Hódmezıvásárhely, Hungary 2011 and ’12 by Polar Team System. Every race has a free practice, a qualifying and two runs. Each runs were 25 minutes +2 laps (about 30 minutes). Only the athlete’s complete runs were analyzed by Polar Pro Trainer 5 (software). These results were compared to international study results. After analyzing all data, we found out the HRavg of Hungarian MX athletes is 184, which means they averaged 95% of their HRmax and they burnt 343 kcal. American (Augustine, 2011) and a Finnish (Konttinen, 2007) studies in the same subject reported their HRavg results 94-, 95- and 96% of the HRmax. The competitors completed the hall heat in the max.pulse zone, so theirs results (toughness, heart rate) are the same as theirs foreign rival.
In conclusion, our study shows no significant differences to other international studies. We can state, therefore, Hungarian MX athletes exercise intensity is the same as the world greatest MX athletes’, so Hungarians should be able to beat them judged by the cardiovascular load and exercise intensity. The results represent the physical demand of a race day as well by the kcal loss. This could be 1400 kcal or even more.
Keywords: Motocross, pulse control, heart rate, competitors.
Introduction
Off-road motorsport request concentration, fast reflexes and short reaction time, especially if we are talking about motocross. Most of the people do not know that motocross is physically demanding as athletics or cycling is and sometimes exercise intensity is nearly maximal.
Hungarian motocross and the riders develop year by year. For achieving their goals and dreams, about being among the World top riders, they take part of international competitions beside the Hungarian National Championship.
Since motocross is one of the most difficult and complex off-road motorsports, it is impossible to investigate that in a laboratory. Maybe this could be the answer for the so little researches worldwide. Professional heart rate monitors, however, makes it possible to study these sports during training sessions or in race situation. After the sessions and races we can analyze all the saved data and compare them to others or come to conclusion.
We would like to demonstrate with scientific results that motocross is one of the most demanding sports in the aspect of exercise intensity. This is not just the physical and cardiovascular load which is

222
caused by riding on a 100kg and 40-50HP bike in any weather and track conditions, but it can refer to the mental stress caused by the constant concentration and crash-avoidance.
Our goals are, furthermore, helping the development of Hungarian motocross community. The latest and only book which deals with motocross in Hungary was published in 1985. Our fresh data and results compared to internationals can help athletes’ training work and preparation for international competitions giving their best.
Method
We used a Polar Team System heart rate monitor, which is able to collect 10 riders’ data simultaneously. This system is less disturbing for the riders, because it saves all the data to its memory built-in the brace, and the athletes do not have to wear any other accessories. The braces save data in every 5 seconds so it gives us a continuous heart rate curve. After the races we analyzed data in the Polar Pro Trainer 5 software. We untied the Polar System time to Chronomoto Timing Team’s official race time to achieve true real time results.
We needed the HRmax of each athlete but lack of a sport laboratory we calculated it by the following formula:. x=5 if the athlete is female, x=0 if the athlete is male and y=5 if the athlete is not A-level, y=0 if he/she is an A-level athlete.
The data collection took place in Hódmezıvásárhely, Hungary in 15.05.2011 and 22.04.2012 during the National Motocross Championship’s rounds. 12 A-level motocross riders, who were 16-28 year old males, agreed to partake in our study.
A motocross event lasts a day long. A free practice and qualifying is held in the morning and the two runs are held in the afternoon. The free practice and the qualifying are 25 minutes long and the runs are 25 minutes and 2 laps long (app. 30min). Only the completed runs were analyzed.
Results
We could analyze 9 heart rate curve and data because of the high number of injuries, crashes or the failure of the data collection.
A complete run’s heart rate curve looks like the following:

223
The following table summarizes the analyzed data compared to their athletes: Athlete/
run HRrlx Calc. HRmax HRmax HRavg
HRavg/ Calc. HRmax
HRavg/ HRmax Burnt kcal
1./1. 54 202 201 193 96% 96% 300
2./1. 55 197 190 183 93% 96% 340
3./1. 58 195 187 182 93% 97% 400
4./1. 48 199 194 186 93% 96% 325
4./2. 48 199 194 187 94% 96% 333
5./1. 45 202 194 188 93% 97% 356
5./2. 45 202 192 187 93% 97% 351
6./1. 49 201 182 179 89% 98% 344
6./2. 49 201 182 175 87% 96% 337
The relaxed heart rate of the athletes was 50,5 ± 4,2. This data is significantly less than a non-athletic relaxed heart rate, which is usually 65-75. So this low HRrlx can refer to endurance training.
The mean calculated HRmax was 200 ± 2. The athletes mean HRavg was 184 ± 4 and the mean HRmax was 191 ± 5. They averaged 97% ± 0,01% of their HRmax and 92% ± 0,02% of their calculated HRmax. There is a 5% gap among the two averaged result which shows the lack of the laboratory HRmax
test and the inaccuracy of the formula. Therefore we calculated the mean averaged results, which is 95%.
A motocross athlete burns 343 ± 17,7 kcal during one run, which equals a hamburger’s energy. This means during a whole race day they can lose 1440 kcal.
Conclusion
Our study is the first one, which investigates motocross athletes’ exercise intensity in Hungary. Through the results an expert can see how great is the cardiovascular load and a motocross rider tolerates that in each run in complete gear on a 100kg bike which is 40-50HP strong.
We compared the results to Augustine et al. and Konttinen et al. who both had the same result, the athletes’ average heart rate was 95% of their maximum. So the Hungarian motocross riders are as good as the international top riders at least in exercise intensity. If they can not succeed on international competitions, it is more can be a fault of their riding technique or speed.
Reference
1. Augustine, S., Gay, D., Keen, J., Riel, R., Evans, M., & Milek, M. (2011). The Exercise Intensity of MX and SX Racing. (TC Training LLC) Downloaded: 2011, source: Racer X Virtual Trainer - Motocross & Action Sports Training, Fitness & Nutrition: http://www.racerxvt.com/virtual_trainer/Dr_A_heart_rate.html
2. Dickhut, H.-H. (2005). Sportélettan, sportorvostan. Budapest: Dialóg Campus Kiadó.
3. Glázer, T. (2010). Pulzusmérés. Budapest: Cser Kiadó.
4. Konttinen, T., Hakkinen, K., & Kyrölainen, H. (2007). Cardiopulmonary loading in motocross riding. Journal of Sports Sciences, old.: 995 – 999.
5. Kökényesy, G. (1985). Porban az igazság. Budapest: Sportpropaganda Vállalat.
6. Sachs, L. (2011). Heart Rate Training. IDEA Fitness Journal, old.: 28-31.
7. Saltin, B. (1975). Maximal oxygen uptake and heart rate of a motocross rider during riding. In Husqvarna 250-360 CR owner’s manual. Varnamo, Svédország: Bratts Tryckeri AB.

224

225
USE OF SUPPLEMENTS AMONG THE NATIONAL TRACK AND
FIELD TEAM MEMBERS
Milan Šolaja1, Anita Šolaja1 and Miroslav Milankov2
1 Faculty of Sport and Physical Education, University of Novi Sad 2 Clinical Center of Vojvodina, Clinic for Orthopedic Surgery and Traumatology,
Novi Sad, Serbia
Abstract
The standard diet of active athletes consist of various nutritional supplements. Today, the top results in track and field can not be achieved without the use of additives or supplements.
The research included 78 athletes who are members of the junior and senior national team of Serbia (34 women and 44 men) aged 15 to 32 years. The research was conducted in the official training camp for the national selection in Bar (Montenegro), and research involved international respondents (N=37) and national (N=41) rank athletes.Data was collected by using a non-standardized survey research technique, questionnaire, andto determine the significance between the different variables was used nonparametricχ2 test. There were significant differences between men and women in the use of certain types of supplements. Also, there were significant differences in using the supplements among category level and track and field discipline.
Keywords: track and field, questionnaire, supplements, men, women.
Introduction
Sport performance primarily depends on genetic characteristic of the athlete, but as well as morphological, physiological, psychological and metabolic sport specific characteristics. Optimal training can improve physical power, enhance mental strength and make competitive advantage. However athletes very often use different substances in order to achieve better physical fitness and sport performance. Implementation of Anti-doping rules decreases use of prohibited substances, but increases use of different dietary supplements.
Well-planned, balanced diet of young people involved in regular sports training, is one of the keys to staying healthy, to provide unhindered growth and achieve maximum success in the sport. In these circumstances, the total energy needs are icreased and the demand for all nutrients accordingly. Respecting the recommended relation carbohydrate - protein - fat will provide the intake of all other nutrients. Specific nutrient supplementation is recommended only in case of inability to meet the needs by consuming "normal" food and / or meals, and in the case of clear biochemical indicators of deficiency of certain nutrients as well. Acquisition of good eating habits at an early age is essential both for good health and later in life, when sporting activities stop. Therefore, educating coaches, parents and young athletes in that direction is the key to success.Nutrition duty is to improve psychophysical ability in athletes, efficiency, faster recover after physical activity and to keep optimum body weight. There are many factors that have to be consider in planning diet for an athlete, such as: age, sex health condition, body weight, climatic conditions, characteristics of sport activity, category, phase of training process, intensity, frequency and duration of training.
Numerous studies point to the problem of excessive use of drugs and dietary supplements by athletes. The trend of increased use of dietary supplements (74%) and drugs (54%) was indicated for the first time after the Olympic Games in Sydney (Corrigan and Kazlauskas, 2000). Although there are many reports that supplements can enhance athletic ability, there is still not enough evidence to support those claims (Burke and Deakin, 2006; Coombes and Hamilton, 2000; Telford, Catchpole, Deakin, et al., 1992;

226
Schwenk and Costley, 2002). On the other hand, inappropriate and excessive use of dietary supplements and medications (called polypharmacy) may cause significant side effects and interactions from mild discomfort to life-threatening symptoms (Petróczi and Naughton, 2007; Chen, Biller, Willing and Lopez, 2008).
Despite lack of scientific evidence to support their alleged benefits (Singh, Moses and Deuster, 1992; Schwenk and Costley, 2002),the retail sale of dietary supplementsin the USA generated $3.3 billion in 1990 and $13.9 billion in 1998, and is predicted to triple (US Food and Drug Administration, 2005; USDA Food Surveys Research Group, 2005). Unlike medicines, there is no governing body to control and regulate the supplement industry.
Regulations in other nations are not as stringent and athletes, therefore, remain vulnerable. There is also a small but real risk of an athlete committing an unintentional doping offence as the result of ingesting a dietary supplement or herbal preparation (Baylis, Cameron-Smith and Burke, 2001; Geyer, Parr and Mareck, 2004). Athletes are also at risk of significant adverse effects as some dietary supplementsand herbal preparations have been associated with cardiovascular, neurological, metabolic, and haematological problems (Foxford, Sahlas and Wingfield, 2003;Scally and Hodge, 2004). Elite athletes are more likely to be under pressure to take supplementsand it was, therefore, decided to study this population.
The objectives of this study were to determine use or non-use of multivitamins, protein, energy drinks and creatine by the current national junior trackandfield team, and the difference in use among men and female, competition level, category level and track and field discipline.
Method
The research included 78 athletes who are members of the junior and senior national team of Serbia (34 women and 44 men) aged 15 to 32 years. The research was conducted in the official training camp for the national selection in Bar (Montenegro), and research involved international respondents (N=37; 47,4%) and national (N=41; 52,6%) rank athletes. Data was collected by using a non-standardized survey research technique, questionnaire, which was anonymous and which included informations of taking or no-taking of multivitamins, proteins, energy drinks and creatine. Authors decided to study the usage of these types of supplements on the basis of years of experience in sport, particulary in athletics. Besides that, questionnaire included information about gender, competition level, category level and track and field discipline.
Statistical analysis was performed using the SPSS 20.0 package. A p value <0.05 was considered statistically significant. Statistical analyses were performed to compare subjects taking and not taking supplements. To determine the significance between the different variables was used nonparametric independent χ2 test. Analyses were calculated for all subjects combined and also separately by gender, competition level, category level and track and field discipline.
Results and Discussion
70,5% of the total number of athletes were using multivitamins. Of the number who used, the prevalence of multivitamins was slightlyhigher for male (54,5%) than female athletes (45,5%), and this did not reach statistical significance (p‐=‐0.61). Proteins were used 41% of total. Male athletes used proteins (62,5%) more often than the female (37,5%) athletes and there were statistical significant difference (p=0.00) among gender. 47,4% of total number of athletes were using energy drinks.Creatin preparations were used 30,8% of total number.There were no statistical significant difference (p=0.65) between male (55,5%) and female athletes (44,5%) in using energy drinks. The difference for creatine use (p=0,00) was higher for male (58,3%) than for female athletes (41,7%).
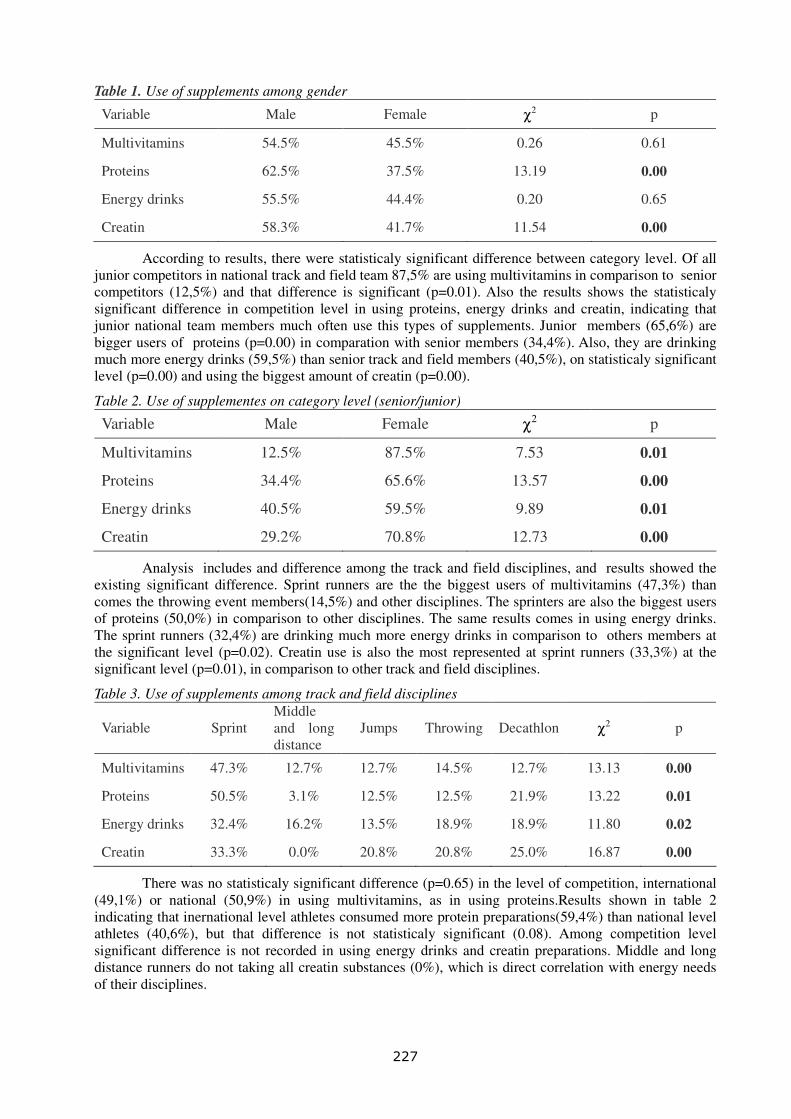
227
Table 1. Use of supplements among gender
Variable Male Female χ2 p
Multivitamins 54.5% 45.5% 0.26 0.61
Proteins 62.5% 37.5% 13.19 0.00
Energy drinks 55.5% 44.4% 0.20 0.65
Creatin 58.3% 41.7% 11.54 0.00
According to results, there were statisticaly significant difference between category level. Of all junior competitors in national track and field team 87,5% are using multivitamins in comparison to senior competitors (12,5%) and that difference is significant (p=0.01). Also the results shows the statisticaly significant difference in competition level in using proteins, energy drinks and creatin, indicating that junior national team members much often use this types of supplements. Junior members (65,6%) are bigger users of proteins (p=0.00) in comparation with senior members (34,4%). Also, they are drinking much more energy drinks (59,5%) than senior track and field members (40,5%), on statisticaly significant level (p=0.00) and using the biggest amount of creatin (p=0.00).
Table 2. Use of supplementes on category level (senior/junior)
Variable Male Female χ2 p
Multivitamins 12.5% 87.5% 7.53 0.01
Proteins 34.4% 65.6% 13.57 0.00
Energy drinks 40.5% 59.5% 9.89 0.01
Creatin 29.2% 70.8% 12.73 0.00
Analysis includes and difference among the track and field disciplines, and results showed the existing significant difference. Sprint runners are the the biggest users of multivitamins (47,3%) than comes the throwing event members(14,5%) and other disciplines. The sprinters are also the biggest users of proteins (50,0%) in comparison to other disciplines. The same results comes in using energy drinks. The sprint runners (32,4%) are drinking much more energy drinks in comparison to others members at the significant level (p=0.02). Creatin use is also the most represented at sprint runners (33,3%) at the significant level (p=0.01), in comparison to other track and field disciplines.
Table 3. Use of supplements among track and field disciplines
Variable Sprint Middle and long distance
Jumps Throwing Decathlon χ2 p
Multivitamins 47.3% 12.7% 12.7% 14.5% 12.7% 13.13 0.00
Proteins 50.5% 3.1% 12.5% 12.5% 21.9% 13.22 0.01
Energy drinks 32.4% 16.2% 13.5% 18.9% 18.9% 11.80 0.02
Creatin 33.3% 0.0% 20.8% 20.8% 25.0% 16.87 0.00
There was no statisticaly significant difference (p=0.65) in the level of competition, international (49,1%) or national (50,9%) in using multivitamins, as in using proteins.Results shown in table 2 indicating that inernational level athletes consumed more protein preparations(59,4%) than national level athletes (40,6%), but that difference is not statisticaly significant (0.08). Among competition level significant difference is not recorded in using energy drinks and creatin preparations. Middle and long distance runners do not taking all creatin substances (0%), which is direct correlation with energy needs of their disciplines.

228
Table 4. Use of supplements on competation level (international/national)
Variable International National χ2 p
Multivitamins 49.1% 50.9% 0.20 0.65
Proteins 59.4% 40.6% 3.10 0.08
Energy drinks 51.4% 48.6% 0.43 0.51
Creatin 52.2% 45.8% 0.63 0.43
A multivitamin is preparation intended to be a dietary supplement with vitamins, dietary minerals, and other nutritional elements.By supplementing the diet with additional vitamins and minerals, multivitamins can be a valuable tool for those with dietary imbalances or different nutritional needs (Rock, 2007). According to Nieper (2005) multivitamins were the most frequently used supplement (45%), among track and field athletes.In elite Canadian athletes using of multivitamins and minerals (13.5%),and vitamin C (6.4%) were most frequently reported (Erdman, Fung and Reimer, 2006). Reason for this is supported by the primary motivations cited for taking supplements in Nieper (2005) study: health issues (33%) and strengthening the immune system (44%). Among junior team members and sprint runners of our national track and field team, is also widespread this type of supplement. Sprinter runners are taking lots of different types of supplement because of complex motor abilities and energetic capacities, needed for their performance.
Dietary protein is required to promote growth, repair damaged cells and tissue, synthesize hormones, and for a variety of metabolic activities. Finally, adequate intake and appropriate timing of protein ingestion has been shown to be beneficial in multiple exercise modes, including endurance, anaerobic, and strength exercise(Kreider and Campbell, 2009). Protein is more often use by male athletes, sprint runners and junior team members in national track and field of Serbia. Athletes at the highest performance level were significantly more likely to use protein supplements, to be advised by strength trainers regarding supplement usage, to have a higher self-rating of their diet, to prefer individual interviews for supplement educational purposes, to perceive greater awareness of antidoping legislation, and train more (Erdman, Fung and Reimer, 2006).
A variety of physiological and psychological effects have been attributed to energy drinks and their ingredients.From a total declared, sport drinks (22.4%)are most frequently reported in elite Canadian athletes(Erdman, Fung and Reimer, 2006). Junior team members and sprint runners are using more often this type of drinks rather other categories in this study. Energy drinks and different types of supplements are very popular among young people,athletes and non-athletes, so there is the key why they use it so much. And when they come to senior level, they can notice which supplements, they have used, are good for them and choose the right one.
Williams and Branch (1998) suggest that the adenosine triphosphate-phosphocreatine (ATP-PCr) energy system has the greatest power potential. Muscle stores of PCr may split and release energyfor rapid resynthesis of ATP, although the supply of PCr is limited, with the combined total ATP and PCr capable of sustaining all out maximal effort exercise lasting up to 5 to 10 seconds (Williams and Branch, 1998). Therefore, fatigue may be attributed to the rapid decrease in PCr. Generation of peak anaerobic power and anaerobic capacity in short-term, highintensity exercise may be dependent upon endogenous levels of ATP and PCr, particularly, PCr as a means to rapidly regenerate the limited intramuscular supply of ATP for anaerobic capacity (Williams and Branch 1998). It has also been reported that CrS may improve single effort and/or repetitive sprint performance particularly in sprints lasting 6 to 30 s with 30 s to 5min of rest recovery between sprints(Dawson et al.,1995). This is the reason why sprinter runners are, among all track and field disciplines, the biggest consumers of this type of supplement. After sprinters comes decathlon athletes and athletes who atempt throwing events, which is in direction relation with the energetic needs of their disciplines. The results of our study are matching with other studies, thatmale athletes used “ergogenic aids” more often than the female athletes, and one of the resons is weight increasing.Also, this type of supplements are widespread in junior track and field teams, rather than senior (Nieper, 2005). International and national level athletes consumed creatin without difference. The reason is probably easy availability of this products and their goal to acchive the best results.
229
In conclusion,education, in first place coaches and athletes is a primary goal. But first step should be cooperation of medicine, pharmacy and sport science in order to make strategy and recommendations on National level for use of supplements and drugs in sport. And all in order to achieve top results in athletics and other sports.
References
1. Baylis, A, Cameron-Smith, D., & Burke, L. M. (2001). Inadvertent doping through supplement use by athletes: assessment and management of the risk in Australia. International Journal of Sport Nutrition and Exercise Metabolism, 11(3) :365–83.
2. Burke, L, & Deakin, V. (2006). Clinical Sports Nutrition. Sydney: McGraw-Hill Australia.
3. Cheryl, L. R. (2007). Multivitamin-multimineral supplements: who uses them?. American Journal of Clinical Nutrition, 85(1), 277S-279S.
4. Coombes, J.S, & Hamilton, K. L.(2000). The effectiveness of commercially available sports drinks. Sports Medicine Journal, 29, 181–209.
5. Corrigan, B, & Kazlauskas, R. (2003). Medication use in athletes selected for doping control at the Sydney Olympics 2000. Clinical Journal of Sport Medicine,13(1), 33-40.
6. Dawson, B., Cutler, M., Moody, A., Lawerence, S., Goodman, C., & Randall, N. (1995). Effects of oral creatine loading on single and repeated maximal short sprints. Australian Journal of Science and Medicine in Sports, 27, 56-61.
7. Erdman, K.A., Fung, T.S., & Reimer, R. A. (2006). Influence of Performance Level on Dietary Supplementation in Elite Canadian Athletes. Medicine & Science in Sports & Exercise, 38(2), 349-356.
8. Foxford, R.J, Sahlas, D.J., & Wingfield, K. A. (2003). Vasospasm-induced stroke in a varsity athlete secondary to ephedrine ingestion. Clinical Journal of Sport Medicine,13,183–185.
9. Geyer, H, Parr, M.K., & Mareck, U. (2004). Analysis of non-hormonal nutritional supplements for anabolic-androgenic steroids – results of an international study. International Journal of Sports Medicine, 25(2), 124–129.
10. Kreider, R.B., & Campbell, B. (2009). Protein for exercise and recovery. The Psysician and Sportsmedicine, 37(2), 13-21.
11. Nieper, A.(2005). Nutritional supplement practices in UK junior national track and field athletes. British Journal of Sports Medicine, 39, 645–649.
12. Petróczi, A., &Naughton D P. (2007). Supplement use in sport: is there a potentially dangerous incongruence between rationale and practice? Journal of Occupational Medicine and Toxicology, 2:4
13. Scally, M.C., & Hodge, A. (2003). A report of hypothyroidism induced by an over-the-counter fat loss supplement (Tiratricol). International Journal of Sport Nutrition and Exercise Metabolism, 13(1), 112–116.
14. Schwenk, T. L., & Costley, C. D. (2002). When food becomes a drug: nonanabolic nutritional supplement use in athletes. American Journal of Sports Medicine, 30(6), 907–916.
15. Schwenk, T., & Costley, C. (2002). When Food Becomes A Drug: Nonanabolic Nutritional Supplement Use in Athletes. American Journal of Sports Medicine, 30(6), 907-916.
16. Singh, A, Moses, F. M., & Deuster, P. A. (1992). Chronic multivitamin-mineral supplementation does not enhance physical performance. Medicine and Science in Sports and Exercise's, 24, 726–732.
17. Telford, R. D, Catchpole, E. A, Deakin, V., et al. (1992). The effect of 7 to 8 months of vitamin/mineral supplementation on athletic performance. International Journal of Sport Nutrition, 2, 135–153.
18. US Food and Drug Administration. Dietary supplements. http://www.cfsan.fda.gov/~dms/supplmnt.html
19. USDA Food Surveys Research Group. Supplementary data tables. USDA’s 1994–1996 continuing survey of food intake by individuals. http://www.barc.usda.gov/bhnrc/foodsurvey/pdf/Supp.pdf
20. Williams, M.H., & Branch, J.D. (1998) Creatine supplementation and exercise performance: Anupdate. Journal of the American College of Nutrition, 17, 216-234.

230