3_-_graphs_and_functions v3
TRANSCRIPT
1
Graphs and Functions
Session #3
Carlos da Maia, PhD
Business School
UNIVERSITY OF ST. THOMAS OF MOZAMBIQUE
3L5ECONS
Advanced Mathematics for Economics, September 2014

2
Outline
1 Functions of One Variable
2 An Example of a Function
3 Domain of a Function
4 Graphs of Functions
5 Linear Functions
6 Linear Models
7 Non-linear Functions
3
Introduction
Important in every area of pure and applied mathematics(including mathematics applied to economics);
The language of economic analysis is full of terms like demandand supply functions, cost functions, production functions,consumption functions, etc;
One variable is a function of another if this �rst variabledepends upon the second;
Example
The area of a circle is a function of its radius; if radius r is given,then the area A is determined;

4
Introduction
Important in every area of pure and applied mathematics(including mathematics applied to economics);
The language of economic analysis is full of terms like demandand supply functions, cost functions, production functions,consumption functions, etc;
One variable is a function of another if this �rst variabledepends upon the second;
Example
The area of a circle is a function of its radius; if radius r is given,then the area A is determined;

5
Introduction
Important in every area of pure and applied mathematics(including mathematics applied to economics);
The language of economic analysis is full of terms like demandand supply functions, cost functions, production functions,consumption functions, etc;
One variable is a function of another if this �rst variabledepends upon the second;
Example
The area of a circle is a function of its radius; if radius r is given,then the area A is determined;
6
Introduction, cont.
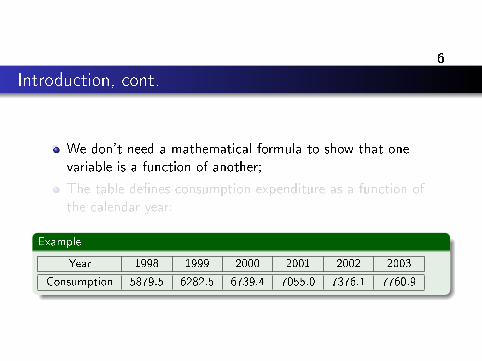
We don't need a mathematical formula to show that onevariable is a function of another;
The table de�nes consumption expenditure as a function ofthe calendar year:
Example
Year 1998 1999 2000 2001 2002 2003
Consumption 5879.5 6282.5 6739.4 7055.0 7376.1 7760.9
7
Introduction, cont.
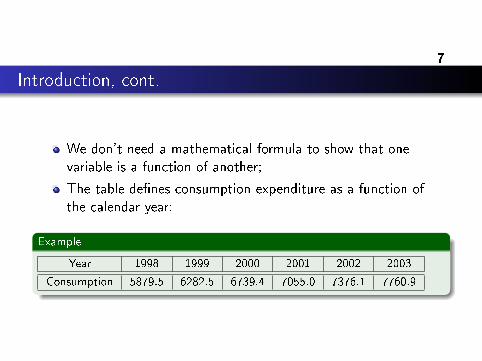
We don't need a mathematical formula to show that onevariable is a function of another;
The table de�nes consumption expenditure as a function ofthe calendar year:
Example
Year 1998 1999 2000 2001 2002 2003
Consumption 5879.5 6282.5 6739.4 7055.0 7376.1 7760.9

8
Introduction, cont.
The dependence between two variables can also be illustratedby means of a graph.
Figure: The La�er curve
9
Introduction, cont.
Functions are given letter names such as f, g, or F;
If f is a function and x is a number in its domain D, then f(x) denotes thenumber that the function f assigns to x;
The symbol f(x) is pronounced "f of x", or often just "f x";
Note de di�erence:
f is a symbol forthe function; and
f(x) denotes the value of f at x.
If f is a function, we sometimes ley y denote the value of f at x, so
Example
y = f(x)
x is the independent variable or the argument of f;
y is the dependent variable, because the y (in general) depends on thevalue of x;

10
Introduction, cont.
Functions are given letter names such as f, g, or F;
If f is a function and x is a number in its domain D, then f(x) denotes thenumber that the function f assigns to x;
The symbol f(x) is pronounced "f of x", or often just "f x";
Note de di�erence:
f is a symbol forthe function; and
f(x) denotes the value of f at x.
If f is a function, we sometimes ley y denote the value of f at x, so
Example
y = f(x)
x is the independent variable or the argument of f;
y is the dependent variable, because the y (in general) depends on thevalue of x;
11
Introduction, cont.
Functions are given letter names such as f, g, or F;
If f is a function and x is a number in its domain D, then f(x) denotes thenumber that the function f assigns to x;
The symbol f(x) is pronounced "f of x", or often just "f x";
Note de di�erence:
f is a symbol forthe function; and
f(x) denotes the value of f at x.
If f is a function, we sometimes ley y denote the value of f at x, so
Example
y = f(x)
x is the independent variable or the argument of f;
y is the dependent variable, because the y (in general) depends on thevalue of x;
12
Introduction, cont.
Functions are given letter names such as f, g, or F;
If f is a function and x is a number in its domain D, then f(x) denotes thenumber that the function f assigns to x;
The symbol f(x) is pronounced "f of x", or often just "f x";
Note de di�erence:
f is a symbol forthe function; and
f(x) denotes the value of f at x.
If f is a function, we sometimes ley y denote the value of f at x, so
Example
y = f(x)
x is the independent variable or the argument of f;
y is the dependent variable, because the y (in general) depends on thevalue of x;

13
Introduction, cont.
Functions are given letter names such as f, g, or F;
If f is a function and x is a number in its domain D, then f(x) denotes thenumber that the function f assigns to x;
The symbol f(x) is pronounced "f of x", or often just "f x";
Note de di�erence:
f is a symbol forthe function; and
f(x) denotes the value of f at x.
If f is a function, we sometimes ley y denote the value of f at x, so
Example
y = f(x)
x is the independent variable or the argument of f;
y is the dependent variable, because the y (in general) depends on thevalue of x;

14
Introduction, cont.
Functions are given letter names such as f, g, or F;
If f is a function and x is a number in its domain D, then f(x) denotes thenumber that the function f assigns to x;
The symbol f(x) is pronounced "f of x", or often just "f x";
Note de di�erence:
f is a symbol forthe function; and
f(x) denotes the value of f at x.
If f is a function, we sometimes ley y denote the value of f at x, so
Example
y = f(x)
x is the independent variable or the argument of f;
y is the dependent variable, because the y (in general) depends on thevalue of x;
15
Introduction, cont.
Functions are given letter names such as f, g, or F;
If f is a function and x is a number in its domain D, then f(x) denotes thenumber that the function f assigns to x;
The symbol f(x) is pronounced "f of x", or often just "f x";
Note de di�erence:
f is a symbol forthe function; and
f(x) denotes the value of f at x.
If f is a function, we sometimes ley y denote the value of f at x, so
Example
y = f(x)
x is the independent variable or the argument of f;
y is the dependent variable, because the y (in general) depends on thevalue of x;

16
Introduction, cont.
The domain of the function f is the set of all possible values of theindependent variable;
The range is the set of corresponding values of the dependent varaible;
In economics, x is often called exogenous variable, whereas y is theendogenous variable;
A function is often de�ned by a formula such as: y = 2x2- 3x +8; thefunction is then the rule that assigns the number 2x2- 3x +8 to each value of x.
17
Introduction, cont.
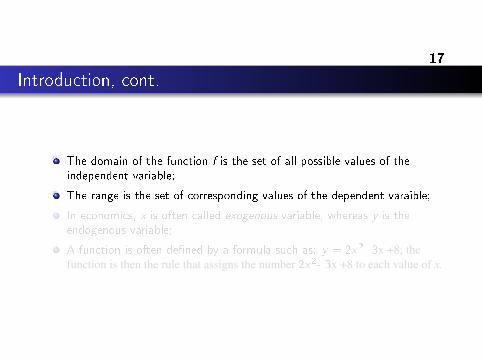
The domain of the function f is the set of all possible values of theindependent variable;
The range is the set of corresponding values of the dependent varaible;
In economics, x is often called exogenous variable, whereas y is theendogenous variable;
A function is often de�ned by a formula such as: y = 2x2- 3x +8; thefunction is then the rule that assigns the number 2x2- 3x +8 to each value of x.

18
Introduction, cont.
The domain of the function f is the set of all possible values of theindependent variable;
The range is the set of corresponding values of the dependent varaible;
In economics, x is often called exogenous variable, whereas y is theendogenous variable;
A function is often de�ned by a formula such as: y = 2x2- 3x +8; thefunction is then the rule that assigns the number 2x2- 3x +8 to each value of x.
19
Introduction, cont.
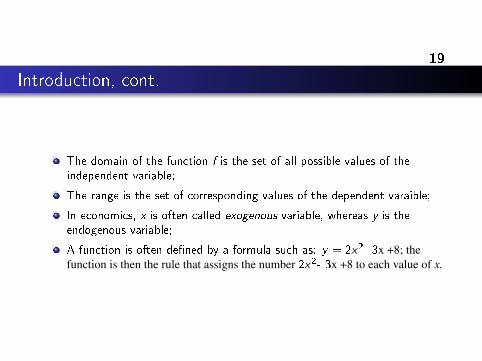
The domain of the function f is the set of all possible values of theindependent variable;
The range is the set of corresponding values of the dependent varaible;
In economics, x is often called exogenous variable, whereas y is theendogenous variable;
A function is often de�ned by a formula such as: y = 2x2- 3x +8; thefunction is then the rule that assigns the number 2x2- 3x +8 to each value of x.
20
An Example of a Function
Example
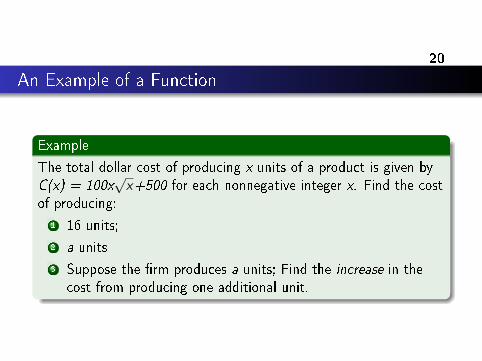
The total dollar cost of producing x units of a product is given byC(x) = 100x
√x+500 for each nonnegative integer x. Find the cost
of producing:
1 16 units;
2 a units
3 Suppose the �rm produces a units; Find the increase in thecost from producing one additional unit.
21
An Example of a Function, cont.
Example
Solution
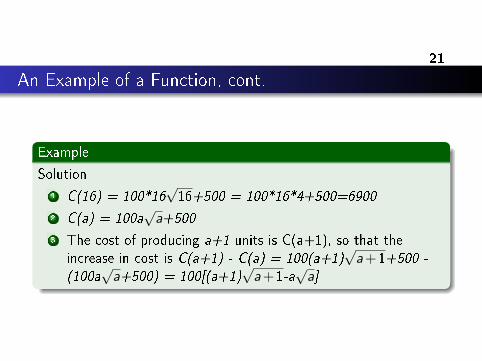
1 C(16) = 100*16√16+500 = 100*16*4+500=6900
2 C(a) = 100a√a+500
3 The cost of producing a+1 units is C(a+1), so that theincrease in cost is C(a+1) - C(a) = 100(a+1)
√a+1+500 -
(100a√a+500) = 100[(a+1)
√a+1-a
√a]
22
Domain of a Function
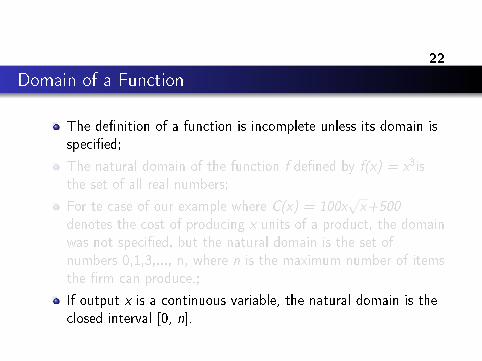
The de�nition of a function is incomplete unless its domain isspeci�ed;
The natural domain of the function f de�ned by f(x) = x3isthe set of all real numbers;
For te case of our example where C(x) = 100x√x+500
denotes the cost of producing x units of a product, the domainwas not speci�ed, but the natural domain is the set ofnumbers 0,1,3,..., n, where n is the maximum number of itemsthe �rm can produce.;
If output x is a continuous variable, the natural domain is theclosed interval [0, n].

23
Domain of a Function
The de�nition of a function is incomplete unless its domain isspeci�ed;
The natural domain of the function f de�ned by f(x) = x3isthe set of all real numbers;
For te case of our example where C(x) = 100x√x+500
denotes the cost of producing x units of a product, the domainwas not speci�ed, but the natural domain is the set ofnumbers 0,1,3,..., n, where n is the maximum number of itemsthe �rm can produce.;
If output x is a continuous variable, the natural domain is theclosed interval [0, n].

24
Domain of a Function
The de�nition of a function is incomplete unless its domain isspeci�ed;
The natural domain of the function f de�ned by f(x) = x3isthe set of all real numbers;
For te case of our example where C(x) = 100x√x+500
denotes the cost of producing x units of a product, the domainwas not speci�ed, but the natural domain is the set ofnumbers 0,1,3,..., n, where n is the maximum number of itemsthe �rm can produce.;
If output x is a continuous variable, the natural domain is theclosed interval [0, n].
25
Domain of a Function, cont.
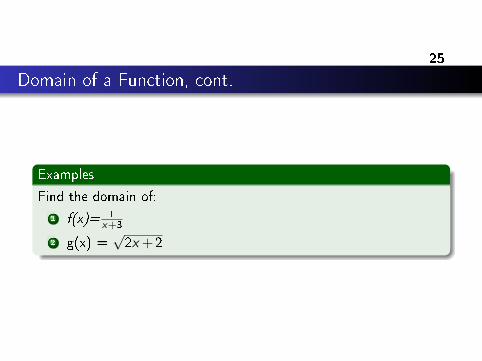
Examples
Find the domain of:
1 f(x)= 1x+3
2 g(x) =√2x+2
26
Domain of a Function, cont.
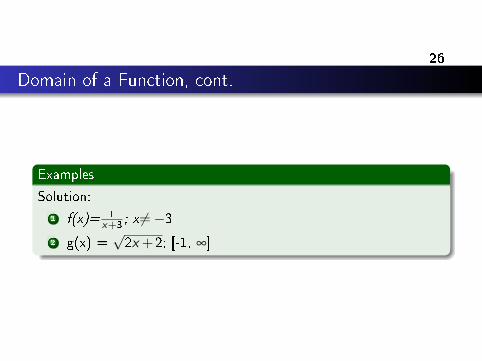
Examples
Solution:
1 f(x)= 1x+3 ; x 6=−3
2 g(x) =√2x+2; [-1, ∞]
27
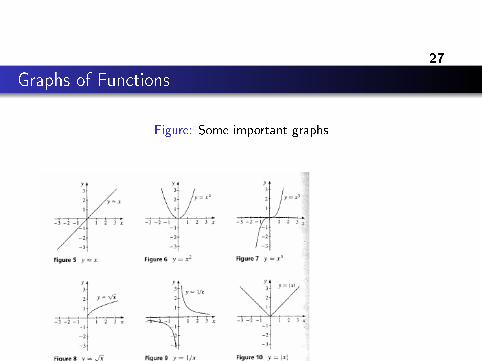
Graphs of Functions
Figure: Some important graphs

28
Graphs of Functions
Example
Consider the function f(x) = x2- 4x + 3. The values of f(x) forsome special choices of x are given in the following table.
Table: Values of f(x) = x2- 4x + 3
x 0 1 2 3 4
f(x) = x2- 4x + 3
Fill the table, then plot the points obtained from the table in axy-plane and, and then draw a smooth curve through this point.What is the name of the resulting graph?
29
Graphs of Functions
Example
Find some of the points of the graph g(x) = 2x - 1, and sketch it.
30
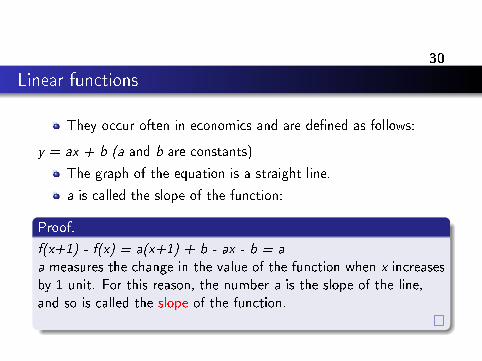
Linear functions
They occur often in economics and are de�ned as follows:
y = ax + b (a and b are constants)
The graph of the equation is a straight line.
a is called the slope of the function:
Proof.
f(x+1) - f(x) = a(x+1) + b - ax - b = aa measures the change in the value of the function when x increasesby 1 unit. For this reason, the number a is the slope of the line,and so is called the slope of the function.
31
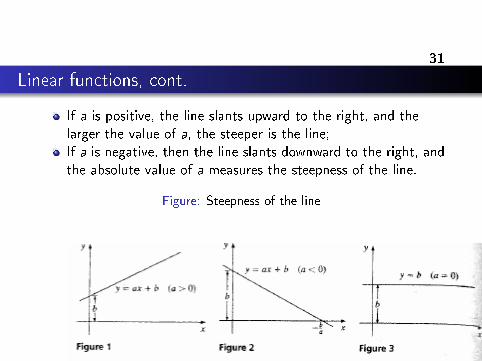
Linear functions, cont.
If a is positive, the line slants upward to the right, and thelarger the value of a, the steeper is the line;If a is negative, then the line slants downward to the right, andthe absolute value of a measures the steepness of the line.
Figure: Steepness of the line
32
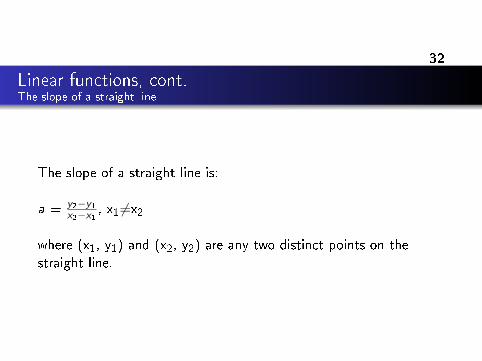
Linear functions, cont.The slope of a straight line
The slope of a straight line is:
a = y2−y1x2−x1 , x1 6=x2
where (x1, y1) and (x2, y2) are any two distinct points on thestraight line.
33
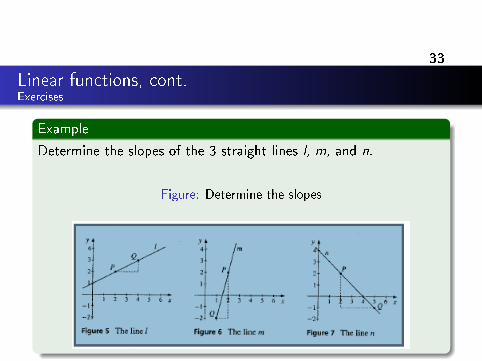
Linear functions, cont.Exercises
Example
Determine the slopes of the 3 straight lines l, m, and n.
Figure: Determine the slopes
34
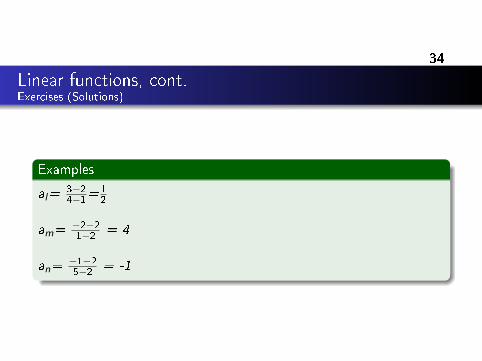
Linear functions, cont.Exercises (Solutions)
Examples
al=3−24−1=
12
am=−2−21−2 = 4
an=−1−25−2 = -1
35
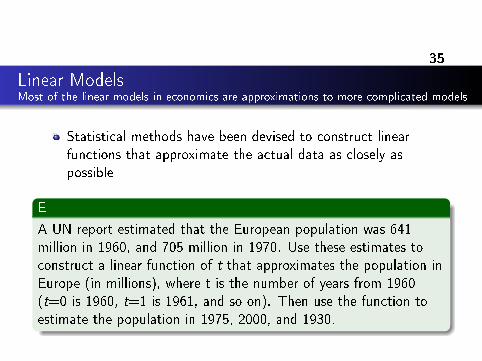
Linear ModelsMost of the linear models in economics are approximations to more complicated models
Statistical methods have been devised to construct linearfunctions that approximate the actual data as closely aspossible
E
A UN report estimated that the European population was 641million in 1960, and 705 million in 1970. Use these estimates toconstruct a linear function of t that approximates the population inEurope (in millions), where t is the number of years from 1960(t=0 is 1960, t=1 is 1961, and so on). Then use the function toestimate the population in 1975, 2000, and 1930.
36
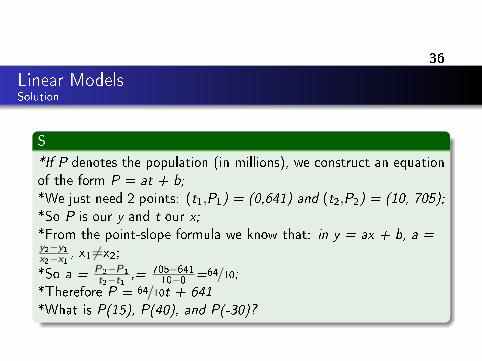
Linear ModelsSolution
S
*If P denotes the population (in millions), we construct an equationof the form P = at + b;*We just need 2 points: (t1,P1) = (0,641) and (t2,P2) = (10, 705);*So P is our y and t our x;*From the point-slope formula we know that: in y = ax + b, a =y2−y1x2−x1 , x1 6=x2;
*So a = P2−P1
t2−t1 ,= 705−64110−0 =64/10;
*Therefore P = 64/10t + 641*What is P(15), P(40), and P(-30)?
37
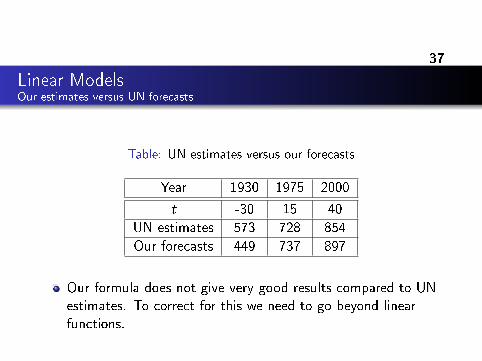
Linear ModelsOur estimates versus UN forecasts
Table: UN estimates versus our forecasts
Year 1930 1975 2000
t -30 15 40
UN estimates 573 728 854
Our forecasts 449 737 897
Our formula does not give very good results compared to UNestimates. To correct for this we need to go beyond linearfunctions.

38
Quadratic Functions
To obtain acceptable descriptions of economic phenomenaeconomists often have to use more complicated functions;
Many economic models involve functions that either decreasedown to some minimum value and the increase, or elseincrease up to some maximum value and then decrease;
These are the quadractic functions:
Example
f(x) = ax2+ bx + c (a, b, and c are constants, a6=0)
39
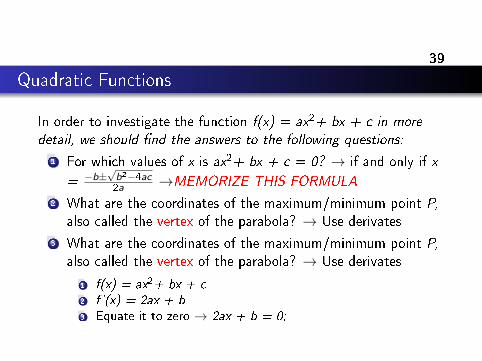
Quadratic Functions
In order to investigate the function f(x) = ax2+ bx + c in moredetail, we should �nd the answers to the following questions:
1 For which values of x is ax2+ bx + c = 0? → if and only if x
= −b±√b2−4ac2a →MEMORIZE THIS FORMULA
2 What are the coordinates of the maximum/minimum point P,also called the vertex of the parabola? → Use derivates
3 What are the coordinates of the maximum/minimum point P,also called the vertex of the parabola? → Use derivates
1 f(x) = ax2+ bx + c2 f'(x) = 2ax + b3 Equate it to zero → 2ax + b = 0;

40
Quadratic Functions, cont.
if a>0, then f(x) = ax2+ bx + c has a minimum at x = -b/2a
if a>0 f(x) has a maximum at x = -b/2a

41
Quadratic Functions, cont.Example
Example
The price P per unit obtained by a �rm in producing and selling Qunits is P = 102 - 2Q, and the cost of producing and selling Qunits is C = 2Q + 1/2Q2.(1) What is the expression of the pro�t?(2) What is the value of Q which maximizes pro�ts, and thecorresponding maximum pro�t? (Sol: 20 and 1000)

42
Quadratic Functions, cont.Exercises
Determine the zeros and maximum/minimum points:
1 x2 + 4x
2 x2 + 6x + 18
3 -3x2 + 30x - 3
4 -x2 - 200x - 30000