(3). - ircobi · particular attention was paid to dif f erences of the behavioral pattern ......
TRANSCRIPT

DIFFERENT BEHAV IORAL PATTERNS OF SEAT BELT USERS AND NON-USERS
ABSTRACT
g. V. Nielsen, E. Nordentoft, R. Weeth
Accident Analysis Group
Odense University Hospital, Odense, Denrnark
2.295 injured front seat occupants registered at the Odense University Hospital during a 4-year period have been the subject of a closer analysis in order to define possible reasons for the lacking effect of the belt mandatory introduced in 1976. Particular attention was paid to dif f erences of the behavioral pattern of seat belt users and non-users by means of age, hour and type of accident and errand. Several possible factors are discussed which might counteract the predicted eff ect of the seat belt legislation.
INTRODUCTION
In Denrnark seat belt use was made mandatory for front seat occupants in cars and delivery vans as per January lst, 1976. Several studies have been carried out to examine the effectiveness of the seat belt legislation ( 1, 2) • Recently our group published a paper on this item, showing a vanishing effect two years after the law enactment when studied epidemiologically (3). This lack of effect is found despite the fact, that road censuses in November 1977 during daylight time estimated 83% of all front seat car occupants were using seat belt. At that time 91% of the car park had belts installed •
. AIM OF PRESENT STUDY
In order to def ine possible reasons for the lacking, epidemiological effect of the seat belt law, we have analysed our material as to seat belt use by correlating to age, sex, time of accident, errand and type of counterpart. We have payed special attention to high risk groups, who do not follow the general trends, in order to be able to concen trate future preventive efforts on these groups.
1
MATERIAL AND METHODS
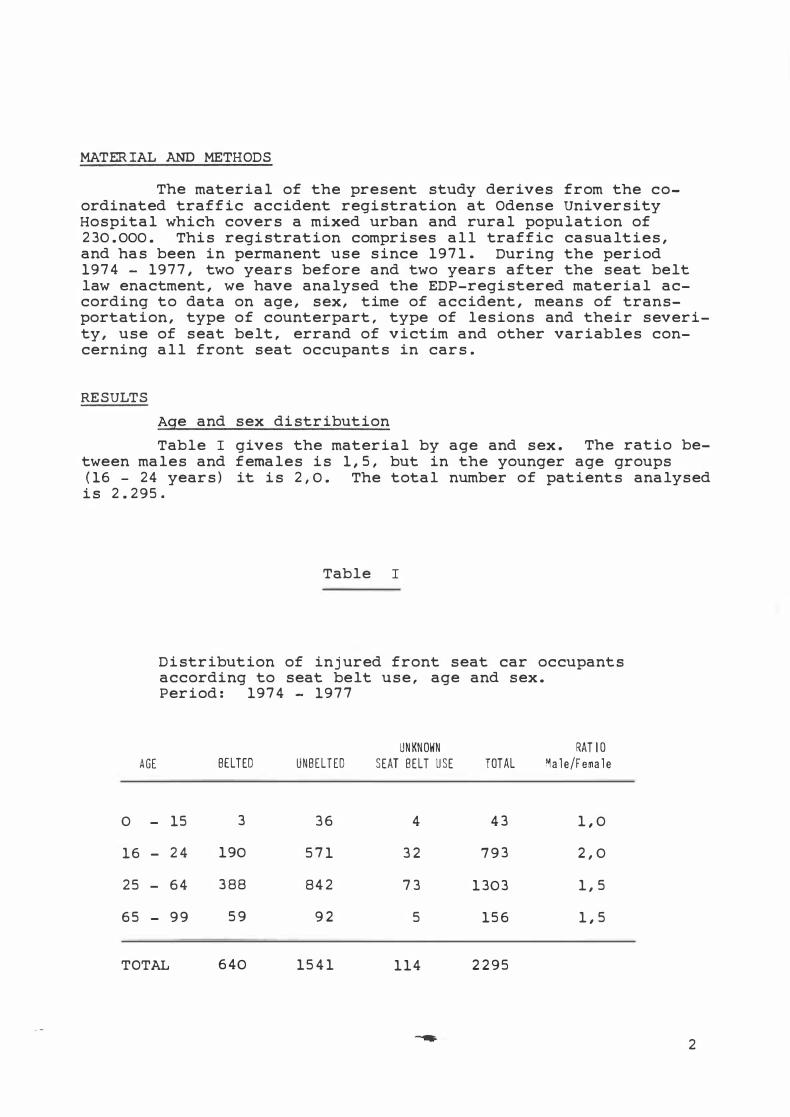
The material of the present study derives from the coordinated traff ic accident registration at Odense University Hospital which covers a mixed urban and rural population of 230.000. This registration comprises all traffic casualties, and has been in permanent use since 1971. During the period 1974 - 1977, two years before and two years after the seat belt law enactment, we have analysed the EDP-registered material according to data on age, sex, time of accident, means of transportation, type of counterpart, type of lesions and their severity, use of seat belt, errand of victim and other variables concerning all front seat occupants in cars.
RESULTS
Age and sex distribution
Table I gives the material by age and sex. The ratio between males and fernales is 1,5, but in the younger age groups (16 - 24 years) it is 2,0. The total number of patients analysed
is 2.295.
Table r
Distribution of injured front seat car occupants according to seat belt use, age and sex. Period: 1974 - 1977
AGE BEL TED UNBELTED
0 - 15 3 36
16 - 24 190 571
25 - 64 388 842
65 - 99 59 92
TOTAL 640 1541
UNKNOWN SEAT BELT USE
4
32
73
5
114
TOTAL
43
793
1303
156
2295
RAT 10 Male/Female
1,0
2,0
1,5
1,5
2

Table II illustrates the age-specif ic casualty rate both according to seat belt use bef ore and af ter legislation and according to the total material. The age group 16 - 24 years presents about a three times higher casualty rate than the average rate found in the material as a whole. This difference remains unchanged after seat belt legislation. The proportion of nonusers compared to users was very high bef ore the law enactrnent in both age groups, thus ref lecting the low rate of belt use in general traffic confirrned by road censuses. After law enactrnent the proportion of non-users is reduced, but it is still srnaller f or the younger age group.
1974 -1975
1976-1977
Casualty rates use
LU = <
0 - 15
16-24
25-99
TOTAL
0 -15
16-24
25-99
TOTAL
bef ore
= c::>
"'c-c-c-°'°' z . . c::> ....- ....--oo 1- • • < ....- ....-....J 00
ä: 0::: 0::: 0 u.J u.J Cl... Cl... Cl...
56.776
32.063
153. 391
232.230
56. 385
31.525
144. 955
232.865
and
Table II
accord ing af ter seat
(/) u.. = u.. (/) 0 u.J 0 = '-" u.J = :::i X U) u.J u.J = = 1- = ' ::c ....J ::;::: ;z: :::i u.J :::io = = """%
1 16
28 339
70 578
99 933
2 20
162 232
377 356
551 608
to age belt
� ' =
w..:::i-c::> • u.J
....J (/) = <...>:::i u.J %
= -1-::<::---' :::i u.J =o=
...... ....J a:::Z <C ::J :::;:: 1---., c::>
0 ;z: = 1- _::..:::
18
383
682
1083
25
410
777
1212
and seat belt legislation.
(/) a::: ;z: 0 <
0 u.J u.J (/) 1- >-
<...> = <...> ....J - LU u.J - u..J u..J c::: w.. 1- Q... u._ t-- CO u..J -< -< Q... u =o = uer::o u.J c::> < LU c::> (/) Q... >- 0...., Q... >- c::> = U') c::: r- >- c.n a:: ,-- 0
:::i :::i (/) u..J-,a::e::: t..-J -, c:::: c::: <..:) 2: u..J L.J..J -:...:>:z:u..Ju.J <C.-a...a.. <-a... a...
0. 2 0.4
6.0 0.4
2.2 o.2
2. 3 2. 0
0.2
6. 5 2.6
2. 7 1. 3
2. 6 1. 2
* 5.0% of victirns with unknown seat belt use
0 u.J a::: 1- < ....J u.J LU >-
<...> = -u.JZ:O:::. u... ...,._ :::> u.J -< Q... u =Cl u.J 0 (/) Cl...>- 0 = c.n a:: r- 0
:::i (/) w..JJO::O::: (..,:) z u.J u..J
<-c:i..c:i..
0. 1
5. 3
1. 9
0. 2
0. 2
3. 7
1.2
1. 3
3

TIME OF ACCIDENT
The f requency of injured persons according to time of accident before and after the legislation shows the well known distribution with well def ined peaks during morning and afternoon rush hours as seen in figure 1.
FIG. 1 DISTRIBUTION OF INJUREO FRONT SEAT OCCUPANTS ACCOROING TO
HOUR OF ACCIOENT BE FORE AND AFTER BELT LEGISlATION
PERIOD. 1974 ·75 ANO 1976 -77
number of injured • • •• before
100
75
50
2 5
6 8 1 0 12 1 4 16 1 8 2 0 2 2 2 4 2 4 6 hour of occident
A different pattern of accidents correlated to hour of day is found both according to age and to the use of belt. Among nonusers in the youngest age group (16 - 24) , 40% of all accidents occur during night time (defined as from 22 p.m. to 05 a.m.). In the older age group (25 - 99) only 18"/o of all accidents occur during night hours. This time distribution is unchanged after the seat belt legislation as shown in table III. In contrast belt users have a smaller proportion of their accidents during night time. After the law enactment 24% of the young age group and 13% of the older age group had been involved in night accidents.
4

1974-
1975
1976-
1977
Table III
Distribution of injured front seat occupants according to seat belt use, age and time of accident bef ore and after seat belt legislation.
GE LT ED N 0 N - B E L T E D PERCENT OF PERCENT OF
BEL TED tJON-BEL TED
VICTIMS VICTIMS
AGE M IGHT TOTAL M IGHT TOTAL AT N IGHT AT NIGHT
16-24 7 28 130 339 25 38
25-99 7 70 101 578 10 18
16-24 38 162 94 232 24 41
25-99 48 377 64 356 13 18
PURPOSE OF R IDE
Figure 2 demonstrates seat belt use according to purpose of ride. The high proportion (78%) of leisure driving is seen both in the belted and in the unbelted group. In spite of the pronounced increase in accident frequency during morning and afternoon rush hours, only 15% of all victims were involved in accidents on their way to and from or during work. That is, even rush hour accidents most often occur at leisure driving and not while commuting.
In f igure 3 the same material is divided into age groups. The proportion of leisure driving in opposition to other errands is slightly higher in the younger age group.
5

FIG. 2
DISTRIB UTION OF INJURED FRONTSEAT OCCUPANTS ACCORDING
TO SEAT BELT USEAGE AND ER�AND. PERIOD: 1974·1977
BELT USERS
NON USERS
F IG. 3
DISTRIB U TION OF INJUREO fRONTSEAT OCCUP ANTS ACCORDING T O
ERRAND AND AGE
Totol number - 2295 In• "3 victims • 16 years of age 1
AGE, 16-24 yeors n • 796
82" WORK 12"
WORK 18" 72"
n - l" 5 6 OTHERS 10" AGL 2 5 -99 years
6

TYPE OF ACCIDENT WITH SPECIAL R EGARD TO SINGLE ACCIDENTS
Drivers involved in single accidents are often assurned to be composed of a special risk-taking group (with particular high occurrence of alcohol intoxication, little driving experience etc. )
Table IV shows the distribution of the whole material according to counterpart and age. The young age group ( 16 - 24) is involved in 50% of the single accidents, but only in 28% of all other collision situations.
Table IV
Distribution of injured front seat occupants according to type of accident and age. Period: 1974 - 1977
Type of counterpart 0 - 14 16 - 24 25 - 99 TOTAL
Single 9 373 373 755
(49.4%) (49.4%) ( 100%)
Others 34 420 1086 1540
(27. 3%) (70.5%) ( 100%)
TOTAL 43 793 1459 2295
There are several indications pointing towards the younger age groups as high risk groups in traffic accidents. The younger age group is therefore analysed with special regard to the drivers behavior according to seat belt use, driving habits and accident proneness. When involved in single accidents the age group reveals a high proportion of non-users (80%) compared to 74% in the older ages as it appears in table V.
7

Table V
Distribution of drivers involved in single accidents accordina to seat belt use and age. Period:· 1974 - 1977.
BELT USE
Single accident Belt used
Single accident Belt not used
TOTAL
Percent of non-users
A G E 16-24 25-99
7 1 9 1
282 262
353 353
79,8 74,2
TOTAL
162
544
706
In the younger group 80% were leisure driving when involved in single accidents, against 68% in the older age group as it appears in table VI.
Table VI
Drivers involved in single acc ;dents according to age and errand.
Q.. Q.. """ ::::> ::::>
c Cl Cl
"' -' . 0:: 0:: ...... <.:> <.:>
:z: < ,_ 0:: <.:> ,_ <.:> ...... -' :s: :z: :::> :z: u.J % "' :z: ..... 0:: �V? - c.!J t...&....I :::.:::-� ::::> Cl Cl 0:: ,_
c....:>-::>< w 0:: > < (/') :..:: Cl :z: ...... 0:: :::c: :..:: :::c: Cl 0:: ...... - 0:: Cl -
...... Cl <...; ;z: - \.4J _.J c:: z i.....J:SO::Z Q.. "' o- Q.. „ o-
AGE -' :s: (/') :::>Cl -
16 - 24 202 27 2 2 1 252 80 1 1
25.- 99 202 59 34 295 68 20
TOTAL 404 86 2 55 547
Percent 74 16 10 100
8

In regard to seat belt use in the category of leisure driving according to age, an equal distribution of non-users in the two age groups is found. 4/5 of both elderly and younger drivers did not wear seat belts when involved in single accidents during leisure time driving as shown in table VII.
Table VII
Drivers involved in s ingle accidents according to age, errand and seat belt use.
L E I S U R E w 0 R K
16-24 25-99 TOTAL 16-24 25-99 TOTAL
Seat belt used 41 47 89 17 17 34
Seat belt not used 150 150 300 15 39 54
TOTAL 191 197 389 32 56 88
37 victirns are recorded, where seat belt use is unknown.
9

Figure 4 shows the hour of single accident for drivers in the age groups 16 - 24 and 25 - 99 years during the entire period 1974 - 1977. A pronounced peak of accident frequencies at night (22 p.rn. - 04 a.rn.) is dernonstrated for the younger group, where
as the older group shows a rnore even time distribution. The material after the belt legislation is still too srnall to analyse whether this behavioral pattern has changed.
FIG. A
OIST Rl8UTION OF INJURED DRIVERS INVOLVEO IN SINGLE ACCIDENTS
ACCOROING TO AGE ANO HOUR OF ACCIOENT PERIOO 197A - 1977
number of injured 4 0 driven
30
20
10
DISCUSSION
o-o oge 16-24yeors n-252 1n-35ol8yeors old)
6 8 1 0 1 2 1 A 16 18 2 0 2 2 2 4 2 A 6 h OUI 0 f accidenl
The biornechanical eff ect of the seat belt in laboratory conditions is well established. However, it has not been possible for us to show the expected effect of the seat belt rnandatory through epiderniological investigations in spite of the rising belt wearing rate according to daylight censuses. This indicates, that there are factors counteracting the predicted effects.
10

The following factors might be suggested:
a) Changes in catchment area or lowering of uptake criterias (increased liability to seek medical attendance at hospital).
b) overestimation of belt use.
c) Rise in traffic work.
a) We know from previous investigations, that our casualty department is treating more than 95% of all casualties in the area. The uptake area of the hospital has not changed in the past few years. Our registration procedures have not been altered, but we may have been more liable to keep belt users under observation as in-patients due to the special attention we payed to the possibility of belt induced lesions after the seat belt legislation. However, there were few such cases.
b) It is our impression, that some victims when asked, are not honest as to their informations regarding seat belt use at the time of accident. It is very unlikely, that roadside censuses .. of seat belt use in daylight ref lect beltwearing habits in actual collision situations especially in single accidents. In our material the rate of belt use by drivers who had been involved in single accidents is only about 50% in both the younger and older age groups as opposed to 80% found in roadside censuses.
c) Unfortunately we lack information about the work in real traff ic, and we know nothing about the various age groups represented in real traffic. Without this kind of information we are not able to estimate the activity risk of the various groups •
. Data on fuel consumption, traf f ic censuses and registration of new cars do not indicate any notable increase, which might explain the lacking effect of the law. The young age group does have three times higher casualty rate than the older group, and this holds true both before and after seat belt legislation. In the younger age group a high proportion of non-belted victims is found compared to the older age group, but there is no difference in the rate of seat belt use between the two age groups when involved in single accidents during leisure time.
The frequency of single accidents compared to all other types of counterparts show a small decline after the seat belt legislation, and equal proportions of younger and older people are involved in this type of accident. So, a higher proportion of this type of risk takers is not found after the law enactment.
Other indicators, usually used to estimate the traff ic work, such as speed measurements (4) , material damage only accidents and the number of new licenses issued do not indicate any increase which might explain the lacking effect of the law.
11

CONCLUSION
The three-point seat belt is known to give good protection under laboratory conditions in frontal and roll over collision situations. However, the initial effect of the seat belt legislation by means of decreasing nurnber of casualties and days of inability in our area, was lost during the second year. This might be due to a higher proportion of injuries caused by cabin intrusion than assumed. Also it could be due to non-optimal function of the belt systems as used in real traffic. Another possible reason could be an increasing proportion of risk takers among those, who are not obedient to the law, or an increase in traffic. The lacking effect however, could in this analysis not be explained neither by differences of the behavioral patterns of seat belt users and non-users, nor by alterations in traffic. The lacking effect might be due to the interaction of different counteracting f actors in real traff ic, which cannot be identif ied separately.
REFERENCES:
1. International Association For Accident and Traff ic Medicine. Proceedings of the Sixth International Conference, p. 21-141, Melbourne 1977.
2. Dalgaard, J . B. Experiences with the New Seat Belt Law on Fatal Lesions of Car Occupants in Denmark. In ibid p. 56, 1977.
3. Nordentoft, E.L., Kruse, T., Nielsen, H. V., Weeth, R. The Effect of Mandatory Seat Belt Legislation On Mortality and Morbidity in Denmark. Proceedings of the VII Conference of the American Association for Automotive Medicine. Ann Arbor 1978, in press.
4. The Danish Council for Road Safety Research. Report no. 145, October 1976.
12