gender di erences in financial advice
TRANSCRIPT

Gender Differences in Financial Advice
Tabea Bucher-Koenen, Andreas Hackethal, Johannes Koenen,
Christine Laudenbach, and Annika Webera
May 5, 2020
Abstract
Financial advisors are more likely to recommend costly products to women than to men. We use
minutes from about 27,000 advisor-client meetings plus archival data on client portfolios and show
that there are systematic differences in why men and women receive expensive fund recommenda-
tions: For men, the likelihood of risky funds being recommended is higher and these are generally
more expensive; on the other hand, within any given risk category, funds recommended to women
are more costly on average. Beyond this, men are significantly more likely to receive rebates on
funds’ upfront fees. These results can be predicted by a stylized model where advisors observe
imprecise signals of clients’ financial literacy – in this case gender – and less literate clients are
more likely to follow advice, even when it is not optimal. In line with the prediction, we show that
objectively knowledgeable clients signaling low financial aptitude reject advisor recommendations
more frequently than equally knowledgeable clients with high signals.
JEL Codes: G2, E2, D8
Keywords: credence goods, financial advice, consumer protection, financial literacy,
discrimination
aContact: ¡Tabea Bucher-Koenen, ZEW - Leibniz Centre for European Economic Research, MannheimUniversity, MEA and Netspar, [email protected]; Andreas Hackethal, Goethe University Frank-furt and SAFE, [email protected]; Christine Laudenbach, Goethe University Frankfurt,[email protected]; Johannes Koenen, ARC Econ, [email protected], An-nika Weber, Goethe University Frankfurt, [email protected]. Tabea Bucher-Koenen grate-fully acknowledges financial support from Netspar. The authors greatly benefitted from discussions withRenee Adams, Rob Alessie, Tobias Berg, Axel Borsch-Supan, Riccardo Calcagno, Andreas Fuster, DimitrisGeorgarakos, Tobias Gesche, Michael Haliassos, Mike Hurd, Roman Inderst, Daniel Krahmer, AnnamariaLusardi, Steffen Meyer, Markus Noth, Frank Rosar, Oliver Spalt, Konrad Stahl, Thomas Post, Melissa Prado,Maarten Van Rooij, Matthias Weiss, and Joachim Winter. We are very grateful to seminar participants inMannheim, Bonn, Lyon, Hamburg, Frankfurt, and Regensburg, at the Swiss Finance Conference and theShowcasing Women in Finance Workshop, Luxembourg 2019.

1 Introduction
If Mr. and Mrs. Smith need to have their car serviced, which one of them should take it to
the garage? Even if the two were equally clueless (or expert) with respect to car maintenance,
common wisdom points toward Mr. Smith. If the population contains many more incompetent
female than male garage visitors, then any mechanic will be more inclined to sell or charge for
redundant services to Mrs. Smith than to Mr. Smith, because a priori the likelihood that Mrs.
Smith will notice such malfeasance is lower. An interesting implication of this is that female car
experts should be substantially more likely to experience, detect and ultimately reject poor service
than equally knowledgeable men.1
We apply this logic to another important context: Financial advice. The objective is to doc-
ument the differences in financial product advice across client’ genders and to understand which
mechanisms can explain observed differences in treatment of men and women by financial advisors.
We use administrative data of a large German bank on advisor-client interactions. This data
set contains advisor recommendations from around 27,000 advisory meetings that took place be-
tween 2009 and 2017. In a first step we document differences for male and female clients in the
type, risk and fees of the recommended products. We find that women receive significantly fewer
recommendations to invest in pure equity funds, and lower equity shares in their investment are
recommended. This effect is present despite controlling for differences in individual risk preferences.
Second, the bank’s own balanced funds are more likely to be suggested to women than to men.
Third, advisors recommend funds with higher management fees (within given fund risk categories)
to women. This effect is explained in part by the fact that the bank’s own balanced funds are more
expensive compared to funds with the same risk level. Finally, women are significantly less likely
to receive rebates on the upfront load of any given product. While the more frequent recommen-
dations for the (expensive) bank own funds could be related to a hypothetical higher willingness to
pay for delegating the investment decision, this argument does not explain why women less often
receive discretionary rebates on the upfront fees charged upon purchase of a fund, i.e., pay more
for given funds.
A mechanism that could explain the observed differences in the financial advice by gender, is
related to the fact that financial advice is a prototypical credence good (see Dulleck and Ker-
schbamer (2006) and Kerschbamer and Sutter (2017) for reviews), where knowledgeable clients are
more able to assess service quality, even ex post. Advisors incentivized by sales commissions and
kickbacks might attempt to sell costly or unsuitable products to clients who appear or seem clueless
(e.g., Chen and Gesche, 2018; Inderst and Ottaviani, 2012a; Stoughton, Wu, and Zechner, 2011;
Mehran and Stulz, 2007). Since actual financial aptitude might be hard to observe for advisors,
they might use easily observable proxies for client’s financial aptitude to tailor advice. Various
studies show that financial literacy of women is on average significantly lower than that of men,
1In a study on car repairs Busse, Israeli, and Zettelmeyer (2017) show that women who signal moreknowledge of the market price are in fact offered better prices for the same service compared to women whodo not signal this knowledge. This effect was not detected for men.
1

even after controlling for factors such as education, age, and income (e.g., Lusardi and Mitchell,
2011; Bucher-Koenen, Lusardi, Alessie, and van Rooij, 2016). Inferring from population averages
and own experiences, therefore, advisors may have an incentive to treat female clients differently
than males. In order to understand the empirical findings better, we set up a simple yet general
analytical framework for advisor interactions with clients who differ according to their financial
aptitude. We start from the assumption that knowledgeable clients possess better do-it-yourself
outside options when choosing investment products than their less knowledgeable peers. This char-
acteristic gives advisors interested in client relationships a (financial) incentive to provide higher
quality advice to knowledgeable clients. If advisors cannot observe true client skills, but only a
noisy signal that is on average informative, then clients who appear to be knowledgeable (here:
men) will receive better advice, while clients who appear to be less knowledgeable (here: women)
will receive worse advice (mis-selling hypothesis). Since the signal is imprecise, some clients will ap-
pear less financially literate, but are actually capable. These clients will receive low-quality advice,
will notice the poor quality, and will reject it (the rejection hypothesis). In our context this means
that women with high financial literacy skills should be more likely to reject financial advisors’
recommendations.
We find empirical support for the mis-selling hypothesis in our data as reported above. However,
going one step further we can also test the rejection hypothesis. Specifically in the bank data,
we observe the objective, test-based financial literacy for a subset of clients who participated in
a survey. We can confirm that women with higher financial literacy are more likely to reject
advisor recommendations. In addition, we make use of an alternative data set, namely the SAVE
household panel, where we observe test-based financial literacy and a self-reported measure of
clients’ adherence to financial advice. Our results from the survey data are also consistent with
the model predictions. Financially literate women are more likely to reject advice than their less
knowledgeable female fellow clients; this pattern is not observed for men.
Despite our extensive set of controls in all regressions, one could, however, argue that advisors
cater to their clients’ requests for all-in-one products, when selling the bank’s own target funds.
Women might simply be willing to pay a price premium for not having to build, and then re-
balance portfolios from multiple funds that each invest in just one asset class. High fund fees
would then not indicate poor advice or mis-selling, but would rather imply a catering effect in
line with Hackethal, Laudenbach, Meyer, and Weber (2018) and Gennaioli, Shleifer, and Vishny
(2015). We do, however, not find any evidence that women, in general, have a higher preference for
these bank-owned funds. Results are robust to the exclusion of meetings that were initiated by the
client or to product recommendations that can be traced back to a specific client idea. In addition,
women are not more likely to follow recommendations for a bank-owned fund in comparison to
alternative recommendations. From a survey of a sub-sample of clients, we find evidence that
raises the possibility that women may have slightly different motives for seeking financial advice,
which could conceivably be related to receiving recommendations of the bank’s own funds more
often. It is an open question whether they are aware of the substantially higher costs of these
2

all-in-one products compared to funds with the same risk category and similar returns. Finally,
even if these differences in motives to consult financial advisors are relevant, they do not explain
why men have a higher likelihood for receiving a rebate on the up front load for a given product.
The wider empirical literature on financial advice underlines the relevance of our results: the
majority of households rely on professional advice when investing. A survey of US retail investors
shows that 73 percent consult advisors when investing in stocks or bonds (Hung, Clancy, Dominitz,
Talley, Berrebi, and Suvankulov, 2008). Parallel results hold for Europe, where 80 percent of the
households who recently bought investment products interacted with a personal advisor and 58
percent followed the advice (Chater, Huck, and Inderst, 2010a). Moreover, in Germany between 60
percent and 80 percent of individual investors rely on professional advice when making investment
decisions (Burke and Hung, 2015; Bluethgen, Meyer, and Hackethal, 2008) and in the Netherlands
more than half of the investors with an investment portfolio rely on financial advice (Kramer,
2012). At the same time, clients seem to be unaware of advisors’ conflicts of interest. For example,
Chater, Huck, and Inderst (2010a) report that more than half of the respondents in their survey
believed that the advice they received was completely independent. On the other hand, individuals’
ability to identify and value truly independent advice in quasi-experimental settings seems doubtful:
Bhattacharya, Hackethal, Kaesler, Loos, and Meyer (2012) find that only 5 percent out of about
8,000 retail clients of an online broker solicited advertised free and unbiased advice and even fewer
followed the advice given.
Empirical investigations of who consults with an advisor reveal that mainly households with
higher levels of education, income and wealth and older, more experienced and better informed
investors consult professionals (e.g., Bi, Montalto, and Fox, 2002; Hackethal, Haliassos, and Jap-
pelli, 2012; Van Rooij, Lusardi, and Alessie, 2011; Kramer, 2012). These observations point to a
complementary relationship between financial literacy and financial advice rather than a substi-
tute relationship. Hackethal, Haliassos, and Jappelli (2012) argue that higher opportunity costs of
time lead wealthier and older clients to make use of financial planners, even though they would be
relatively better suited to perform financial planning themselves. Some recent papers theoretically
modeling financial advice have also recognized that customers might differ in terms of their levels of
financial sophistication (Gabaix and Laibson, 2006; Inderst and Ottaviani, 2012b; Georgarakos and
Inderst, 2011; Calcagno and Monticone, 2015). Within the broader literature on financial advice,
we provide further insights on the determinants of adherence to financial advice. In contrast to
Bhattacharya, Hackethal, Kaesler, Loos, and Meyer (2012) and Stolper (2018), who do not find
that women and men generally differ in their following behavior, we find evidence for a significant
interaction effect of gender and financial literacy on adherence to financial advice.
With regard to the quality of financial advice in general, some systematic issues have been uncov-
ered. Recent studies comparing do-it-yourself and advised individual investor portfolios suggest that
on average, advisors have a negative impact on portfolio performance (Hoechle, Ruenzi, Schaub,
and Schmid, 2018, 2016; Chalmers and Reuter, 2012; Hackethal, Haliassos, and Jappelli, 2012).
Egan, Matvos, and Seru (2019) document frequent misconduct among US financial advisors with
3

limited consequences for the offending advisors. However advice is also shown to improve financial
planning (Lusardi and Mitchell, 2011) and to ameliorate investment mistakes.2 In this paper, we
do not intend to evaluate the overall benefits of financial advice. Rather, we look at differences in
the advice provided to different client types, namely men and women.
Our paper is also related to recent research on discrimination in financial markets, which so far
focuses mainly on credit markets. For example, Alesina, Lotti, and Mistrulli (2013) find that com-
pared to male business owners, female business owners in Italy pay higher interest rates conditional
on risk characteristics. They also provide references to the literature on ethnic discrimination in
credit markets in the US (see Cavalluzzo and Cavalluzzo, 1998 and Blanchflower, Levine, and Zim-
merman (2003) for reviews). Egan, Matvos, and Seru (2017) document gender differences on the
supply, namely the advisor, and not on the demand side. The authors find that female compared
to male advisors are more severely charged for misconduct. To the best of our knowledge, no other
literature examines gender-based differences on the demand, namely the client side, in financial
markets.
Our findings have considerable welfare implications. We show that individuals who appear less
financially literate are more likely to receive recommendations for more expensive products from
advisors. If less skilled clients are unable to recognize poor advice, then they are likely to adhere
to it and make inferior financial decisions. We believe that the basic mechanism in our theoretical
framework, which is supported by the empirical findings, is not limited to the domain of financial
advice but applies to many credence goods (Kerschbamer and Sutter, 2017). For example, indi-
viduals who appear more intimate with the subject of cars should receive better advice from their
mechanics. Other relevant applications include taxi services (see Balafoutas, Beck, Kerschbamer,
and Sutter, 2013), health care (see e.g., Gottschalk, Mimra, and Waibel, 2018), or legal matters.
2 Data
We use data on advised investors at a large German bank operating a nationwide branch network.
Our main source of information are advisory minutes that provide great detail on the interactions
of clients with their bank financial advisors. Since January 2010, advisors are mandated by law to
documents all client advisory meetings in written form, including the motivation for and duration
of the meeting, as well as the advisor’s final product recommendations, along with a justification
for the recommendations made. Our data covers 27,617 advisory meetings between 13,723 retail
clients and 4,649 advisors. The meetings took place between January 2009 and December 2017.
We complement this rich source of information with data on clients’ security transactions and
demographic information. For a small subsample of 523 clients (1,341 product recommendations),
we observe information on test-based financial literacy and qualitative information on attitudes
2Specifically, mistakes such as under-diversification (Hoechle, Ruenzi, Schaub, and Schmid, 2016;Gaudecker, 2015), home bias (Kramer, 2012; Bluethgen, Meyer, and Hackethal, 2008), and the dispositioneffect (Hoechle, Ruenzi, Schaub, and Schmid, 2016; Shapira and Venezia, 2001).
4

towards financial advice from an online survey administered to a random sample of clients at the
bank.
In Germany, as in many other European countries such as Sweden, Italy, or France, financial
advice to retail investors is primarily provided by banks.3 Most German households make financial
decisions in cooperation with their house bank financial advisor. Figures for German households
relying on financial advice range from 60% to 80% across studies (Burke and Hung, 2015; Chater,
Huck, and Inderst, 2010b; Droesser, 2016). This marks an important difference to the US, where
advice to retail investors is often provided by independent financial advisors.
When opening an account with the bank, clients are assigned a designated advisor. In the retail
segment, the client-advisor match is based on branch location, but it is otherwise independent of
customer characteristics. Bank customers either conduct transactions unassisted or consult with
their advisor. Complete delegation of financial decisions is rare in Germany and is mostly limited
to the wealthiest customers.4 Bank customers pay for financial advice indirectly through product
fees and commissions, that are (partly) channeled to the bank.
The advisors in our sample are full-time employees of the bank who have completed a three-year
vocational training. They are paid a fixed wage in accordance with the collective wage agreement
of the banking industry. Variable components of monthly pay must not amount to more than 10
percent of total salary and are typically a function of team or branch performance, acquisition of
new client assets, and surveyed client satisfaction. While advisors are not directly compensated for
their individual sales performance, career concerns may provide indirect sales incentives (Hoechle,
Ruenzi, Schaub, and Schmid, 2018).
Clients and Advisors. All clients in our sample interact with a bank advisor at least once over
the sample period. On average, both female and male clients consult the bank for advice about
twice during our sample period. Panel A of Figure A1 in the appendix shows the distribution of
the number of meetings by client. For about one quarter of the clients we observe only one advisory
meeting in our sample period. Around 23% of the clients are observed twice, and about half of the
sample is observed more than three times within the sample period. Panel B of Figure A1 shows
the distribution of protocols over calendar months. The figure reveals that that there are seasonal
patterns in the distribution of advisory meetings, which we will account for in our analyses by
controlling for time fixed effects.
Summary statistics on the overall sample as well as split by gender are reported in Table 1. In
Panel A we show statistics at the client level, in Panel B we report statistics at the recommendation
level. Slightly less than half (45 percent) of the clients in the sample are female. The median client
is 65 years old or older. Clients in our sample are on average risk-averse, with the majority willing to
take only moderate financial risk (53% are in the second - ”low” category on a 1-4 scale). In line with
3With a high importance of independent financial advisors, the United Kingdom is an exception amongEuropean countries.
4As a bank’s financial advice provided to retail clients is likely to differ from financial advice in the wealthmanagement and business client segments, we exclude wealth management clients with portfolio holdings ofat least e500,000 and business clients from our analyses.
5

the literature, male clients show a higher risk tolerance (49% are in the top two risk categories)
compared to female clients (42% in the top risk categories). The median portfolio value in our
sample is around EUR 40,000 (mean: EUR 62,000), compared to the median portfolio value held
by Germany households conditional on capital market participation which is EUR 16,600 (mean:
EUR 54,200) (Deutsche Bundesbank, 2016). On average 75 percent of the assets are invested in
mutual funds.
The majority of client-advisory meetings takes place in person (86 percent for female, 83 percent
for male clients), in only a small fraction of cases advice is received over the phone. The majority
of interviews takes 30 minutes or longer (see Panel B in Table 1).
Overall we observe recommendations by 4,649 different advisors, who are approximately balanced
by gender (48 percent are male). However, there is wide variation in the number of observations
per advisor. This is due to the fact that our sample is a random draw across bank clients, rather
than advisors.5 Among those clients for whom we observe more than one interview, 20 percent
of the meetings after the first are with a new advisor. Advisor changes in the retail segment are
not uncommon and are mostly driven by fluctuations in the career position or the location of bank
employees.
Product Recommendations As a result of regulatory tightening and ensuing compliance con-
cerns, large banks have standardized their financial advice, especially in the retail client segment.
Advisors at the bank are supposed to pick recommendations from a pre-selected list of actively
managed mutual funds, covering different asset classes and risk categories. Individual stocks, indi-
viduals bonds, certificates, index funds, or exchange traded funds (ETFs) can also be recommended
and discussed with the clients. While in principle the bank maintains an open fund architecture,
which means that advisors have a bank’s own funds as well as outside options in their menu, the
banks’ own fund products figure prominently on the product menu. As a result of standardization,
the 10 products that are recommended most often account for 40% of all purchase recommendations
in our sample (see Figure A2 in the appendix). All of these top 10 products are actively managed
mutual funds, 7 of which are bank-own products. Overall the bank’s own balanced fund products
also account for the lion’s share of fund recommendations to retail clients. These products are
multi-asset funds that invest both in stocks and funds with different allocations and are designed
to provide an all-in-one portfolio solution to retail clients.6
Panel A of Figure 1 shows the distribution of recommendations across product types by gender.
It closely mirrors the precepts of the bank’s standardized advisory approach. Overall, funds are
the most recommended product category to both male and female clients. However, female clients
receive recommendations for funds more frequently than men (67% for female versus 64% for male
5We observe exactly one meeting for 27 percent of advisors, for 30 percent of the advisors we observemore than five meetings.
6We exclude recommendations for a topic specific in-house fund from our data. The distribution of thisfund was accompanied by comprehensive marketing campaigns, which we cannot control for. Results arerobust to the inclusion of these recommendations and, importantly, the share of recommendations for thisfund does not significantly differ between male and female clients.
6

clients). The frequency of single bond recommendations is comparable (11% for female versus 10%
for male clients). Single stocks are rarely recommended, and if so, they are more often recommended
to male than to female clients (4% versus 2% of all recommendations in our sample). Given their
predominance, the main focus of our analyses is on recommendations to invest in mutual funds.
Quality of recommendations – risk and costs. We consider two aspects of the quality of
advisor recommendations, (1) risk adequacy and (2) fees. The Markets in Financial Instruments
Directive (MiFID) of the European Parliament and the European Council (2004 and 2006) stresses
risk adequacy, requiring investment recommendations to match investor risk preferences.7
Mullainathan, Noeth, and Schoar (2012) consider retail financial advice as high quality if it
provides the clients with a broadly diversified, but low-cost portfolio. We therefore assess the fees
of the fund recommendations as a second criterion. Fees for mutual fund purchases typically have
two components: initial up-front fees (loads) paid upon purchase of a mutual fund and recurring
fees summarized by the Total Expense Ratio (TER) which are paid annually in proportion to the
amount invested. Upfront fees paid upon fund purchase are directly collected by the bank. In
case of bank-own funds, a significant fraction of recurring fees accrues to the bank, as well.8 As
opposed to returns, which at least in part result from luck, fund fees can directly be influenced by
the advisor. 9 Funds differ considerably with regard to their total expense ratios (TER).
While a fund’s TER applies equally to all investors, upfront loads paid upon purchase can be
adjusted to the individual client. In particular, advisors can offer discretionary rebates (up to
100 percent) on the upfront charge. From the advisory minutes, we observe whether the advisor
granted a partial or full rebate on the upfront load of a recommended fund. About 24% of all fund
recommendations come with a rebate on the up front load (see Panel B in 1). Panel A of Figure 4
shows that there is considerable variation at the level of individual funds with regard to whether a
rebate was granted to clients or not. For the graph, we consider only funds that are recommended
for at least 50 times. The graph shows, that the granting of rebates is not a feature for specific
funds. There are no funds for which a rebate is always granted, about 18% of the recommended
funds never come with a rebate. Slightly more than 30% of the recommended funds are offered
with a rebate on the upfront load in about 30% of the cases.
Adherence to advisor recommendations As an outcome of the advisory meeting, we can
observe if recommendations are implemented afterwards by the client. We define a recommendation
as implemented, if the client buys the recommended security within 30 days after the meeting.
Overall, 62% of all recommendations are followed by the clients within 30 days (see Panel B in 1).
7Investment firms are required to obtain ‘information as is necessary for the firm to understand theessential facts about the customer” (Article 35, 1) and to elicit the customerOCOs ‘preferences regardingrisk taking, his risk profile, and the purpose of the investment” (Article 35, 4).
8(Hoechle, Ruenzi, Schaub, and Schmid, 2018) study a comparable bank setting in Switzerland and showthat trades in bank-own mutual funds are the most profitable for the bank in the context of retail financialadvice.
9Grinblatt, Ikaheimo, Keloharju, and Knupfer (2016) argue that variations in risk-adjusted returns onmutual fund portfolios result largely from differences in fees.
7

3 Gender Differences in Product Recommendations and
Fees
Our aim is to understand whether male and female clients receive different product recommen-
dations from financial advisors. We will first look at gender differences in the type and risk level
of the funds advisors recommend. In a second step, we analyse differences in fund fees.
3.1 Fund type and risk level
Panel B of Figure 1 presents the distribution of fund recommendations by fund type and gender.
Most apparently, female clients are significantly more likely to get recommendations for one of the
bank’s own balanced funds (71% for female versus 60% for male clients) that come at different
asset allocations. Balanced funds which are not under the bank’s own management are slightly
more often recommended to men (6% to men vs. 4% to women). Male clients are also significantly
more likely to get recommendations for pure equity funds (22% for male versus 14% for female
clients). Bond funds are recommended with similar probability (6% for female versus 5% for male
clients). The overall pattern in advisors’ fund recommendations is in line with the general finding
that women on average are less risk-tolerant compared to men.
Differences in the riskiness of recommended products are also apparent from Panel A of Figure
2. According to the European Market in Financial Instruments Directive (MiFID), all funds are
classified into seven risk classes according to the average volatility over the last five years. Funds
in category 1 exhibit the lowest risk levels, category 7 implies high risks. The figure shows the
distribution of fund recommendations over the seven fund risk categories by gender. In line with
a lower average risk-tolerance observed in women, the distribution of recommendations for female
clients has more mass on lower risk categories. Next, we analyze what drives the risk level of funds
recommended in a multi-variate regression framework.
Empirical specification. We measure the riskiness of a fund being recommended using three
alternative variables. First, equity is a dummy equal to one if a recommended fund is a pure equity
fund. This applies to 18 percent of all fund recommendations. Second, equity share is the share
of equity in a fund’s holdings. The equity share varies between 0 percent (e.g., bond funds) and
100 percent (stock funds). Equity shares of balanced funds take intermediate values, depending on
their investment strategy.10 The average equity share over all fund recommendations is 48 percent.
Third, we use the fund risk category. The average fund recommended falls into category 4.
We Would like to understand whether advisors recommend different funds to women as compared
to men controlling for client risk preferences and a broad set of other factors. We run linear
regressions using the three measures of fund risk as the dependent variable. The unit of observation
is a single recommendation provided during one of client i’s advisory meetings. Since a client can
be involved in multiple meetings, we introduce the subscript j to designate meetings. We estimate
10Equity allocations of funds are taken from the Morning star data base.
8

linear regression models of the form:
yij = β0 + β1femalei + β2characteristicsi + β3meetingij + µttime+ µaadvisorij + εij (1)
The dependent variable y is one of our three risk measures for the recommended fund. The
variable female is an indicator equal to one if the client is female, zero otherwise. characteristicsi
captures the client’s personal and financial characteristics, in particular personal risk tolerance
(on a 1-4 scale), log financial wealth with the bank, dummies for age groups, and occupational
and educational status (employed, manager, and academic (PhD)). We also include variables to
control for the circumstances of the meeting (meetingij). These are indicators for whether advice
was received in person rather than over the phone and whether the meeting took longer than 30
minutes. We also control for the length of the relationship the client has with the bank in years.
All regressions include year-times-month fixed effects. Following Foerster, Linnainmaa, Melzer,
and Previtero (2017), we also include advisor fixed effects µa to control for advisor heterogeneity.
Standard errors are clustered at the client level.
Results. The results in Table 2 show that, controlling for client’s risk tolerance and a large set
of control variables, women are on average 2pp less likely to receive an equity fund recommenda-
tion (Column 1). Compared to an average of 18% equity fund recommendations this translates
into an 11% lower likelihood to receive an equity fund recommendation for women. The equity
share of the recommended fund is on average 1,69 pp lower, corresponding to a 3.5% lower equity
allocation based on the same risk preferences and other characteristics (Column 2). Moreover, the
recommended funds’ risk categories are significantly lower for women (Column 3), which is in line
with the graphical results from figure 2. In Columns (4) and (5), we show that results for equity
share (Col 4) and risk category (Col 5) hold, when we restrict our analyses to fund recommenda-
tions that contain at least a minimal equity share (excluding bond and money market funds). The
results even become slightly stronger without the low-risk-funds. The final analysis regarding the
recommended product type is reported in Column (6). Here the dependent variable is a dummy
indicating a recommendation for one of the bank’s own balanced funds. We find that women are 3
pp more likely to receive a recommendation for one of the bank’s own products compared to men
(an increase of 4.6% relative to the average share of recommendations of bank own products of
around 65%).
Overall, these results show that, even taking into account and controlling for client risk preferences
as measured by the advisor during the meeting, advisors tend to recommend less risky products to
female clients. This could be related to the fact that the bank’s own risk assessment on a 4-point
scale does not entirely reflect clients’ risk preferences and further information on risk preference
is communicated during the meeting. For a subsample of client’s we have a self-assessed survey
measure of risk preferences on a 7-point scale. However, when we include this measure instead of
the risk measure reported in the protocol our findings remain unchanged.
9

3.2 Product Fees
In the next set of analyses we look at differences in product fees. A mere comparison of average
total expense ratios (TER) of the funds recommended to male and female clients seems to suggest
that there are no gender-specific differences in average fund fees paid. For male clients the average
TER is 1.91 percentage points, for female clients it is 1.90. Generally, total expenses are higher for
more risky funds (Gennaioli, Shleifer, and Vishny, 2015), and they increase in the level of active
management (Linnainmaa, Melzer, and Previtero, 2018). Given this evidence, the finding that fund
fees do not differ by gender is rather surprising, since we just showed that funds recommended to
male clients exhibit higher risk levels. Panel B of Figure 2 shows the relationship between total
expense ratios and fund risk; higher risk comes at higher cost, but the fees for pure equity funds are
on average lower compared to actively managed balanced funds with a high equity share. There
is also substantial variation in the total expense ratios within risk categories. In the lowest risk
category, we observe a difference of 97 basis points between funds with the lowest fees and those
with the highest fees. In the highest risk category this difference is 187 basis points.
Therefore, we compare the management fees conditional on the recommended fund’s risk in a
next step. For this purpose, we follow a similar strategy as Linnainmaa, Melzer, and Previtero
(2018) and use a management fee rank approach. In particular, within each fund risk category
(from 1 to 7), we sort funds into quintiles according to their total expense ratios charged. This
means that within each risk category we measure the 20% cheapest (lowest quintile) up to the 20%
most expensive (highest quintile) products. According to this metric, the average management fee
quintile of the recommended products in our sample is 3.87; 44% of all fund recommendations fall
into the highest quintile. Figure 3 shows the distribution of fund recommendations for male and
female clients over the fee quintiles: for women there is more mass in the higher quintiles (category
4 and 5). This means, that female clients receive more expensive recommendations within a given
risk category. We examine the relationship between gender and the fund’s fee quintile more closely
in a multivariate framework.
Empirical Specification. We use an OLS regression model of the form:
yij = β0 + β1femalei + β2characteristicsi + β3meetingij + µttime+ µaadvisorj + εij (2)
The dependent variable y is the management fee quintile of the fund recommended to client i during
the meeting j. Our main independent variable, female, and the other control variables are the
same as in the previous regressions. Most importantly we include month-times-year and advisor
fixed effects.
Results. Column (1) of Table 3 reports a regression controlling only for gender, advisor, and
time fixed effects. We find that advisors recommend more expensive funds to women using the fee
quintile within a risk category as a dependent variable. Results get weaker, but stay significantly
10
positive if we include further controls in Column (2). What explains the differences in management
fees, that go beyond differences in the funds’ riskiness? From the descriptive results in Panel B of
Figure 1 and Table 2, we know that women are more likely to receive recommendations for balanced
funds, and especially for the bank’s own balanced funds. These bank owned funds have a high degree
of active management, and tend to charge higher fees compared to other funds in the same risk
category. In Panel B of Figure 3) we show the average TER by fund risk category and differentiate
between external funds on the left and fund’s under the banks’ own management on the right.
In each risk category the bank managed funds are more expensive than comparable funds. If we
control for a recommendation being for one of the bank’s own balanced funds in our fee regression
in Column (3), the female indicator turns significantly negative. This implies, that women receive
more expensive product recommendations than men, because they receive recommendations for the
banks’ own managed funds, which carry particularly high product fees.
In addition to the management fees funds carry sales fees—the so called upfront load. Upfront
loads are one-time costs to the investor, charged upon purchase of the fund. As opposed to the
fund’s TER, reductions on the upfront load can be granted at the discretion of the advisor. This
fact is neither advertised nor typically known by clients. Studying these rebates, we are able to see
whether the costs for the very same financial product suggested by advisors differ by the gender
of the client. Note that we observe rebates only for recommendations that were actually executed.
Roughly one quarter of all fund purchases in our sample come with a rebate on the upfront load.
We show differences in the share of fund purchases, which are associated with a rebate by fund risk
category and gender in Figure 4 Panel B. The comparison reveals that the share of purchases with
a rebate on the load is larger for male clients across all fund risk categories. Next, we examine this
in a multivariate regression framework.
Empirical Strategy. The dependent variable of our regressions is an indicator equal to one if
the client has received a rebate on the mutual fund load. In order to test whether female clients
face higher costs than men for the same financial products we include fund fixed effects (ISIN fixed
effects) into the regression. Otherwise, the structure of the model is unchanged from the previous
set of regressions.
Results. Results in Table 4 reveal that female clients are significantly less likely to receive a
rebate when they purchase funds. The difference of 2 percentage points translates into a 8.3% lower
probability for female clients to get a rebate on a fund load compared to men. Since rebates matter
more for short term investments, we control for the investment horizon in Column (2) and the
results stay the same. In Column (3) we include all other control variables and in Column (4), we
restrict the sample to funds (ISIN codes) that are recommended at least 50 times. Again, results
are stable. For a last test, we exclude bank-owned funds from the regression to show that results
are not driven by the fact that the bank-owned funds might come with different rebates compared
to other funds. The effect remains in the same order of magnitude and highly significant. Note that
in all regressions the differences between men and women are only identified through differences in
fees paid on the same product offered by the same advisor to different clients. Female clients are
11

in fact significantly less likely to receive a rebate on the fund load for any given product. Clearly,
this finding cannot be explained by preferences for certain kinds of products.
To summarize, we find first that women receive significantly fewer recommendations to invest
in pure equity funds and are recommended lower equity shares in their investment. This effect
is present despite controlling for differences in individual risk preferences. Second, women receive
more recommendations for the bank’s own balanced funds. Third, advisors recommend funds with
higher management fees within the same fund risk category to women. This effect is mostly due
to the fact that the bank’s own balanced funds are more expensive compared to funds with the
same risk level. Finally, women are significantly less likely to receive rebates on the upfront load of
any given product. While the more frequent recommendations for the (expensive) bank own funds
could be related to a hypothetical higher willingness to pay for delegating the investment decision,
this argument does not explain why women less often receive discretionary rebates on the upfront
fees charged upon purchase of a fund. In the next section we will propose a potential mechanism
for the findings reported.
4 What explains differences in product recommenda-
tions and costs?
4.1 Gender as a signal for financial literacy?
The central question therefore is: Why do advisors treat women differently than men? In the
previous section we showed that the results do not seem to be driven by gender differences in risk
preferences, they are also not driven by differences in the wealth held at the bank or the value of the
recommendations. However, a fact that has widely been documented in the literature is that women
on average have lower levels of financial literacy than men (for a review, see Bucher-Koenen, Lusardi,
Alessie, and van Rooij (2016)). This matters in our context, because higher financial literacy is
associated with significantly better financial decision making skills (for a review, see Lusardi and
Mitchell (2014)).
In this section we set up a simple theoretical model which relates financial advice to clients’
gender and financial literacy and we derive some predictions regarding the financial advice given
to women and men. The predictions of the model are closely related to our empirical analysis. As
is typically assumed in the recent advice literature, the advisor in our model benefits in some way
if the client picks from a certain subset of alternatives – this may be due to kickbacks or due to
greater familiarity with certain options, which therefore require less research and effort on the part
of the advisor. The advisor therefore prefers to suggest options from this subset to his client, all
else given. We add an additional model ingredient to this, in that the advisor is uncertain with
regard to the client’s aptitude.
Why is aptitude important? Higher financial literacy of clients implies that they have a better
understanding of financial matters and are able to make better decisions on their own and reject
12

advice once their outside option grants higher utility. The advisor tries to infer the client’s financial
literacy from observable traits, because this knowledge helps him to optimally tailor his advice: less
informed clients are less likely to recognize more costly or bad advice (which may be particularly
lucrative to the advisor, as in the case of kickbacks for a product sold by the advisor’s firm).
On the other hand, better informed clients are more likely to recognize and reject bad advice.
The advisor therefore has an incentive to suggest better options to clients with higher signals of
financial literacy. Assuming that advisors use gender as a signal of financial literacy and putting
these arguments together, clients signalling low literacy (women) but who are in fact well informed
should be substantially more likely to reject advice they have received, since they (a) receive and
(b) recognize bad advice with a substantially higher probability. Next, we formally derive these
relationships and in the following subsection we will empirically examine the additional hypotheses
derived from the model.
General Setup. Consider a setting with two rational agents, a client and a financial advisor.
The client faces the task of choosing a product (e.g., an investment fund) from a set Q = {q1, ..., qz}of potential alternatives. She derives utility u(qj) from alternative qj , whereas she receives a utility
normalized to 0 if no alternative is chosen. Clients differ in their levels of financial literacy or
aptitude θi, with θ ∈ [0, 1].11 A higher θ signifies stronger ability.
Ex ante, the client does not know the full set of potential alternatives. In the spirit of Stigler
(1961) she can engage in a search to uncover them on her own, which determines her outside option
in the “advice game” described below. We assume that the expected utility from random search is
Eu(qS |θj).12 As Rothschild (1974) demonstrates, this expected utility generally increases as clients’
search costs decrease. We assume that clients’ search costs are decreasing as their level of financial
literacy rises, and therefore Eu(qS |θi) is strictly increasing in θ.13 This assumption seems natural:
Higher aptitude could be associated with a better grasp of technical terms and concepts such as
compound interest, so that less effort is required to study each offer. It could also decrease the
time necessary to recognize and dismiss unsuitable offers.
We model the interactions with the advisor as a reduced form game of asymmetric information
with the following timing and information structure:
1. The client observes her level of financial literacy θi. The advisor receives a signal of the
client’s financial literacy si (but not the actual θi). From this signal, he infers a subjective
distribution of financial literacy F (θ|si), conditional on the client having solicited advice. On
the basis of this inference, he suggests to the client an investment alternative qa from the set
of alternatives available to him, Q.
11Here, we think of financial literacy as an individual’s level of understanding regarding financial mattersand financial products, in particular with respect to their risk, returns and cost structure as well as furtherbenefits and relevant features.
12For a micro foundation, one may think of the optimal number of searches, or equivalently the reservationvalue of the client depending on θ.
13Hackethal, Haliassos, and Jappelli (2012) argue for the opposite relationship owing to potentially higheropportunity costs of time spent on research for people with higher aptitude. However, we have evidence thaton average, clients with higher financial literacy compare more alternative products.
13

2. The client decides whether to accept or reject the offer. If the client accepts the offer, she
receives the utility u(qa) and the advisor receives the utility ν(qa). If she rejects the offer,
the advisor receives utility −λi, for example, owing to complaints or the possibility of lost
future business. The client can then decide whether to search independently or to choose no
option and obtain a utility of 0.
The client’s problem. Consider the decision problem of the client who has been offered in-
vestment alternative qa by the advisor. The client should follow the recommendation and pick
alternative qa only if the following holds:
u(qa) ≥ max{Eu(qs|θi), 0} (3)
The utility derived from the suggested alternative must exceed the expected utility from both
independent search (which we call the client’s outside option) and choosing none of the alternatives.
This requirement immediately yields the first hypothesis:
Hypothesis 1: For a given suggested alternative qa, the probability that a client will accept is
(weakly) decreasing in the client’s level of financial literacy θi.
In other words, more financially literate clients are more selective regarding advice, owing to
their more valuable outside option from independent search.
The advisor’s problem. The advisor’s task is to pick an alternative qa ∈ Q to suggest to the
client. The advisor observes a signal si and updates the (subjective) distribution of the client’s
financial literacy to F (θ|si), with the associated densities f(θ|si). We assume the following struc-
ture: If s′ is a signal of higher expertise than s, then F (θ|s′i) < F (θ|si) ∀θ ∈ (0, 1). That is, higher
signals lead to first order stochastic dominance of the subjective distribution contingent on the
received signal.
Let θc(qj) signify the critical level of financial literacy, for which a client would be indifferent
between accepting the offer of qj and searching independently. That is, u(qj) ≥ Eu(qs|θc(qj)) and
u(qj) < Eu(qs|θ′) if θ′ > θc(qj). The advisor, upon observing signal si, expects the client to follow
advice qj with probability:
p+(qj |si) = F (θc(qj)|si) (4)
The advisor’s utility is ν(qa) if the client picks the suggested alternative, whereas he suffers
expected (dis)utility −λi if the client refuses the offered advice, the size of which may depend on
the client’s characteristics. This approach captures the possibility of losing future business if the
client is dissatisfied or if complaints are logged. The advisor facing client i solves the maximization
problem:
maxqa∈Q
p+(qa|si)ν(qa)− (1− p+(qa|si))λi (5)
Assume that alternatives can be ordered such that a higher index represents a better alternative
from the perspective of the client. The advisor will prefer to suggest alternative j+1 over alternative
14

j, that is, he will offer better advice for the client, if the following condition holds:
p+(qj+1|si)p+(qj |si)
>(ν(qj) + λi)
(ν(qj+1) + λi)(6)
Intuitively, the increased probability of the client following advice has to outweigh the advisor’s
utility loss from suggesting a less preferred (from the advisor’s perspective) option. The advisor
trades off the additional likelihood of the better suggestion being accepted versus the foregone pri-
vate benefit from lower compensation. The inequality is trivially satisfied whenever ν(qi+1) ≥ ν(qi).
In this case, the interests of the advisor and the client are aligned and alternative qj is dominated
– the advisor can increase either his own payoff or the probability of acceptance by picking the
dominant alternative. In general, screening out dominated alternatives is an important benefit
that financial advisors offer their clients. Finally, note that the righthand-side of the inequality is
decreasing in the value of λj : as the disutility from failing to convince the client grows larger, the
necessary increase in the likelihood of acceptance from offering better advice shrinks.14
Conflict of interest and kickbacks or standard products. Next, we zoom in on the
structure of ν, the advisor’s compensation. Financial advisors are frequently incentivized through
kickbacks or bonus payments if they sell certain products. Bank financial advisors receive a fixed
salary, but banks are allowed to pay their employees bonuses based on the success of the branch,
the team, and/or the entire bank. Alternatively (or in addition) advisors may have an incentive to
recommend standard products predefined by their employer, because it reduces the effort required
on their part (e.g., time spent researching alternatives), while the bank benefits from selling own
products (Hoechle, Ruenzi, Schaub, and Schmid, 2018), in turn.
Assume that the advisor (or the bank) receives a base utility of v (fixed-wage component) as well
as a private advantage (via a kickback or lower effort cost) of b > 0 only if he successfully suggests
an alternative from the set Qb ⊂ Q to the client. Within Qb, the advisor then has an incentive
to suggest the alternative that conveys maximal utility to his client, because it has the highest
probability of acceptance. Analogously, all but one of the alternatives for which the advantage b
does not accrue to the advisor must be (weakly) dominated: The one that conveys the maximal
utility to the client. If the overall optimal (from the perspective of the client) alternative is not
within Qb,15 then the advisor’s problem is reduced to suggesting either an alternative for which he
receives an advantage, which we denote as a1, or the best overall option, which we denote as a2,
with u(a2) > u(a1), while ν(a1) > ν(a2). From this, we derive the following:
Lemma 1: If the advisor receives a private advantage b > 0 for successfully suggesting an
alternative from the set Qb ⊂ Q, by elimination of (weakly) dominated alternatives his problem is
14In the extreme (as λi → ∞), the right-hand side approaches 1: If a certain client is very importantor valuable, the advisor will have an incentive to maximize the probability of her acceptance of his adviceby making the best available suggestion. For this reason and since we allow λi to depend on the client’scharacteristics, we have to control for the client’s importance to the bank, such as by using overall financialwealth with the bank or the value of the specific recommendation.
15If the optimal alternative is within Qb, then no conflict of interest exists.
15

reduced to suggesting one of (at most) two alternatives a1 and a2.
Financial literacy and the quality of advice. An advisor would prefer to convince the client
to pick alternative a1, even while he knows that the client would be better served by a different
option. Given the findings above, we derive the following central result. Assume that an advisor
receives b > 0 if he successfully suggests an alternative from Qb ⊂ Q to the client. Further assume
that an alternative aZ exists, with u(aZ) > u(qb)∀qb ∈ Qb and u(aZ) ≥ u(qi) ∀qi ∈ Q.
Hypothesis 2: For two signals s′ > s, the probability of the advisor suggesting aZ is greater if he
observes the signal of higher financial literacy s′ than if he observes signal s.
Proof: If an alternative aZ with the properties described above exists, then p+(aZ |sj) = 1∀sj and
aZ must be one of the two alternatives that the adviser considers. Denote the alternative in Qb
that maximizes the acceptance probability by the client as a1. By Lemma 1, we know that the
advisor only considers these two alternatives. Denote the distribution function of ε as N . Plugging
into (6), we can explicitly derive the probability of the advisor suggesting aZ over alternative a1 as
1 − N(
p+(a1|sj)1−p+(a1|sj)b− v − `j
). By first order stochastic dominance, p+(a1|s′) < p+(a1|s) if s′ > s
which yields Hypothesis 2.
A higher observed signal of financial literacy is more likely to induce the advisor to offer better
advice to the client, and (partially) forego his private advantage. This response is the central
mechanism we are interested in. To paraphrase: Clients who appear to be smarter are more likely
to receive better advice from advisors. We refer to this hypothesis as miss-selling hypothesis.
Finally, this analytical framework suggests an additional aspect, which can be empirically exam-
ined: As a high signal of financial literacy is associated with receiving better advice, it is rational to
adhere, irrespective of actual financial knowledge of the client. So we should observe the mechanism
of Hypothesis 1 – smarter clients reject advice more often – mainly or only when they also receive
suboptimal advice due to a bad signal – Hypothesis 2. Intuitively, two factors must coincide for an
offer to be rejected: 1) The advice received from the advisor must be suboptimal and 2) the client
must recognize this and be able to do better on her own. Thus we hypothesize that clients with
bad signals of financial literacy but high actual financial literacy are more likely to reject a given
advisor recommendation. We refer to this as the rejection hypothesis.
Our empirical observations in the administrative bank data reported in Section 3 are: clients with
a signal for lower financial literacy, i.e. women, are more likely to receive product recommendations
which do not align with their risk preferences. They pay higher management fees for funds within
the same risk category and they are less likely to receive rebates on the front-end loads. All of these
observations are in line with the miss-selling hypothesis. In the next section, we will empirically
investigate the rejection hypothesis.
16

4.2 Are Women with higher financial literacy more likely to reject
advice?
In order to examine the rejection hypothesis we need a data set in which we observe both the
signal as well as the ”true” financial literacy of the client. Unfortunately, for the majority of clients
in our bank sample we do not observe the true financial literacy. However, within the bank data
set, we observe a subsample of clients and their respective recommendations, for whom we have
an overlap with two surveys conducted among bank clients in 2018/2019. In these surveys clients’
financial literacy was assessed using financial literacy quizzes. In the first survey among 520 clients
five literacy questions were asked and in a second survey among 258 clients two additional literacy
questions were asked (see appendix tables B1 and B2 for the wording of the questions). The results
of the survey for individual clients are unknown to the bank. The financial literacy questions entail
the three basic literacy questions by Lusardi and Mitchell (2007) and some additional questions
asking about the riskiness of different savings products and some institutional knowledge about
investment funds. We group the financial literacy questions into four general questions of financial
literacy and questions of fund specific knowledge. The distributions of correct answers for both
measures are shown in figure 5. In the first measure the median client answered three out of four
questions correctly. In the fund literacy survey the median client answered 2 out of 3 questions
correctly. The figure also reveals that on average in our sample women have lower levels of test
based financial literacy which is in line with results in the literature. Men answer on average
3.25 general and 1.67 fund questions correctly, vs. 2.97 and 1.3 correct answers among women,
respectively. For the purpose of our study, we define a high-literacy (high fund-literacy) client as
someone who answers all general questions (fund questions) correctly.
Empirical Strategy. On the basis of the analytical framework, our identification strategy in
this section hinges on the fact that the data allow us to observe a measure of the client’s true
financial literacy, which is unavailable to the advisor, in addition to the signal of financial literacy,
which is observable to both the advisor and us as researchers. We employ being female as a signal
of low aptitude and being male as a signal of high aptitude.16
To test the rejection hypothesis, we estimate linear models of the following form:
yi = β0 + β1xi ∗ genderi + β2zi + ε (7)
where, y is a measure of client i’s adherence to the advisor’s recommendation. More specifically
it is an indicator if the recommended investment alternative was implemented within 30 days after
the meeting. x is the objective measure of financial literacy, and z is a vector of controls including
the same variables as in our previous regressions. In order to test our predictions, we interact
financial literacy and gender. Corresponding to the ‘rejection hypothesis’, financial literacy should
16One potential problem in this context is that couples make financial decisions jointly given the finan-cial advice they have received; to account for this, we control for the marital status of respondents in allspecifications.
17

have a significant effect on following advice only for individuals with “bad” signals, in our context
women. Since the sample for this analysis is substantially smaller than the samples before, we
cannot add year times month and advisor fixed effects. Instead we add month fixed effects and
average all control variables by advisor and include these advisor averages instead of advisor fixed
effects (Mundlak correction).
Results. The results are reported in Table 5. The average effect of financial literacy on adherence
is negative and insignificant for the general financial literacy measure (Column 1), it is negative
and significant for the more specific fund literacy measure (Column 2). Differentiating the effects
by gender (column 3 and 4) reveals that only financially literate female clients are significantly less
likely to follow advice. An F-test shows that the coefficients for men and women differ significantly
in both regressions. Higher financial literacy, or a better outside option, only makes rejections more
likely for women, a finding compatible with the prediction derived in the analytical framework.
Since the bank data set in combination with the survey is limited, we additionally make use
of a panel data set of German households called SAVE. The SAVE data set contains detailed
information on households’ financial situation as well as their socio-economic and psychological
characteristics.17 Our analysis is primarily based on data from SAVE 2009, which contains 2,222
observations and which elicited respondents’ financial literacy. Our main variables of interest are
the household’s level of financial literacy, whether the household solicited financial advice, and
whether the household followed the financial advice it received. Summary statistics are provided
in the appendix Table .18 In the SAVE data, about one-third (33.7 percent) of the overall sample
reports having consulted an advisor in the previous year.19 As a follow-up question, respondents
who consult professional advisors were asked how closely they adhere to the received advice on
a scale from 1 to 10 (from 0 = not at all to 10 = entirely). On average, respondents tend to
follow advice – only around 15.8 percent of the responses are below the center of the scale (5).
Financial literacy is elicited using objective measures of financial literacy based on quizzes similar
to questions in prior work, e.g. Lusardi and Mitchell (2007) and Van Rooij, Lusardi, and Alessie
(2011). In total, nine financial literacy questions were asked in SAVE in 2009. We can construct
two measures of financial literacy – basic and advanced. Each literacy measures is composed of a
set of four questions, which are – judging by the answering behavior of respondents – relatively
easy (basic literacy) respectively difficult (advanced literacy).20 We create two indices from the
17For a detailed description see Borsch-Supan, Coppola, Essig, Eymann, and Schunk (2009).18We drop observations with missing information on our dependent variables or the central explanatory
variable financial literacy.19This refers to advisors from banks, insurance companies, or other financial service providers. The
fraction of households consulting advisors is rather stable over time.20Van Rooij, Lusardi, and Alessie (2011) and Bucher-Koenen (2011) conduct factor analyses to group
financial literacy items into different constructs. The basic questions examine the understanding of interest,inflation, compound interest, and money illusion. The fraction of correct answers among these questionsranges from 57.2 percent on the money illusion to 85.7 percent on the interest question . The advancedquestions test the understanding of return fluctuations, stock markets, risk and diversification, and mutualfunds. The percentage of correct answers ranges from 47.4 percent on the funds question to 73.4 percent onthe return question.
18

number of correct answers. Around 17 percent (8.4 percent) of the respondents in the survey were
unable to give even a single correct answer to the four advanced (basic) questions, while 31 percent
(41 percent) were able to answer each advanced (basic) question correctly.
We apply the same empirical strategy as before using the survey measure of adherence. Table
6 shows the results within the SAVE Panel: We find a significant negative effect of financial
literacy on self-reported following professionals’ financial advice. This finding is concurrent with
our hypothesis that more knowledgeable clients are more likely to reject advice. Comparison of
the effects for basic and advanced financial literacy shows that for the rejection of financial advice,
only advanced literacy matters. Inserting interaction terms of the objective financial literacy with
gender (Column 2) reveals again that only women with higher advanced financial aptitude reject
received financial advice with a significantly higher likelihood. In fact, for men this effect is not only
insignificant, but actually 0.00 in the survey sample. In accordance with the rejection hypothesis,
an F-test of the coefficients for men and women reveals that compared to men, the effect of advanced
financial literacy on women’s decisions is significantly stronger. Higher levels of financial literacy
do make clients more likely to reject advice, but this result holds only for individuals endowed with
a bad signal of their financial skills – here, women.
Overall, predictions of our theoretical framework are in line with the results, that we obtained
in the data. It seems that advisors tailor their advice to their clients based on observed signals
of financial aptitude. As a result women, receive lower quality advice, i.e recommendations for
products that are less in line with their risk preferences and more costly. However, given that their
true literacy is high they are more likely to reject this advice.
5 Discussion
In this section we discuss some alternative mechanisms, which could conceivably explain the
observed differences in advice to male and female clients. We also raise the issue of possible
economic consequences of the different product recommendations for women’s portfolios.
5.1 Catering to specific (gender-based) client requests?
We observe empirically that women are more likely to receive recommendations for the bank-
owned balanced funds. However, some clients might actually be willing to incur higher costs
in exchange for specific product features. In the following, we analyse whether there might be
characteristics of bank-owned balanced funds that make them more attractive to female clients, in
particular.
From the administrative bank data we can examine whether the advisory meeting was initiated by
the client or the advisor. Overall, 72% of the meetings are initiated by the advisor (no significant
differences between male and female clients). In Column 1 of Table 7 we run a regression on
whether bank own funds were recommended based on the sample of meetings that were initiated
19

by the advisor – here, the clients own motives should play less of a role compared to meetings
initiated by clients. The results in Table 7 reveal that our previous findings hold: Female clients
are significantly more likely to receive a recommendation for one of the bank’s own balanced funds
in meetings initiated by the advisor. To further pursue the issue, we next consider adherence
to recommendations with a focus on bank own funds. If women were more likely to follow this
type of recommendation (while controlling for other relevant factors), this could be a signal of
(revealed) client preferences. Again adherence is defined as an indicator equal to one if a purchase
recommendation is followed within 30 days after the meeting. There is no evidence that women
are more likely than men to adhere to advice, if a bank-owned balanced fund is recommended to
them (interaction-term in Column 2).
What else could lead to higher willingness to pay for bank owned balanced funds? Figure 6
summarizes potential differences in motives and goals of male and female clients for seeking advice.
The data are again obtained from a survey that was run with clients of the bank, which randomly
overlaps with 199 clients (135 men) in our sample. Figure 6 reveals that women are more likely to
seek advice in order to find a suitable asset allocation and feel relief due to being able to delegate the
investment decision. The fund brochures of the bank’s own balanced funds directly appeal to these
desires. Rather than having to make a series of individual investment decisions, these products
promise to be a ”convenient” all-in-one portfolio solution that does not require any further action
on the part of the investor.
Based on the transcribed advisory meeting protocols, we are able to examine whether advisors
make use of these arguments. For this, we run a text analysis on the reasons that advisors state
for recommending a certain product. Due to the variation in phrasings, typos, and abbreviations
in the protocols a fully automated text analysis is unfeasible. Therefore, we hand-collected the
evidence on client preferences as stated by advisors. Figure 8 shows the most frequently stated
reasons for recommending a product, separately for bank own funds and other fund products.
Diversification is the reason most often stated for both categories equally (it was stated as relevant
for recommending in 78% of cases for other products and for 81% of cases in bank-owned funds).
A fund’s investment strategy plays a role in slightly less than 20% of the cases, respectively. As
opposed to this, we observe substantial differences when looking at the role of ”hand-holding” and
”convenience”. These reasons are relevant for around half of the recommendations for the bank’s
own funds compared to almost no references (4% hand holding, 0% convenience) in case of other
product recommendations. Taking the evidence from both figures together, we do observe a certain
level of correspondence between the motives stated by women for seeking investment advice and the
reasons stated by advisors for recommending bank owned funds. In the following, we demonstrate
how expensive this (possible) preference can turn out to be.
In order to understand if the differences in fees resulting from advisors’ differential treatment of
men and women are economically relevant, we perform a simple back of the envelop calculation.
The most frequently recommended bank-owned fund invests 40% in equity and 60% in bonds, and
is associated with a total expense ratio of 2.2%. A similar portfolio could therefore be achieved
20

by investing 40% of the assets into an equity fund and 60% into a bond fund. The average equity
fund recommended in our sample has an expense ratio of 1.5, the average bond fund of 0.97. It
is important to note that we use a rather conservative approach to calculate fee differences by
focusing on funds which are recommended – a more extreme approach would be to instead consider
the fees of index funds or exchange traded funds (ETFs) as a benchmark. Figure 9 shows the
results from this exercise if a client invests 10,000 Euros in total over different investment horizons.
The alternative combination of funds would, holding returns constant at 6%, result in a difference
in final wealth of around 1,500 Euros after 10 years and 4,500 Euros after 20 years, which is in line
with the fact that 48% of the recommendations in the sample are tailored to a long-term investment
horizon. These cost differences are substantial.
Thus, while these motives might explain why women get more recommendations for the bank’s
own balanced funds, for which they would be willing to pay a premium, it remains unclear whether
they are fully aware of the full costs they pay. As one piece of evidence, the fact that women less
often receive (ask for) a rebate on the upfront fee charged upon mutual fund purchase casts doubt
on the hypothesis, that the higher fund fees paid by women exclusively reflect a higher willingness
to pay for additional service.
Thus, even though the evidence suggests that women tend to look for investment opportunities
that allow them decision delegation and an easy solution to their portfolio management. And that
advisors tend to sell the bank’s own funds exactly under these premises we are not convinced that
the clients who follow these recommendations are aware of the price they pay. Interestingly a
disclosure of the Euro price might not help in these cases either because individuals are not able
to make a price and product comparison easily.
5.2 Differences by advisor gender?
Since the finance industry is male-dominated, differential treatment of male and female clients
could be present. We split our sample by advisor gender and run the same regressions as before in
order to check if the results differ for male and female advisors (see Table ).
We find that differential treatment of female and male clients is almost only significant and
relevant in the regression for the male advisors. Male advisors are more likely to recommend less
risky products, a lower equity share and a higher fraction of bank own funds to female clients. While
female advisors tend to recommend similar products to male and female clients. The differences in
the product fees and rebates recommended by female and male advisors to their female clients are
less clear. While these results do not contradict our proposed mechanism we need to investigate
the precise recommendations by male and female advisors in more detail.
5.3 Negotiation skills?
Another driver of the results could be differences in the tendency to negotiate by gender. There
is ample empirical evidence that women are less willing to negotiate compared to men. Thus in an
21

advisory meeting women might be less likely to ask for investment alternatives or a rebate. With the
evidence available to us at this moment, unfortunately, we cannot examine this mechanism further.
However, we are aware that this could be an interesting mechanism and it is definitely worth
examination in the future. Overall, the conclusions of the paper would not change fundamentally
because of this alternative mechanism. However, the policy conclusions might be slightly different.
If financial literacy is the main driver, investment in financial literacy might help, if negotiation skills
are required, higher levels of financial literacy might not help women in getting better investment
advice. However, financial literacy and negotiation skills might even be interrelated. If women were
more financially literate and confident about their knowlegde they might also be more likely to ask
for alternative product recommendations or rebates. However, closer examination is required here
in future work.
5.4 Alternative signals for financial literacy?
We suggest that individuals who appear to be less sophisticated receive worse advice, which
implies that the effect goes beyond a pure gender effect. To test this broader idea, we can look
into alternative measures for the appearance of low literacy, for example education and German
citizenship. Education is correlated with financial literacy and has been used as a proxy for financial
expertise in studies such as e.g. Georgarakos and Inderst (2011). Since we do not have a direct
measure for education in our bank data, we can examine if the client holds a doctoral degree or a
management position. In addition, we use a second proxy for apparent low literacy, namely whether
a client has a foreign citizenship. The reasoning is that these clients are less accustomed to the
German banking system and therefore are likely to have a lower institutional knowledge, which is
also a part of financial literacy. These clients account for 5 percent of the clients in our sample.
Results show that, clients with an academic degree or a those holding a management position are
less likely to receive recommendations to purchase a bank-owned fund (see Table 2 Column 6). The
effect of foreign citizenship is insignificant in this regression. With regard to the fund fee, we find
no significant effect for foreign customers or management position or academic degree. However,
the probability to be offered a rebate, is significantly lower among foreign citizens. Overall, the
results indicate that the effect of adjusting advice to apparent signals of literacy might go beyond a
pure gender effect. Results are, however, not as robust, which can be explained by the fact that the
alternative signals display lower salience and a less favorable sample splits than the gender signal.
6 Conclusion
A limitation of the empirical literature on advice, whether in the financial context or other
contexts, is that observing the interactions between the advisor and the customer is extremely
difficult, and therefore evaluating the quality of advice is also challenging. We are able to overcome
some of these limitations with a very detailed data set on advisory meetings. In addition, we make
22

use of survey data for additional information not recorded in administrative bank data. For the
approach that we introduced, which can and should be replicated in the future, we use both a signal
of the respondents’ financial literacy, which is on average informative (the respondent’s gender),
and an objective measure of financial literacy, which is not available to the advisor.
Our empirical results emphasize the problems surrounding the misalignment of incentives of
advisors and their customers. To refer back to the title of the paper, yes, women seem to get
different financial advice compared to men. However we propose that this is not a pure gender result
but comes from the fact that individuals who appear to be more versed in financial matters receive
better advice, on average. This systematic differential treatment of customers by professional
advisors has not previously been demonstrated for large sample of bank customers. It appears
likely that this finding not only applies to financial matters but can be generalized to other settings
in which individuals receive advice from professionals.
The basic mechanism responsible for the conflict of interest is the contractual incentive structure
of advisors, with higher bonuses exacerbating the problems. This finding is in line with findings
from the literature , e.g., Inderst and Ottaviani (2012a) or Inderst and Ottaviani (2009). Various
policies to address this issue have been implemented, in particular disclosure of the conflict of
interest to clients or a decrease in incentives for advisors by reducing the bonus component of their
contracts. Clearly, these approaches may have drawbacks of their own: Lacko and Pappalardo
(2010) and Loewenstein, Cain, and Sah (2011) show in experimental settings that disclosure could
be associated with other disadvantages, such as clients becoming distracted from essential details
owing to information overload, or advice even becoming more biased owing to the interaction of
trust and signaling effects. Fee-based advisory contracts are also no panacea, since they may
induce advisors to strategically inflate the number of interactions with each customer. Our findings
should add an additional reason for and more urgency to these regulatory and policy efforts, since
we show that costs associated with product recommendations are borne disproportionately by
women. While the intention of this paper is not to question the overall quality of advice, the
documented mechanism adversely affects those generally more in need of professional financial
advice. The Federal Trade Commission provides shopping tips and questions to ask for customers
on its website (https://www.consumer.ftc.gov/topics/shopping-saving). Initiatives like that may
help less sophisticated clients to at least ask the right questions in an advisory meeting.
23

References
Alesina, A. F., F. Lotti, and P. E. Mistrulli, 2013, “Do Women Pay More For Credit? Evidence
From Italy,” Journal of the European Economic Association, 11(s1), 45–66.
Balafoutas, L., A. Beck, R. Kerschbamer, and M. Sutter, 2013, “What Drives Taxi Drivers? A
Field Experiment on Fraud in a Market for Credence Goods,” Review of Economic Studies,
80(3), 876–891.
Bhattacharya, U., A. Hackethal, S. Kaesler, B. Loos, and S. Meyer, 2012, “Is Unbiased Financial
Advice to Retail Investors Sufficient? Answers from a Large Field Study,” Review of Financial
Studies, 25(4), 975–1032.
Bi, L., C. P. Montalto, and J. J. Fox, 2002, “Household Search For and Use of Financial Informa-
tion,” Consumer Interests Annual, 48, 1–9.
Blanchflower, D. G., P. B. Levine, and D. J. Zimmerman, 2003, “Discrimination in the Small-
Business Credit Market,” The Review of Economics and Statistics, 85(4), 930–943.
Bluethgen, R., S. Meyer, and A. Hackethal, 2008, “High-Quality Financial Advice Wanted,” work-
ing paper.
Borsch-Supan, A., M. Coppola, L. Essig, A. Eymann, and D. Schunk, 2009, The German SAVE
Study - Design and Results. Mannheim Institute for the Economics of Aging (MEA), 2nd edn.
Bucher-Koenen, T., 2011, “Financial Literacy, Riester Pensions, and Other Private Old-Age Pro-
vision in Germany,” MEA Discussion Paper, 250-11.
Bucher-Koenen, T., A. Lusardi, R. Alessie, and M. van Rooij, 2016, “How financially literate are
women? Some new perspectives on the gender gap,” Journal of Consumer Affairs, 51, 255–238.
Burke, J., and A. A. Hung, 2015, “Financial Advice Markets,” RAND working paper. Working
Paper.
Busse, M., A. Israeli, and F. Zettelmeyer, 2017, “Repairing the Damage: The Effect of Gender and
Price Knowledge on Auto-Repair Price Quotes,” Journal of Marketing Research, 54, 75–95.
Calcagno, R., and C. Monticone, 2015, “Financial Literacy and the Demand for Financial Advice,”
Journal of Banking and Finance, 50.
Cavalluzzo, K. S., and L. C. Cavalluzzo, 1998, “Market Structure and Discrimination: The Case of
Small Businesses,” Journal of Money, Credit and Banking, 30(4), 771–792.
Chalmers, J., and J. Reuter, 2012, “Is Conflicted Investment Advice Better than No Advice?,”
NBER Working paper No. 18158. Working Paper.
24

Chater, N., S. Huck, and R. Inderst, 2010a, “Consumer decision-making in retail investment ser-
vices: a behavioural economics perspective,” Final Report for the European Union, 22.
, 2010b, “Consumer decision-making in retail investment services: A behavioural economics
perspective,” working paper, Report to the European Commission/SANCO.
Chen, Z. C., and T. Gesche, 2018, “Persistent Bias in Advice-Giving,” Working Paper.
Deutsche Bundesbank, 2016, “Vermoegen und Finanzen privater Haushalte in Deutschland: Ergeb-
nisse der Vermoegensbefragung 2014,” Monthly Report, March. Working Paper.
Droesser, C., 2016, Wie wir Deutschen ticken – Wer wir sind. Wie wir denken. Was wir fuehlen.
Edel Books, Hamburg, 1 edn.
Dulleck, U., and R. Kerschbamer, 2006, “On doctor, mechanics, and computer specialists: The
economics of credence goods,” Journal of Economic Literature, 44(1), 5–42.
Egan, M., G. Matvos, and A. Seru, 2017, “When Harry Fired Sally: The Double Standard in
Punishing Misconduct,” Working Paper.
, 2019, “The Market for Financial Adviser Misconduct,” Journal of Political Economy,
127(1), 233–295.
Foerster, S., J. T. Linnainmaa, B. T. Melzer, and A. Previtero, 2017, “Retail financial advice: does
one size fit all?,” Journal of Finance, 72(4), 1441–1482.
Gabaix, X., and D. Laibson, 2006, “Shrouded attributes, consumer myopia, and information sup-
pression in competitive markets,” The Quarterly Journal of Economics, 121(2), 505–540.
Gaudecker, H. M. v., 2015, “How does household portfolio diversification vary with financial literacy
and financial advice?,” Journal of Finance, 70(2), 489–507.
Gennaioli, N., A. Shleifer, and R. Vishny, 2015, “Money doctors,” Journal of Finance, 70(1),
91–114.
Georgarakos, D., and R. Inderst, 2011, “Financial advice and stock market participation,” Working
Paper Series 1296, European Central Bank.
Gottschalk, F., W. Mimra, and C. Waibel, 2018, “Health Services as Credence Goods: A Field
Experiment,” Working Paper.
Grinblatt, M., S. Ikaheimo, M. Keloharju, and S. Knupfer, 2016, “IQ and mutual fund choice,”
Management Science, 62(4), 924–944.
Hackethal, A., M. Haliassos, and T. Jappelli, 2012, “Financial advisors: A case of babysitters?,”
Journal of Banking and Finance, 36(2), 509–524.
25

Hackethal, A., C. Laudenbach, S. Meyer, and A. Weber, 2018, “Client Involvement in Expert
Advice - Antibiotics in Finance?,” SAFE Working Paper.
Hoechle, D., S. Ruenzi, N. Schaub, and M. M. Schmid, 2016, “The Impact of Financial Advice on
Trade Performance and Behavioral Biases,” Review of Finance, 20, 1–40.
, 2018, “Financial Advice and Bank Profits,” The Review of Financial Studies, 31, 4447–
4492.
Hung, A. A., N. Clancy, J. Dominitz, E. Talley, C. Berrebi, and F. Suvankulov, 2008, “Investor
and Industry Perspectives on Investment Advisers and Broker-Dealers,” working paper, RAND
Corporation.
Inderst, R., and M. Ottaviani, 2009, “Misselling Through Agents,” The American Economic Re-
view, 99, 883–908.
, 2012a, “Competition through Commissions and Kickbacks,” The American Economic
Review, 102(2), 780–809.
, 2012b, “How (not) to pay for advice: A framework for consumer financial protection,”
Journal of Financial Economics, 105(2), 393–411.
Kerschbamer, R., and M. Sutter, 2017, “The economics of credence goods OCo A survey of recent
lab and field experiments.,” CESifo Economic Studies, 63, 1–23.
Kramer, M. M., 2012, “Financial Advice and Individual Investor Portfolio Performance,” Financial
Management, 41(2), 395–428.
Lacko, J. M., and J. K. Pappalardo, 2010, “The Failure and Promise of Mandated Consumer
Mortgage Disclosures: Evidence from Qualitative Interviews and a Controlled Experiment with
Mortgage Borrowers,” The American Economic Review: Papers and Proceedings, 100, 516–521.
Linnainmaa, J., B. Melzer, and A. Previtero, 2018, “The Misguided Beliefs of Financial Advisors,”
Working Paper.
Loewenstein, G., D. M. Cain, and S. Sah, 2011, “The Limits of Transparency: Pitfalls and Potential
of Disclosing Conflicts of Interest,” The American Economic Review, 101, 423–428.
Lusardi, A., and O. Mitchell, 2007, “Financial Literacy and Retirement Planning: New Evidence
from the Rand American Life Panel,” Pension Research Council Working Paper, PRC-WP2007-
33.
, 2011, “Financial Literacy Around the World: An Overview,” Journal of Pension Eco-
nomics and Finance, 10(4), 497–508.
26

, 2014, “The Economic Importance of Financial Literacy: Theory and Evidence,” Journal
of Economic Literature, 52(1), 5´44.
Mehran, H., and R. M. Stulz, 2007, “The economics of conflicts of interest in financial institutions,”
Journal of Financial Economics, 85(2), 267 – 296.
Mullainathan, S., M. Noeth, and A. Schoar, 2012, “The Market for Financial Advice: An Audit
Study,” NBER Working Paper, No. 17929.
Rothschild, M., 1974, “Searching for the Lowest Price When the Distribution of Prices is Unknown,”
The Journal of Political Economy, 82, 689–711.
Shapira, Z., and I. Venezia, 2001, “Patterns of behavior of professionally managed and independent
investors,” Journal of Banking & Finance, 25(8), 1573 – 1587.
Stigler, G. J., 1961, “The Economics of Information,” The Journal of Political Economy, 69, 213–
225.
Stolper, O., 2018, “It takes two to tango: householdsOCO response to financial advice and the role
of financial literacy,” Journal of Banking & Finance, 92, 295–310.
Stoughton, N. M., Y. Wu, and J. Zechner, 2011, “Intermediated Investment Management,” The
Journal of Finance, 66(3), 947–980.
Van Rooij, M., A. Lusardi, and R. Alessie, 2011, “Financial Literacy and Stock Market Participa-
tion,” Journal of Financial Economics, 101(2), 449–472.
27

Figure 1: Variation in Product Recommendations by Gender
This figures shows the share of different product categories recommended to male and female clients sepa-
rately.
Panel A: Recommendations by Product Category and Gender
0
.2
.4
.6
.8
1
Shar
e of
Rec
omm
enda
tions
Male Clients Female Clients
Balanced Funds Equity FundsSingle Stocks Bond FundsSingle Bonds Other FundsCertificates Warrants Others
Panel B: Recommendations by Fund Type and Gender
0
.2
.4
.6
.8
1
Shar
e of
Rec
omm
enda
tions
Male Clients Female Clients
Bank Owned Balanced Funds Other Balanced FundsEquity Funds Bond FundsOther Funds
28

Figure 2: Fund Recommendations: Management Fees and Risk Categories
Panel A: Distribution of Risk Categories by GenderFor each risk category the figure show the share of recommendations for male and female clients separately.
010
2030
40Sh
are
of R
ecom
men
datio
ns
1 2 3 4 5 6 7Fund Risk Category
Female Clients Male Clients
Panel B: Management Fees by Risk CategoryFor each risk category the figure show the total expense ratios for all funds in our sample.
01
23
4To
tal E
xpen
se R
atio
1 2 3 4 5 6 7Fund Risk Category
29

Figure 3: Fee Rank and Management Fees by Risk Category
Panel A of this figures shows the distribution of fund recommendations across five bins, from low to high
costs, for female and male clients separately. The quintiles (ranks) were calculated for each of the seven risk
categories separately. The figure in Panel B, shows the average management fee for bank owned balanced
and other funds separately by fund risk category.
Panel A: Distribution of Fee Rank by Gender
010
2030
4050
Perc
ent
1 2 3 4 5Fee Rank (1 = low, 5 = high)
Female Clients Male Clients
Panel B: Fees by Risk Category and Ownership
01
23
1 2 3 4 5 6 7 1 2 3 4 5 6 7
All funds (excl. bank owned) Bank owned balanced funds
Aver
age
Tota
l Exp
ense
Rat
io
Risk Category
30

Figure 4: Rebate on Fund Loads to male (M) and female (F) clients
For each risk category the figure shows the share of fund purchases that were granted a rebate by the advisor
for male and female clients separately.
Panel A: Distribution of Rebates by Asset0
1020
30Pe
rcen
t
0 .2 .4 .6Share Rebates of all Recommendations for a given ISIN
Panel B: Distribution of Rebates by Gender and Risk Category
0.1
.2.3
Shar
e R
ebat
es
1 2 3 4 5 6 7M F M F M F M F M F M F M F
Gender and Fund Risk Category (1-7)
31

Figure 5: Financial literacy by gender
Panel A of this figures shows the distribution of correct answers to the four general literacy questions by
gender. Panel B shows the distribution of correct answers to three fund literacy questions by gender. Detailed
wording of questions can be found in the appendix.
Panel A: Distribution of Correct Answers to General Questions0
1020
3040
50Pe
rcen
t
0 1 2 3 4Number of correct answers
Female Clients Male Clients
Panel B: Distribution of Correct Answers to Fund Literacy Questions
010
2030
40Pe
rcen
t
0 1 2 3Number of correnct answers
Female Clients Male Clients
32

Figure 6: Motives for Advice Seeking by Gender
This figures shows the underlying reasons for advice seeking by gender.
0.39 0.40
0.2
.4.6
.8Sh
are
with
pos
itive
eva
luat
ion
Male Clients Female Clients
Achieve higher returns
0.35
0.52
0.2
.4.6
.8Sh
are
with
pos
itive
eva
luat
ion
Male Clients Female Clients
Find suitable Asset Allocation
0.47
0.23
0.2
.4.6
.8Sh
are
with
pos
itive
eva
luat
ion
Male Clients Female Clients
Provide Second Opinion
0.31
0.49
0.2
.4.6
.8Sh
are
Agre
ed
Male Clients Female Clients
Relief to Delegate Decisons
33

Figure 7: Returns of bank-owned versus other funds over the sample period
This figure shows the average returns of all bank-owned versus all other funds over the sample period.
34

Figure 8: Differences in Reasons for Recommendations
This figure shows differences in reasons for the recommendations of bank-owned versus other fund products.
35

Figure 9: Stylized Differences in Financial Wealth as a result of Fund Selection
This figures shows the result of a stylized calculation of the financials wealth as a result of a bank-owned versus
own investment approach. The total expense ratio of 2.2% represents the TER of the most recommended
bank-owned fund. The ter of 1.18% reflects a combined solution with the same risky share based on the
combination of a pure equity and a bond fund. Return is fixed to 6% per year for both funds.
36
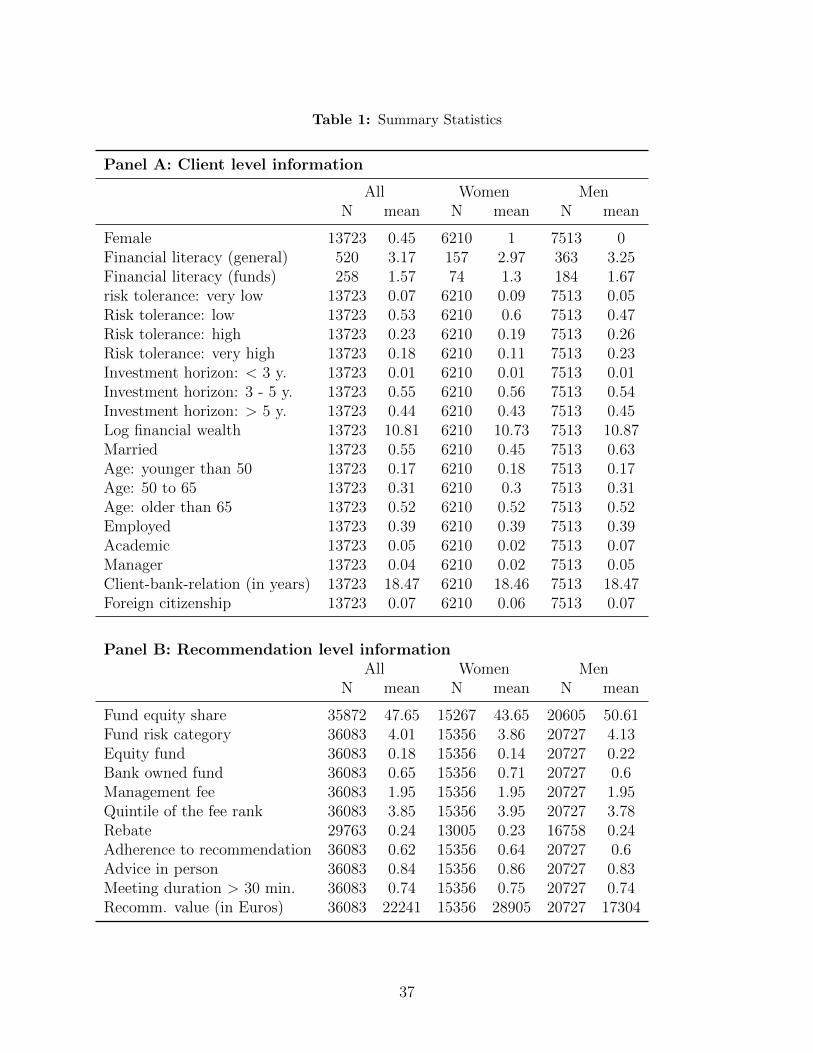
Table 1: Summary Statistics
Panel A: Client level information
All Women MenN mean N mean N mean
Female 13723 0.45 6210 1 7513 0Financial literacy (general) 520 3.17 157 2.97 363 3.25Financial literacy (funds) 258 1.57 74 1.3 184 1.67risk tolerance: very low 13723 0.07 6210 0.09 7513 0.05Risk tolerance: low 13723 0.53 6210 0.6 7513 0.47Risk tolerance: high 13723 0.23 6210 0.19 7513 0.26Risk tolerance: very high 13723 0.18 6210 0.11 7513 0.23Investment horizon: < 3 y. 13723 0.01 6210 0.01 7513 0.01Investment horizon: 3 - 5 y. 13723 0.55 6210 0.56 7513 0.54Investment horizon: > 5 y. 13723 0.44 6210 0.43 7513 0.45Log financial wealth 13723 10.81 6210 10.73 7513 10.87Married 13723 0.55 6210 0.45 7513 0.63Age: younger than 50 13723 0.17 6210 0.18 7513 0.17Age: 50 to 65 13723 0.31 6210 0.3 7513 0.31Age: older than 65 13723 0.52 6210 0.52 7513 0.52Employed 13723 0.39 6210 0.39 7513 0.39Academic 13723 0.05 6210 0.02 7513 0.07Manager 13723 0.04 6210 0.02 7513 0.05Client-bank-relation (in years) 13723 18.47 6210 18.46 7513 18.47Foreign citizenship 13723 0.07 6210 0.06 7513 0.07
Panel B: Recommendation level informationAll Women Men
N mean N mean N mean
Fund equity share 35872 47.65 15267 43.65 20605 50.61Fund risk category 36083 4.01 15356 3.86 20727 4.13Equity fund 36083 0.18 15356 0.14 20727 0.22Bank owned fund 36083 0.65 15356 0.71 20727 0.6Management fee 36083 1.95 15356 1.95 20727 1.95Quintile of the fee rank 36083 3.85 15356 3.95 20727 3.78Rebate 29763 0.24 13005 0.23 16758 0.24Adherence to recommendation 36083 0.62 15356 0.64 20727 0.6Advice in person 36083 0.84 15356 0.86 20727 0.83Meeting duration > 30 min. 36083 0.74 15356 0.75 20727 0.74Recomm. value (in Euros) 36083 22241 15356 28905 20727 17304
37

Table 2: Differences in product recommendations for male and female clients
The dependent variables are: Col (1) an indicator equal to one if the recommendation is an equity fund, Col(2) and (4) the equity share of the recommended fund, Col (3) and (5) the risk category of the recommendedfund, (6) and indicator equal to one if the recommendation is one of the bank’s own balanced funds. Standarderrors clustered by client in parentheses. */**/*** denote significance at the 10/5/1%-level.
(1) (2) (3) (4) (5) (6)VARIABLES Equity fund Equity share Risk cat. Equity share Risk cat. Bank fund
Female -0.02*** -1.69*** -0.08*** -2.44*** -0.10*** 0.03***(0.00) (0.39) (0.01) (0.37) (0.01) (0.01)
Risk tol. very low [Ref.]Risk tol. low 0.05*** 12.90*** 0.71*** 5.25*** 0.42*** 0.16***
(0.01) (0.75) (0.03) (0.77) (0.03) (0.01)Risk tol. high 0.14*** 25.98*** 1.17*** 18.62*** 0.85*** 0.06***
(0.01) (0.84) (0.03) (0.85) (0.03) (0.01)Risk tol. very high 0.29*** 36.72*** 1.50*** 29.31*** 1.18*** -0.08***
(0.01) (0.92) (0.03) (0.90) (0.03) (0.02)ln (value of recomm.) -0.05*** -4.01*** -0.17*** -3.43*** -0.12*** 0.04***
(0.00) (0.13) (0.00) (0.12) (0.00) (0.00)ln (financial wealth) 0.01*** 0.86*** 0.04*** 1.15*** 0.04*** -0.02***
(0.00) (0.14) (0.01) (0.13) (0.00) (0.00)Married 0.01* 0.33 0.00 0.64* 0.01 -0.02***
(0.00) (0.39) (0.01) (0.37) (0.01) (0.01)Employed -0.00 0.06 0.01 -0.31 -0.00 0.00
(0.01) (0.60) (0.02) (0.56) (0.02) (0.01)Academic 0.03** 1.70* 0.08** 1.88** 0.07** -0.03*
(0.01) (0.99) (0.03) (0.94) (0.03) (0.02)Manager 0.03** 1.86 0.06 2.60** 0.05 -0.06***
(0.01) (1.16) (0.04) (1.08) (0.04) (0.02)Client-bank-relat. -0.00 -0.01 -0.00 -0.01 -0.00 0.00**(in years) (0.00) (0.02) (0.00) (0.02) (0.00) (0.00)Foreign citizen 0.01 -0.45 -0.02 -0.15 -0.01 -0.01
(0.01) (0.84) (0.03) (0.82) (0.03) (0.01)Advice by phone [Ref.]Personal advice -0.03*** -0.94* -0.04* -2.62*** -0.08*** 0.06***
(0.01) (0.57) (0.02) (0.53) (0.02) (0.01)Meeting duration: 0.05*** 4.10*** 0.17*** 3.34*** 0.10*** -0.04***over 30 min (0.01) (0.45) (0.02) (0.41) (0.01) (0.01)Constant 0.47*** 52.24*** 4.22*** 68.25*** 4.49*** 0.14**
(0.04) (3.42) (0.15) (2.46) (0.09) (0.06)
Age Group Dummies X X X X X XMonth Fixed Effects X X X X X XAdvisor Fixed Effects X X X X X X
Observations 36,083 35,872 36,083 31,840 31,919 36,083R-squared 0.36 0.36 0.40 0.48 0.50 0.43Adjusted R-squared 0.26 0.27 0.30 0.39 0.41 0.34
38

Table 3: Differences in Fund Fees by Gender
The dependent variable fee is the management fee quintile within a given fund risk category. Standard errorare reported in parentheses. */**/*** denote significance at the 10/5/1%-level.
(1) (2) (3)VARIABLES Fee Fee Fee
Female 0.08*** 0.03* -0.03**(0.02) (0.02) (0.01)
Bank own fund 2.00***(0.01)
Risk tol. very low [Ref.]Risk tolerance low 0.46*** 0.14***
(0.03) (0.03)Risk tol. high 0.41*** 0.29***
(0.04) (0.03)Risk tol. very high 0.08** 0.25***
(0.04) (0.03)ln (value of recom.) 0.06*** -0.01***
(0.01) (0.00)ln (financial wealth) -0.03*** 0.01**
(0.01) (0.00)Married -0.05*** -0.01
(0.02) (0.01)Employed 0.04* 0.04**
(0.02) (0.02)Academic -0.05 -0.00
(0.04) (0.03)Manager -0.07 0.04
(0.04) (0.03)Client-bank-rel. 0.00 -0.00
(0.00) (0.00)Foreign citizen -0.02 0.00
(0.04) (0.02)Advice by phone [Ref.]Personal advice 0.11*** -0.01
(0.02) (0.02)Meeting duration -0.06*** 0.03**longer than 30 min (0.02) (0.01)
Age Group Effects X XMonth Fixed Effects X X XAdvisor Fixed Effects X X XConstant 3.37*** 2.78*** 2.51***
(0.13) (0.15) (0.12)
Observations 36,083 36,083 36,083R-squared 0.28 0.3 0.63Adjusted R-squared 0.175 0.195 0.569
39

Table 4: Rebates on fund purchases
Panel A Rebate is an indicator equal to one if a client received a rebate on the upfront fee on a mutualfund purchases (load). Specification (1) to (4) include all fund purchases, specification (5) include purchasesof the 50 most frequently recommended funds, and specification (6) contains only purchases of funds thatare not under the bank’s own management. Standard errors are reported in parentheses. */**/*** starsdenote significance at the 10/5/1%-level.
(1) (2) (3) (4) (5) (6)VARIABLES rebate rebate rebate rebate rebate rebate
Female -0.02** -0.02** -0.02** -0.02** -0.02** -0.04**(0.01) (0.01) (0.01) (0.01) (0.01) (0.02)
ln (value of the recommendation) 0.06*** 0.06*** 0.06*** 0.06***(0.00) (0.00) (0.00) (0.01)
Inv. Horizon: <3y [Ref.]Inv. Horizon: 3y to 5y 0.03 0.03 0.03 0.05
(0.04) (0.04) (0.05) (0.07)Inv. Horizon: > 5y 0.04 0.04 0.04 0.06
(0.05) (0.05) (0.05) (0.07)Risk tolerance very low [Ref.]Risk tolerance low 0.01 0.01 0.00
(0.02) (0.02) (0.03)Risk tolerance high -0.01 -0.01 -0.04
(0.02) (0.02) (0.04)Risk tolerance very high -0.02 -0.01 -0.05
(0.02) (0.02) (0.04)ln (financial wealth) 0.00 0.00 -0.00
(0.00) (0.00) (0.00)Married 0.01 0.01 0.02
(0.01) (0.01) (0.02)Client-bank-relation 0.00 0.00 -0.00
(0.00) (0.00) (0.00)Foreign citizen -0.06*** -0.06*** -0.07*
(0.02) (0.02) (0.04)Advice by phone [Ref.]Personal advice 0.01 0.01 -0.00
(0.01) (0.01) (0.02)Duration of the meeting -0.01 -0.01 -0.01longer than 30 min (0.01) (0.01) (0.02)Constant 0.23*** 0.23*** -0.34*** -0.38*** -0.31*** -0.18
(0.04) (0.07) (0.09) (0.09) (0.10) (0.13)Controls: age group, employment X X XMonth fixed effects X X X X X XFund (ISIN) fixed effects X X X X X
Observations 21,785 21,785 21,778 21,778 20,510 7,492R-squared 0.35 0.38 0.41 0.41 0.41 0.51Adjusted R-squared 0.2 0.23 0.26 0.26 0.26 0.31
40

Table 5: Following Financial Advice
This table reports the effect of financial literacy and various covariates on following financial advice using OLSregressions. Adherence is measured on the basis of the recommendations implemented after a meeting witha financial advisor . Financial literacy is measured by a dummy indicating high financial literacy based onsurvey questions. Additional controls are the same as in our previous models. Standard errors are clusteredat the client level and reported in parentheses.*/**/*** stars denote significance at the 10/5/1%-level.
(1) (2) (3) (4)VARIABLES adherence adherence adherence adherence
Financial literacy -0.08(0.10)
Fund literacy -0.75**(0.36)
Financial literacy*female -0.30*(0.17)
Financial literacy*male 0.06(0.11)
Fund literacy* female -0.79**(0.35)
Fund literacy*male -0.43(0.36)
Female -0.05 -0.11 0.05 -0.04(0.08) (0.15) (0.10) (0.18)
Controls X X X XMonth fixed effects X X X XMundlak correction X X X X
Observations 1,342 675 1,342 675R-squared 0.08 0.17 0.08 0.17Adjusted R-squared 0.05 0.11 0.05 0.11
41

Table 6: Following Financial Advice - SAVE data
This table reports the effect of financial literacy and various covariates on following financial advice usingOLS regressions. Following behavior is measured on a self-assessed survey measure on a scale from 0 to10. Additional controls are age, education, married, net income, financial wealth, previous consultation ofa financial advisor, cognition, risk aversion. Standard errors are reported in parentheses. */**/*** starsdenote significance at the 10/5/1%-level.
(1) (2)Female -0.08 -0.01
(0.168) (0.623)Advanced financial literacy -0.18**
(0.083)Basic financial literacy 0.02
(0.096)Advanced financial literacy x female -0.30***
(0.107)Advanced financial literacy x male 0.00
(0.119)Basic financial literacy x female 0.11
(0.13)Basic financial literacy x male -0.14
(0.137)F-test: advanced financial literacy x female F( 1, 626) = 3.72= advanced financial literacy x male Prob > F = 0.0542F-test: basic financial literacy x female F( 1, 626) = 1.69= basic financial literacy x male Prob > F = 0.1944N 649 649R-sq 0.034 0.040
42

Table 7: Catering to client requests?
Bank-owned fund is an indicator equal to one if the recommended purchase is a bank-owned balanced fund.Adherence is an indicator if the recommendation was implemented within 30 days. Standard errors arereported in parentheses. */**/*** stars denote significance at the 10/5/1%-level.
(1) (2)VARIABLES bank own fund adherence
Bank own fund*female 0.00(0.01)
Bank own fund 0.03***(0.01)
Female 0.03*** 0.02(0.01) (0.01)
Risk tolerance very low [Ref.]Risk tolerance low 0.16*** 0.08***
(0.01) (0.02)Risk tolerance high 0.06*** 0.09***
(0.02) (0.02)Risk toleance very high -0.09*** 0.06***
(0.02) (0.02)ln (value of the recommendation) 0.04*** 0.01***
(0.00) (0.00)ln (financial wealth) -0.02*** -0.01***
(0.00) (0.00)Married -0.01* -0.02**
(0.01) (0.01)Client bank relationship in years 0.00** -0.00
(0.00) (0.00)Foreign citizen -0.01 -0.02
(0.02) (0.02)Advice by phone [Ref.]Personal advice 0.05*** 0.07***
(0.01) (0.01)Duration of the meeting -0.04*** 0.00longer than 30 min (0.01) (0.01)Constant 0.13* 0.33***
(0.07) (0.07)
Controls: Age groups, employment X XAdvisor fixed effects X XMonth fixed effects X X
Observations 26,129 36,083R-squared 0.45 0.26Adjusted R-squared 0.35 0.14
43

Table 8: Results by advisor gender
(1) (2) (3) (4) (5) (6)VARIABLES Equity fund Equity fund Equity share Equity share risk cat. risk cat.
Female Male Female Male Female Male
female 0.00 -0.03*** -0.39 -2.61*** -0.03 -0.12***(0.01) (0.01) (0.55) (0.53) (0.02) (0.02)
Controls X X X X X XMonth fixed effects X X X X X XAdvisor fixed effects X X X X X XConstant 0.40*** 0.70*** 49.35*** 62.77*** 3.63*** 4.75***
(0.05) (0.05) (3.87) (4.93) (0.16) (0.15)Observations 15,384 20,632 15,354 20,451 15,384 20,632R-squared 0.36 0.36 0.4 0.35 0.43 0.39Adjusted R-squared 0.234 0.274 0.282 0.260 0.313 0.303
(7) (8) (9) (10) (11) (12)VARIABLES bank own fund bank own fund fee fee rebate rebate
Female Male Female Male Female Male
female 0.01 0.03*** -0.00 0.05** -0.02 -0.02*(0.01) (0.01) (0.02) (0.02) (0.01) (0.01)
Controls X X X X X XMonth fixed effects X X X X X XAdvisor fixed effects X X X X X XISIN fixed effects X XConstant 0.35*** 0.06 2.85*** 2.59*** -0.54*** -0.43***
(0.06) (0.05) (0.18) (0.15) (0.19) (0.11)Observations 15,384 20,632 15,384 20,632 9,470 12,261R-squared 0.41 0.434 0.33 0.29 0.44 0.42Adjusted R-squared 0.296 0.359 0.191 0.192 0.246 0.284
44

Online Appendix: Gender Differences in Financial Advice
Tabea Bucher-Koenen1 Andreas Hackethal2 Christine Laudenbach3
Johannes Koenen4 Annika Weber5
1Contact: Tabea Bucher-Koenen, ZEW - Leibniz Centre for European Economic Research, MannheimUniversity, MEA and Netspar, [email protected]
2Goethe University Frankfurt and SAFE, [email protected] University Frankfurt, [email protected] Econ, [email protected] University Frankfurt, [email protected]
1

A Additional figures
Figure A1: Distribution of the Protocols over Calendar Months
This figures shows the the number of protocols in our sample over calendar months.
Panel A: Distribution of the number of meetings by client0
510
1520
25Pe
rcen
t
0 5 10 15 20Number of Meetings
Female Clients Male Clients
Panel B: Distribution of Protocols over Calendar Month
0
1,000
2,000
3,000
Num
ber o
f Pro
toco
ls
Jan Feb Mar Apr May Jun Jul Aug Sep Oct Nov Dec
2

Figure A2: Variation in Product Recommendations by Gender
This figures shows the cumulative distribution of distinct product recommendations. On the x-axis securities
(identified by their ISIN) are ordered by their frequency of occurrence in the data (equally weighted). The
vertical dashed line intersects with the distributional graph at the point of the 10 (20, 30, 40, 50) most
recommended securities in the sample.
Variation in product recommendations0
.2.4
.6.8
Perc
ent
0 10 20 30 40 50ISINs recommended ordered by frequency (from high to low)
3

B Additional Tables
Table B1: General financial literacy questions
The table presents the exact wording of the four general financial literacy questions along with their answerformat.
Concept Question text German original
Compound interest Suppose you had EUR 100 in a savings accountand the interest rate was 2% per year. After 5years, how much do you think you would havein the account if you left the money to grow?a) More than EUR 102, b) Exactly EUR 102,c) Less than EUR 102, d) Do not know
Angenommen, ein Sparguthaben von 100 EURwird mit 2% pro Jahr verzinst. Was mei- nenSie: Wie viel Guthaben weist das Sparkontonach 5 Jahren auf? a) Mehr als EUR 102, b)Genau EUR 102, c) Weniger als EUR 102, d)Ich weiß es nicht, e) Keine Angabe
Inflation Imagine that the interest rate on your savingsaccount was 1% per year and inflation was 2%per year. After 1 year, how much would yoube able to buy with the money in thisaccount? a) More than today, b) Exactly thesame, c) Less than today, d) Do not know
Angenommen, die Verzinsung eines Spar-kontos betragt 1% pro Jahr und die Infla-tionsrate betragt 2% pro Jahr. Was glau- benSie: Konnte man nach einem Jahr mit demGuthaben des Sparkontos genau- so viel, mehroder weniger als heute kaufen? a) Mehr alsheute, b) Genauso viel, c) Weniger als heute,d)Ich weiß es nicht, e) Keine Angabe
Diversification Please tell me whether this statement is true orfalse. “Buying a single company’s stock usuallyprovides a safer return than a stock mutualfund.” a) True, b) False, c) Do not know
Ist die folgende Aussage wahr oder falsch:“Die Anlage in Aktien eines einzelnenUnternehmens ist weniger riskant als dieAnlage in einem Fonds mit Aktien ahnlicherUnternehmen.” a) Wahr, b) Falsch, c) Ichweiß es nicht, d) Keine Angabe
Product risk Please rank the following investment productsaccording to their financial risk involved (inascending order, starting with the one with thelowest risk) Correct ranking: 1. Savingsaccount 2. Corporate bond 3. Stock;alternatively, clients yould choose ”Do notknow”
Bitte ordnen Sie die vier untenstehendenAnlageformen nach ihrem durchschnitt- lichenRisiko (in aufsteigender Reihen- folge,beginnend mit dem Produkt mit demgeringsten Risiko). Korrekte Reihen- folge: 1.Sparkonto 2. Unternehmensan- leihe 3. Aktie;alternative Antwortmo- glichkeit: ”Ich weiß esnicht”
4

Table B2: Fund literacy questions
The table presents the exact wording of the three fund literacy questions along with their answer format.
Concept Question text German original
Fund fees: actively
managed vs.
passive funds
Please state whether this statement is true or
false. “ETFs and other passive funds on
average charge higher annual fees compared to
actively managed funds.” a) True, b) False, c)
Do not know
Ist die folgende Aussage wahr oder falsch:
“ETFs und andere passive Fonds verlangen in
der Regel hohere jahrliche Gebuhren als aktiv
gemanagte Investmentfonds.” a) Wahr, b)
Falsch, c) Ich weif es nicht.
Fund fees: Size of
upfront charge
In many cases, a upfront fee is charged upon
purchase of an actively managed investment
fund. In what range does this fee fall for an
average actively managed equity fund? a)
0-0.5% of the amount invested, b) 1-2% of the
amount invested, c) 4-6% of the amount
invested, d) 8-10% of the amount invested, e) I
do not know the average size of this feet, f) I
did not know that there is such a fee
Beim Kauf von aktiv gemanagten Invest-
mentfonds fallt haufig eine Ausgabege- buhr
an. In welcher Großenordnung liegt dieser
sogenannte Ausgabeaufschlag regu- lar fur
einen durchschnittlichen, aktiv gemanagten
Aktienfonds? a) 0-0,5% der Anlagesumme, b)
1-2% der Anlagesumme, c) 4-6% der
Anlagesumme, d) 8-10% der Anlagesumme, e)
Ich weiß nicht wie hoch diese Gebuhr ist, f) Ich
wusste nicht, dass eine solche Gebuhr existiert
Mutual fund Which one of the following statements is NOT
a possible advantage of investing in investment
funds from the perspective of an investor? a)
The possibility to invest diversified, b) The
possibility to invest in special markets, c)The
possibility to invest small amounts of money,
d) The possibility to participate in the choice
of individual stocks, e) Do not know.
Bei welchem der folgenden Punkt handelt es
sich aus der Sicht eines Anlegers NICHT um
einen moglichen Vorteil eines Fonds? a) Die
Moglichkeit diversifiziert zu investieren, b) Die
Moglichkeit in spezielle Markte zu investieren,
c) Die Moglichkeit mit kleinen Betragen zu
investieren, d) Die Moglichkeit bei der
Titelauswahl mitzuentscheiden, e)Ich weiß es
nicht
5

Table B3: Summary Statistics SAVE
Full sample Conditional on adviceVariable N Mean Std.Dev. N Mean Std.Dev.Female 1,910 0.51 0.50 649 0.47 0.50Age 1,910 54.89 15.14 649 55.58 15.04Low education 1,910 0.10 0.31 649 0.08 0.28Intermediate education 1,910 0.71 0.45 649 0.71 0.46High education 1,910 0.18 0.38 649 0.21 0.41Married 1,910 0.64 0.48 649 0.74 0.44Net income (monthly in Euros 2009) 1,910 2383 1604 649 2666 1494Financial wealth (in Euros 2009) 1,910 45,843 116,040 649 79,291 179,661Consulted advisor in 2009 1,910 0.34 0.47 649 1.00 0.00Consulted advisor in 2008 1,910 0.35 0.48 649 0.65 0.48Following of advice 649 6.16 1.99Advanced financial literacy 1,910 2.41 1.46 649 2.78 1.31Basic financial literacy 1,910 2.90 1.24 649 3.13 1.10Cognition 1,910 1.21 1.07 649 1.38 1.06Risk aversion 1,910 2.25 2.56 649 2.48 2.47
6