(3-5) inulin. · sodium thiosulfate as a measure of extracellular fluid in 120 ml. of sterile...
TRANSCRIPT

THE VOLUMEOF DISTRIBUTION OF SODIUMTHIOSULFATEAS A MEASUREOF THE EXTRACELLULARFLUID SPACE1
By R. H. CARDOZO2 AND I. S. EDELMAN3
(From the Laboratory for Surgical Research, Peter Bent Brigham Hospital and the HarvardMedical School, Bo.ton, Mass.)
(Submitted for publication September 11, 1951; accepted December 17, 1951)
The importance of total body fluid and electro-lytes and their distribution in the body cell masshas been increasingly emphasized in the care ofacutely and chronically ill patients. In order todetermine distribution of water and electrolytes, aconvenient and accurate technique for the estima-tion of the extracellular fluid space is essential.
Moore (1) has demonstrated that the chemicaldissection of the patient (to determine total bodycomposition) is feasible by the dilution of radio-active and stable isotope tracers used in conjunc-tion with a means for measuring the extracellularfluid. While techniques such as deuterium dilu-tion, tritium dilution, and antipyrine dilution forthe in vivo measurement of total body water can bechecked for absolute accuracy against desiccationand specific gravity measurements (2), no suchcriterion for the accuracy of extracellular fluidmeasurements is available. Evaluation of extra-cellular fluid techniques must depend upon theirreproducibility and compatibility with microana-tomical studies and estimations of the volume ofdistribution of normal extracellular constituents.
In addition to interstitial and plasma water, theextracellular compartment must be considered toinclude the cerebrospinal fluid, water in the gastro-intestinal tract, in glandular lumina, and bone ma-trix water. No technique is at present availablewhich has been proven to measure the absolutevolume of the entire compartment. Indeed atcertain points the exact boundaries of the "com-
1 This work was carried out under a grant from theAtomic Energy Commission and with the generous as-sistance of the Upjohn Company and Winthiop-Stearns,Inc.
2Assistant in Surgery, Peter Bent Brigham Hospitaland Research Fellow in Surgery, Harvard Medical School,Boston, Massachusetts.
8 Research Fellow of the American Heart Association,Peter Bent Brigham Hospital and Research Associatein Surgery, Harvard Medical School, Boston, Massachu-setts.
partment" defy anatomical definition. In the ab-sence of an absolute standard for extracellular fluidmeasurement, reasonable criteria for assessinga particular method would be that it must (a) in-clude a significant fraction of the compartment,(b) vary in proportion to changes in the extra-cellular space, (c) be insensitive to changes incell permeability, and (d) be reproducible andtechnically convenient.
Previous studies by Newman, Gilman, andothers (3-5) employing sodium thiosulfate havedemonstrated (a) that its equilibrium volume ofdistribution is in the range of the extracellularfluid volume, (b) that its rate of disappearanceafter equilibrium of distribution is proportionalto its concentration, (c) that it diffuses rapidly,and (d) that it is metabolized slowly and at anexponential rate (4).
These properties suggested that the thiosulfateion would prove to be a suitable and convenientmeasure of the extracellular fluid by a techniquenot requiring either urine collections or a long pe-riod of constant infusion such as is necessary withinulin.
The present study was undertaken to examinethe volume of distribution of sodium thiosulfateobserved after a brief single injection and the col-lection of several serial blood samples over ashort interval of time.
METHODS
Seven adult mongrel dogs ranging from 8.5-14.4 kgm.in weight were used in the preliminary experiments.Normal healthy male adult humans, ages 18-30, werestudied for the arterio-venous difference, reproducibilityand erythrocyte penetration studies, and hospital patientsas specifically described in the next section were studiedin febrile and edema states.
Twenty-five to 30 ml. of sterile 10% commercial hy-drated sodium thiosulfate (Na2S20 5H20)' were in-jected into the dogs in one to two minutes. For humanstudies, 12 gm. of sterile sodium thiosulfate were diluted
'Sulfactol, Winthrop-Stearns, Inc., New York, N. Y.
280

SODIUM THIOSULFATE AS A MEASUREOF EXTRACELLULARFLUID
in 120 ml. of sterile pyrogen free water, 20 ml. with-drawn for determination of density and titration, and theremaining material administered by infusion after carefulweighing to 0.01 gm. On completion of the 10-12 minuteinfusion, the infusion set was washed through three timeswith saline. Studies on a fourth rinse reveal less than0.01% of the dose remaining.
Four to 12 blood samples were withdrawn from an in-dwelling needle (Cournand) in the femoral artery andvenous blood from the femoral vein in dogs and theantecubital veins in man.
Samples in the preliminary studies were analyzed ac-
cording to the indirect iodometric macro-method ofNewman (3). In later studies it was found that a micro-technique afforded equal accuracy and required much lessblood, thus permitting more samples and better defi-nition of the curve without excessive blood loss. Thistechnique 5 was modified from that suggested by Newman.
Calculation of the thiosulfate space
Venous serum concentrations are plotted semilogarith-mically against the mid-time of sample collection and theequilibrium concentration obtained by extrapolation to thetime of commencement of infusion (zero time). Theplotted values must demonstrate linearity within thelimits of error of the experiment or extrapolation is in-valid. The extrapolated concentration is divided into thedose injected to obtain the volume of distributions
RESULTS
1. Accuracy of chemical technique
Duplicate samples were reproducible within an
average range of 4 parts per 1,000. Recovery fromplasma by this method averaged 96.5%o with a
range of 93.3-100%o. Recovery from water aver-
aged 98%o ranging from 95-100%o.
6 See Appendix II.
2. Expected accuracy in absolute quantitiesAccuracy in absolute quantities was estimated
by a "dummy" measurement of 7,052 ml. Thiswas done to indicate whether significant changes involume of distribution might be masked by the er-
ror of the technique. Calculated values in quin-tuplicate averaged 7,265.3 + 58.7 ml. This is an
error of 213 ml. or 3.0%.
3. Erythrocyte penetration
Studies on erythrocytes incubated in vitro for90 minutes at room temperature with oxygenationand gentle agitation indicated complete penetra-tion of red cell water by sodium thiosulfate.
Studies in vivo were made by drawing blood 70minutes after injection of thiosulfate, determiningthe hematocrit corrected for 3%o trapped plasma,and splitting the sample, one-half of which was
used for calculating plasma concentration. Theother half was used for determining whole bloodconcentration, after hemolysis induced by alternatefreezing and thawing. Table I summarizes thedata obtained. Since at equilibrium of distribu-tion, with complete penetration, the concentrationof thiosulfate in both plasma water and red cellwater will equal the concentration in whole bloodwater, the ratio of thiosulfate concentration inerythrocyte water to thiosulfate concentration inwhole blood water was used as the index of pene-
tration. In these experiments the ratios so ob-tained were 0.92, 0.42, and 0.62.
4. Linearity of total clearance
Preliminary studies were made on dogs employ-ing an injection time of one to two minutes with
TABLE IPenetration of thiosulfate into erythrocytes in vivo
Corr. Plasma Whole blood Plasma* water Wholet blood ErythrocytetSubject hematocrit SO, s20,- S203- water water EWT/WBWTIS1-a SI0a
mgm./mI. mgm./ml. mgm./ml. mgm./ml. mgm./ml.D. H. 36 0.133 0.116 0.145 0.140 0.128 0.92D. H. 39 0.142 0.100 0.154 0.121 0.051 0.42J. R. 47.5 0.083 0.058 0.090 0.073 0.045 0.62
* Plasma water thiosulfate concentration = concentration of thiosulfate in plasma . 0.92.t Whole blood water thiosulfate concentration = concentration of thiosulfate in whole blood +. (0.92 [plasma
volume] + 0.67 [red cell volume]).t Erythrocyte water thiosulfate concentration = (thiosulfate content of 1 ml. whole blood - thiosulfate content
in plasma fraction of 1 ml. whole blood) . 0.67 X red cell volume per ml. of whole blood.§ EWT/WBWT= ratio of the concentration of thiosulfate in erythrocyte water to the concentrationin whole blood
water.
281
2R. H. CARDOZOAND I. S. EDELMAN
Arterial Disappearance Curveof Thiosulfate
E t". .20
E
2~~~~~~~~~*g0.10
.09
qg.08
.07
1..0
.04-
.03
.02
.0110 20 30 40 50 60
Minutes
FIG. 1
Subject was a 13.0 kgm. dog. Twenty-five ml. 10%Na2S2Os 5H2O were injected into the femoral vein in one
minute. Samples were withdrawn from the femoral ar-
tery through an indwelling (Cournand) needle and serum
thiosulfate concentrations plotted against time. Curveanalysis was by standard subtraction technique (11).
12 samples obtained from one to 70 minutes afterthe beginning of injection. In human subjectsthiosulfate was administered by infusion lastingeight to 12 minutes and four to 12 arterial and/orvenous samples were obtained. In 15 curves on
seven dogs and 18 curves on 14 humans, linearitywas demonstrated within the limits of error of theexperiment. Typical examples of the resultingcurves are presented in Figures 1 and 2.
TABLE II
Comparison of thiosulfate space determined simultaneouslyfrom arterial and venous blood levels
Arterial Venous Difference
SubjectLiters %b Liters %body Liters %body
weight weight weight
R. H. C. 10.88 17.5 10.00 16.1 -0.88 -1.4R. H. C. 11.29 18.5 10.86 17.8 -0.45 -0.7R. H. 10.50 13.3 10.33 13.0 -0.17 -0.3J. R. 11.88 17.8 11.88 17.8 0.00 -0.0T. D. B. 13.83 18.1 13.17 17.2 -0.66 -0.9
Mean 11.68 18.0 11.05 17.2 0.63 -0.8
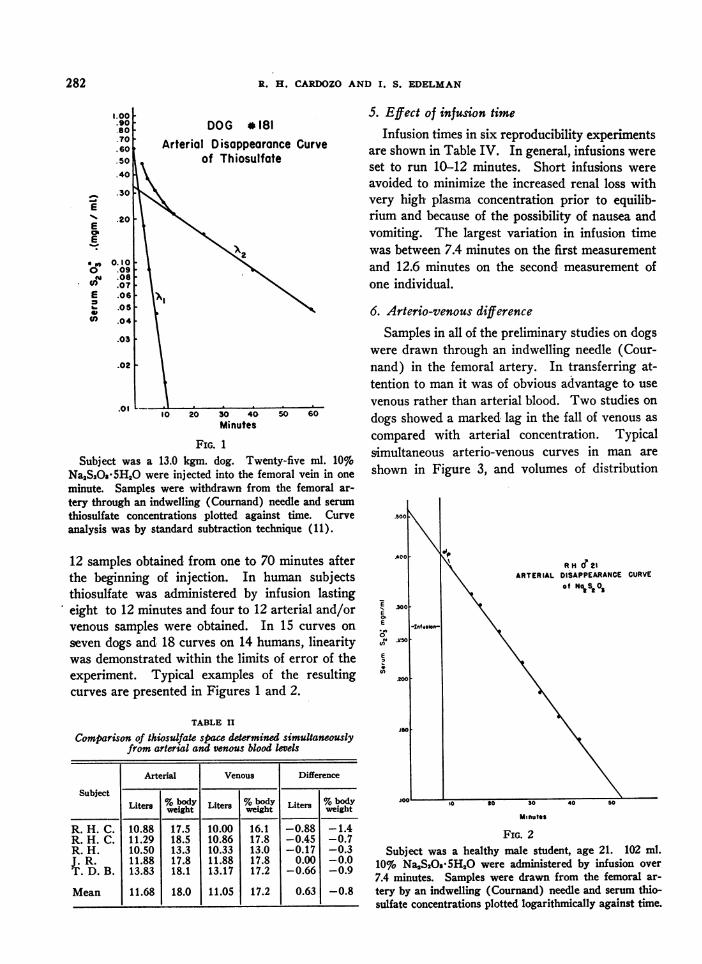
S. Effect of infusion timeInfusion times in six reproducibility experiments
are shown in Table IV. In general, infusions wereset to run 10-12 minutes. Short infusions wereavoided to minimize the increased renal loss withvery high plasma concentration prior to equilib-rium and because of the possibility of nausea andvomiting. The largest variation in infusion timewas between 7.4 minutes on the first measurementand 12.6 minutes on the second measurement ofone individual.
6. Arterio-venous difference
Samples in all of the preliminary studies on dogswere drawn through an indwelling needle (Cour-nand) in the femoral artery. In transferring at-tention to man it was of obvious advantage to usevenous rather than arterial blood. Two studies ondogs showed a marked lag in the fall of venous ascompared with arterial concentration. Typicalsimultaneous arterio-venous curves in man areshown in Figure 3, and volumes of distribution
.5000
ACORH d?21
ARTERIAL DISAPPEARANCE CURVEof Nt Sit 0
.300
OC
0E0M .050
200
J50
0 I10 t0 30 40 s0
Minutes
FIG. 2Subject was a healthy male student, age 21. 102 ml.
10% Na2S2Qs 5H2O were administered by infusion over7.4 minutes. Samples were drawn from the femoral ar-tery by an indwelling (Cournand) needle and serum thio-sulfate concentrations plotted logarithmically against time.
282

SODIUM TIEIOStJLFATV AS A MEASUREOP EXTRACELLULARFLUID
TABLE III
Volume of distribution of sodium thiosulfate in dogs
Dog no. Body weight Thiosulfate space
kgm. lites %body weight195 8.5 2.0 23.6203 14.4 4.1 28.1204 13.7 3.6 27.2223 12.8 3.0 23.2224 12.4 3.1 24.6181 11.5 2.3 20.3182 12.7 3.1 24.4
Mean 12.4 3.0 24.4
determined simultaneously from arterial and ve-
nous samples in four healthy young adult malehumans are tabulated in Table II. The average
volume of distribution was 0.63 liter (0.8%o ofbody weight) smaller by venous concentration.The largest discrepancy in volume distributionwas 0.9 liter or 1.4%o of the body weight. At anyone time the venous concentration of thiosulfateis higher than the arterial after distribution equil-ibrium has taken place (Figure 3). In addition,although not marked in every case, the venous
concentration fell more slowly than the arterial.This discrepancy in rate of fall of thiosulfate con-
centration is less evident in the experiment givenin Figure 3 than in some of the others studied.
7. Volume of distribution and reproducibility
The volumes of distribution of thiosulfate as de-termined in seven dogs under similar conditionsare presented in Table III. The average valuewas 3 liters or 24.4%o of body weight. Table IVshows the volumes of distribution in six healthymale adult humans studied on two occasions atvarious time intervals. As far as possible, subjects
0.500.40
0 30
ok 0.20
010.10
4Infuson T.D.B. OR IS
Thiosulfote Disoppooronce*-Arterial-Spoce 13,825cc 18.1% Body Wt
17% Body WC.u-venous- sace 13,166 cc
10 20 30 40 50 60Minutes
FIG. 3Subject was a healthy male student, age 19. 101 ml.
10% NaS20 5H20 were administered by infusion over
6.9 minutes. Arterial samples were drawn from the fe-moral artery using an indwelling (Cournand) needle.Venous samples were drawn from the antecubital veinsand all serum thiosulfate concentrations plotted logar-ithmically against time.
in a "steady state" were chosen and no illness oc-
curred between measurements. The average thio-sulfate space was 12.2 liters or 16.6%o of bodyweight and the average interval change of 0.42liter or 0.38%o of body weight is smaller than theexpected general error of the measurement.
8. Volumes of distribution in febrile patients
Sensitivity of the thiosulfate ion to changes incell permeability was tested in three hospital pa-
tients with febrile illnesses. Volumes of distribu-tion are presented in Table V. An effort was madeto choose patients free from any chronic underly-ing disease or complication which might affectfluid or electrolyte distribution or kinetics. Allwere adequately hydrated at the time of measure-
ment but were not edematous. Volumes of dis-tribution in these patients were 17.9, 18.4, and15.9%o of body weight.
TABLE IVVolume of distribution and reproducibility of thiosulfate space in adult male humans
First measurement Second measurement
Subject Age DifferenceIf-Body SurfaceTIfu Body SurfacL|Date tin weight area Thiosulfate space Date |s|ion weight area Thiosulfate space
yrs. min. kgm. M liters b. wot. L/M2 mix. kgm. M2 liters b. wt. LIM2 liters b. wt. LIM2R. H. C. 30 12/8/50 13.6 62.2 1.68 10.00 16.1 5.95 1/11/51 16.5 61.1 1.67 10.68 17.8 6.50 +0.68 +1.7 +0.55J. R. 18 1/16/51 11.0 66.8 1.86 11.88 17.8 6.39 2/9/51 10.8 67.6 1.87 11.78 17.4 6.30 -0.10 -0.4 -0.09T. D. B. 19 1/19/51 6.9 76.2 1.99 13.17 17.2 6.62 2/12/51 11.3 75.0 1.97 11.93 15.9 6.06 -1.24 -1.3 -0.56G. C. 18 1/23/51 8.4 82.6 2.06 13.74 16.6 6.67 2/5/51 11.6 82.9 2.07 13.74 16.5 6.64 0.00 -0.1 -0.03F. R. C. 21 1/22/51 12.4 76.7 2.00 12.48 16.3 6.24 2/8/51 11.1 75.2 1.98 11.79 15.7 5.95 -0.69 -0.6 -0.29R. H. 21 1/26/51 12.6 81.2 2.04 13.39 16.5 6.56 3/6/51 7.4 80.6 2.03 12.05 14.9 5.94 -1.3 -1.6 -0.65
Mean 10.8 12.44 16.75 6.41 11.4 12.02 16.37 6.23 -0.42 -0.38 -0.18
283

R. H. CARDOZOAND I. S. EDELMAN
TABLE V
Volume of thiosulfate distribution in febrile patients
Patient Sex Age Diagnosis Temp. range Body weight SsOs space
yrs. OF. kgm. liers %body wt.M. R. F 18 Infectious mononucleosis 103 54.8 10.0 17.9E. C. M 68 Bronchopneumonia 101.8-103.5 63.2 11.5 18.4S. K. M 27 Post-lithotomy fever 101.4-102.4 72.0 11.5 15.9
9. EdemaAs a first step in evaluating the relative ac-
curacy of thiosulfate dilution as a measure of theextracellular fluid volume, patients with obviousedema were studied. Table VI lists the determi-nations carried out in five such patients. In thesesubjects the thiosulfate volume of dilution rangedfrom 14.6 to 20.7 liters, corresponding to 21.5-28.7%o of the body weight. All of these values areconsiderably greater than those found in any ofthe normals. In two of the five subjects the vol-umes obtained were close to twice that obtained inthe normal. In these instances the thiosulfatespace has changed in the same direction and is ofreasonable magnitude based on the clinical ap-pearance of the subjects. It is of interest thatnone of these edematous patients showed thiosul-fate spaces in the "excessive" range (over 35%o ofbody weight) often found in observing the radio-sodium space or thiocyanate space in sick patients.Similarly it is reassuring that they all manifestedincreases of an absolute magnitude comparable tothe volume of clinical edema (diuresis).
DISCUSSION
I. Characteristics of thiosulfate as an "extracel-lular" ion
Sodium thiosulfate was first investigated as anantichemical-warfare agent and was found non-
TABLE VI
Volume of thiosulfate distribution in edematous patients
Patient Sex Age Diagnosis Body ThiosulfatePatientSexAge ~~~weight space
yrs. kgm. litrs %b. wI.M. L. F 37 Lymphedema, 93.2 20.0 21.5
etiology unknownK. R. M. M 42 Malignant hyperten- 68.7 19.8 28.7
sionL. H. F 25 Nephrotic syndrome 59.8 14.6 24.5F. M. M 74 Congsie 67.2 16.3 24.3
J. J. M 70 Chronic nephritis, 96.6 20.7 21.9uremia
toxic even in very large doses, the only untowardeffects observed being nausea and vomiting. Theseappeared when high concentrations were injectedrapidly and were considered due to hypertonicity.It was also observed that the ion appeared in theurine at a rate which suggested that its excretionwas a function of glomerular filtration. Thereafterit was extensively studied as a renal clearance testand found to have a clearance ratio to inulin andcreatinine of 1.0 (both in normals and in renal andcardiac disease states [3-5]). Gilman, Philips,and Koelle (4) suggested and Brun (5) unequivo-cally asserted that the thiosulfate ion was confinedto the extracellular space and not absorbed by therenal tubules. The former (4) calculated volumesof distribution using the amount recovered in theurine while Schwartz, using a constant infusiontechnique, estimated the space in dogs and man(6).
Contrasted with inulin which has a large molecu-lar weight of 5,100 and a slow diffusion coefficientof 0.20/cm.2/day, thiosulfate has a molecularweight of only 135 and diffuses rapidly with a dif-fusion coefficient of 0.68/cm.2/day (7). In thisrespect it lies between inulin and the halides andlight metals whose atomic weights are under 100and which diffuse very rapidly at a rate of ap-proximately 1.4/cm.2 /day (7, 8).
Binding to plasma proteins similar to that whichoccurs with the thiocyanate ion has been investi-gated by Kowalski and Rutstein (9). Their invitro studies indicate that no protein binding ofthiosulfate takes place.
From the data presented in Table I it is ap-parent that significant penetration of thiosulfateinto erythrocyte water occurs after 70 minutes.If penetration does not occur instantaneously, theextrapolation method used will correct for loss intoerythrocyte water.
It is well known that thiosulfate crosses somecell membranes since it cannot be recovered com-
284

SODIUM THIOSULFATE AS A MEASUREOF EXTRACELLULARFLUID
pletely from the urine. In a large series of dogs,Gilman, Philips and Koelle (4) were able to re-rover 70-809%o in the urine by the time the plasmaconcentration had fallen below 1.0 mgm.%o. Indogs with ligated ureters he observed that the slopeof disappearance was linear at 0.05% to 0.109o%per minute and represented about 7%o of the renalclearance. In this laboratory, 65%o of the dose ad-ministered to a normal healthy adult male humanwas recovered by the time the plasma concentrationwas 1.0 mgm.%and only negligible amounts there-after. This suggests that recovery in man may beslightly less than in the dog where extremelyrapid elimination through the kidneys comparedwith the volume of distribution reduces the timeduring which significant metabolism may occur.Gilman and his associates (4) concluded that thio-sulfate degradation occurs primarily during and im-mediately following injection and that after equili-bration only slow destruction occurs. One obser-vation offered in support of this postulation was theexpanding volume of distribution from approxi-mately 35%o of the body weight at 30 minutes to80%b of the body weight at 120 minutes, noted infour dogs and calculated on the basis of the re-tained dose (the difference between the injecteddose and the amount excreted in the urine). Thesedata indicate that metabolism of thiosulfate duringthe post-equilibrium period must account for theexpanding volume of distribution noted. In fact,if one plots their data on semi-logarithmic coordi-nates and extrapolates to zero time, the thiosulfatespace so obtained is approximately 25%o of thebody weight, which agrees well with the valuesobtained in our series (24.4%o of the body weight,cf. Table III) and with those obtained by theseauthors (4) in the same animals using the New-man formula (10). One is therefore forced toconclude that destruction of thiosulfate is uni-form throughout the post-injection period. Thediscrepancy that remains unexplained is that be-tween the rate of degradation of thiosulfate basedon the slow fall in plasma thiosulfate concentrationin the anuric dog and the rate of degradation basedon the expanding volume of distribution during thepost-equilibrium period with intact renal function.
II. The mathematical modelThe volume of distribution of a hypothetical sub-
stance which could be completely and equally
mixed throughout this volume instantly, could beexpressed by:
A=P (1)
V = the volume of distribution,A = the total substance introduced,P = the concentration after mixing.
The volume of distribution of any substancewhich is very rapidly and freely diffusible through-out its volume and which disappears by any routeat a rate proportional to its concentration may bedetermined by plotting its concentration semi-logarithmically against time and extrapolating toits theoretical equilibrium concentration at zerotime for substitution in equation (1).
V= AP at tot (2)
That is, the volume of distribution is equal to theamount of material dissipated into the space di-vided by the concentration which would have oc-curred had it been instantly distributed throughoutthe volume at zero-time. The mathematical justi-fication and experimental basis for equation (2)is implicit in the derivations of Newman, Bordley,and Winternitz (10) which relates the volume ofdistribution of a non-metabolized substance to therenal clearance and the time decrement of thenatural logarithm of the plasma concentration andin the Schwartz (6) modification which takesinto account clearance by all routes.
The primary error involved in applying equa-tion (2) is the renal loss incurred at concentra-tions greater than that accounted for by extrapola-tion during the period of equilibration (Figure 1).For a rapidly diffusible substance equilibrium timeis short enough to make this error insignificant.Employment of such a substance eliminates the nec-essity for constant infusion or urine collections.It permits the use of a substance lost by extrarenalroutes (including metabolism) provided that cellpenetration is slow as compared with the rate ofdistribution in the interstitial fluid. The studiesreported in this paper indicate that sodium thio-sulfate approaches the requirements for the useof this expression.
Examination of Figure 1 reveals that equilibriumoccurs in 10-12 minutes in that the concentrationfalls logarithmically from this time on and that the
285

R. H. CARDOZOAND I. S. EDELMAN
curve may be analyzed into "fast" and "slow" rates,the former probably representing transfer acrossthe capillaries while the latter represents total clear-ance by all routes. The curve may be described bythe general formula (11 ):
C' = Cle-)1t + C2e-3t (3)where C. is the concentration at any time t in serum.
C, is the concentration obtained by extrapolation ofthe rapid component of the curve to time zero.
C2 is the concentration obtained by extrapolation ofthe slow or equilibrium component of thecurve to time zero.
XI is the slope of the rapid component of the curve.X2 is the slope of the equilibrium or slow component
of the curve.
Since AX is much faster than X2, the requirementof rapid distribution as compared to its total clear-ance is met. Further evidence indicating rapidequilibration as compared to total clearance is theclose agreement for thiosulfate volumes of dilutiongiven by simultaneous arterial-venous sampling.If there were a sizeable gradient across the capil-
lary, one would expect significant arterial-venousdifferences.
Study was focussed on the equilibrium disap-pearance rate. The linearity of total clearance asobserved by other investigators (3, 4, 6) was con-firmed.
The single injection technique described in thispaper eliminates the elaborate constant infusionequipment, the long equilibration period, and theaddition of a large volume of fluid added to theextracellular compartment. Like the Schwartztechnique (6), it does not require urine collectionsor bladder washouts and obviates the possible er-rors due to changing urine blank and renal delaytime.
Its sole theoretical disadvantage is the possibleerror due to loss (by all routes) while the concen-tration of thiosulfate in the plasma is in excess ofthe extrapolated equilibrium value.
Validity of the single injection technique is de-pendent on three requirements: (1) The extra-cellular space must remain constant throughout the
.500
400
.300
EP 250
0
2 .200CO
j50
I.
e-lnfusion-4
10
D H. & 18
VENOUS DISAPPEARANCECURVE0- 1/9/51x- 2/2/51
20 30 40 50 60 TO
Minutes
FIG. 4Subject was a healthy male student, age 18. No history of renal or other
disease. 102 ml. 10% NaS208 5HQ were administered by infusion over11.3 minutes. Samples were drawn from the antecubital veins and serumthiosulfate plotted logarithmically against time.
286

SODIUM THIOSULFATE AS A MEASUREOF EXTRACELLULARFLUID
experiment. The small amount of fluid added bythe technique described and the short time re-quired for the measurement tend to insure this.(2) There must be uniform and rapid distributionof the substance throughout the space. This ap-pears to occur in about 10 minutes for the thiosul-fate ion. (3) The substance must be removed fromits volume of distribution by all routes at an ex-ponential rate. This has been shown to occur.
The slopes of decrement (in two studies on onesubject) in which total clearance rate appears tohave been variable are shown in Figure 4. Obvi-ously this curve does not permit extrapolation to azero-time value and it is anticipated that when suchindividuals are encountered clinically they will beat once recognized by the characteristics of thecurve and no attempt made to estimate the volumeof dilution by this method.
III. Evaluation of data and comparison with othertechniques
Comparison of simultaneous arterial and venousrates of disappearance shows a consistent lag inthe rate of fall of venous values, even though thedifference in volume of distribution at zero-timeobtained by extrapolation is insignificant, as de-scribed above. Brun, Hilden, and Raaschou work-ing with diodrast in dogs (12) point out that theA-V difference is due to the presence in the rightventricle of cleared blood from the renal veins.The much greater difference in dogs is explainedby the fact that the ratio of the renal clearance tothe volume of distribution in dogs is 70/3 com-pared with 130/12 in man or almost 2.5 times asgreat in dogs. Hence a far larger part of the vol-ume of distribution is being cleared in dogs per unittime.
The volumes of distribution of thiosulfate indogs and man have been determined in this smallseries to be 24.4%o and 16.6%o of body weight,respectively. The latter figures were reproduciblewithin 2%o of the body weight after a month ormore in a steady state. The lower volumes ob-tained by Schwartz in dogs (17%o of the bodyweight) may be due to a greater fat content inhis animals. Gilman, Philips, and Koelle (4) ob-tained volumes of 22%o of the body weight in dogs,agreeing with our values and Schwartz obtainedvalues of 15.7%o and 19.5%o in two human subjects,agreeing well with our series (Table IV). The
volumes are close to those determined with inu-lin by Gaudino and other investigators (13, 14)of 21-23% for the dog and 13.5-17.5% for man.Turning to the other extracellular dilution indices,chloride, bromide, and sodium are excreted slowlybut are known to enter cells to varying degrees andto be concentrated in certain cellular areas (14-18). The sulfate ion is endogenously produced atvarying and unpredictable rates and is thereforeunsatisfactory (19, 20).
Thiocyanate has been extensively studied as ameasure of the extracellular compartment (21, 22).It diffuses rapidly and is slowly excreted permittinglong equilibration (22). Its volume of distribution(22-27% of body weight) is similar to that forbromide and sodium which are known to have con-siderable intracellular fractions and is considerablylarger than the inulin space where the large mole-cule is presumed to be limited to extracellular areas.Protein binding of thiocyanate has been demon-strated by Scheinberg and Kowalski (23). It isknown to penetrate the red cell and to be concen-trated in saliva and other gastrointestinal secretions(24).
Overman (25) has shown that in febrile statesthe permeability of the cell membrane to thiocya-nate is altered and that its volume of distributionapproaches the total body water. Three studies(reported herein), with thiosulfate in febrile pa-tients, resulted in volumes of distribution in thenormal range; hence it is probable that no grosschanges in cell permeability to thiosulfate occur asa result of fever.
As part of the preliminary evaluation of thistechnique, five patients with obvious edema werestudied. The finding of an increased volume of di-lution in all of these patients supports the conceptsthat by this method an accurate estimate of the ex-tracellular fluid volume can be made.
The final evaluation of this method will dependon the results obtained after wide application bymany workers. Further studies on the rates ofpenetration of thiosulfate into fluid compartmentsand repeat studies in patients with known lossesand/or gains of extracellular fluid are essential.
SUMMARY
A technique for measurement of the extracellularfluid space employing a single brief injection ofsodium thiosulfate and collection of several small
287

R. H. CARDOZOAND I. S. EDELMAN
blood samples over a short period is presented.This method obviates constant infusion and urinecollection. Evidence is presented that sodiumthiosulfate is a suitable substance for the relativemeasurement of the volume of extracellular water.
While there was a consistent lag in the fall ofvenous concentration behind arterial concentra-tion, no significant difference in the volume of dis-tribution obtained by extrapolation was demon-strated.
The volumes of distribution of sodium thiosul-fate in seven dogs and six humans averaged 3liters or 24.4%o of body weight and 12.2 liters or
16.6%o of body weight, respectively.Thiosulfate space in patients with fevers of 102-
103.50 F. were in the normal range and in patientswith edema were well above the normal range.
The volume of distribution of thiosulfate in edema-tous patients was compatible with known increasein weight and clinical estimates of edema fluid.
ACKNOWLEDGMENTS
The authors wish gratefully to acknowledge the sug-
gestions of Mr. R. Ainslie Jamieson of Glasgow who car-
ried out some of the first thiosulfate determinations inthis laboratory and the constructive criticism and sug-
gestions of Dr. Anthony H. James of St. Mary's Hospital,London. Misses Marie MacDonald and Margaret R.Ball assisted in the analytic procedure.
Wewish to express our appreciation to Dr. Francis D.Moore for his support, guidance, and critical evaluationof this study.
SINGLE INJECTION TECHNIQUEFORMEASUREMENT
OF THE VOLUMEOF DISTRIBUTION OF
THIOSULFATE
APPENDIX I
Preparation-(under sterile conditions): Twelve 1.0 gm.ampules of Na2S208 5H20* are dissolved in a sterile beakerwith 120 ml. sterile pyrogen-free water and thoroughlymixed. Twenty ml. are withdrawn for the determinationof the density of the solution and titration of the con-
centration of thiosulfate. The remainder is used to fill a
calibrated 100 ml. syringe.Administration: An infusion is started with saline or 5%
glucose using an open-top set. When the chamber of theinfusion set is empty, the thiosulfate solution is quicklyintroduced from the calibrated syringe.
A stop-watch is started when the thiosulfate solutionreaches the needle and this is considered zero-time forcalculations.
* Sulfactol, Winthrop-Stearns, Inc., N. Y. C.
Flow should be regulated, before addition of the meas-ured thiosulfate, to approximate seven to 10 ml. per min-ute so that the infusion will last ten to 15 minutes. Uponcompletion of the infusion, the time should be noted andthe set washed through with 20-30 ml. of normal salineor 5%dextrose solution three times.
Samples: Blood samples should be 1-2 ml. in volume.The blank titration is considerable (about 0.04 mgm./ml.). A blank should be drawn at the time the needleis inserted for the infusion. Venous samples must bedrawn without stasis and midtimes recorded. Betweensamples the arm should be kept under a blanket. Aminimum of four samples evenly spaced over 20-70minutes after the start of infusion should be drawn.
APPENDIX II
Chemical MethodI. Reagents
1%Na2WO4N H2SO415
0.001 N (exact) KIO30.0005 N Na2S2Oa2 N HC110% KI1%soluble starch.
Comment: The KI03 must be made up precisely and isstable. The Na2S203 tends to deteriorate and must bechecked at the beginning and end of each run. Deteriora-tion is due to sulfur-metabolizing bacteria and may beslowed by using sterile distilled water and adding 0.1 gm.Na2CO3 per liter. KI should be prepared freshly witheach set of determinations and kept in a brown or opaquecontainer.
The starch solution is prepared by boiling. It is thencentrifuged and decanted, and can be stored on ice for afew days.
II. ProcedureA. Protein-free filtratesSamples are centrifuged as soon as possible and clear
serum must be obtained.
To 2 ml. N H2SO4 in 16 ml. H20, add 0.2 ml. serum15slowly with agitation.
Then add 2.0 ml. 1.0% Na2WO4slowly with agitation.Permit to stand 10 minutes, centrifuge, decant, and
save clear supernatant fluid.
B. Infused solutionThe weight of the infused thiosulfate solution contained
in a calibrated 10 ml. pipette is determined on a chemicalbalance and the density calculated.
Quadruplicate 0.10 ml. aliquots are then weighed to0.1 mgm. and diluted in liter volumetric flasks with dis-tilled water and 8 ml. aliquots of both dilutions titrated asbelow.
288

SODIUM THIOSULFATE AS A MEASUREOF EXTRACELLULARFLUID
C. Titration*To 5 ml. 0.001 N KIO,, add 8 ml. protein-free filtrate
and 1 ml. 2 N HCl.Let stand at least five minutes and not more than 10
minutes.Then add
1 ml. 10% KI and titrate immediately with0.0005 N Na2S2O, using 2 to 3 drops 1% starchindicator.
Comment: Duplicate 8 ml. aliquots of the diluted infusedsolutions, serum blank, serum samples, and a reagentblank are titrated. Starch should not be added until theyellow iodine color has almost disappeared.
III. CakulationsA WI XC, (1)
where: A = mgm. of S203- administered.WI = volume in ml. delivered by the calibrated
100 ml. syringeCI = concentration in mgm./ml. of the infused
thiosulfate solution.
C, = (t.- t0)(058)(tS)QD8) (2)t
Cp = (tsB tu) ( 8 (t )( (3)twhere: Cp, = concentration in mgm./ml. of thiosulfate in
serum.
t, = ml. of 0.0005 N Na2S2O: required to titrate5 ml. of 0.001 N KI0 (reagent blank).
tu = ml. of 0.0005 N Na2S203 required to titrateunknowns other than serum blank.
tB = ml. of 0.0005 N Na2S20s required to titrateserum blank.
D.F. = dilution factor, obtained by dividing 1000 bythe weight of the aliquot and this divided bythe density of the infused solution.
AV= Cp '(4)where: V = volume of distribution for thiosulfate
CPO = concentration in mgm./ml. of thiosulfate inserum at zero-time. This is obtained byplotting on semi-log coordinates the con-
centrations of thiosulfate in the serum
samples against the mid-point of the time atwhich they were drawn and extrapolatingto zero-time.
REFERENCES
1. Moore, F. D., Determination of total body water andsolids with isotopes. Science, 1946, 104, 156.
2. Schloerb, P. R., Friis-Hansen, B. J., Edelman, I. S.,Solomon, A. K., and Moore, F. D., The measure-
ment of total body water in the human subject by
* All glassware must be extremely clean and oxidizingagents must be avoided.
t For derivation of formulas 2 and 3 see Newman, Gilman,and Philips (3).
deuterium oxide dilution. J. Clin. Invest., 1950, 29,1296.
3. Newman, E. V., Gilman, A., and Philips, F. S., Re-nal clearance of thiosulfate in man. Bull. JohnsHopkins Hosp., 1946, 79, 229.
4. Gilman, A., Philips, F. S., and Koelle, E. S., Renalclearance of thiosulfate with observations on itsvolume distribution. Am. J. Physiol., 1946, 146,348.
5. Brun, C., Thiosulfate as a measure of glomerular fil-tration rate in normal and diseased kidneys. Actamed. Scandinav., 1949, Suppl., 234, 63.
6. Schwartz, I. L., Measurement of extracellular fluidby means of a constant infusion technique withoutcollection of urine. Am. J. Physiol., 1950, 160, 526.
7. National Research Council, International CriticalTables of Numerical Data, Physics, Chemistry andTechnology. McGraw Hill Co., New York, 1929,Vol. 5, p. 67.
8. Bunim, J. J., Smith, W. W., and Smith, H. W., Diffu-sion coefficients of inulin and other substances ofinterest in renal physiology. J. Biol. Chem., 1937,118, 667.
9. Kowalski, H. J., and Rutstein, D. D., The distribu-tion of the thiosulfate ion with respect to normalhuman serum and red blood cells and its applica-tion to extracellular fluid determination. J. Clin.Invest., in press.
10. Newman, E. V., Bordley, J., III, and Winternitz, J.,Interrelationships of glomerular filtration rate(mannitol clearance), extracellular volume, surfacearea of body, and plasma concentration of mannitol.Bull. Johns Hopkins Hosp., 1944, 75, 253.
11. Solomon, A. K., Equations for tracer experiments. J.Clin. Invest., 1949, 28, 1297.
12. Brun, C., Hilden, T., and Raaschou, F., The signifi-cance of the difference in systemic arterial and ve-nous plasma concentrations in renal clearancemethods. J. Clin. Invest., 1949, 28, 144.
13. Gaudino, M., Schwartz, I. L., and Levitt, M. F., Inu-lin volume of distribution as a measure of extra-cellular fluid in dog and man. Proc. Soc. Exper.Biol. & Med., 1948, 68, 507.
14. Levitt, M. F., and Gaudino, M., Measurement ofbody water compartments. Am. J. Med., 1950, 9,208.
15. Burch, G. E., Threefoot, S. A., and Ray, C. T., Ratesof turnover and biologic decay of chloride andchloride space in the dog determined with the long-life isotope C1l. J. Lab. & Clin. Med., 1950, 35,331.
16. Kaltreider, N. L., Meneely, G. R., Allen, J. R., andBale, W. F., Determination of volume of extracel-lular fluid with radioactive sodium. J. Exper. Med.,1941, 74, 569.
17. Winkler, A. W., Elkinton, J. R., and Eisenman, A. J.,Comparison of sulfocyanate with radioactive chlo-ride and sodium in measurement of extracellularfluid. Am. J. Physiol., 1943, 139, 239.
289

R. H. CARDOZOAND I. S. EDELMAN
18. Goudsmit, A., Louis, L., and Scott, J. C., Bromidespace, thiocyanate space, and the measurement ofthe extracellular fluid volume. Am. J. Physiol.,1941, 133, P297.
19. Lavietes, P. H., Bourdillon, J., and Klinghoffer, K. A.,The volume of the extracellular fluids of the body.J. Clin. Invest., 1936, 15, 261.
20. Bourdillon, J., and Lavietes, P. H., Observations on
the fate of sodium sulfate injected intravenously inman. J. Clin. Invest., 1936, 15, 301.
21. Elkinton, J. R., and Taffel, M., The apparent volumeof distribution of sulfocyanate and of sulfanilamidein the dog. Am. J. Physiol., 1942-43, 138, 126.
22. Ashworth, C. T., Muirhead, E. E., Thomas, 0. F.,
and Hill, J. M., An analysis of the thiocyanatemethod for determining the distribution of bodyfluids. Am. J. Physiol., 1943, 139, 255.
23. Scheinberg, I. H., and Kowalski, H. J., Binding ofthiocyanate to albumin in normal human serum anddefibrinated blood with reference to the determina-tion of "thiocyanate space." J. Clin. Invest., 1950,29, 475.
24. Crandall, L. A., Jr., and Anderson, M. X., Estimationof state of hydration of body by amount of wateravailable for solution of sodium thiocyanate. Am.J. Digest. Dis. & Nutrition, 1934, 1, 126.
25. Overman, R. R., Permeability alterations in disease.J. Lab. & Clin. Med., 1946, 31, 1170.
290