2qfy16 biocon - business...
TRANSCRIPT
21 October 2015
2QFY16 Results Update | Sector: Healthcare
Biocon
Amey Chalke ([email protected]); +91 22 3982 5423
BSE SENSEX S&P CNX CMP: INR452 TP: INR460 (+2%) Sell 27,288 8,252 Bloomberg BIOS IN
Equity Shares (m) 200.0 M.Cap. (INR b) / (USD b) 90.4/1.4 52-Week Range (INR) 496 / 397 1, 6, 12 Rel. Per (%) -2/2/-8 Avg Val (INR m) 347 Free float (%) 39.0
Financials & Valuation (INR b) Y/E Mar 2015 2016E 2017E
Sales 30.6 34.2 39.5 EBITDA 6.7 7.9 9.0
Net Profit 4.0 4.9 5.4 EPS (INR) 20.1 24.4 26.9 EPS Gr. (%) -2.8 21.4 10.1
BV/Sh. INR 163.5 187.9 207.0 RoE (%) 12.3 13.0 13.0 RoCE (%) 12.5 16.9 11.8
P/E (x) 22.5 18.5 16.8 P/BV (x) 2.8 2.4 2.2
Estimate change
TP change
Rating change
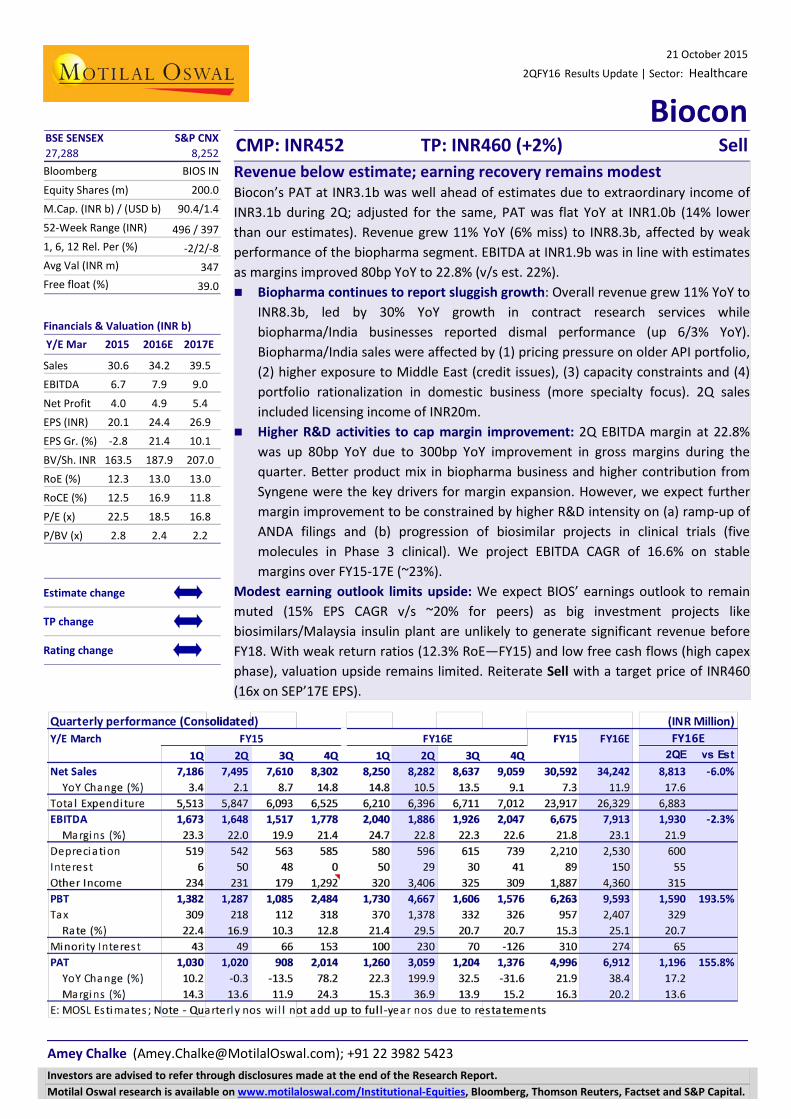
Revenue below estimate; earning recovery remains modest Biocon’s PAT at INR3.1b was well ahead of estimates due to extraordinary income of INR3.1b during 2Q; adjusted for the same, PAT was flat YoY at INR1.0b (14% lower than our estimates). Revenue grew 11% YoY (6% miss) to INR8.3b, affected by weak performance of the biopharma segment. EBITDA at INR1.9b was in line with estimates as margins improved 80bp YoY to 22.8% (v/s est. 22%). Biopharma continues to report sluggish growth: Overall revenue grew 11% YoY to
INR8.3b, led by 30% YoY growth in contract research services while biopharma/India businesses reported dismal performance (up 6/3% YoY). Biopharma/India sales were affected by (1) pricing pressure on older API portfolio, (2) higher exposure to Middle East (credit issues), (3) capacity constraints and (4) portfolio rationalization in domestic business (more specialty focus). 2Q sales included licensing income of INR20m.
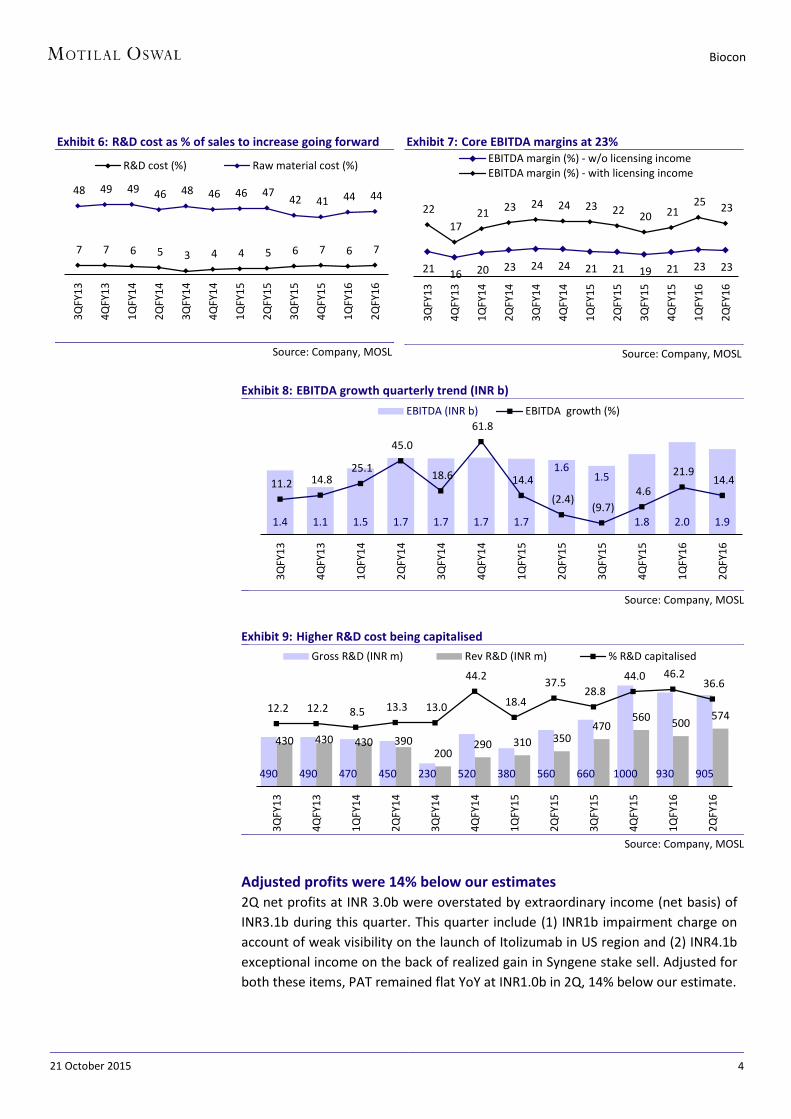
Higher R&D activities to cap margin improvement: 2Q EBITDA margin at 22.8% was up 80bp YoY due to 300bp YoY improvement in gross margins during the quarter. Better product mix in biopharma business and higher contribution from Syngene were the key drivers for margin expansion. However, we expect further margin improvement to be constrained by higher R&D intensity on (a) ramp-up of ANDA filings and (b) progression of biosimilar projects in clinical trials (five molecules in Phase 3 clinical). We project EBITDA CAGR of 16.6% on stable margins over FY15-17E (~23%).
Modest earning outlook limits upside: We expect BIOS’ earnings outlook to remain muted (15% EPS CAGR v/s ~20% for peers) as big investment projects like biosimilars/Malaysia insulin plant are unlikely to generate significant revenue before FY18. With weak return ratios (12.3% RoE—FY15) and low free cash flows (high capex phase), valuation upside remains limited. Reiterate Sell with a target price of INR460 (16x on SEP’17E EPS).
Investors are advised to refer through disclosures made at the end of the Research Report. Motilal Oswal research is available on www.motilaloswal.com/Institutional-Equities, Bloomberg, Thomson Reuters, Factset and S&P Capital.

21 October 2015 2
Biocon
2Q Result analysis
Exhibit 1: Quarterly Snapshot (Revenue mix) (INR m) 2QFY15 1QFY16 2QFY16 %YoY %QoQ FY15 FY16E %YoY Revenue split
Biopharma 4,321 4,690 4,568 5.7 (2.6) 17,632 18,707 6.1 India 1,160 1,120 1,190 2.6 6.3 4,300 4,811 11.9 Total Biopharma 5,481 5,810 5,758 5.1 (0.9) 21,932 23,517 7.2 CRO 1,921 2,250 2,504 30.3 11.3 8,228 10,293 25.1 Licensing income 93 190 20 (78.5) (89.5) 433 418 (3.5) Total revenues 7,495 8,250 8,282 10.5 0.4 30,593 34,229 11.9
Source: Company, MOSL
Exhibit 2: Quarterly Profit and Loss statement
(INR m) 1QFY15 4Q FY15 2QFY16 %YoY %QoQ FY15 FY16E %YoY Total revenues 7,495 8,250 8,282 10.5 0.4 30,592 34,242 11.9 Material cost 3,514 3,630 3,685 4.9 1.5 12,561 15,013 19.5 Gross profit 3,981 4,620 4,597 15.5 (0.5) 18,031 19,229 6.6 Gross margin (%) 53.1 56.0 55.5 239 bp (49)bp 58.9 56.2 (278)bp Staff cost 1,253 1,410 1,367 9.1 (3.0) 5,334 5,573 4.5 % of sales 16.7 17.1 16.5 (21)bp (59)bp 17.4 16.3 (116)bp Other expense 730 670 770 5.5 14.9 4,022 3,475 (13.6) % of sales 9.7 8.1 9.3 (44)bp 118 bp 13.1 10.1 (300)bp R&D expense 350.0 500.0 574.0 64.0 14.8 2000.0 2267.9 13.4 % of sales 4.7 6.1 6.9 226 bp 87 bp 6.5 6.6 9 bp EBITDA 1,648 2,040 1,886 14.4 (7.5) 6,675 7,913 18.5 EBITDA margin (%) 22.0 24.7 22.8 78 bp (195)bp 21.8 23.1 129 bp Depreciation 542 580 596 10.0 2.8 2,210 2,530 14.5 EBIT 1,106 1,460 1,290 16.6 (11.6) 4,465 5,383 20.6 Interest cost 50 50 29 (42.0) (42.0) 89 150 68.8 Other income (net) 231 320 336 45.5 5.0 837 1,290 54.1 PBT 1,287 1,730 1,597 24.1 (7.7) 5,213 6,523 25.1 Income tax 218 370 338 55.0 (8.6) 858 1,367 59.4 Effective tax rate (%) 16.9 21.4 21.2 423 bp (22)bp 16.5 21.0 450 bp Reported PAT 1,069 1,360 1,259 17.8 (7.4) 4,356 5,156 18.4 Exceptional items (post tax) - - 2,030 - - 952 2,030
Minority Interest 49 100 230 369.4 130.0 310 274 PAT (after MI) 1,020 1,260 3,059 199.9 142.8 4,997 6,912 38.3
Adj. PAT 1,020 1,359 1,029 0.9 (24.3) 4,045 6,912 70.9
Source: Company, MOSL

21 October 2015 3
Biocon
Biopharma business underperforms 2Q Revenue growth at 10.5% YoY, 6% below our estimates, was affected by weak performance of Biopharma business. Biopharma sales grew 5.7%YoY to INR4.5b, 8% lower than estimates, due to (1) Pricing pressure on older API portfolio, (2) Higher exposure to Middle east region (credit issue) and (3) Capacity constraints in Insulin business. Going ahead, we believe improved traction in insulins and MAbs products to lead 10-11% CAGR growth over FY15-18E. India formulation business (14% of sales) also registered flat growth in 2Q, on account of portfolio rationalization steps taken by the company, focuses on high margin specialty brands. We expect India business to register 12-13% growth over FY15-18E driven by high growth portfolio of Metabolics and Oncology division. Exhibit 3: Quarterly performance (sales mix) (INR m) 2QFY16 2QFY15 % YoY 1QFY15 % QoQ 2QFY16E % var Bio-Pharma 4,568 4,321 5.7 4,690 -2.6 4,982 -8.3
% of sales 55.2 57.7
56.8 56.5 India Form. 1,190 1,160 2.6 1,120 6.3 1,227 -3.0
% of sales 14.4 15.5 13.6 13.9 Contract Research 2,504 1,921 30.3 2,250 11.3 2,540 -1.4 % of sales 30.2 25.6 27.3 28.8 Licensing Income 20 93 - 190 - 63 -68.5
% of sales 0.2 1.2
2.3
0.7 Total Revenues 8,282 7,495 10.5 8,250 0.4 8,813 -6.0
Source: Company, MOSL
Exhibit 4: Biopharma sales trend (In USDm)
Source: Company, MOSL
Exhibit 5: CRO business ramp-up (sales in USDm)
Source: Company, MOSL
Increasing R&D outlay to cap margins expansion 2Q EBITDA at INR 1.9b (up 14% YoY) was in line with expectations as gross margin improvement was offset by higher R&D expenses during this quarter. Gross margins improved 300bp from 53% in 2QFY15 to 57% in 2QFY16, attributed to improving product mix in Biopharma business. However, R&D cost also increased 64%YoY to INR574m v/s INR350m in 2QFY15. Increase in R&D spend is reflection of uptick in clinical activities during this quarter. We believe that R&D intensity is likely to increase going ahead as five biosimilar/novel projects has advanced into phase III clinical trials in 2Q. However, the impact on P&L would be felt with a lag as the company capitalizes large part of gross R&D spend (37% capitalized). We expect EBITDA margins to stay in the range of 22.5-23.5% over next two years.
71
67
72 70 72
69
79
74 70
2QFY
14
3QFY
14
4QFY
14
1QFY
15
2QFY
15
3QFY
15
4QFY
15
1QFY
16
2QFY
16
Biopharma ex. branded form. (USD m)
28 30 30 30 29 32 35 38 35
2QFY
14
3QFY
14
4QFY
14
1QFY
15
2QFY
15
3QFY
15
4QFY
15
1QFY
16
2QFY
16
CRO division (USD m)
21 October 2015 4
Biocon
Exhibit 6: R&D cost as % of sales to increase going forward
Source: Company, MOSL
Exhibit 7: Core EBITDA margins at 23%
Source: Company, MOSL
Exhibit 8: EBITDA growth quarterly trend (INR b)
Source: Company, MOSL
Exhibit 9: Higher R&D cost being capitalised
Source: Company, MOSL
Adjusted profits were 14% below our estimates 2Q net profits at INR 3.0b were overstated by extraordinary income (net basis) of INR3.1b during this quarter. This quarter include (1) INR1b impairment charge on account of weak visibility on the launch of Itolizumab in US region and (2) INR4.1b exceptional income on the back of realized gain in Syngene stake sell. Adjusted for both these items, PAT remained flat YoY at INR1.0b in 2Q, 14% below our estimate.
7 7 6 5 3 4 4 5 6 7 6 7
48 49 49 46 48 46 46 47 42 41 44 44
3QFY
13
4QFY
13
1QFY
14
2QFY
14
3QFY
14
4QFY
14
1QFY
15
2QFY
15
3QFY
15
4QFY
15
1QFY
16
2QFY
16
R&D cost (%) Raw material cost (%)
21 16 20 23 24 24 21 21 19 21 23 23
22 17
21 23 24 24 23 22 20 21 25 23
3QFY
13
4QFY
13
1QFY
14
2QFY
14
3QFY
14
4QFY
14
1QFY
15
2QFY
15
3QFY
15
4QFY
15
1QFY
16
2QFY
16
EBITDA margin (%) - w/o licensing incomeEBITDA margin (%) - with licensing income
1.4 1.1 1.5 1.7 1.7 1.7 1.7
1.6 1.5
1.8 2.0 1.9
11.2 14.8 25.1
45.0
18.6
61.8
14.4
(2.4) (9.7)
4.6
21.9 14.4
3QFY
13
4QFY
13
1QFY
14
2QFY
14
3QFY
14
4QFY
14
1QFY
15
2QFY
15
3QFY
15
4QFY
15
1QFY
16
2QFY
16
EBITDA (INR b) EBITDA growth (%)
490 490 470 450 230 520 380 560 660 1000 930 905
430 430 430 390 200
290 310 350 470
560 500 574 12.2 12.2 8.5 13.3 13.0
44.2
18.4
37.5 28.8
44.0 46.2 36.6
3QFY
13
4QFY
13
1QFY
14
2QFY
14
3QFY
14
4QFY
14
1QFY
15
2QFY
15
3QFY
15
4QFY
15
1QFY
16
2QFY
16
Gross R&D (INR m) Rev R&D (INR m) % R&D capitalised

21 October 2015 5
Biocon
Exhibit 10: Earnings quarterly growth trend
Source: Company, MOSL
Exhibit 11: Sales growth v/s PAT growth
Source: Company, MOSL
Other key highlights Malaysia facility is expected to get commercialized by 2HFY17. Once it receives
approval from Local authority, the company will also stop capitalizing cost (including interest) for Malaysia facility. Overall capital expenditure incurred is estimated to be at INR12b for this plant.
Glargine Insulin: Recruitment of patients has been completed for clinical trials and Biocon expects to file this product in FY17. Similar as Lilly, Biocon is also likely to file through 505(b)2 route in US market.
Partnered products: Till date, five products have entered phase III clinical trials that includes - Trastuzumab, Insulin glargine, Pegfilgrastim, Adalizumab and Bevacizumab (RoW). The company is expected to file these products by FY17. It is confident on the prospects of MAb portfolio and expects biosimilars product to become predictable growth driver for the company.
Oral Insulin: Biocon has received complete study report for IN-505 (Tregopil). Itolizumab – The company had purchased marketing rights of Itolizumab from
Cimab (for USD17m) in 2010. However, there were legal restrictions on the commercialization of this product in US as innovator had developed this asset in Cuba. With limited visibility on commercialization of this product in US/Canada market, Biocon has taken impairment charge of INR1b for this product in 2QFY16.
917 467 935 1023 1050
1130
1030 1020 908 1305 1260 1030
8
35 19 14 15
(55)
10 (0)
(13)
16 22
-
3QFY
13
4QFY
13
1QFY
14
2QFY
14
3QFY
14
4QFY
14
1QFY
15
2QFY
15
3QFY
15
4QFY
15
1QFY
16
2QFY
16
PAT (INR m) Growth (%)
23 3
22 24 10 15
3 2 9 15
15
11
8
35 19 14 15
(55)
10 (0)
(13)
16
22
-
3QFY
13
4QFY
13
1QFY
14
2QFY
14
3QFY
14
4QFY
14
1QFY
15
2QFY
15
3QFY
15
4QFY
15
1QFY
16
2QFY
16
Sales gr. (%) PAT gr. (%)

21 October 2015 6
Biocon
Operating metrics
Exhibit 12: Key operating metrics
3QFY13 4QFY13 1QFY14 2QFY14 3QFY14 4QFY14 1QFY15 2QFY15 3QFY15 4QFY15 1QFY15 2QFY15
Revenue Mix (%) Biopharma 63.1 59.9 62.2 60.4 59.1 61.1 58.0 57.7 56.0 58.8 56.8 55.2
India 13.5 13.4 14.5 13.5 14.1 12.9 15.4 15.5 13.8 11.9 13.6 14.4 Total Biopharma 76.6 73.4 76.7 73.9 73.3 74.0 73.4 73.1 69.8 70.7 70.4 69.5 CRO 22.0 26.3 22.3 25.6 26.1 26.0 24.0 25.6 28.9 28.7 27.3 30.2 Licensing income 1.4 0.3 1.1 0.5 0.6 - 2.6 1.2 1.3 0.6 2.3 0.2
Revenue Gr. (%) 22.6 3.3 21.7 23.9 10.4 14.7 3.4 2.1 8.7 14.8 14.8 10.5 Biopharma 30.8 (0.8) 23.9 19.2 3.4 17.0 (3.5) (2.6) 2.9 10.5 12.5 5.7 India 22.0 30.2 17.1 8.3 15.8 9.9 9.8 17.3 6.1 5.8 1.3 2.6 Total Biopharma 29.2 3.7 22.5 17.1 5.6 15.7 (1.0) 1.1 3.5 9.7 10.2 5.1 CRO 24.7 40.6 26.3 45.7 31.0 13.3 11.4 2.1 20.2 26.8 30.6 30.3 Licensing income (69.9) (95.7) (45.3) #DIV/0! (54.5) 0.0 150.0 173.5 150.0 0.0 - (78.5) Cost of sales (%) Raw material 48.4 49.2 49.4 45.7 48.3 45.9 46.5 46.9 41.7 40.7 44.0 44.5 Staff cost 13.8 15.7 15.4 14.0 15.3 15.5 16.2 16.7 17.9 16.4 17.1 16.5 R&D cost 6.8 6.8 6.2 5.3 2.9 4.0 4.3 4.7 6.2 6.7 6.1 6.9 Other expenses 8.7 11.6 7.9 12.0 9.6 11.1 9.8 9.7 14.3 14.7 8.1 9.3 Tax Rate 21.4 10.1 23.6 23.2 19.1 13.8 22.4 16.9 10.3 12.8 21.4 20.7 Margins (%) Gross Margins 51.6 50.8 50.6 54.3 51.7 54.1 53.5 53.1 58.3 59.3 56.0 55.5 EBITDA Margins 22.3 16.7 21.0 23.0 24.0 23.5 23.3 22.0 19.9 21.4 24.7 22.8 EBIT Margins 15.1 9.4 14.1 16.2 16.7 16.0 16.1 14.8 12.5 14.4 17.7 15.6 PAT margins 14.5 39.4 13.5 13.9 15.0 15.6 14.3 13.6 11.9 24.3 15.3 36.9
Source: Company; MOSL

21 October 2015 7
Biocon
Valuation and view We expect BIOS earnings outlook to remain subdued (14% EPS CAGR over FY15-18E) owing to (a) elevated R&D spend as molecules progress in clinical trials, (b) fixed overheads at Malaysia facility (INR 12b spent) with no meaningful revenue contribution till FY18E. While Biocon’s long term prospects in biosimilars space continue to remain appealing, current valuations of 17x FY17E and 15x FY18E leave limited valuation support. Maintain Sell rating with a target price of INR460. We value BIOS at 16x Sep’17E EPS, at 25% discount to sector average P/E multiples (1 year forward) which is justified noting: Weak earnings outlook of 14-15% EPS CAGR over FY15-18E (vs 25%+ for peers). Below-par returns ratios (RoE of 12%, RoCE of 12%). We believe that the following factors pose risks to our thesis: Out-licensing of Itolizumab and partnership for rh-insulin (in regulated markets)
are potential R&D triggers. Milestone receipt upon regulatory progress of key biosimilar projects (MAbs,
insulin portfolio) could provide one-time upside.
Exhibit 13: P/E valuation band (10 years)
Source: Company, MOSL
Exhibit 14: Premium relative to Sensex
Source: Company, MOSL
15.0
45.9
16.9
7.3 0
15
30
45
60
Oct
-05
Jan-
07
Apr-
08
Jul-0
9
Oct
-10
Jan-
12
Apr-
13
Jul-1
4
Oct
-15
PE (x) Peak(x) Avg(x) Min(x)
-7.3
1.7
-60
0
60
120
180
Oct
-05
Jan-
07
Apr-
08
Jul-0
9
Oct
-10
Jan-
12
Apr-
13
Jul-1
4
Oct
-15
Biocon PE Relative to Sensex PE (%) LPA (%)

21 October 2015 8
Biocon
Story in charts
Exhibit 15: Sales to pick up in FY17-18E
Source: Company, MOSL
Exhibit 16: Biopharma sales trend (In INR m)
Source: Company, MOSL
Exhibit 17: CRO business ramp-up (sales in INR m)
Source: Company, MOSL
Exhibit 18: Return ratios trending lower with high capex
Source: Company, MOSL
Exhibit 19: R&D Expenses (annual trend)
Source: Company, MOSL
Exhibit 20: EBITDA margin trend
Source: Company, MOSL
24 28 20 24 29 31 34 39 46
47
20
-33
14 14 5 7 13 14
FY10 FY11 FY12 FY13 FY14 FY15 FY16E FY17E FY18E
Sales (INR b) YoY growth (%)
11,799 14,817 16,389
18,705 21,380 22,367 23,950
27,035 30,823
FY10 FY11 FY12 FY13 FY14 FY15 FY16E FY17E FY18E
2,807 3,180 4,101
5,572 7,137
8,225
10,292
12,417
14,901
FY10 FY11 FY12 FY13 FY14 FY15 FY16E FY17E FY18E
15.6 19.2
13.0
17.8
11.7 12.5
16.9
11.8 12.4 16.7 18.0
14.9 12.1
13.7 12.3 13.0 13.0 13.3
FY10 FY11 FY12 FY13 FY14 FY15 FY16E FY17E FY18E
RoCE (%) RoE (%)
784 1,180 1,566 1,640 1,312 2,000 2,268 2,778 3,393
3.3% 4.3%
7.6% 6.8%
4.6%
6.5% 6.6% 6.8% 7.2%
FY10 FY11 FY12 FY13 FY14 FY15 FY16E FY17E FY18E
R&D Expenses (INR m) As a % of sales
5 6
5
5 7 7 8 9 11
19.9
21.2
23.4
20.0
23.2
21.7
23.1 22.8 23.0
FY10 FY11 FY12 FY13 FY14 FY15 FY16E FY17E FY18E
EBITDA (INR m) EBITDA Margin (%)
21 October 2015 9
Biocon
Financials and valuations
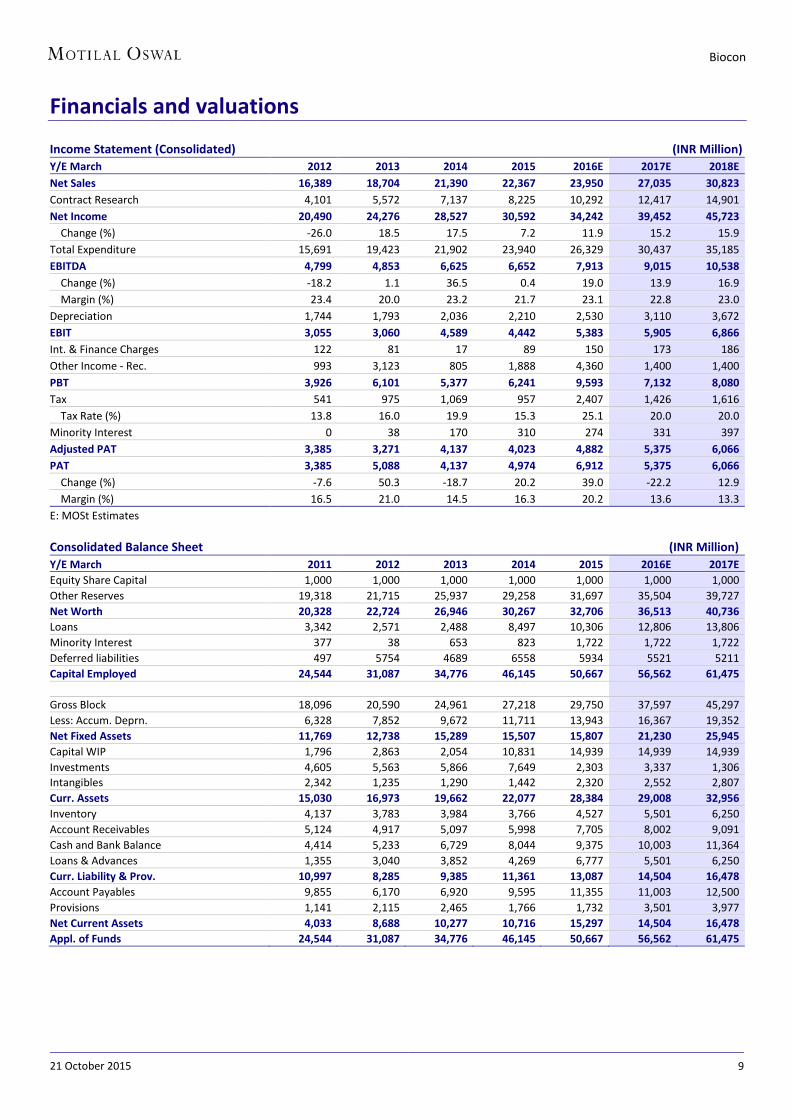
Income Statement (Consolidated)
(INR Million) Y/E March 2012 2013 2014 2015 2016E 2017E 2018E Net Sales 16,389 18,704 21,390 22,367 23,950 27,035 30,823 Contract Research 4,101 5,572 7,137 8,225 10,292 12,417 14,901 Net Income 20,490 24,276 28,527 30,592 34,242 39,452 45,723 Change (%) -26.0 18.5 17.5 7.2 11.9 15.2 15.9 Total Expenditure 15,691 19,423 21,902 23,940 26,329 30,437 35,185 EBITDA 4,799 4,853 6,625 6,652 7,913 9,015 10,538 Change (%) -18.2 1.1 36.5 0.4 19.0 13.9 16.9 Margin (%) 23.4 20.0 23.2 21.7 23.1 22.8 23.0 Depreciation 1,744 1,793 2,036 2,210 2,530 3,110 3,672 EBIT 3,055 3,060 4,589 4,442 5,383 5,905 6,866 Int. & Finance Charges 122 81 17 89 150 173 186 Other Income - Rec. 993 3,123 805 1,888 4,360 1,400 1,400 PBT 3,926 6,101 5,377 6,241 9,593 7,132 8,080 Tax 541 975 1,069 957 2,407 1,426 1,616 Tax Rate (%) 13.8 16.0 19.9 15.3 25.1 20.0 20.0 Minority Interest 0 38 170 310 274 331 397 Adjusted PAT 3,385 3,271 4,137 4,023 4,882 5,375 6,066 PAT 3,385 5,088 4,137 4,974 6,912 5,375 6,066 Change (%) -7.6 50.3 -18.7 20.2 39.0 -22.2 12.9 Margin (%) 16.5 21.0 14.5 16.3 20.2 13.6 13.3 E: MOSt Estimates
Consolidated Balance Sheet (INR Million) Y/E March 2011 2012 2013 2014 2015 2016E 2017E Equity Share Capital 1,000 1,000 1,000 1,000 1,000 1,000 1,000 Other Reserves 19,318 21,715 25,937 29,258 31,697 35,504 39,727 Net Worth 20,328 22,724 26,946 30,267 32,706 36,513 40,736 Loans 3,342 2,571 2,488 8,497 10,306 12,806 13,806 Minority Interest 377 38 653 823 1,722 1,722 1,722 Deferred liabilities 497 5754 4689 6558 5934 5521 5211 Capital Employed 24,544 31,087 34,776 46,145 50,667 56,562 61,475
Gross Block 18,096 20,590 24,961 27,218 29,750 37,597 45,297 Less: Accum. Deprn. 6,328 7,852 9,672 11,711 13,943 16,367 19,352 Net Fixed Assets 11,769 12,738 15,289 15,507 15,807 21,230 25,945 Capital WIP 1,796 2,863 2,054 10,831 14,939 14,939 14,939 Investments 4,605 5,563 5,866 7,649 2,303 3,337 1,306 Intangibles 2,342 1,235 1,290 1,442 2,320 2,552 2,807 Curr. Assets 15,030 16,973 19,662 22,077 28,384 29,008 32,956 Inventory 4,137 3,783 3,984 3,766 4,527 5,501 6,250 Account Receivables 5,124 4,917 5,097 5,998 7,705 8,002 9,091 Cash and Bank Balance 4,414 5,233 6,729 8,044 9,375 10,003 11,364 Loans & Advances 1,355 3,040 3,852 4,269 6,777 5,501 6,250 Curr. Liability & Prov. 10,997 8,285 9,385 11,361 13,087 14,504 16,478 Account Payables 9,855 6,170 6,920 9,595 11,355 11,003 12,500 Provisions 1,141 2,115 2,465 1,766 1,732 3,501 3,977 Net Current Assets 4,033 8,688 10,277 10,716 15,297 14,504 16,478 Appl. of Funds 24,544 31,087 34,776 46,145 50,667 56,562 61,475

21 October 2015 10
Biocon
Financials and valuations
Ratios Y/E March 2011 2012 2013 2014 2015 2016E 2017E Basic (INR)
EPS 18.3 16.9 16.4 20.7 20.1 26.9 29.8 Cash EPS 26.2 25.6 34.4 30.9 35.9 39.0 44.8 BV/Share 101.6 113.6 134.7 151.3 163.5 182.5 203.6 DPS 4.5 5.0 7.5 5.0 5.0 6.7 7.5 Payout (%) 27.0 34.3 34.5 28.3 23.5 29.3 29.3 Valuation (x)
P/E 25.4 27.5 28.5 22.5 23.2 17.3 15.6 Cash P/E 17.8 18.2 13.5 15.1 13.0 11.9 10.4 P/BV 4.6 4.1 3.5 3.1 2.9 2.6 2.3 EV/Sales 3.2 4.1 3.4 3.0 3.0 2.5 2.3 EV/EBITDA 14.9 17.7 17.1 13.0 13.8 11.0 9.7 Dividend Yield (%) 1.0 1.1 1.6 1.1 1.1 1.4 1.6 Return Ratios (%)
RoE 18.0 14.9 12.1 13.7 12.3 14.7 14.7 RoCE 19.2 13.0 17.8 11.7 12.5 12.9 13.3 Working Capital Ratios
Fixed Asset Turnover (x) 2.4 1.7 1.7 1.9 2.0 2.0 1.8 Debtor (Days) 68 88 77 77 92 80 80 Inventory (Days) 54 67 60 48 54 55 55 Working Capital (Days) -5 62 53 34 71 45 45 Leverage Ratio (x)
Current ratio 1.4 2.0 2.1 1.9 2.2 2.0 2.0 Debt/Equity 0.2 0.1 0.1 0.3 0.3 0.4 0.3
Consolidated Cash Flow Statement (INR Million) Y/E March 2011 2012 2013 2014E 2015 2016E 2017E Oper. Profit/(Loss) before Tax 5,867 4,799 4,853 6,625 6,652 8,448 9,747 Interest/Dividends Recd. 429 993 3,123 805 1,888 1,290 1,400 Direct Taxes Paid -733 4,716 -2,040 800 -1,581 -1,829 -1,889 (Inc)/Dec in WC 4,102 -3,836 -1,910 876 -3,251 1,422 -613 CF from Operations 9,666 6,673 4,025 9,106 3,709 9,331 8,645
(Incr)/Dec in FA -2,735 -3,781 -3,535 -11,031 -6,618 -7,847 -7,700 Free Cash Flow 6,931 2,892 490 -1,925 -2,910 1,484 945 (Pur)/Sale of Investments -915 149 -358 -1,935 4,468 -1,266 1,777 CF from investments -3,649 -3,632 -3,893 -12,966 -2,151 -9,113 -5,923
Change in Net Worth 76 174 2,706 354 -414 0 0 (Inc)/Dec in Debt -1,830 -1,111 494 6,009 2,397 2,215 652 Interest Paid -257 -122 -81 -17 -89 -231 -266 Dividend Paid -991 -1,162 -1,755 -1,170 -1,170 -1,574 -1,746 CF from Fin. Activity -3,002 -2,221 1,364 5,175 724 410 -1,360
Inc/Dec of Cash 3,015 819 1,496 1,315 2,282 628 1,361 Add: Beginning Balance 1,399 4,414 5,233 6,729 8,044 9,375 10,003 Closing Balance 4,414 5,233 6,729 8,044 10,326 10,003 11,364 E: MOSL Estimates
21 October 2015 11
Biocon
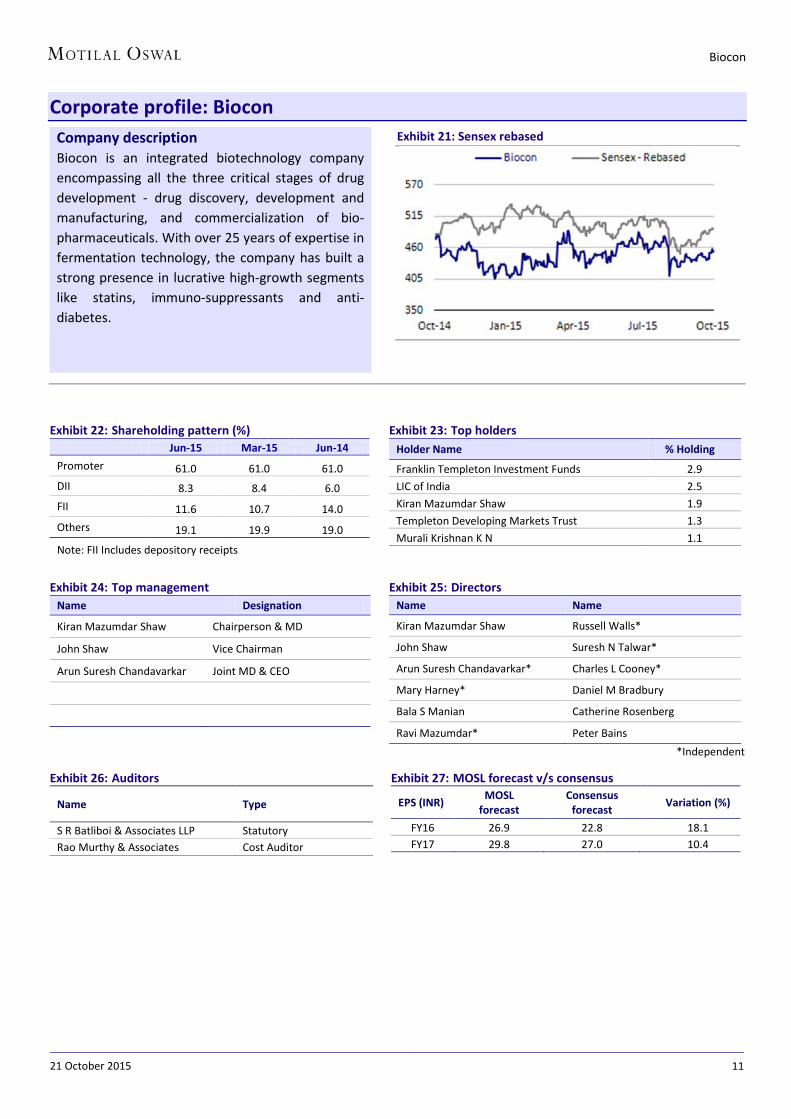
Corporate profile: Biocon
Exhibit 22: Shareholding pattern (%) Jun-15 Mar-15 Jun-14 Promoter 61.0 61.0 61.0 DII 8.3 8.4 6.0 FII 11.6 10.7 14.0 Others 19.1 19.9 19.0
Note: FII Includes depository receipts
Exhibit 23: Top holders Holder Name % Holding
Franklin Templeton Investment Funds 2.9 LIC of India 2.5 Kiran Mazumdar Shaw 1.9 Templeton Developing Markets Trust 1.3 Murali Krishnan K N 1.1
Exhibit 24: Top management Name Designation
Kiran Mazumdar Shaw Chairperson & MD
John Shaw Vice Chairman
Arun Suresh Chandavarkar Joint MD & CEO
Exhibit 25: Directors Name Name
Kiran Mazumdar Shaw Russell Walls*
John Shaw Suresh N Talwar*
Arun Suresh Chandavarkar* Charles L Cooney*
Mary Harney* Daniel M Bradbury
Bala S Manian Catherine Rosenberg
Ravi Mazumdar* Peter Bains
*Independent
Exhibit 26: Auditors
Name Type
S R Batliboi & Associates LLP Statutory Rao Murthy & Associates Cost Auditor
Exhibit 27: MOSL forecast v/s consensus
EPS (INR) MOSL forecast
Consensus forecast Variation (%)
FY16 26.9 22.8 18.1 FY17 29.8 27.0 10.4
Company description Biocon is an integrated biotechnology company encompassing all the three critical stages of drug development - drug discovery, development and manufacturing, and commercialization of bio-pharmaceuticals. With over 25 years of expertise in fermentation technology, the company has built a strong presence in lucrative high-growth segments like statins, immuno-suppressants and anti-diabetes.
Exhibit 21: Sensex rebased

21 October 2015 12
Biocon
Disclosures This document has been prepared by Motilal Oswal Securities Limited (hereinafter referred to as Most) to provide information about the company(ies) and/sector(s), if any, covered in the report and may be distributed by it and/or its affiliated company(ies). This report is for personal information of the selected recipient/s and does not construe to be any investment, legal or taxation advice to you. This research report does not constitute an offer, invitation or inducement to invest in securities or other investments and Motilal Oswal Securities Limited (hereinafter referred as MOSt) is not soliciting any action based upon it. This report is not for public distribution and has been furnished to you solely for your general information and should not be reproduced or redistributed to any other person in any form. This report does not constitute a personal recommendation or take into account the particular investment objectives, financial situations, or needs of individual clients. Before acting on any advice or recommendation in this material, investors should consider whether it is suitable for their particular circumstances and, if necessary, seek professional advice. The price and value of the investments referred to in this material and the income from them may go down as well as up, and investors may realize losses on any investments. Past performance is not a guide for future performance, future returns are not guaranteed and a loss of original capital may occur.
MOSt and its affiliates are a full-service, integrated investment banking, investment management, brokerage and financing group. We and our affiliates have investment banking and other business relationships with a some companies covered by our Research Department. Our research professionals may provide input into our investment banking and other business selection processes. Investors should assume that MOSt and/or its affiliates are seeking or will seek investment banking or other business from the company or companies that are the subject of this material and that the research professionals who were involved in preparing this material may educate investors on investments in such business. The research professionals responsible for the preparation of this document may interact with trading desk personnel, sales personnel and other parties for the purpose of gathering, applying and interpreting information. Our research professionals are paid on the profitability of MOSt which may include earnings from investment banking and other business.
MOSt generally prohibits its analysts, persons reporting to analysts, and members of their households from maintaining a financial interest in the securities or derivatives of any companies that the analysts cover. Additionally, MOSt generally prohibits its analysts and persons reporting to analysts from serving as an officer, director, or advisory board member of any companies that the analysts cover. Our salespeople, traders, and other professionals or affiliates may provide oral or written market commentary or trading strategies to our clients that reflect opinions that are contrary to the opinions expressed herein, and our proprietary trading and investing businesses may make investment decisions that are inconsistent with the recommendations expressed herein. In reviewing these materials, you should be aware that any or all of the foregoing among other things, may give rise to real or potential conflicts of interest. MOSt and its affiliated company(ies), their directors and employees and their relatives may; (a) from time to time, have a long or short position in, act as principal in, and buy or sell the securities or derivatives thereof of companies mentioned herein. (b) be engaged in any other transaction involving such securities and earn brokerage or other compensation or act as a market maker in the financial instruments of the company(ies) discussed herein or act as an advisor or lender/borrower to such company(ies) or may have any other potential conflict of interests with respect to any recommendation and other related information and opinions.; however the same shall have no bearing whatsoever on the specific recommendations made by the analyst(s), as the recommendations made by the analyst(s) are completely independent of the views of the affiliates of MOSt even though there might exist an inherent conflict of interest in some of the stocks mentioned in the research report Reports based on technical and derivative analysis center on studying charts company's price movement, outstanding positions and trading volume, as opposed to focusing on a company's fundamentals and, as such, may not match with a report on a company's fundamental analysis. In addition MOST has different business segments / Divisions with independent research separated by Chinese walls catering to different set of customers having various objectives, risk profiles, investment horizon, etc, and therefore may at times have different contrary views on stocks sectors and markets.
Unauthorized disclosure, use, dissemination or copying (either whole or partial) of this information, is prohibited. The person accessing this information specifically agrees to exempt MOSt or any of its affiliates or employees from, any and all responsibility/liability arising from such misuse and agrees not to hold MOSt or any of its affiliates or employees responsible for any such misuse and further agrees to hold MOSt or any of its affiliates or employees free and harmless from all losses, costs, damages, expenses that may be suffered by the person accessing this information due to any errors and delays. The information contained herein is based on publicly available data or other sources believed to be reliable. Any statements contained in this report attributed to a third party represent MOSt’s interpretation of the data, information and/or opinions provided by that third party either publicly or through a subscription service, and such use and interpretation have not been reviewed by the third party. This Report is not intended to be a complete statement or summary of the securities, markets or developments referred to in the document. While we would endeavor to update the information herein on reasonable basis, MOSt and/or its affiliates are under no obligation to update the information. Also there may be regulatory, compliance, or other reasons that may prevent MOSt and/or its affiliates from doing so. MOSt or any of its affiliates or employees shall not be in any way responsible and liable for any loss or damage that may arise to any person from any inadvertent error in the information contained in this report. MOSt or any of its affiliates or employees do not provide, at any time, any express or implied warranty of any kind, regarding any matter pertaining to this report, including without limitation the implied warranties of merchantability, fitness for a particular purpose, and non-infringement. The recipients of this report should rely on their own investigations.
This report is intended for distribution to institutional investors. Recipients who are not institutional investors should seek advice of their independent financial advisor prior to taking any investment decision based on this report or for any necessary explanation of its contents.
Most and it’s associates may have managed or co-managed public offering of securities, may have received compensation for investment banking or merchant banking or brokerage services, may have received any compensation for products or services other than investment banking or merchant banking or brokerage services from the subject company in the past 12 months. Most and it’s associates have not received any compensation or other benefits from the subject company or third party in connection with the research report. Subject Company may have been a client of Most or its associates during twelve months preceding the date of distribution of the research report
MOSt and/or its affiliates and/or employees may have interests/positions, financial or otherwise of over 1 % at the end of the month immediately preceding the date of publication of the research in the securities mentioned in this report. To enhance transparency, MOSt has incorporated a Disclosure of Interest Statement in this document. This should, however, not be treated as endorsement of the views expressed in the report.
Motilal Oswal Securities Limited is registered as a Research Analyst under SEBI (Research Analyst) Regulations, 2014. SEBI Reg. No. INH000000412
There are no material disciplinary action that been taken by any regulatory authority impacting equity research analysis activities
Analyst Certification The views expressed in this research report accurately reflect the personal views of the analyst(s) about the subject securities or issues, and no part of the compensation of the research analyst(s) was, is, or will be directly or indirectly related to the specific recommendations and views expressed by research analyst(s) in this report. The research analysts, strategists, or research associates principally responsible for preparation of MOSt research receive compensation based upon various factors, including quality of research, investor client feedback, stock picking, competitive factors and firm revenues
Disclosure of Interest Statement BIOCON Analyst ownership of the stock No Served as an officer, director or employee No
A graph of daily closing prices of securities is available at www.nseindia.com and http://economictimes.indiatimes.com/markets/stocks/stock-quotes
Regional Disclosures (outside India) This report is not directed or intended for distribution to or use by any person or entity resident in a state, country or any jurisdiction, where such distribution, publication, availability or use would be contrary to law, regulation or which would subject MOSt & its group companies to registration or licensing requirements within such jurisdictions.
For U.S. Motilal Oswal Securities Limited (MOSL) is not a registered broker - dealer under the U.S. Securities Exchange Act of 1934, as amended (the"1934 act") and under applicable state laws in the United States. In addition MOSL is not a registered investment adviser under the U.S. Investment Advisers Act of 1940, as amended (the "Advisers Act" and together with the 1934 Act, the "Acts), and under applicable state laws in the United States. Accordingly, in the absence of specific exemption under the Acts, any brokerage and investment services provided by MOSL, including the products and services described herein are not available to or intended for U.S. persons.
This report is intended for distribution only to "Major Institutional Investors" as defined by Rule 15a-6(b)(4) of the Exchange Act and interpretations thereof by SEC (henceforth referred to as "major institutional investors"). This document must not be acted on or relied on by persons who are not major institutional investors. Any investment or investment activity to which this document relates is only available to major institutional investors and will be engaged in only with major institutional investors. In reliance on the exemption from registration provided by Rule 15a-6 of the U.S. Securities Exchange Act of 1934, as amended (the "Exchange Act") and interpretations thereof by the U.S. Securities and Exchange Commission ("SEC") in order to conduct business with Institutional Investors based in the U.S., MOSL has entered into a chaperoning agreement with a U.S. registered broker-dealer, Motilal Oswal Securities International Private Limited. ("MOSIPL"). Any business interaction pursuant to this report will have to be executed within the provisions of this chaperoning agreement.
The Research Analysts contributing to the report may not be registered /qualified as research analyst with FINRA. Such research analyst may not be associated persons of the U.S. registered broker-dealer, MOSIPL, and therefore, may not be subject to NASD rule 2711 and NYSE Rule 472 restrictions on communication with a subject company, public appearances and trading securities held by a research analyst account.
For Singapore Motilal Oswal Capital Markets Singapore Pte Limited is acting as an exempt financial advisor under section 23(1)(f) of the Financial Advisers Act(FAA) read with regulation 17(1)(d) of the Financial Advisors Regulations and is a subsidiary of Motilal Oswal Securities Limited in India. This research is distributed in Singapore by Motilal Oswal Capital Markets Singapore Pte Limited and it is only directed in Singapore to accredited investors, as defined in the Financial Advisers Regulations and the Securities and Futures Act (Chapter 289), as amended from time to time. In respect of any matter arising from or in connection with the research you could contact the following representatives of Motilal Oswal Capital Markets Singapore Pte Limited: Kadambari Balachandran Email : [email protected] Contact : (+65) 68189233 / 65249115 Office Address : 21 (Suite 31),16 Collyer Quay,Singapore 04931
Motilal Oswal Securities Ltd
Motilal Oswal Tower, Level 9, Sayani Road, Prabhadevi, Mumbai 400 025 Phone: +91 22 3982 5500 E-mail: [email protected]