2.physiology of mulberry and silkworm e book fi
TRANSCRIPT

www.hbmahesh.weebly.com
YUVARAJA’S COLLEGE
Graduate Course - Semester Scheme
SERICULTURE
MULBERRY AND SILKWORM
www.hbmahesh.weebly.com
University of Mysore
YUVARAJA’S COLLEGE (Autonomous)
Mysuru - 570005
Semester Scheme
A
E – BOOK
FOR
PAPER - DSC 4 LAB
PHYSIOLOGY
OF
MULBERRY AND SILKWORM
Editor
Dr. H.B. MAHESHA
Associate Professor and Head
Department of Sericulture
Yuvaraja’s College, Mysuru-570005
1
MULBERRY AND SILKWORM

www.hbmahesh.weebly.com 2

www.hbmahesh.weebly.com
YUVARAJA’S COLLEGE
Graduate Course - Semester Scheme
SERICULTURE
MULBERRY AND SILKWORM
www.hbmahesh.weebly.com
University of Mysore
YUVARAJA’S COLLEGE (Autonomous)
Mysuru - 570005
Semester Scheme
A
E – BOOK
FOR
PAPER - DSC 4 LAB
PHYSIOLOGY
OF
MULBERRY AND SILKWORM
Editor
Dr. H.B. MAHESHA
Associate Professor and Head
Department of Sericulture
Yuvaraja’s College, Mysuru-570005
3
MULBERRY AND SILKWORM

www.hbmahesh.weebly.com 4
Editor acknowledges all scientists who have pioneered and developed methods described in this e-book.
Copyright: Dr.H.B.Mahesha
First e-Print - 2016-17

www.hbmahesh.weebly.com 5
CONTENTS
Sl. No. Experiment Page
No.
Physiology of Mulberry
1 Determination of stomatal index. 7
2 Kranz Anatomy in relation to photosynthesis. 8
3 Estimation of leaf protein. 10
4 Separation of leaf photosynthetic pigments of mulberry
through paper chromatography.
11
5 Extraction of photosynthetic pigments by solvent wash
method.
13
6 Determination of water potential of potato tubers. 15
7 Estimation of moisture percentage and moisture
retention capacity of mulberry leaf.
17
8 Hill reaction. 18
Physiology of Silkworm
9 Estimation of proteins in haemolymph/egg. 21
10 Estimation of haemolymph glucose level. 23
11 Preparation of silkworm haemocytes. 25
12 Estimation of amylase activity in haemolymph of
bivoltine and multivoltine races.
26
13 Estimation of SDH activity in the eggs/tissue. 28
14 Estimation of glycogen in silkworm fat body/tissue. 31
15 Estimation of uric acid in silkworm litter. 33

www.hbmahesh.weebly.com 6
PART-A: PHYSIOLOGY OF MULBERRY
www.hbmahesh.weebly.com
Experiment No. 1: Determination of
Stomatal Index.
Introduction: Stomatal index is the measurement of the surface density of stomata. This
parameter has been found useful in comparing leaves of different mulberry varieties as it plays
very important role in photosynthesis and transpiration.
Aim: To determine stomatal index of
Procedure: Select a matured mulberry leaf. Apply a thin layer of either gum or nail polish to the
lower surface of the leaf and leave it for 10 min for drying. After complete drying peel the gum
or nail polish layer carefully wi
peeled layer with a drop of diluted safranin and a drop of glycerin on a clean glass slide using
cover glass and observe under a microscope.
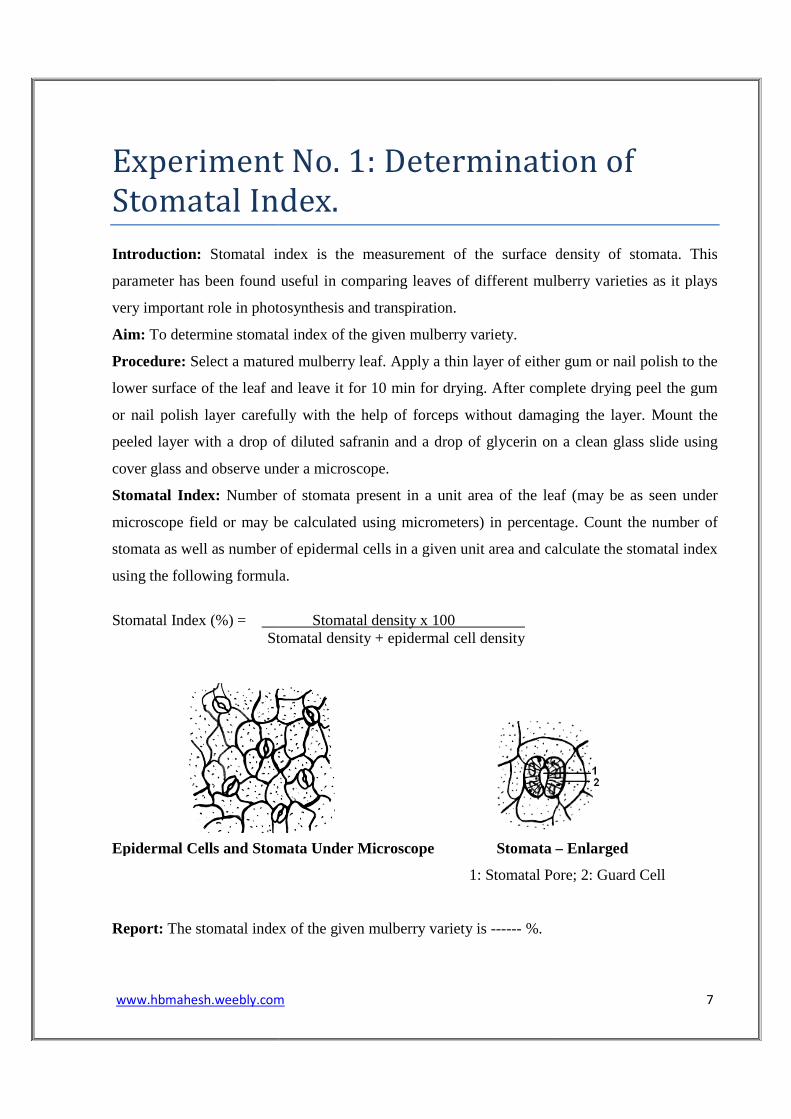
Stomatal Index: Number of stomata present in a unit area of the leaf (may be as seen under
microscope field or may be calculated using micrometers) in percentage. Count the number of
stomata as well as number of epidermal cells in a given unit area and calculate the stoma
using the following formula.
Stomatal Index (%) = Stomatal density + epidermal cell density
Epidermal Cells and Stomata U
Report: The stomatal index of the given
www.hbmahesh.weebly.com
Experiment No. 1: Determination of
Stomatal Index.
index is the measurement of the surface density of stomata. This
parameter has been found useful in comparing leaves of different mulberry varieties as it plays
very important role in photosynthesis and transpiration.
To determine stomatal index of the given mulberry variety.
Select a matured mulberry leaf. Apply a thin layer of either gum or nail polish to the
lower surface of the leaf and leave it for 10 min for drying. After complete drying peel the gum
or nail polish layer carefully with the help of forceps without damaging the layer. Mount the
peeled layer with a drop of diluted safranin and a drop of glycerin on a clean glass slide using
cover glass and observe under a microscope.
Number of stomata present in a unit area of the leaf (may be as seen under
microscope field or may be calculated using micrometers) in percentage. Count the number of
stomata as well as number of epidermal cells in a given unit area and calculate the stoma
using the following formula.
Stomatal density x 100 . Stomatal density + epidermal cell density
Epidermal Cells and Stomata Under Microscope Stomata –
1: Stomatal Pore; 2: Guard C
The stomatal index of the given mulberry variety is ------ %.
7
Experiment No. 1: Determination of
index is the measurement of the surface density of stomata. This
parameter has been found useful in comparing leaves of different mulberry varieties as it plays
Select a matured mulberry leaf. Apply a thin layer of either gum or nail polish to the
lower surface of the leaf and leave it for 10 min for drying. After complete drying peel the gum
th the help of forceps without damaging the layer. Mount the
peeled layer with a drop of diluted safranin and a drop of glycerin on a clean glass slide using
Number of stomata present in a unit area of the leaf (may be as seen under
microscope field or may be calculated using micrometers) in percentage. Count the number of
stomata as well as number of epidermal cells in a given unit area and calculate the stomatal index
– Enlarged
1: Stomatal Pore; 2: Guard Cell

www.hbmahesh.weebly.com 8
Experiment No. 2: Kranz Anatomy.
Introduction: Kranz means wreath in German (A wreath is an assortment of flowers, leaves,
fruits, twigs, cells or various materials that is constructed to resemble a ring). Kranz anatomy
refers to an arrangement of bundle sheath cells surrounded by mesophyll cells in C4 plants. This
arrangement ensures that mesophyll cells are no more than 2-4 cell layers away from the bundle
sheath cells. Hence, the transport of C4 cycle metabolites is facilitated via plasmodesmata
through these two cell types.
Plants are categorized as C3 and C4 plants based on the nature of carbon compounds
formed during carbon dioxide fixation. Generally in plants like dicots eg., in mulberry a three
carbon compound phosphoglyceric acid (PGA) is formed as a first stable compound during CO2
fixation and therefore such plants are called as C3 plants. However, in some monocots eg.,
sugarcane, a four carbon compounds like oxaloacetate, malate and aspartate are formed during
CO2 fixation. Therefore, these plants are called as C4 plants.
Aim: To study the Kranz anatomy.
Procedure: Prepare a thin transverse section of mulberry as well as sugar cane leaf and mount
on a clean glass slide with a drop of glycerin and diluted Safranin. Observe under a microscope
and list out the differences.
Differences between C3 and C4 plants
Sl. No. C3 Plants C4 Plants
1 Non Kranz type anatomy. Kranz type anatomy i.e., has a concentric
arrangement of the bundle sheath and mesophyll
layer, the bundle sheath is also thicker.
2 Bundle sheath cells are absent.
Carbon fixation and Calvin
cycle reactions occur in
mesophyll cells only.
Bundle sheath cells are present and contain
chloroplasts. Carbon is fixed in mesophyll cells
and then transported to bundle sheath cells
where Calvin cycle reactions occur.
3 A 3 carbon compound
phosphoglyceric acid (PGA) is
Four carbon compounds like oxaloacetate,
malate and aspartate are formed during CO2
www.hbmahesh.weebly.com
formed as a first stable
compound.
4 Ribulose 1,5 bisphosphate
carboxylase
(RuBisCo) is the CO
5 Only C3 pathway is present and
involves in CO2 fixation.
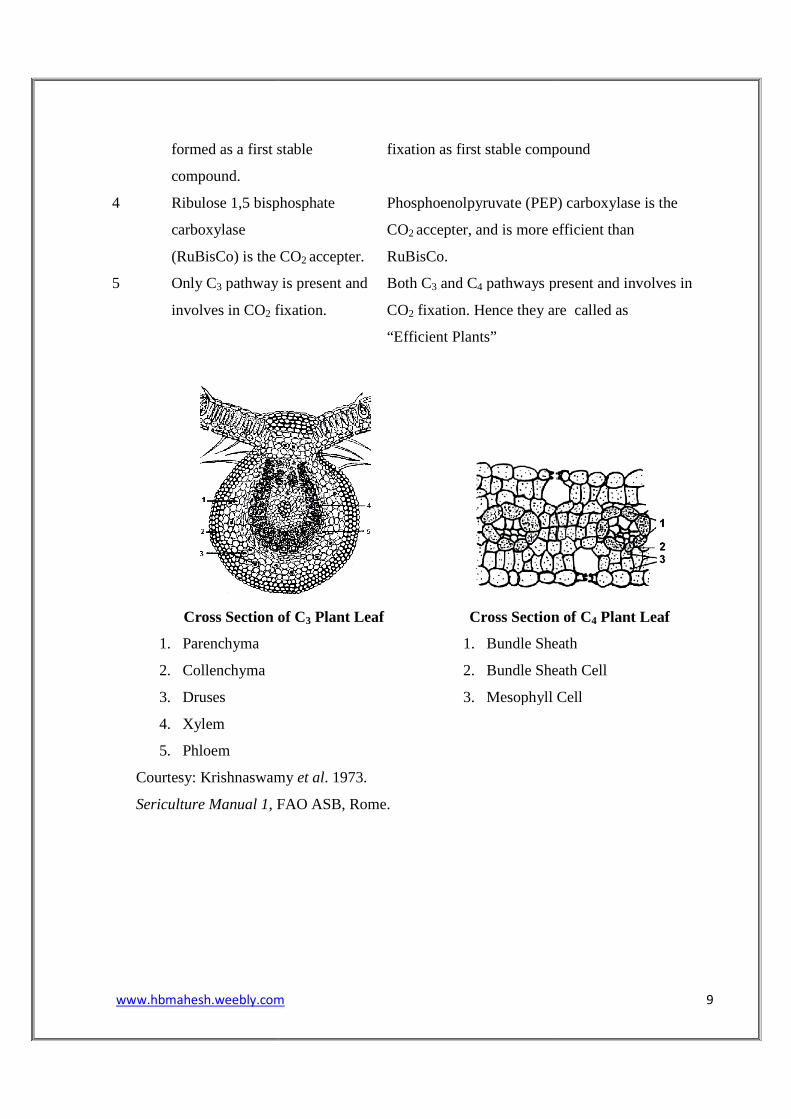
Cross Section of C
1. Parenchyma
2. Collenchyma
3. Druses
4. Xylem
5. Phloem
Courtesy: Krishnaswamy
Sericulture Manual 1, FAO ASB, Rome.
www.hbmahesh.weebly.com
formed as a first stable fixation as first stable compound
Ribulose 1,5 bisphosphate
(RuBisCo) is the CO2 accepter.
Phosphoenolpyruvate (PEP) carboxylase is the
CO2 accepter, and is more efficient than
RuBisCo.
pathway is present and
fixation.
Both C3 and C4 pathways present and involves in
CO2 fixation. Hence they are called as
“Efficient Plants”
Cross Section of C3 Plant Leaf
Courtesy: Krishnaswamy et al. 1973.
, FAO ASB, Rome.
Cross Section of C
1. Bundle Sheath
2. Bundle Sheath Cell
3. Mesophyll Cell
9
st stable compound
Phosphoenolpyruvate (PEP) carboxylase is the
accepter, and is more efficient than
pathways present and involves in
fixation. Hence they are called as
Cross Section of C4 Plant Leaf
Bundle Sheath
Bundle Sheath Cell
Mesophyll Cell

www.hbmahesh.weebly.com 10
Experiment No. 3: Estimation of
Mulberry Leaf Proteins.
Aim: To estimate the mulberry leaf protein by Biuret method.
Principle: The –CO-NH- bond (peptide) in polypeptide chain reacts with copper sulphate in an
alkaline medium to give a purple colour which can be measured at 540 nm.
Reagents Required:
1. Biuret Reagent: Dissolve 3 g of copper sulphate (CuSO4.5H2O) and 9 g of sodium potassium
tartarate in 500 ml of 0.2 mol/liter sodium hydroxide; add 5 g of potassium iodide and make
up to 1 liter with 0.2 mol/liter sodium hydroxide.
2. Protein Standard: Dissolve 250 mg Bovine Serum Albumin (BSA) in 50 ml of 0.1 N NaOH
in a volumetric flask. One ml of this solution contains 5 mg BSA.
3. Mulberry Leaf Extract: Prepare 0.5% homogenate in 0.1 N NaOH / Distilled water using
mortar and pestle, centrifuge at 3000 rpm for 10 min, collect the clear supernatant and use as
sample.
Apparatus and Glass wares required: Test tubes, Pipettes, Colorimeter, etc.,
Procedure:
1. Pipette out 0.0, 0.2, 0.4, 0.6, 0.8 and 1 ml of working standard protein solution in to the series
of labeled test tubes.
2. Pipette out 1 ml of the given sample (mulberry leaf extract) in another test tube.
3. Make up the volume to 1 ml in all the test tubes with distilled water. A tube with 1 ml of
distilled water serves as the blank.
4. Now add 3 ml of Biuret reagent to all the test tubes including the test tubes labeled 'blank'
and 'sample' (mulberry leaf homogenate).
5. Mix the contents of the tubes by vortexing / shaking the tubes and warm at 37 ºC for 10 min.
6. Now cool the contents and record the absorbance at 540 nm against blank.
7. Then plot the standard curve by taking concentration of protein along X-axis and absorbance
at 540 nm along Y-axis.
For drawing Standard Graph please refer last page figure 1.
8. Then from this standard curve calculate the concentration of protein in the given sample.
www.hbmahesh.weebly.com 11
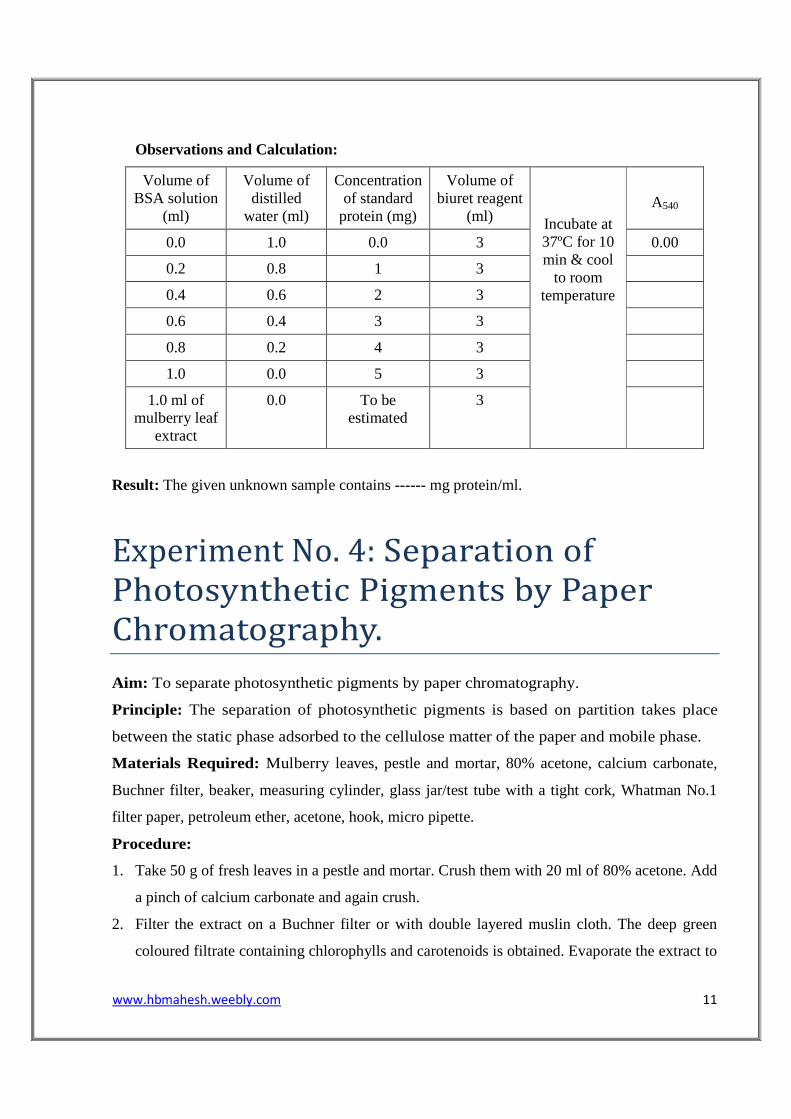
Observations and Calculation:
Volume of BSA solution
(ml)
Volume of distilled
water (ml)
Concentration of standard
protein (mg)
Volume of biuret reagent
(ml)
Incubate at 37ºC for 10 min & cool
to room temperature
A540
0.0 1.0 0.0 3 0.00
0.2 0.8 1 3
0.4 0.6 2 3
0.6 0.4 3 3
0.8 0.2 4 3
1.0 0.0 5 3
1.0 ml of mulberry leaf
extract
0.0 To be estimated
3
Result: The given unknown sample contains ------ mg protein/ml.
Experiment No. 4: Separation of
Photosynthetic Pigments by Paper
Chromatography.
Aim: To separate photosynthetic pigments by paper chromatography.
Principle: The separation of photosynthetic pigments is based on partition takes place
between the static phase adsorbed to the cellulose matter of the paper and mobile phase.
Materials Required: Mulberry leaves, pestle and mortar, 80% acetone, calcium carbonate,
Buchner filter, beaker, measuring cylinder, glass jar/test tube with a tight cork, Whatman No.1
filter paper, petroleum ether, acetone, hook, micro pipette.
Procedure:
1. Take 50 g of fresh leaves in a pestle and mortar. Crush them with 20 ml of 80% acetone. Add
a pinch of calcium carbonate and again crush.
2. Filter the extract on a Buchner filter or with double layered muslin cloth. The deep green
coloured filtrate containing chlorophylls and carotenoids is obtained. Evaporate the extract to

www.hbmahesh.weebly.com
concentrate.
3. Take a glass jar (about 45cm high) with a tight cork fitted in it. The cork should have a hole
in the centre to fix the hook.
4. Now prepare the solvent by mixing 25 ml petroleum ether and 3 ml acetone. Pour the solvent
into the jar and allow the jar to become saturated.
5. Cut a strip of filter paper of the size which can easily be hung on the hook. Apply a circular
spot of pigment extract about 3cm from the base of strip with the help of a micropipette.
Now hang the strip inside th
that the spot is not dipped in the solvent. Make the apparatus air tight and observe.
Experimental set up during running Chromatogram
1. Cork to minimize evaporation of solvent
2. Paper clip hook to hold the paper
3. Filter paper
4. Spot of pigment
5. Solvent
Observation:
The solvent will run on the filter paper. After few hours, the chloroplast pigments will be
separated in the form of different spots on the paper. Take out the paper when the solvent
reaches up to the upper level. After drying the paper, identify the diffe
help of their specific colours. Carotene is yellow, Xanthop
blue green and Chlorophyll
www.hbmahesh.weebly.com
Take a glass jar (about 45cm high) with a tight cork fitted in it. The cork should have a hole
in the centre to fix the hook.
Now prepare the solvent by mixing 25 ml petroleum ether and 3 ml acetone. Pour the solvent
jar and allow the jar to become saturated.
Cut a strip of filter paper of the size which can easily be hung on the hook. Apply a circular
spot of pigment extract about 3cm from the base of strip with the help of a micropipette.
Now hang the strip inside the jar to the hook of cork and close the cork. Care should be taken
that the spot is not dipped in the solvent. Make the apparatus air tight and observe.
Experimental set up during running Chromatogram
1. Cork to minimize evaporation of solvent
2. Paper clip hook to hold the paper
3. Filter paper
4. Spot of pigment
5. Solvent
The solvent will run on the filter paper. After few hours, the chloroplast pigments will be
separated in the form of different spots on the paper. Take out the paper when the solvent
reaches up to the upper level. After drying the paper, identify the diffe
help of their specific colours. Carotene is yellow, Xanthophyll is yellow
blue green and Chlorophyll-b is olive green in colour.
12
Take a glass jar (about 45cm high) with a tight cork fitted in it. The cork should have a hole
Now prepare the solvent by mixing 25 ml petroleum ether and 3 ml acetone. Pour the solvent
Cut a strip of filter paper of the size which can easily be hung on the hook. Apply a circular
spot of pigment extract about 3cm from the base of strip with the help of a micropipette.
e jar to the hook of cork and close the cork. Care should be taken
that the spot is not dipped in the solvent. Make the apparatus air tight and observe.
Experimental set up during running Chromatogram
The solvent will run on the filter paper. After few hours, the chloroplast pigments will be
separated in the form of different spots on the paper. Take out the paper when the solvent
reaches up to the upper level. After drying the paper, identify the different pigments with the
ll is yellow-brown, Chlorophyll-a is

www.hbmahesh.weebly.com 13
Experiment No. 5: Extraction of
Photosynthetic Pigments by Solvent
Wash Method.
Aim: To separate photosynthetic pigments by solvent wash method.
Principle: The separation of photosynthetic pigments is based on solubility of different
pigments with specific solvents.
Materials Required: Mulberry leaves, pestle and mortar, 80% acetone, calcium carbonate,
separating funnel, beaker, measuring cylinder, petroleum ether, acetone, diethyl ether, 30%
methanolic KOH, 95% methanol, distilled water etc.,.
Procedure:
1. Take 10 g of fresh leaves in a pestle and mortar. Crush them with 40 ml of 80% acetone.
Add a pinch of calcium carbonate, crush again and filter the extract on a Buchner filter or
double layered muslin cloth.
2. Fill the homogenate in to separating funnel, add equal amount of petroleum ether, shake the
contents gently and leave it for separation of acetone and petroleum ether layers. The upper
petroleum ether layer contains all the pigments. Care should be taken to release the pressure
built up in the separating funnel by opening the top lid.
3. Discard the lower acetone layer by opening the tap of separating funnel. Wash the petroleum
ether layer with 20-30 ml of distilled water, discard lower water layer.
4. Now to the petroleum ether layer add 20 ml of 95% methanol mix the contents by shaking
and leave it for separation of upper petroleum ether and lower methanol layers.
5. Collect the lower methanol layer and store it separately.
6. To the upper petroleum ether layer add 16 ml of 30 % methanolic KOH and 4 ml of distilled
water shake gently; leave the contents for the separation of two layers. Collect the upper blue
green petroleum ether layer and lower yellowish methanolic KOH layers separately as
chlorophyll a and carotenes.
7. Now take methanol fraction (collected and stored at step 5) in separating funnel and add
equal amount of diethyl ether (16 ml) as well as distilled water (4 ml). Mix the contents and
discard lower methanol layer as it contains no pigments.

www.hbmahesh.weebly.com
8. To the upper diethyl ether fraction add equal amount of methanolic KOH and distilled water
(8+8 ml), mix gently and collect upper diethyl ether layer contains greenish chlorophyll b
and lower methanolic KOH layer contains orange red xanthophylls.
Observation: After isolation identify the different pigments with the help of their specific
colours as shown in the previous experiment.
www.hbmahesh.weebly.com
iethyl ether fraction add equal amount of methanolic KOH and distilled water
(8+8 ml), mix gently and collect upper diethyl ether layer contains greenish chlorophyll b
and lower methanolic KOH layer contains orange red xanthophylls.
olation identify the different pigments with the help of their specific
colours as shown in the previous experiment.
14
iethyl ether fraction add equal amount of methanolic KOH and distilled water
(8+8 ml), mix gently and collect upper diethyl ether layer contains greenish chlorophyll b
olation identify the different pigments with the help of their specific

www.hbmahesh.weebly.com 15
Experiment No. 6: Determination of
Water Potential of Potato Tubers.
Aim: To determine the water potential of potato tubers.
Principle: Water potential is the potential energy unit volume relative to pure water in reference
conditions. The measure of the relative tendency of water to move from one area to another, and
is commonly represented by the Greek letter Ψ (Psi).
Water potential (Ψ) is a measure of the driving force that governs the movement of water
from the soil into plants and finally into the atmosphere. Water potential is the amount of energy
per unit volume (or pressure) contained in a system (like a plant cell, tissue, or soil) and is
expressed in units of megapascals (Mpa). For reference, pure water in a free standing solution
has a water potential of zero, while most plant cells have a negative water potential. Water
potential of a plant cell is made up of two important components, and the relationship among
these components is expressed mathematically as:
Ψ = Ψs + Ψp Ψ is the overall water potential of a cell.
Ψs is the solute or osmotic potential and represents the contribution made by dissolved
solutes to Ψ.
Ψp is the pressure potential and represents the contribution made by pressure to Ψ.
Procedure:
1) Prepare the following sucrose solutions i.e., 0.0 (distilled water), 0.2, 0.4, 0.6, 0.8 and 1 M
sucrose.
2) Cut 6 cylinders from a potato and trim each cylinder to 4 cm in length with a knife.
3) Quickly blot the cylinders on paper towels to remove any excess moisture and weigh the
cylinders. Record the weights in following table. After weighing, quickly transfer one
cylinder to each beaker and ensure that they are fully immersed in the solution.
4) After 45 minutes, remove the cylinders, blot excess moisture with paper towels, and reweigh
them, exactly as in step 3. Record the weights in following table.
www.hbmahesh.weebly.com 16
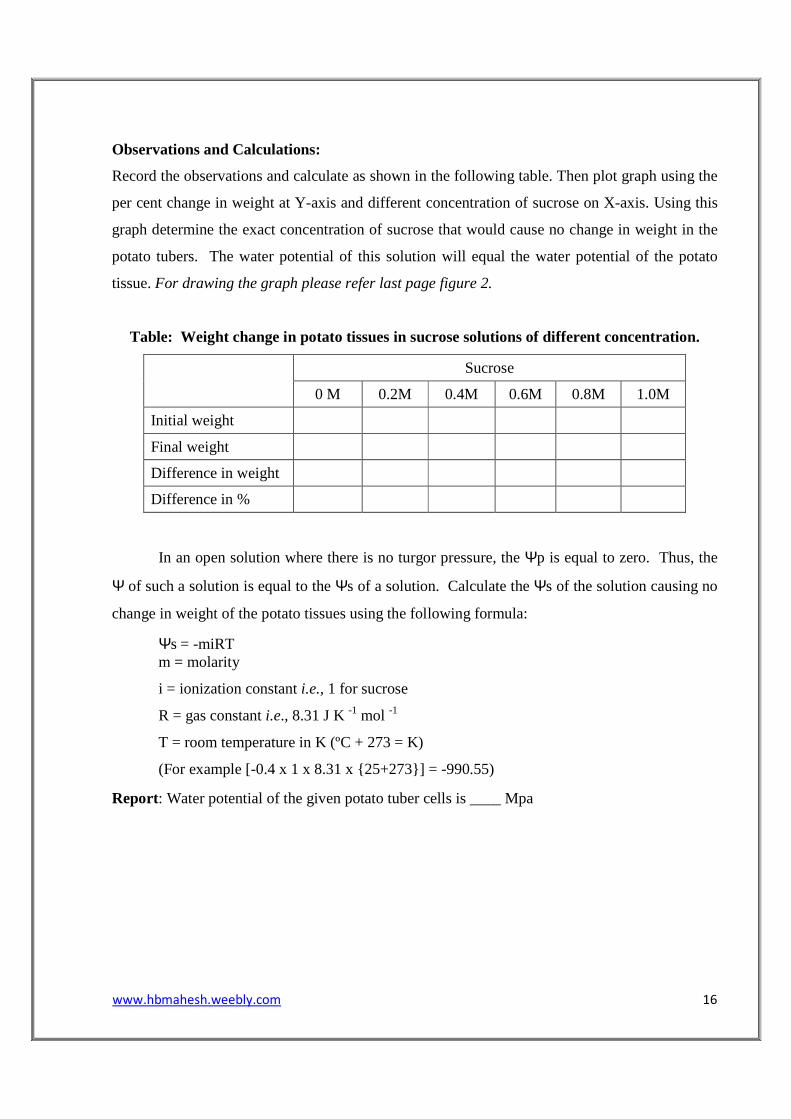
Observations and Calculations:
Record the observations and calculate as shown in the following table. Then plot graph using the
per cent change in weight at Y-axis and different concentration of sucrose on X-axis. Using this
graph determine the exact concentration of sucrose that would cause no change in weight in the
potato tubers. The water potential of this solution will equal the water potential of the potato
tissue. For drawing the graph please refer last page figure 2.
Table: Weight change in potato tissues in sucrose solutions of different concentration.
Sucrose
0 M 0.2M 0.4M 0.6M 0.8M 1.0M
Initial weight
Final weight
Difference in weight
Difference in %
In an open solution where there is no turgor pressure, the Ψp is equal to zero. Thus, the
Ψ of such a solution is equal to the Ψs of a solution. Calculate the Ψs of the solution causing no
change in weight of the potato tissues using the following formula:
Ψs = -miRT m = molarity
i = ionization constant i.e., 1 for sucrose
R = gas constant i.e., 8.31 J K -1 mol -1
T = room temperature in K (ºC + 273 = K)
(For example [-0.4 x 1 x 8.31 x {25+273}] = -990.55)
Report: Water potential of the given potato tuber cells is ____ Mpa

www.hbmahesh.weebly.com 17
Experiment No. 7: Estimation of
Moisture Per Cent Age and Moisture
Retention Capacity of Mulberry Leaf.
Aim: To determine the moisture per cent age and moisture retention capacity of the given
mulberry varieties.
Principle: Water is one of the important constituents of mulberry leaves and it plays an
important role in silkworm crop production. Moisture content varies with variety, season, age of
the plant and preservation techniques followed. It is usually expressed in terms of per cent age.
Procedure: Collect the mulberry leaf samples from garden by plucking the lateral branches as a
whole. Separate the individual types of leaves as tender (for chawki worms) and matured (for
late age worms) leaves. Record the initial weight of the leaves (W1) and preserve them under
standard conditions for 12 or 24 hours. After this preservation, record the second weight of
leaves (W2). After 12 or 24 hours of preservation, keep the same mulberry leaves in an oven at
100 ºC for 2-3 hours or until complete drying of mulberry leaves. After drying, record the weight
of dried mulberry leaves (W3) as final weight. From this observations calculate the per cent age
of water in mulberry leaves, per cent age of water loss and moisture retention capacity of the
different mulberry varieties using the following formulae.
Observations and Calculations
Mulberry variety Fresh weight
(W1)
Second weight
(W2)
Final weight
(W3)
Moisture %
Moisture loss %
Moisture retention capacity
%
M5 Tender
M5 Matured
Mysore Local Tender
Mysore Local Matured
Moisture % = W1 – W3 X 100 W1

www.hbmahesh.weebly.com
Moisture loss % W1 – Fresh weight of leaves
W2 – Second weight of leaves
W3 – Dried weight of leaves
Moisture Retention Capacity = 100
*Fresh weight is considered as 100%
Experiment No. 8:
Aim: To study the Hill reaction.
Principle: One of the first steps of photosynthesis is the photolysis of water to donate two
electrons to the reaction center, P680.
donated to P680 move through an electron transport chain to the reaction
eventually, to reduce NADP to NADPH.
Other electron acceptors can be substituted for NADP, which allow the Hill reaction to be
measured, and some of its components studied.
the dye 2,6 dichlorophenol indophenol (DCIP), which can accept electrons instead of P700.
When DCIP is added to a chloroplast or thylakoid suspension, the following reaction occurs:
DCIP is a blue color in its oxidiz
allows the measurement of the rate of the Hill reaction.
Reagents Required:
1. Potassium phosphate buffer
2. DCIP: 30 µg/ml DCIP in distilled water.
www.hbmahesh.weebly.com
Moisture loss % = W1 – W2 X 100 W1
Fresh weight of leaves
Second weight of leaves
Dried weight of leaves
Moisture Retention Capacity = 100 – Moisture loss %
*Fresh weight is considered as 100%
Experiment No. 8: Hill Reaction.
To study the Hill reaction.
One of the first steps of photosynthesis is the photolysis of water to donate two
electrons to the reaction center, P680. This reaction is known as the Hill reaction.
donated to P680 move through an electron transport chain to the reaction
eventually, to reduce NADP to NADPH. The complete reaction can be summarized as follows:
Other electron acceptors can be substituted for NADP, which allow the Hill reaction to be
measured, and some of its components studied. The most commonly used electron acceptor is
the dye 2,6 dichlorophenol indophenol (DCIP), which can accept electrons instead of P700.
When DCIP is added to a chloroplast or thylakoid suspension, the following reaction occurs:
DCIP is a blue color in its oxidized form. When reduced, it is colorless. This property of DCIP
allows the measurement of the rate of the Hill reaction.
Potassium phosphate buffer: 125 mM pH 7.5 with 0.3 M sucrose.
: 30 µg/ml DCIP in distilled water.
18
Hill Reaction.
One of the first steps of photosynthesis is the photolysis of water to donate two
This reaction is known as the Hill reaction. The electrons
donated to P680 move through an electron transport chain to the reaction center P700, and
The complete reaction can be summarized as follows:
Other electron acceptors can be substituted for NADP, which allow the Hill reaction to be
commonly used electron acceptor is
the dye 2,6 dichlorophenol indophenol (DCIP), which can accept electrons instead of P700.
When DCIP is added to a chloroplast or thylakoid suspension, the following reaction occurs:
When reduced, it is colorless. This property of DCIP

www.hbmahesh.weebly.com 19
Procedure: Prepare 25% homogenate of fresh Spinach leaves in potassium phosphate buffer
with 0.3M sucrose, filter and centrifuge the filtrate at 3000 rpm for 5 min. Re-suspend the
chloroplast pellet in 10 ml of buffer and store on ice. In a test tube take 1.9 ml water, 3 ml buffer,
0.5 ml chloroplast suspension and 0. 1 ml DCIP, mix and incubate in sunlight for 1 hour. A
suitable control should also be prepared and incubate in dark. Prepare a standard curve using
different concentrations of DCIP on X-axis against absorption at 550 nm on Y-axis.
For drawing Standard Graph please refer last page figure 1.
Then from this standard curve calculate the amount of DCIP reduced.
Standard Curve:
Sl. No. Water
(ml)
DCIP
(ml)
Concentration of DCIP (µg)
A550
1 5.5 0.0 0 0.00
2 5.3 0.2 6
3 5.1 0.4 12
4 4.9 0.6 18
5 4.7 0.8 24
6 4.5 1.0 30
Test:
Experiment Water
(ml)
Buffer
(ml)
Chloroplasts
(ml)
DCIP
(ml)
A550 against water
T-1
Incubated in dark 1.9 3 0.5 0.1
T-2
Incubated in sunlight 1.9 3 0.5 0.1
Calculation:
Amount of DCIP reduced = O D of T-1 – O D of T-2 = ……..
Report: The given sample showed ------- µmole of DCIP reduced per hour.

www.hbmahesh.weebly.com 20
PART-B: PHYSIOLOGY OF SILKWORM

www.hbmahesh.weebly.com 21
Experiment No. 9: Estimation of
Haemolymph Proteins.
Aim: To estimate the haemolymph proteins using Lowry’s method.
Principle: The –CO-NH- bond (peptide) in polypeptide chain reacts with copper sulphate in an
alkaline medium to give a blue colored complex. In addition, tyrosine and tryptophan residues of
protein cause reduction of the phosphomolybdate and phosphotungstate components of the
Folin-Ciocalteau reagent to give bluish products which contribute towards enhancing the
sensitivity of this method.
Reagents Required:
1. Reagent A: 2% sodium carbonate in 0.1 N sodium hydroxide.
2. Reagent B: 0.5% copper sulphate (CuSO4.5H2O) in 1% potassium sodium tartarate. Prepare
fresh by mixing stock solutions.
3. Reagent C (Alkaline copper solution): Mix 50 ml of reagent A and 1 ml of reagent B prior
to use.
4. Reagent D (Diluted Folin’s reagent): Dilute Folin-Ciocalteau reagent with an equal volume
of 0.1 N NaOH
5. Standard: Dissolve 50 mg BSA in 50 ml of 0.1 N NaOH in a volumetric flask. Take 10ml of
this stock standard and dilute to 50 ml in another flask for working standard solution. One ml
of this solution contains 200 µg protein.
6. Haemolymph Sample: Dilute the haemolymph 250 times with distilled water containing
1mM thiourea.
Apparatus and Glass wares required: Test tubes, Pipettes, Colorimeter, etc.,
Procedure:
1. Pipette out 0.0, 0.2, 0.4, 0.6, 0.8 and 1 ml of working standard in to the series of labeled test
tubes.
2. Pipette out 1 ml of the sample in another test tube.
3. Make up the volume to 1 ml in all the test tubes. A tube with 1 ml of distilled water serves as
the blank.
www.hbmahesh.weebly.com 22
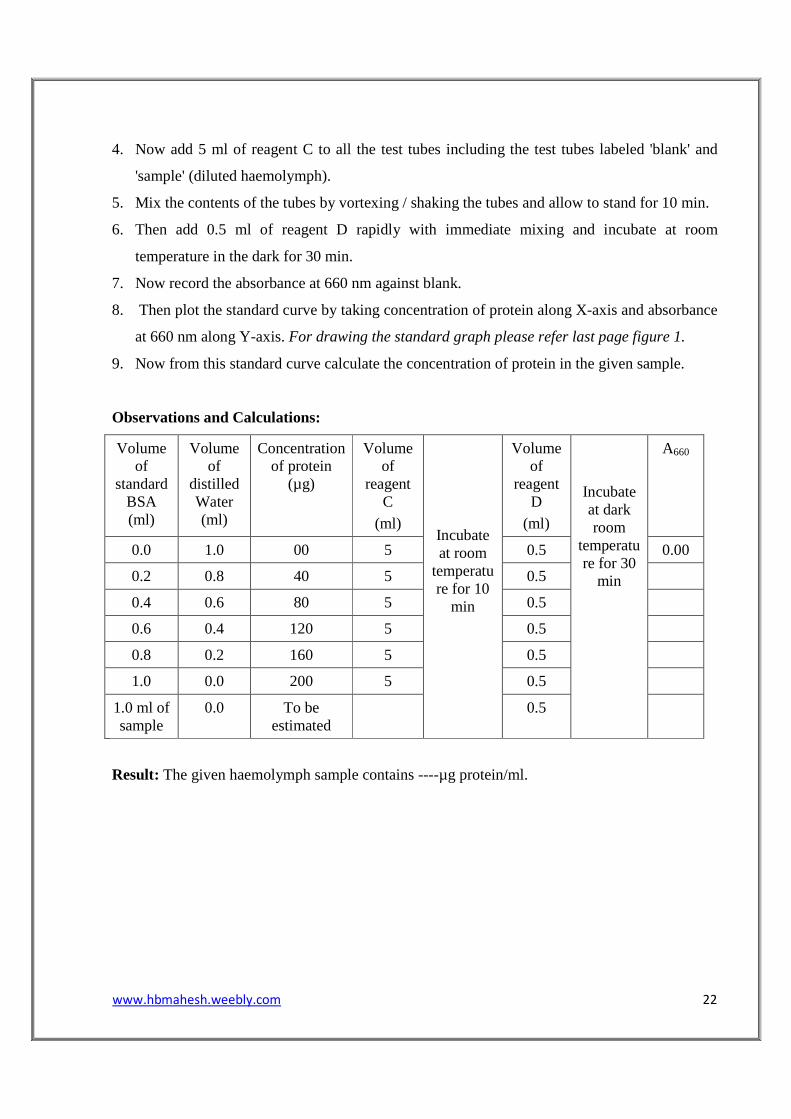
4. Now add 5 ml of reagent C to all the test tubes including the test tubes labeled 'blank' and
'sample' (diluted haemolymph).
5. Mix the contents of the tubes by vortexing / shaking the tubes and allow to stand for 10 min.
6. Then add 0.5 ml of reagent D rapidly with immediate mixing and incubate at room
temperature in the dark for 30 min.
7. Now record the absorbance at 660 nm against blank.
8. Then plot the standard curve by taking concentration of protein along X-axis and absorbance
at 660 nm along Y-axis. For drawing the standard graph please refer last page figure 1.
9. Now from this standard curve calculate the concentration of protein in the given sample.
Observations and Calculations:
Volume of
standard BSA (ml)
Volume of
distilled Water (ml)
Concentration of protein
(µg)
Volume of
reagent C
(ml)
Incubate at room
temperature for 10
min
Volume of
reagent D
(ml)
Incubate at dark room
temperature for 30
min
A660
0.0 1.0 00 5 0.5 0.00
0.2 0.8 40 5 0.5
0.4 0.6 80 5 0.5
0.6 0.4 120 5 0.5
0.8 0.2 160 5 0.5
1.0 0.0 200 5 0.5
1.0 ml of sample
0.0 To be estimated
0.5
Result: The given haemolymph sample contains ----µg protein/ml.

www.hbmahesh.weebly.com 23
Experiment No. 10: Estimation of
Haemolymph Glucose Level.
Aim: To estimate haemolymph glucose level by DNS method.
Principle: Several reagents have been employed which assay sugars by using their reducing
properties. One such compound is 3, 5- dinitrosalicylic acid (DNS) which in alkaline solution is
reduced to 3-amino 5-nitrosalicylic acid.
Reagents Required:
1. Sodium potassium tartarate: Dissolve 300 gm of this salt in about 500 ml of water.
2. 3, 5-dinitrosalicylic acid: dissolve 10 gm of this powder in 200 ml of 2 mol/lt sodium
hydroxide.
3. Dinitrosalicylic acid reagent: Prepare this fresh by mixing solutions 1 and 2 and make up to
1 liter with water.
4. Sodium hydroxide: 2 mol/liter
5. Stock glucose standard: 1gm/liter solution in saturated benzoic acid.
6. Working sugar standard: Dilute stock standard solution in 1:1 ratio with distilled water to
get 500 µg/ml glucose.
Preparation of protein free filtrate: To 1 ml haemolymph sample, add 8 ml distilled water, 0.5
ml of 2/3 N sulfuric acid and 0.5 ml of 10% sodium tungstate solution in a stoppered centrifuge
tube and mix the contents. Then centrifuge at 3000 rpm for 10 min and collect the supernatant as
sample.
Procedure:
1. Pipette out 0.0, 0.2, 0.4, 0.6, 0.8 and 1 ml of working standard in to the series of labeled test
tubes.
2. Pipette out 1 ml of the given haemolymph sample (protein free filtrate) in another test tube.
3. Make up the volume to 1 ml in all the test tubes. A tube with 1 ml of distilled water serves as
the blank.
www.hbmahesh.weebly.com 24
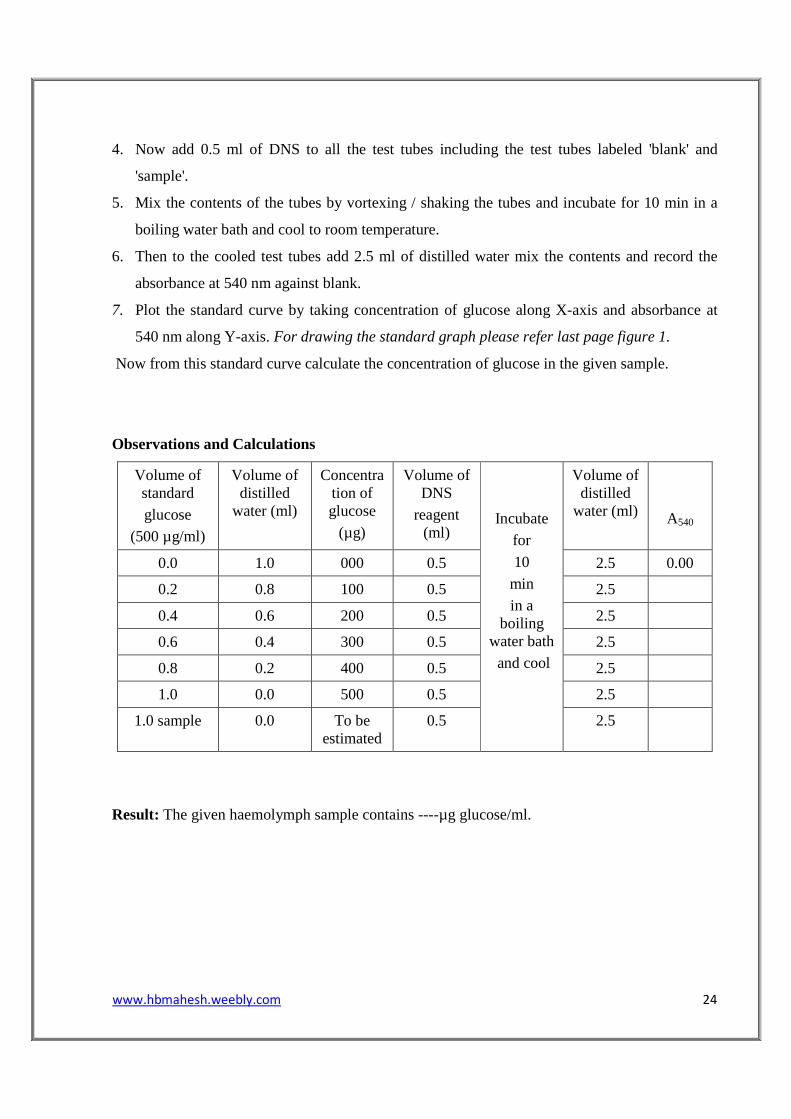
4. Now add 0.5 ml of DNS to all the test tubes including the test tubes labeled 'blank' and
'sample'.
5. Mix the contents of the tubes by vortexing / shaking the tubes and incubate for 10 min in a
boiling water bath and cool to room temperature.
6. Then to the cooled test tubes add 2.5 ml of distilled water mix the contents and record the
absorbance at 540 nm against blank.
7. Plot the standard curve by taking concentration of glucose along X-axis and absorbance at
540 nm along Y-axis. For drawing the standard graph please refer last page figure 1.
Now from this standard curve calculate the concentration of glucose in the given sample.
Observations and Calculations
Volume of standard
glucose
(500 µg/ml)
Volume of distilled
water (ml)
Concentration of glucose
(µg)
Volume of DNS
reagent (ml)
Incubate
for
10
min
in a boiling
water bath
and cool
Volume of distilled
water (ml)
A540
0.0 1.0 000 0.5 2.5 0.00
0.2 0.8 100 0.5 2.5
0.4 0.6 200 0.5 2.5
0.6 0.4 300 0.5 2.5
0.8 0.2 400 0.5 2.5
1.0 0.0 500 0.5 2.5
1.0 sample 0.0 To be estimated
0.5 2.5
Result: The given haemolymph sample contains ----µg glucose/ml.

www.hbmahesh.weebly.com 25
Experiment No. 11: Preparation of
Silkworm Haemocytes.
Aim: To prepare the silkworm haemocytes.
Reagents Required:
1. Phosphate-buffered saline with 10% formalin: 10mM Na2HPO4, 138mM NaCl, and
2.7mM KCl, pH 7.4 containing 10% formalin and 1mM thiourea.
2. Lishman’s Stain: Dissolve 0.6 g Leishman’s stain powder in 400 ml Methanol. Or ready
solution may be used.
Procedure:
1. Collect the haemolymph from 5th instar silkworm larvae in a clean pre cooled micro
centrifuge tube by puncturing the caudal horn.
2. Then, immediately mix 200 µl of haemolymph with one ml of phosphate buffered saline and
leave it for 5 min at room temperature.
3. Now, centrifuge the above preparation at 1000 rpm for 3 min.
4. After centrifugation remove the supernatant with a micro pipette carefully, re-suspend the
palette with 50 µl of phosphate buffered saline, drop on a clean glass slide.
5. Air dry the preparation, stain with Lishman’s stain for 2 min, wash excess stain in running
distilled water, air dry and observe under a microscope with a magnification of 450 X.
Observation:
Observe the haemocytes and record the results as number of different types with reference to the
following photograph.

www.hbmahesh.weebly.com
Courtesy: Takashi et al. 2008.
Experiment No 12.
Amylase Activity in Haemolymph
Bivoltine and Multivoltine R
Aim: To estimate the amylase activity in haemolymph of bivoltine and multivoltine silkworm
strains.
Principle: When amylase acts on starch, it is converted in to glucose uni
units react with 3, 5-dinitrosalicylic acid (DNS) in alkaline solution to give rise to orange
coloured complex, which can be measured at 540 nm.
Reagents Required:
1. Phosphate buffer 0.1 M pH 7.8:
a. 0.1 M KH2PO4: Dissolve 1.360 g of
b. 0.1 M K2HPO4: Dissolve 1.7418 g of K
Mix the solutions a and b at 1:1 ratio and adjust the pH 7.8.
www.hbmahesh.weebly.com
2008. J. Insect Physiology (54): 454–461.
Experiment No 12. Estimation of
Amylase Activity in Haemolymph
Bivoltine and Multivoltine Races.
To estimate the amylase activity in haemolymph of bivoltine and multivoltine silkworm
When amylase acts on starch, it is converted in to glucose uni
dinitrosalicylic acid (DNS) in alkaline solution to give rise to orange
coloured complex, which can be measured at 540 nm.
Phosphate buffer 0.1 M pH 7.8:
: Dissolve 1.360 g of KH2PO4 in 100 ml of distilled water.
: Dissolve 1.7418 g of K2HPO4 in 100 ml of distilled water.
Mix the solutions a and b at 1:1 ratio and adjust the pH 7.8.
26
Figure: GR-F: Granulocyte
in the feeding phase.
GR-M: Granulocyte in the molting phase.
PL: Plasmatocyte. PR: Prohemocyte. SP: Spherulocyte. OE: Oenocytoid.
Estimation of
Amylase Activity in Haemolymph of
aces.
To estimate the amylase activity in haemolymph of bivoltine and multivoltine silkworm
When amylase acts on starch, it is converted in to glucose units. The resultant glucose
dinitrosalicylic acid (DNS) in alkaline solution to give rise to orange
in 100 ml of distilled water.
in 100 ml of distilled water.

www.hbmahesh.weebly.com 27
2. Haemolymph Sample: Dilute 100 µl of silkworm haemolymph with 1900 µl phosphate
buffer containing 1mM thiourea.
3. Substrate (1% starch): Dissolve 1 g soluble starch in 90 ml of distilled water and boil to get
clear solution. Make up to 100 ml with water.
4. DNS reagent: Please refer experiment number 11.
Procedure for Standard Curve: For preparation of standard curve please refer experiment
number 11 or same standard curve may used here for the estimation of amylase activity.
Procedure for Experiment:
1. Blank: Take 2 ml of phosphate buffer, 0.5 ml of substrate and 0.5 ml of inactivated
haemolymph sample or distilled water in a clean dry test tube.
2. Test 1: Take 2 ml of phosphate buffer, 0.5 ml of substrate and 0.5 ml of multivoltine
haemolymph samples in a clean dry test tube.
3. Test 2: Take 2 ml of phosphate buffer, 0.5 substrate and 0.5 ml of bivoltine haemolymph
samples in a clean dry test tube.
4. Mix the contents of the tubes by vortexing / shaking the tubes and incubate for 30 min at
37°C.
5. Now add 0.5 ml of DNS to all the test tubes, mix the contents of the tubes by vortexing /
shaking the tubes and incubate for 10 min in a boiling water bath and cool to room
temperature.
6. Then to the cooled test tubes add 0.5 ml of distilled water, mix the contents and record the
absorbance at 540 nm against blank.
Observations and Calculations
Buffer (ml)
Substrate (ml)
Enzyme sample (ml)
Mix,
incubate at 37°C
for
30’
DNS (ml)
Incubate
for
10
min
in a boiling water bath
and cool
D W
(ml)
A540
Blank 2 0.5 0.5
IE*
0.5 0.5 0.00
Test 1 (MV)
2 0.5 0.5 0.5 0.5
Test 2 (BV)
2 0.5 0.5 0.5 0.5
*IE - Inactivated Enzyme
www.hbmahesh.weebly.com 28
Amylase activity = Standard Curve Value X 60 X Dilution Factor (20) Sample taken (ml) X Time of incubation (min)
= -----µg of glucose released/ml of haemolymph sample/hour at 37°C
Result: The given multivoltine and bivoltine haemolymph samples shown ----- and ----- µg /ml /
hour at 37°C respectively.
Experiment No 13. Estimation of
Succinate Dehydrogenase Activity in the
Eggs/ Tissue.
Aim: To estimate succinate dehydrogenase activity in silkworm eggs.
Principle: Succinate dehydrogenase is one of the mitochondrial enzymes, which catalyzes the
conversion of succinate to fumerate. In this reaction FAD reduces to FADH2. In in vitro, the
lemon yellow colored INT accepts electrons and becomes red coloured farmazan which can be
measured at 495 nm.
Reagents Required:
1. Sodium phosphate buffer (0.1M, pH 7.4): Mix 16 ml (0.2 M) of monobasic and 84 ml (0.2
M) of dibasic and makeup to 200 ml with distilled water.
2. INT [2(4-iodophenyl)-3(4-nitrophenyl)-5-Phenyltetrazolium chloride]: 1mg/ml in distilled
water.
3. Sodium succinate: 15mM
4. Glacial acetic acid, Toluene etc.,
5. Sample: Prepare 0.2% egg (5 days old or more) homogenate in cold phosphate buffer/
distilled water using mortar and pestle. Centrifuge the homogenate at 3000 rpm for 10 min,
collect the clear supernatant and use as sample.
www.hbmahesh.weebly.com 29
Procedure for Standard Curve:
1. Pipette out 0.0, 0.2, 0.4, 0.6, 0.8 and 1 ml of INT in to the series of labeled test tubes.
2. Make up the volume to 1 ml in all the test tubes. A tube with 1 ml of distilled water serves as
the blank.
3. Now add 1 ml of buffer, 1 ml of sodium succinate and 1 ml of sample (egg homogenate) to all
the test tubes including the test tubes labeled 'blank' and 'test'.
4. Mix the contents of the tubes by vortexing / shaking the tubes and incubate at 37°C for 24 h or
until complete reduction of INT.
5. Now add 6 ml of glacial acetic acid to stop the reaction.
6. Then add 6 ml of toluene, mix and keep them in a refrigerator for separation of toluene layer.
7. Now collect the upper red coloured toluene layer containing farmazan in to a tube, cool to
room temperature and record the absorbance at 495 nm against blank.
8. Then plot the standard curve by taking concentration of farmazan (equivalent to INT) along
X-axis and absorbance at 495 nm along Y-axis.
For drawing the standard graph please refer last page figure 1.
Procedure for Test:
7. Blank: Take 1 ml of phosphate buffer, 1 ml of sodium succinate, 1 ml of INT and 1 ml of
inactivated enzyme sample (distilled water may be used) in a clean dry test tube, and
incubate at 37°C for one hour.
8. Test: Take 1 ml of phosphate buffer, 1 ml of sodium succinate, 1 ml of INT and 1 ml of
enzyme sample in a clean dry test tube, and incubate at 37°C for one hour.
After incubation add 6 ml of glacial acetic acid to both blank as well as test to stop the
reaction. Then add 6 ml of toluene to each tube, mix and keep them in a refrigerator to separate
the red farmazan. After separation, collect the upper red coloured toluene layer containing
farmazan in to a cuvette and record the absorbance at 495 nm against blank.

www.hbmahesh.weebly.com 30
Observations and Calculations:
Standard Curve:
INT (ml)
H2O (ml)
Buffer (ml)
Succinate (ml)
Sample (ml)
Mix, incubate at 37ºC for 24 h.
Acetic acid (ml)
Toluene (ml)
Mix & keep in a
fridge for 24 h.
Then collect
the upper layer
A495
0.0 1.0 1 1 1 6 6
0.2 0.8 1 1 1 6 6
0.4 0.6 1 1 1 6 6
0.6 0.4 1 1 1 6 6
0.8 0.2 1 1 1 6 6
1.0 0.0 1 1 1 6 6
Test:
Ex. INT (ml)
Buffer (ml)
Succinate (ml)
Sample (ml)
Mix & incubate at 37ºC for 1hr
Acetic acid (ml)
Toluene (ml)
Collect the
farmazan as above
A495
B 1 1 1 1 6 6 0.00
T 1 1 1 1 6 6
B - Blank
T - Test
Optical density of the test: ---
SDH activity level = Standard Curve Value X 60 . Tissue taken (mg) X Incubation time (min)
= ----- µg of farmazan formed per hour per mg at 37°C.
Report: The SDH activity in the given sample is ----- µg of farmazan formed per hour per mg
tissue at 37°C.

www.hbmahesh.weebly.com 31
Experiment No 14. Estimation of
Glycogen in Silkworm Fat Body/Tissue.
Aim: To estimate the amount of glycogen.
Principle: Glycogen is released from the tissue by heating with strong alkali and precipitated by
the addition of ethanol. Sodium sulphate is added as co-precipitant to give a quantitative yield of
glycogen.
Simple sugars, oligosaccharides, polysaccharides, and their derivatives, give an orange
yellow color when treated with phenol and concentrated sulfuric acid, which can be read at 490
nm.
Requirements:
1. 30% KOH.
2. Ethyl alcohol: 95% ethanol
3. 2 N H2SO4
4. Glycogen Standard: 100µg/ml in double distilled water.
5. Phenol: 5% solution.
6. H2SO4: 96-98%.
Procedure:
Isolation of Glycogen:
1. Place 1 g of freshly collected silkworm tissue into a calibrated stoppered centrifuge tube
containing 2 ml of 30% KOH and heat in a boiling water bath for 20 min with occasional
shaking.
2. Cool the tubes in ice, add 0.2 ml of saturated Na2SO4, and mix thoroughly.
3. Precipitate the glycogen by adding 5 ml of 95% ethanol, stand on ice for 5 min, and
centrifuge.
4. Discard the supernatant and dissolve the precipitated glycogen in about 5 ml of water with
gentle warming, then dilute with distilled water to the 10 ml calibration mark and mix
thoroughly. One ml of this sample is equivalent to 100 mg of tissue.

www.hbmahesh.weebly.com 32
Estimation of glycogen:
1. Pipette out 0.0, 0.2, 0.4, 0.6, 0.8 and 1 ml of glycogen standard in to the series of labeled test
tubes.
2. Pipette out 1 ml of isolated glycogen in another test tube.
3. Make up the volume to 1 ml in all the test tubes. A tube with 1 ml of distilled water serves as
the blank.
4. Now add 1 ml of phenol. Then rapidly pipette out 5 ml of H2SO4 to all the test tubes
including the test tubes labeled 'blank' and 'unknown'.
5. Mix the contents and incubate on ice bath for 30 min.
6. Then record the absorbance at 490 nm against blank.
7. Then plot the standard curve by taking concentration of glycogen standard along X-axis and
absorbance at 490 nm along Y-axis.
8. Then from this standard curve calculate the concentration of glycogen in the given test
sample.
Observations and Calculations:
Volume of standard glycogen
(ml)
Volume of distilled
water (ml)
Concentration of glycogen
(ml)
Volume of phenol (ml)
Volume of H2SO4
Incubate on Ice
bath for 30 min
A490
0.0 1.0 00 1 5 0.00
0.2 0.8 20 1 5
0.4 0.6 40 1 5
0.6 0.4 60 1 5
0.8 0.2 80 1 5
1.0 0.0 100 1 5
1.0 ml sample
0.0 To be estimated
1 5
Amount of glycogen silkworm litter = Standard Curve Value . Silkworm Tissue taken (mg)
= -------µg of glycogen/mg tissue
Result: The given unknown sample contains ----µg glycogen /mg tissue.

www.hbmahesh.weebly.com 33
Experiment No 15. Estimation of Uric
Acid in Silkworm Litter.
Aim: To estimate the amount of uric acid.
Principle: The uric acid reduces phosphotungstic acid in the presence of sodium carbonate to
blue coloured complex. The concentration of uric acid is directly proportional to intensity of
colour, which can be read at 700 nm.
Requirements:
1. Tungstic acid: Mix 25 ml of 10% sodium tungstate, 25 ml of 2/3 N H2SO4 and drop of
phosphoric acid, make up to 400 ml with distilled water. Store in a brown bottle.
2. Phosphotungstic acid (stock) solution: Dissolve 50 g of sodium tungstate in about 400 ml
of water. Add 40 ml of 85% phosphoric acid and reflux gently for 2 hours. Cool, transfer to
500 ml flask and make up to the mark with water. Keep this in a brown bottle
3. Dilute solution for use: Dilute 10 ml of the stock solution to 100 ml with water and store in
a brown bottle.
4. Sodium carbonate solution (10%): Dissolve 10 grams sodium carbonate in 100 ml of
distilled water.
5. Uric acid standard solution: Dissolve 60 mg of lithium carbonate in 15-20 ml of water in a
test tube. Heat the solution to 60 °C and pour on to 100 mg of uric acid taken in a small
beaker. Stir until dissolved, heat further if necessary. Add 2 ml of 40% formalin and then
slowly with shaking add 1 ml of 50% acetic acid. Make up to volume 100 ml and store in
brown bottle.
6. Uric acid working standard: Dilute 1 ml of the stock to 200 ml with water. Store in a
brown bottle. This contains 0.05 mg uric acid per ml.
Preparation of protein free filtrate: Take 100 mg of silkworm litter, wash with 10 ml
petroleum ether followed by 10 ml of acetone to remove green pigments and to the residue, add
10 ml of tungstic acid reagent in a stoppered centrifuge tube and homogenize the contents. Then
centrifuge at 3000 rpm for 10 min and collect the supernatant as sample. 5 ml of supernatant is
equivalent to 10 mg of litter.
Procedure:

www.hbmahesh.weebly.com 34
9. Pipette out 0.0, 1, 2, 3, 4 and 5 ml of working uric acid standard in to the series of labeled test
tubes.
10. Pipette out 5 ml of the given sample/ protein free filtrate in another test tube.
11. Make up the volume to 5 ml in all the test tubes. A tube with 5 ml of distilled water serves as
the blank.
12. Now add 1 ml of sodium carbonate solution and 1 ml of dilute phosphotungstic acid solution
to all the test tubes including the test tubes labeled 'blank' and 'unknown'.
13. Mix the contents of the tubes by vortexing / shaking the tubes and incubate for 3 min at 25°C
in a water bath.
14. Then record the absorbance at 700 nm against blank.
15. Then plot the standard curve by taking concentration of uric acid along X-axis and
absorbance at 700 nm along Y-axis.
16. Then from this standard curve calculate the concentration of uric acid in the given sample.
Observations and Calculations:
Volume of standard uric acid
(ml)
Volume of distilled
water (ml)
Concentration of uric acid
(µg)
Volume of sodium
carbonate solution (ml)
Volume of phosphotungstic
acid solution (ml)
A700
0 5 0 1 1 0.00
1 4 5 1 1
2 3 10 1 1
3 2 15 1 1
4 1 20 1 1
5 0 25 1 1
5 ml of sample
0 To be estimated
1 1
Amount of uric acid in silkworm litter = Standard Curve Value . Silkworm Litter taken (mg)
= -------µg of uric acid/mg litter
Result: The given unknown sample contains ----µg uric acid/mg litter.

www.hbmahesh.weebly.com
Figure 1: Model Standard Graph
Figure 2: Model Graph Showing Water
Potential of
www.hbmahesh.weebly.com
Figure 1: Model Standard Graph
Figure 2: Model Graph Showing Water
Potential of Tissue
35
Figure 1: Model Standard Graph
Figure 2: Model Graph Showing Water

www.hbmahesh.weebly.com 36
References
1. Rangaswamy, G., Narasimhanna, M.N., Kasiviswanathan, K., Sastry, C.R. and Jolly, M.S., 1976. Sericulture Manual, Vol. 1, Mulberry Cultivation, FAO, United Nations, Rome.
2. Krishnaswamy, S., Narasimhanna, M.N., Suryanarayan, S.K., and Kumararaj, S., 1976. Sericulture Manuals, Vol. 2, Silkworm Rearing, FAO, United Nations, Rome.
3. David T Plummer., 2001. An Introduction to Practical Biochemistry, Tata McGraw-Hill
Publishing Company Limited, New Delhi, India.
4. Raghuramulu, N., Madhavan nair, K and Kalyanasundaram, S., 1983. A manual of Laboratory techniques, National Institute of Nutrition, Hyderabad, India.
5. Takashi, K., Fugaku, A and Masao, N. 2008. Effects of high temperature on the hemocyte cell cycle in silkworm larvae, J. Insect Physiology, (54): 454–461.
6. Michel Dubois, K. A. Gilles, J. K. Hamilton, P. A. Rebers, and Fred Smith, 1956. Colorimetric Method for Determination of Sugars and Related Substances, Analytical Chemistry, 28(3): 350-356,
------------

www.hbmahesh.weebly.com 37

www.hbmahesh.weebly.com 38