2nd world irrigation and drainage prize, 2016 - presentation by prof. bart schultz
TRANSCRIPT

08‐12‐2016
1
PRESENTATION 2ND WORLD IRRIGATION AND DRAINAGE PRIZE
WINNER
Prof. em. Bart Schultz
Prof. em. Land and Water Development, UNESCO-IHE Former Top Advisor Rijkswaterstaat
President honoraire International Commission on Irrigation and Drainage (ICID)
water management for food security impacts of man induced changes in land use and
climate change on living and working in coastal and deltaic areas
In light of a rapidly changing and urbanising world
TWO CRUCIAL TOPICS
08‐12‐2016
2
POPULATION ANDPOPULATION GROWTH
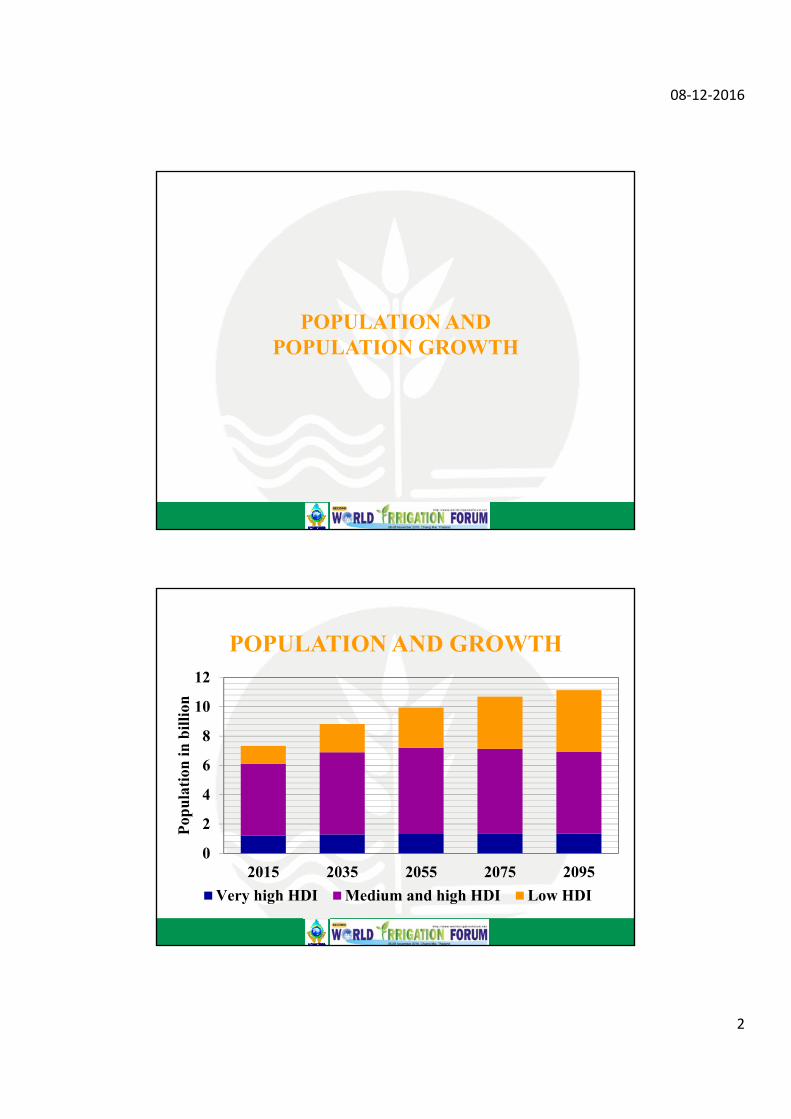
POPULATION AND GROWTH
0
2
4
6
8
10
12
2015 2035 2055 2075 2095
Pop
ula
tion
in b
illi
on
Very high HDI Medium and high HDI Low HDI
08‐12‐2016
3
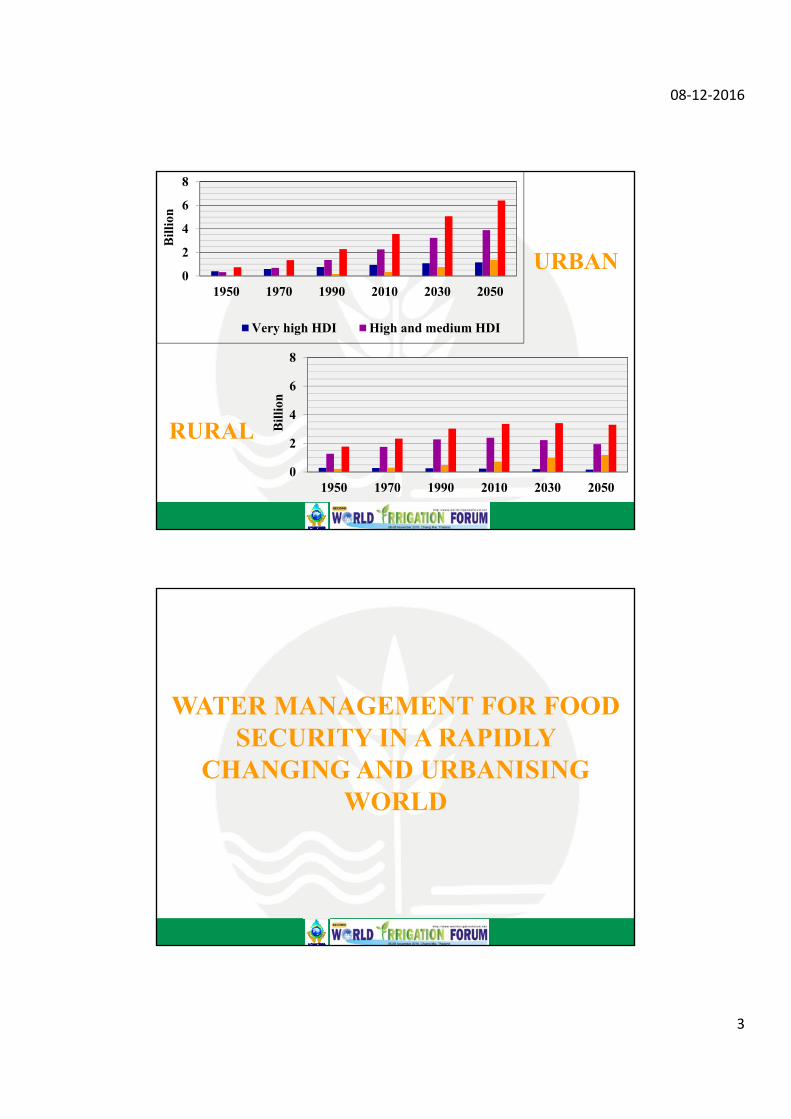
URBAN
RURAL
0
2
4
6
8
1950 1970 1990 2010 2030 2050
Bill
ion
0
2
4
6
8
1950 1970 1990 2010 2030 2050
Bill
ion
Very high HDI High and medium HDI
WATER MANAGEMENT FOR FOOD SECURITY IN A RAPIDLY
CHANGING AND URBANISING WORLD
08‐12‐2016
4
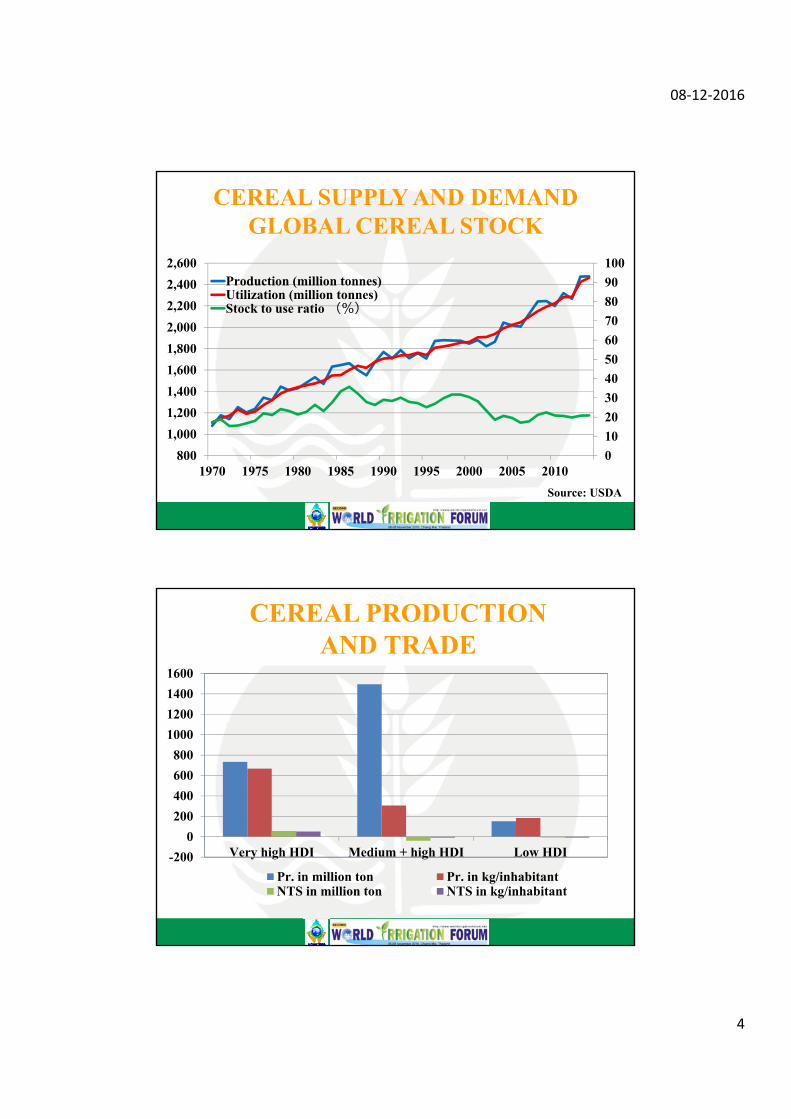
CEREAL SUPPLY AND DEMANDGLOBAL CEREAL STOCK
0
10
20
30
40
50
60
70
80
90
100
800
1,000
1,200
1,400
1,600
1,800
2,000
2,200
2,400
2,600
1970 1975 1980 1985 1990 1995 2000 2005 2010
Production (million tonnes)Utilization (million tonnes)Stock to use ratio (%)
Source: USDA
CEREAL PRODUCTION AND TRADE
-200
0
200
400
600
800
1000
1200
1400
1600
Very high HDI Medium + high HDI Low HDI
Pr. in million ton Pr. in kg/inhabitantNTS in million ton NTS in kg/inhabitant

08‐12‐2016
5
EXPECTATION ON FOOD PRODUCTION duplication in food production in 25 – 30 years 80 - 90% from existing cultivated area higher yield per ha, double or triple cropping installation of irrigation and/or drainage systems in
areas without a system modernization of existing irrigation and drainage
systems installation of drainage in irrigated areas installation of irrigation in rainfed areas with
drainage 10 - 20% from land reclamation
Istanbul 18 March H.Tardieu
INCREASE IN FARM SIZEFood affordable for urban people

08‐12‐2016
6
WORLD MARKET PRICESOVER THE LAST 30 YEARS
0
100
200
300
400
500
600
700
800
1985 1990 1995 2000 2005 2010 2015
Pri
ce in
US
$/to
n
Wheat Maize Rice
WATER MANAGEMENT PRACTICES
no system 1,100 million ha irrigation only 230 million ha drainage only 135 million ha irrigation and drainage 70 million ha
Type of %
country No system Irrigation Drainage
Very High HDIHigh + Medium HDILow HDI
676987
112312
2282
08‐12‐2016
7
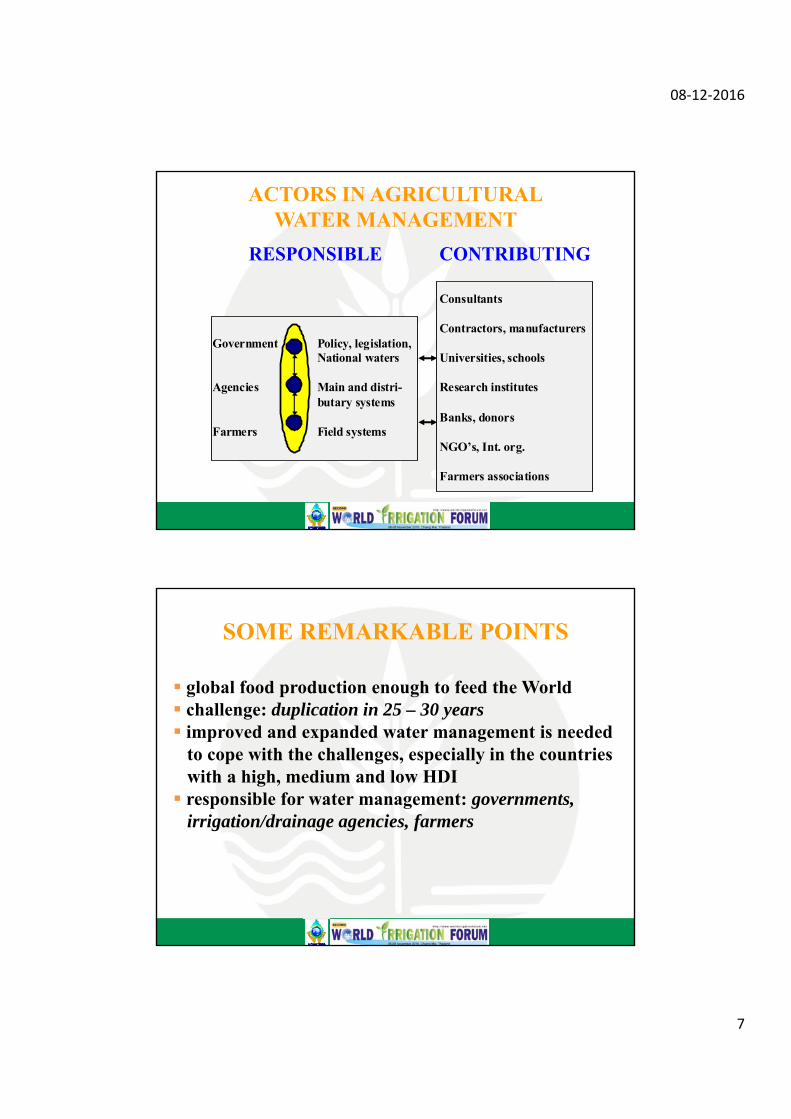
ACTORS IN AGRICULTURALWATER MANAGEMENT
RESPONSIBLE CONTRIBUTING
Consultants Contractors, manufacturers Government Policy, legislation, National waters Universities, schools Agencies Main and distri- Research institutes butary systems Banks, donors Farmers Field systems NGO’s, Int. org. Farmers associations
SOME REMARKABLE POINTS
global food production enough to feed the World challenge: duplication in 25 – 30 years improved and expanded water management is needed
to cope with the challenges, especially in the countrieswith a high, medium and low HDI responsible for water management: governments,
irrigation/drainage agencies, farmers

08‐12‐2016
8
IMPACTS OF MAN INDUCED CHANGES IN LAND USE AND CLIMATE CHANGE ON LIVING AND WORKING IN COASTAL
AND DELTAIC AREAS
worlds’ population is increasingly living and workingin coastal and deltaic areas. No indications that thistendency will change
improvement in agriculture, increase in value of crops, buildings, water management facilities, infrastructure
80 – 90% of urbanisation takes place in flood prone areas. Increase in value of property, buildings and infrastructure. Further increase will take place
CHARACTERISTIC DEVELOPMENTS
08‐12‐2016
9
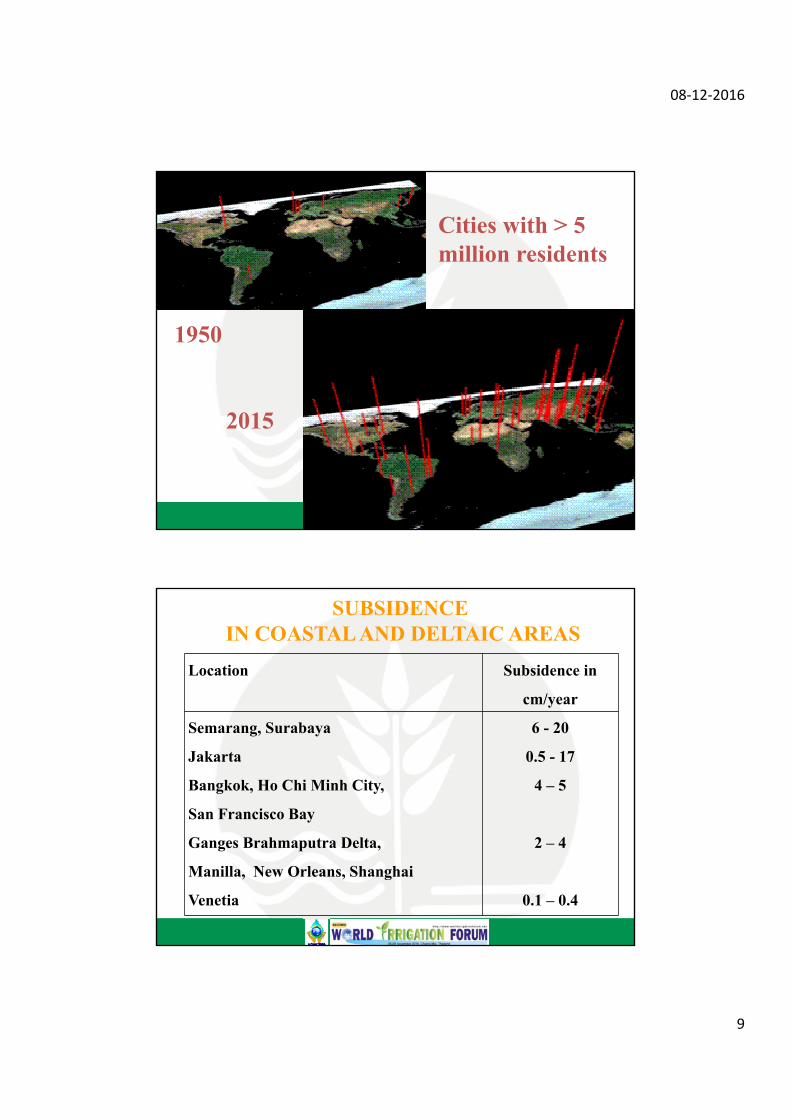
Cities with > 5 million residents
1950
2015
SUBSIDENCEIN COASTAL AND DELTAIC AREAS
Location Subsidence in
cm/year
Semarang, Surabaya
Jakarta
Bangkok, Ho Chi Minh City,
San Francisco Bay
Ganges Brahmaputra Delta,
Manilla, New Orleans, Shanghai
Venetia
6 - 20
0.5 - 17
4 – 5
2 – 4
0.1 – 0.4

08‐12‐2016
10
SUBSIDENCE AND SEA LEVEL RISE
-6
-5
-4
-3
-2
-1
0
1
2
2015 2035 2055 2075 2095 2115
Val
ue
in m
Sea level rise Subsidence 50 mm/year
Subsidence 100 mm/year Subsidence 150 mm/year
Drainage by gravity
needs to be replaced by drainage by pumping
08‐12‐2016
11
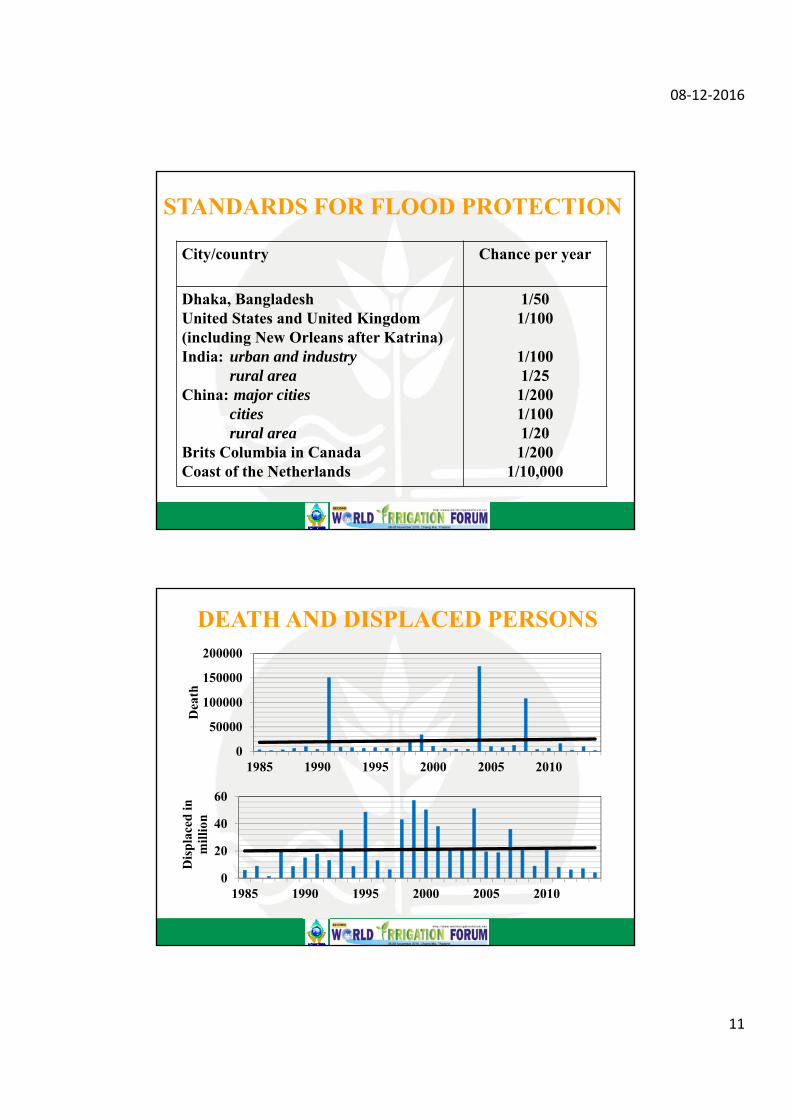
STANDARDS FOR FLOOD PROTECTION
City/country Chance per year
Dhaka, BangladeshUnited States and United Kingdom(including New Orleans after Katrina)India: urban and industry
rural areaChina: major cities
citiesrural area
Brits Columbia in CanadaCoast of the Netherlands
1/501/100
1/1001/251/2001/1001/201/200
1/10,000
DEATH AND DISPLACED PERSONS
0
50000
100000
150000
200000
1985 1990 1995 2000 2005 2010
Dea
th
0
20
40
60
1985 1990 1995 2000 2005 2010
Dis
pla
ced
in
mill
ion
08‐12‐2016
12
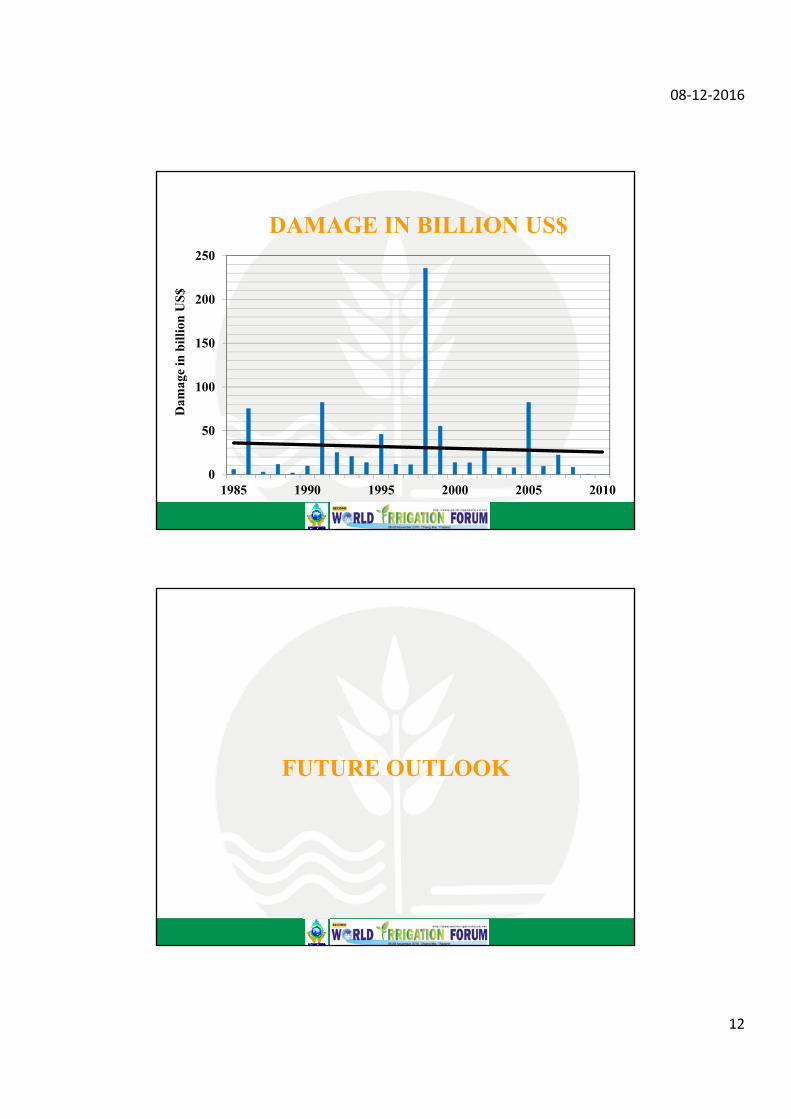
0
50
100
150
200
250
1985 1990 1995 2000 2005 2010
Dam
age
in b
illi
on U
S$
DAMAGE IN BILLION US$
FUTURE OUTLOOK

08‐12‐2016
13
climate change: rise of the mean sea level change in river regimes and increase in peak
discharges of rivers increase in annual rainfall and in peak rainfall
Impact 10 – 45% per century impact of human activities: increase in value of public and private property increase in population increase in value of crops
Impact 100 – 1,000% per century
CLIMATE CHANGE AND IMPACT OF HUMAN ACTIVITIES
08‐12‐2016
14
CONCLUDING REMARKS – IMan induced changes in land use – urbanisation and
land subsidence – are much faster and have much more impact than the impacts of climate change
Measures in the field of water management and flood protection are generally absolutely insufficient
As long as population growth, increase in standards of living, urbanisation and industrialisation in coastal and
deltaic areas goes on, increasingly flood management and flood protection provisions will be required
Flood management and flood protection measures are generally taken after a flooding disaster and not before
Many casualties and substantial damage would have been prevented when the same measures would have been
taken before the disaster, but it looks like our societies are not able to take such decisions in time
CONCLUDING REMARKS - II

08‐12‐2016
15
We are concerned about the calamities that hit us, but many of these calamities are only such disastrous while we started to live on volcanos, at active faults, along subsiding
coasts and the flooding rivers
Salomon Kroonenberg, 2006
Thank you for your attention