2d microtremor array
TRANSCRIPT

Using Two-station Microtremor Array
Method to Estimate Shear-wave Velocity
Profiles in Seattle and Olympia,
Using Two-station Microtremor Array Method to Estimate Shear-wave Velocity Profiles in Seattle and
Olympia, Washington1
Washington
*Koichi Hayashi (Geometrics)
Recep Cakir (Washington State Department of Natural Resources)
Timothy J. Walsh (Washington State Department of Natural Resources)

Outline
Using Two-station Microtremor Array Method to Estimate Shear-wave Velocity Profiles in Seattle and
Olympia, Washington2
• Introduction
• Spatial Auto-correlation
• Data acquisition and processing
• Dispersion curve analysis in terms of Spatial
Autocorrelation
• Conclusions

Introduction (1)
Using Two-station Microtremor Array Method to Estimate Shear-wave Velocity Profiles in Seattle and
Olympia, Washington3
• Surface ground motion of earthquakes highly depends on
subsurface geological structure.
• For estimating the local site effect, S-wave velocity (Vs) down to a
depth of several 10m (e.g. AVS30) is most popular in all over the
world.
• Recent several sever earthquakes have revealed that much deeper
and two or three dimensional structures also play important role.
• Reflection and refraction methods have been applied to delineate
deeper Vs structure.
• These conventional methods are expensive and time consuming so
that the development of cheaper and simpler methods has been
desired.
• Active and passive surface wave methods have been increasingly
getting popular in last 10 years.

Introduction (2)
Using Two-station Microtremor Array Method to Estimate Shear-wave Velocity Profiles in Seattle and
Olympia, Washington4
• The passive method or microtremor array measurements
(MAM) is particularly attractive because the method does not
require any artificial source and the depth of investigation can
be increased easily.
• Large scale microtremor measurements have been widely used
in last 10 years in Japan for estimating S-wave velocity
structure down to a depth of several kilometers.
• In these investigations, triangle arrays with size of several
kilometers are used for calculating a phase velocity in
frequency range from 0.2 to 1Hz.
• The investigation using the large scale microtremor
measurements revealed that abrupt change of deep bedrock
depth caused disaster concentration in the 1995 Earthquake in
Kobe, Japan.

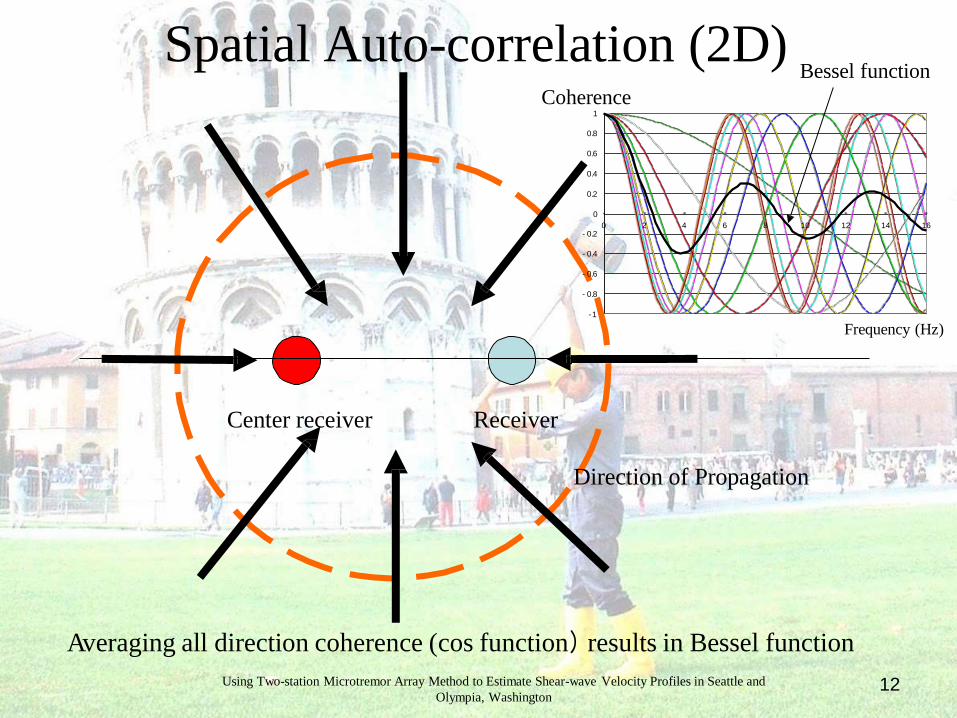
Spatial Auto-correlation (2D)
ReceiverCentral receiver
Micro-tremors does not propagate with particular direction
Receiver
Receiver
Receiver Receiver
Receiver
Using Two-station Microtremor Array Method to Estimate Shear-wave Velocity Profiles in Seattle and
Olympia, Washington5

Spatial auto correlation (2D)
Receiver
Infinite apparent velocity (wave-number is 0)Using Two-station Microtremor Array Method to Estimate Shear-wave Velocity Profiles in Seattle and
Olympia, Washington6
Center receiver
Direction of Propagation
Coherence
12 14 16
Frequency (Hz)
1
0.8
0.6
0.4
0.2
0
- 0.2
- 0.4
- 0.6
- 0.8
- 1
0 2 4 6 8 10

Spatial Auto-correlation (2D)
Center receiver
Direction of Propagation
Receiver
High apparent velocity (small wave-number)
Coherence
12 14 16
Frequency (Hz)
Using Two-station Microtremor Array Method to Estimate Shear-wave Velocity Profiles in Seattle and
Olympia, Washington7
1
0.8
0.6
0.4
0.2
0
- 0.2
- 0.4
- 0.6
- 0.8
- 1
0 2 4 6 8 10

Spatial Auto-correlation (2D)
ReceiverCenter receiver
Coherence
Direction of Propagation
Frequency (Hz)
1
0.8
0.6
0.4
0.2
0
- 0.2
- 0.4
- 0.6
- 0.8
- 1
Low apparent velocity (large wave-number)
Using Two-station Microtremor Array Method to Estimate Shear-wave Velocity Profiles in Seattle and
Olympia, Washington8
0 2 4 6 8 10 12 14 16

ReceiverCenter receiver
Receiver
Receiver
Receiver Receiver
Receiver
-1
- 0.8
- 0.6
- 0.4
- 0.2
0
0.2
0.4
0.6
0 2 4 6 8 10 12 14 16
Spatial Auto-correlation (2D) Bessel function
Averaging all direction coherence (cos function)results in Bessel functionUsing Two-station Microtremor Array Method to Estimate Shear-wave Velocity Profiles in Seattle and
Olympia, Washington9
0.8
1
Coherence
Direction of Propagation
Frequency (Hz)

SPAC with Small Number of Sensors
Using Two-station Microtremor Array Method to Estimate Shear-wave Velocity Profiles in Seattle and
Olympia, Washington10
• Most people use a spatial autocorrelation (SPAC) method for
calculating phase velocities from ambient noise and the method
requires at least 4 or 7 sensors placed on center and corners of
triangles.
• Margaryan et al. (2009) showed that the SPAC using only two
sensors yields almost identical phase velocities as one of 4 or 7
sensors on triangles.
• The SPAC using small number of sensors enables us to perform the
MAM much easily.
• Hayashi and Underwood (2012a) have shown that S-wave velocity
profiles to a depth of 2 to 3 km can be determined by the SPAC
using two sensors in the San Francisco Bay area
• We have performed the SPAC using two sensors at several sites in
Seattle and Olympia, Washington.

ReceiverCenter receiver
Averaging all direction coherence (cos function)results in Bessel function
Receiver
Receiver
Receiver Receiver
Receiver
- 0.6
- 0.8
-1
Frequency (Hz)
- 0.4
- 0.2
0
0 2 4 6 8 10 12 14 16
Spatial Auto-correlation (2D) Bessel function
Using Two-station Microtremor Array Method to Estimate Shear-wave Velocity Profiles in Seattle and
Olympia, Washington11
0.8
0.6
0.4
0.2
1
Coherence
Direction of Propagation
Spatial Auto-correlation (2D)
ReceiverCenter receiver
Averaging all direction coherence (cos function)results in Bessel function
- 0.4
- 0.6
- 0.8
-1
Frequency (Hz)
- 0.2
0.8
0.6
0.4
0.2
0
1
0 2 4 6 8 10 12 14 16
Coherence
Bessel function
Direction of Propagation
Using Two-station Microtremor Array Method to Estimate Shear-wave Velocity Profiles in Seattle and
Olympia, Washington12

Data Acquisition and Processing
Using Two-station Microtremor Array Method to Estimate Shear-wave Velocity Profiles in Seattle and
Olympia, Washington13
• Microtremor array measurements have been performed at
three sites in Seattle and two sites in Olympia.
• Separation of two seismographs varies from 10 to 3102m.
• In each measurement, 10 to 60 minutes ambient noise was
recorded.
• Sampling time is 10msec.
• Two seismographs including three-component
accelerometer (McSEIS-MT Neo) made by OYO
Corporation were used for data acquisition.
• The seismographs include GPS clock and two
seismographs can be synchronized in any distance.

S'te of Investigation
14Using Two-station :tv:ricrotremor .ArrayMethod toEstimate Shear-wave Velocity Profiles in Seattle and
Olympia, Washington

Examp e ofarray configuration
15Using Two-station :tv:ricrotremor .ArrayMethod toEstimate Shear-wave Velocity Profiles in Seattle and
Olympia, Washington
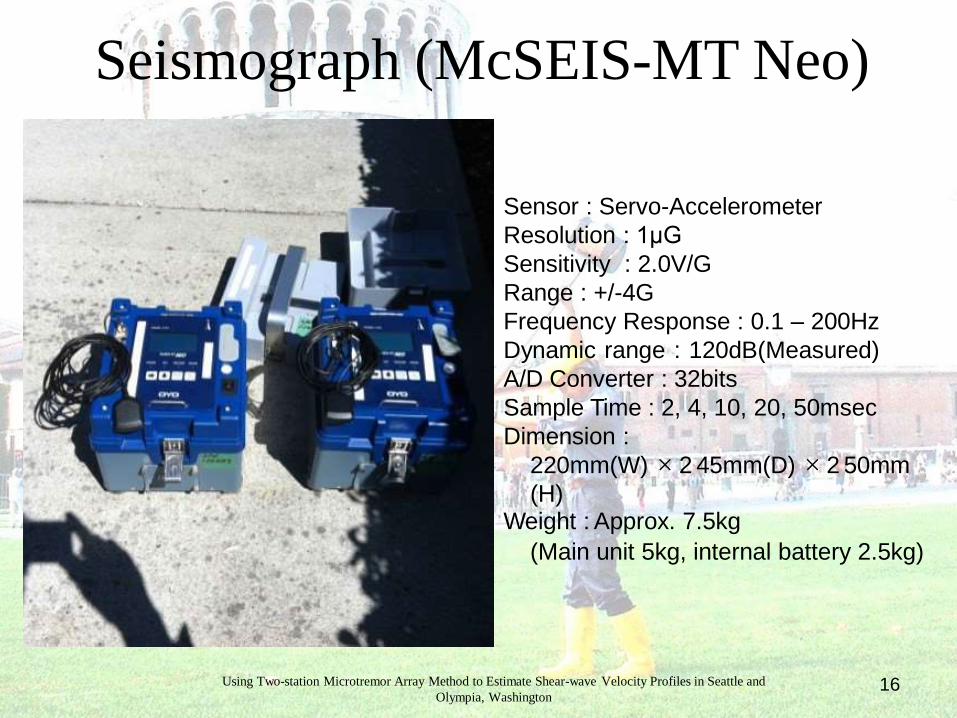
Seismograph (McSEIS-MT Neo)
Sensor : Servo-Accelerometer
Resolution : 1μG
Sensitivity : 2.0V/G
Range : +/-4G
Frequency Response : 0.1 – 200Hz
Dynamic range : 120dB(Measured)
A/D Converter : 32bits
Sample Time : 2, 4, 10, 20, 50msec
Dimension :
220mm(W) × 2 45mm(D) × 2 50mm
(H)Weight : Approx. 7.5kg
(Main unit 5kg, internal battery 2.5kg)
Using Two-station Microtremor Array Method to Estimate Shear-wave Velocity Profiles in Seattle and
Olympia, Washington16

Example of Data
Small array in
Downtown Olympia
Centennial Park (051)
Large array in
Downtown Seattle
Denny park (048)
Using Two-station Microtremor Array Method to Estimate Shear-wave Velocity Profiles in Seattle and
Olympia, Washington17

Example of Spatial
Auto-correlationCoherences as a function of frequency
Denny park (048) Centennial Park (051)
-0.4
-0.2
0
0.2
0.4
0.6
0.8
1
0 1 2 3 4 5
Frequency (Hz)
6 7 8 9 10
Co
he
ren
ce
8m
16m
27m
54m
75m
128m
200m
-0.4
-0.2
0
0.2
0.4
0.6
0.8
1
0 0.1 0.2 0.3 0.4 0.5 0.6 0.7 0.8 0.9 1
Co
her
en
ce
Frequency (Hz)
100m
150m
200m
250m
300m
400m
500m
702m
1116m
1968m
2547m
3102m
Using Two-station Microtremor Array Method to Estimate Shear-wave Velocity Profiles in Seattle and
Olympia, Washington18

Example of Spatial
Auto-correlation
Coherences as a function of distance
Denny park (048) Centennial Park (051)
-0.4
-0.2
0
0.2
0.4
0.6
0.8
1
0 500 1000 1500 2000
Distance (m)
2500 3000 3500
Co
he
ren
ce
0.20757Hz
1362m/sec
0.30525Hz
10755m/sec
0.40293Hz
955m/sec
-0.4
-0.2
0
0.2
0.4
0.6
0.8
1
0 20 40 60 80 100 120 140 160 180 200
Co
he
ren
ce
Distance(m)
1.50183Hz
735m/sec
2.00244Hz
302m/sec
3.50427Hz
245m/sec
Using Two-station Microtremor Array Method to Estimate Shear-wave Velocity Profiles in Seattle and
Olympia, Washington19

Example of SpatialAuto-correlation
Error between observed coherences and theoretical Bessel functions
Denny park (048) Centennial Park (051)
0.0
0.1
0.2
0.3
0.4
0.5
0.6
0.7
0.8
0.9
1.0
Fre
quency
(Hz)
0 200 400 600 800
Phase velocity (m/s)
1000 1200 1400 1600 1800 2000
Source= 0.0m
Dispersion curve : Coherence_all_appended.coh
0.0
0.5
1.0
1.5
2.0
2.5
3.0
3.5
4.0
4.5
5.0
5.5
6.0
6.5
7.0
7.5
8.0
8.5
9.0
9.5
10.0
Fre
quency
(Hz)
0 200
Phase velocity (m/s)
400 600 800 1000
Source= 0.0m
Dispersion curve : Coherence_all.cohUsing Two-station Microtremor Array Method to Estimate Shear-wave Velocity Profiles in Seattle and
Olympia, Washington20

Comparison of Observed
Dispersion Curves
0
200
400
600
800
1000
1200
1400
1600
0.1 1 10 100
Ph
ase
velo
city
(m/s
ec)
Frequency (Hz)
48 : Seattle (Denny park) 49 : Seattle (Alki)50: Seattle (Hiwatha park)51 : Olympia (Centennial Park)52: Olympia (Regional Athletic Park) Wave length = 200mWave length = 500m Wave length = 1km Wave length = 2km Wave length = 5km Wave length = 10km
Using Two-station Microtremor Array Method to Estimate Shear-wave Velocity Profiles in Seattle and
Olympia, Washington21
200m
500m
1km
2km
5km
10km

Comparison of S-wave Velocity
Models Obtained by Inversion
0
50
100
150
200
250
300
350
400
450
500
0 100 200 300 400 500 600 700 800 900 1000 1100
Dep
th(m
)
S-wave velocity (m/sec)
48 : Seattle (Denny park)
49 : Seattle (Alki)
50 : Seattle (Hiwatha park)
51 : Olympia (Centennial Park)
52 : Olympia (Regional Athletic Park)
Using Two-station Microtremor Array Method to Estimate Shear-wave Velocity Profiles in Seattle and
Olympia, Washington22
Shallow region

0
500
1000
1500
2000
2500
3000
3500
2000 2500
Dep
th(m
)
Deep region0 500
Using Two-station Microtremor Array Method to Estimate Shear-wave Velocity Profiles in Seattle and
Olympia, Washington23
S-wave velocity (m/sec)
1000 1500
48 : Seattle (Denny park)
49 : Seattle (Alki)
50 : Seattle (Hiwatha park)
51 : Olympia (Centennial Park)
52 : Olympia (Regional Athletic Park)
Comparison of S-wave Velocity
Models Obtained by Inversion

Conclusions
Using Two-station Microtremor Array Method to Estimate Shear-wave Velocity Profiles in Seattle and
Olympia, Washington24
• 2ST-MAM were performed at several sites in Seattle and Olympia,
Washington in order to estimate deep Vs structures of the area and
evaluate the applicability of the method to such investigations.
• Our investigation results imply that the 2ST-MAM can detect accurate
phase velocities down to a frequency of 0.2Hz and a maximum
penetration depth as deep as 2 to 3km.
• At the downtown Seattle, the bedrock with an Vs higher than 1500m/s
was determined at a depth of greater than 2500m.
• At the central Olympia, a low velocity layer with Vs less than 400m/s
was determined to a depth of 90m.
• These preliminary results have shown that using the 2ST-MAM
method is applicable to deep and shallow depth-to-bedrock
investigations, and provides fast, cost-effective and accurate Vs
estimates.