27 april 2016 portugal - soluções para particulares ... · 2 disclaimer banco santander, s.a....
TRANSCRIPT

PORTUGAL
January – March 2016
27 April 2016
22
Disclaimer
Banco Santander, S.A. ("Santander") cautions that this presentation contains forward-looking statements within the meaning of the US
Private Securities Litigation Reform Act of 1995. These forward-looking statements are found in various places throughout this
presentation and include, without limitation, statements concerning our future business development and economic
performance. While these forward-looking statements represent our judgment and future expectations concerning the development of
our business, a number of risks, uncertainties and other important factors could cause actual developments and results to differ
materially from our expectations. These factors include, but are not limited to: (1) general market, macro-economic, governmental and
regulatory trends; (2) movements in local and international securities markets, currency exchange rates, and interest rates; (3)
competitive pressures; (4) technological developments; and (5) changes in the financial position or credit worthiness of our customers,
obligors and counterparties. The risk factors and other key factors that we have indicated in our past and future filings and reports,
including those with the Securities and Exchange Commission of the United States of America (the “SEC”), could adversely affect our
business and financial performance. Other unknown or unpredictable factors could cause actual results to differ materially from those
in the forward-looking statements.
The information contained in this presentation is subject to, and must be read in conjunction with, all other publicly available
information, including, where relevant any fuller disclosure document published by Santander. Any person at any time acquiring
securities must do so only on the basis of such person's own judgment as to the merits or the suitability of the securities for its purpose
and only on such information as is contained in such public information having taken all such professional or other advice as it
considers necessary or appropriate in the circumstances and not in reliance on the information contained in the presentation.
In making this presentation available, Santander gives no advice and makes no recommendation to buy, sell or otherwise deal in
shares in Santander or in any other securities or investments whatsoever.
No offering of Securities shall be made in the United States except pursuant to registration under the U.S. Securities Act of 1933, as
amended, or an exemption therefore.
Nothing contained in this presentation is intended to constitute an invitation or inducement to engage in investment activity for the
purposes of the prohibition on financial promotion in the U.K. Financial Services and Markets Act 2000.
Note: Statements as to historical performance, historical share price or financial accretion are not intended to mean that future
performance, historical share price or future earnings (including earnings per share) for any period will necessarily match or exceed
those of any prior year. Nothing in this presentation should be construed as a profit forecast.
Note: The results information contained in this presentation has been prepared according to Spanish accounting criteria and regulation
in a manner applicable to all subsidiaries of the Santander Group and as a result it may differ from the one disclosed locally by Banco
Santander Totta.
Note: March 2016 results and business volumes evolution contained in this presentation reflect the acquisition of Banif in Dec/15.

Agenda
■ Macro-economic environment and financial system
■ Strategy and business
■ Results
■ Appendix
44
13.912.4
11.5 11.0
2014 2015 2016 (e) 2017 (e)
-0.3
0.51.0
1.6
2014 2015 2016 (e) 2017 (e)
0.9
1.5 1.41.6
2014 2015 2016 (e) 2017 (e)
-4.5
-3.0-2.2 -1.9
2014 2015 2016 (e) 2017 (e)
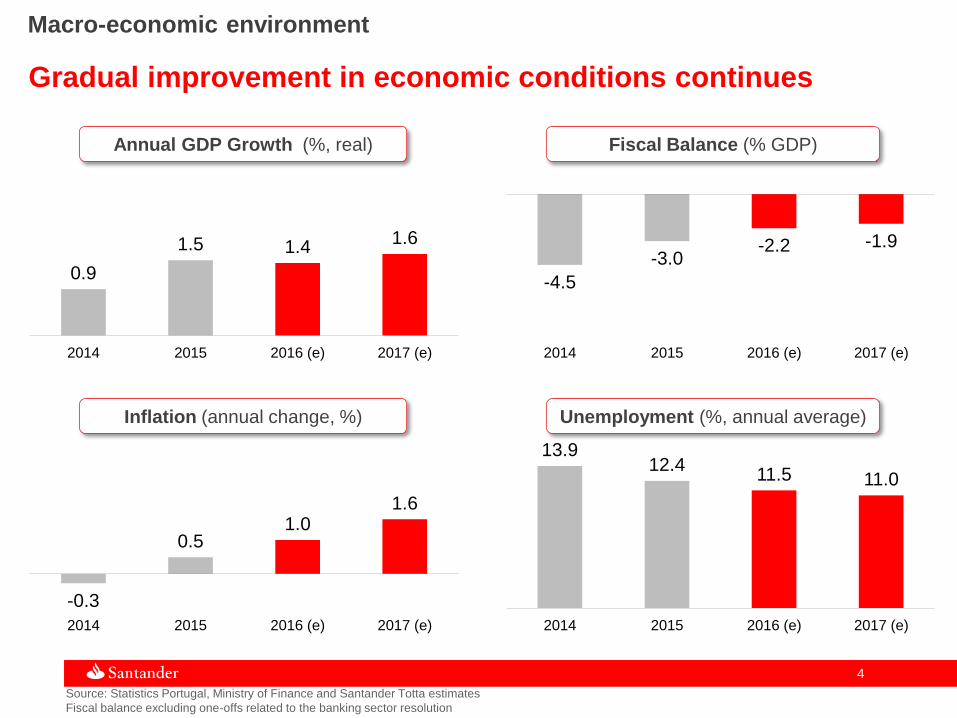
Source: Statistics Portugal, Ministry of Finance and Santander Totta estimates
Fiscal balance excluding one-offs related to the banking sector resolution
Macro-economic environment
Annual GDP Growth (%, real)
Unemployment (%, annual average)Inflation (annual change, %)
Fiscal Balance (% GDP)
Gradual improvement in economic conditions continues
55
-20%
-10%
0%
10%
20%
30%
40%
Feb/12 Feb/13 Feb/14 Feb/15 Feb/16
EU Extra EU Total
-20%
-10%
0%
10%
20%
11 12 13 14 15
-12%
-6%
0%
6%
12%
Feb/12 Feb/13 Feb/14 Feb/15 Feb/16
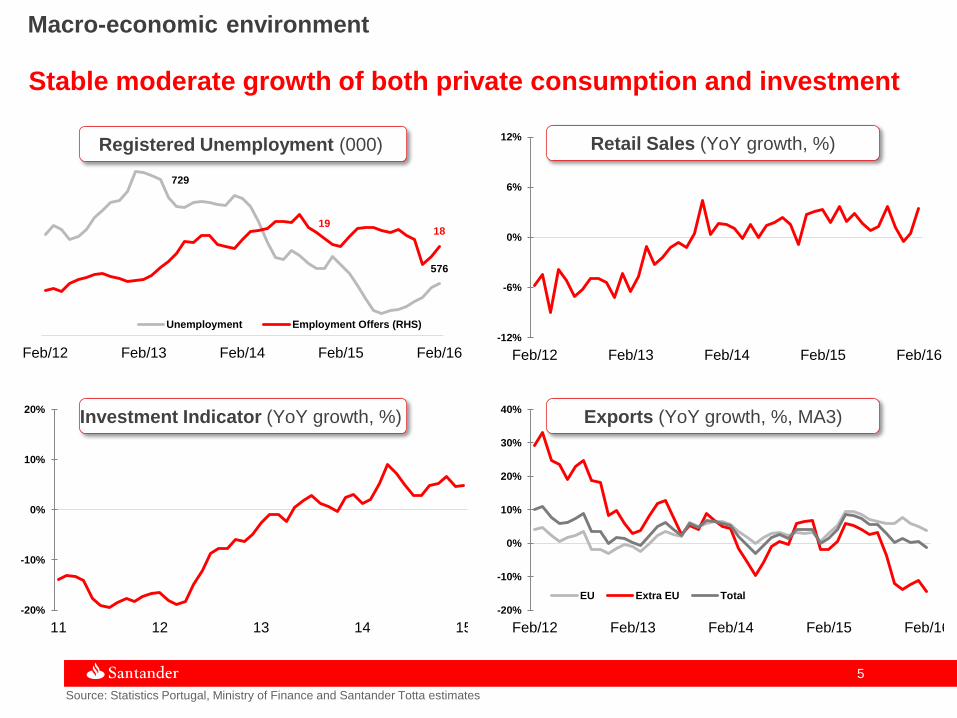
729
576
1918
Feb/12 Feb/13 Feb/14 Feb/15 Feb/16
Unemployment Employment Offers (RHS)
Macro-economic environment
Stable moderate growth of both private consumption and investment
Registered Unemployment (000)
Exports (YoY growth, %, MA3)Investment Indicator (YoY growth, %)
Retail Sales (YoY growth, %)
Source: Statistics Portugal, Ministry of Finance and Santander Totta estimates
66
0%
1%
2%
3%
4%
5%
Mar/15 May/15 Jul/15 Sep/15 Nov/15 Jan/16 Mar/16
3Y 5Y 10Y
-10
-5
0
5
jan feb mar apr may jun jul aug sep oct nov dec
2013
2015
2016
-10%
-5%
0%
5%
10%
15%
20%
Feb/13 Feb/14 Feb/15 Feb/16
Current Revenue Current Expenditure
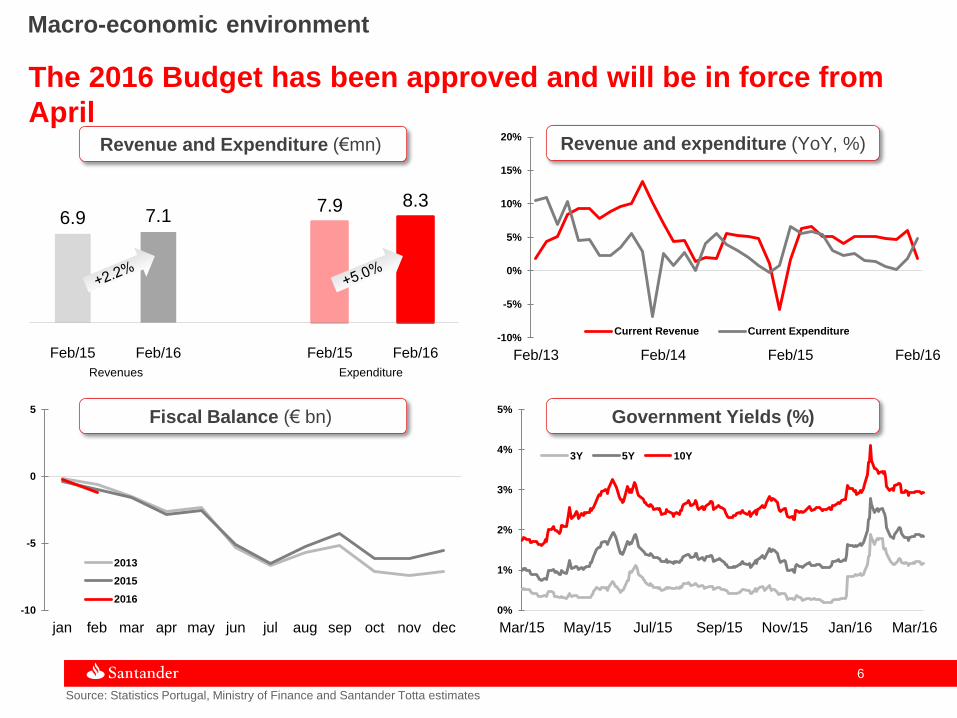
Macro-economic environment
The 2016 Budget has been approved and will be in force from
AprilRevenue and Expenditure (€mn)
Government Yields (%)Fiscal Balance (€ bn)
Revenue and expenditure (YoY, %)
6.9 7.17.9 8.3
Feb/15 Feb/16 Feb/15 Feb/16
Revenues Expenditure
Source: Statistics Portugal, Ministry of Finance and Santander Totta estimates
77
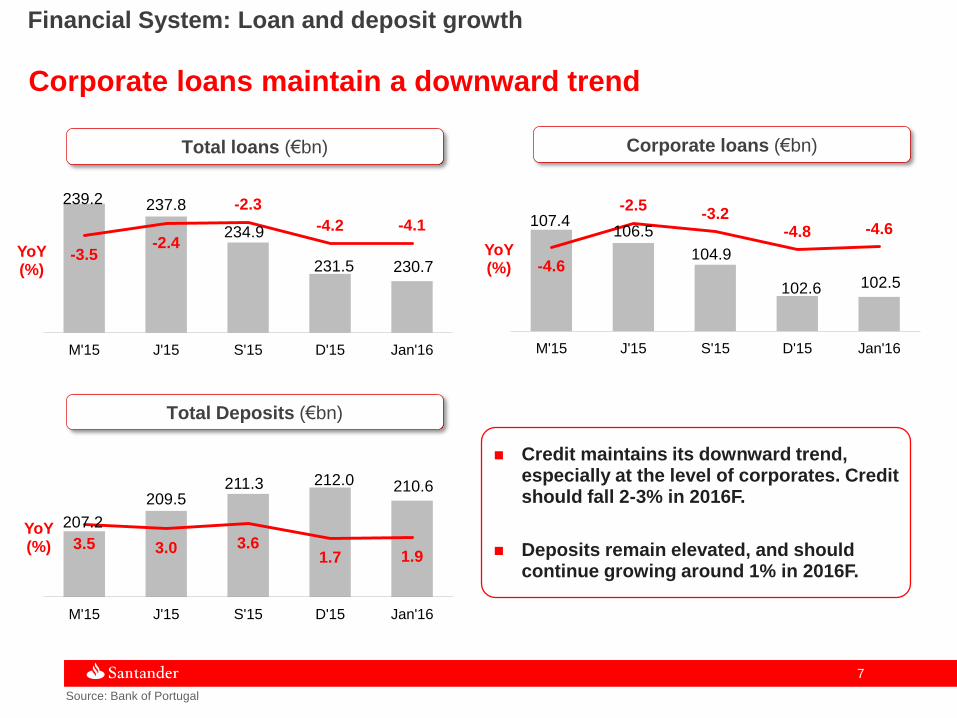
239.2 237.8
234.9
231.5 230.7-3.5
-2.4
-2.3
-4.2 -4.1
M'15 J'15 S'15 D'15 Jan'16
Source: Bank of Portugal
Credit maintains its downward trend, especially at the level of corporates. Credit should fall 2-3% in 2016F.
Deposits remain elevated, and should continue growing around 1% in 2016F.
Total loans (€bn)
Total Deposits (€bn)
YoY(%)
YoY(%)
Corporate loans maintain a downward trend
Corporate loans (€bn)
YoY(%)
107.4106.5
104.9
102.6 102.5-4.6
-2.5-3.2
-4.8 -4.6
M'15 J'15 S'15 D'15 Jan'16
207.2
209.5211.3 212.0 210.6
3.5 3.0 3.61.7 1.9
M'15 J'15 S'15 D'15 Jan'16
Financial System: Loan and deposit growth

Agenda
■ Macro-economic environment and financial system
■ Strategy and business
■ Results
■ Appendix
99
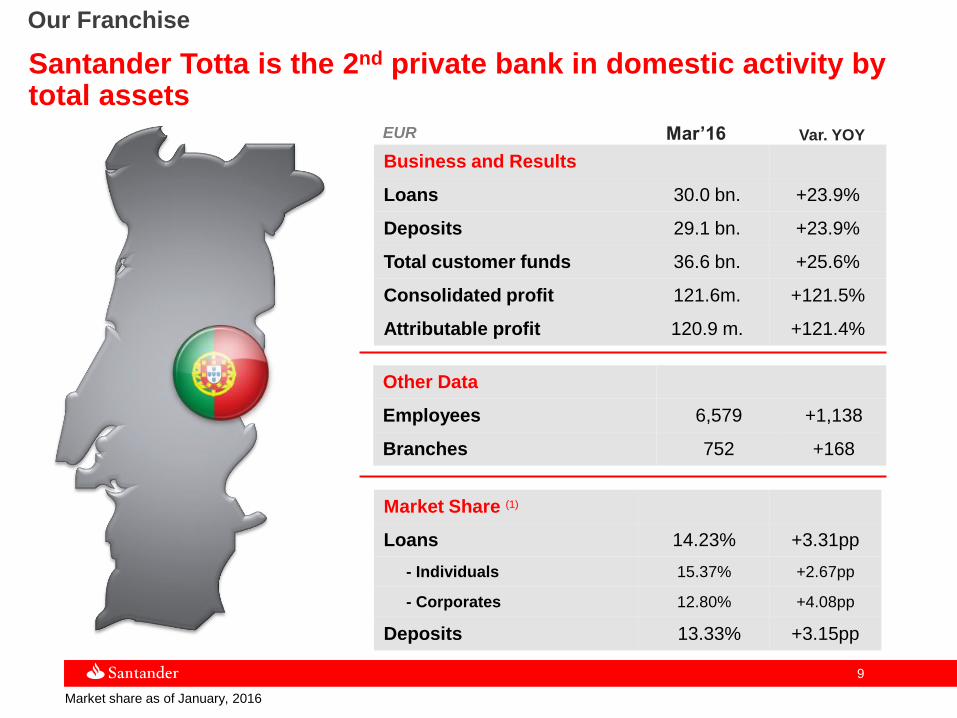
Our Franchise
(1) Market share as of January, 2016
Business and Results
Loans 30.0 bn. +23.9%
Deposits 29.1 bn. +23.9%
Total customer funds 36.6 bn. +25.6%
Consolidated profit 121.6m. +121.5%
Attributable profit 120.9 m. +121.4%
Other Data
Employees 6,579 +1,138
Branches 752 +168
Market Share (1)
Loans 14.23% +3.31pp
- Individuals 15.37% +2.67pp
- Corporates 12.80% +4.08pp
Deposits 13.33% +3.15pp
EUR
Santander Totta is the 2nd private bank in domestic activity by total assets
Mar’16 Var. YOY
1010
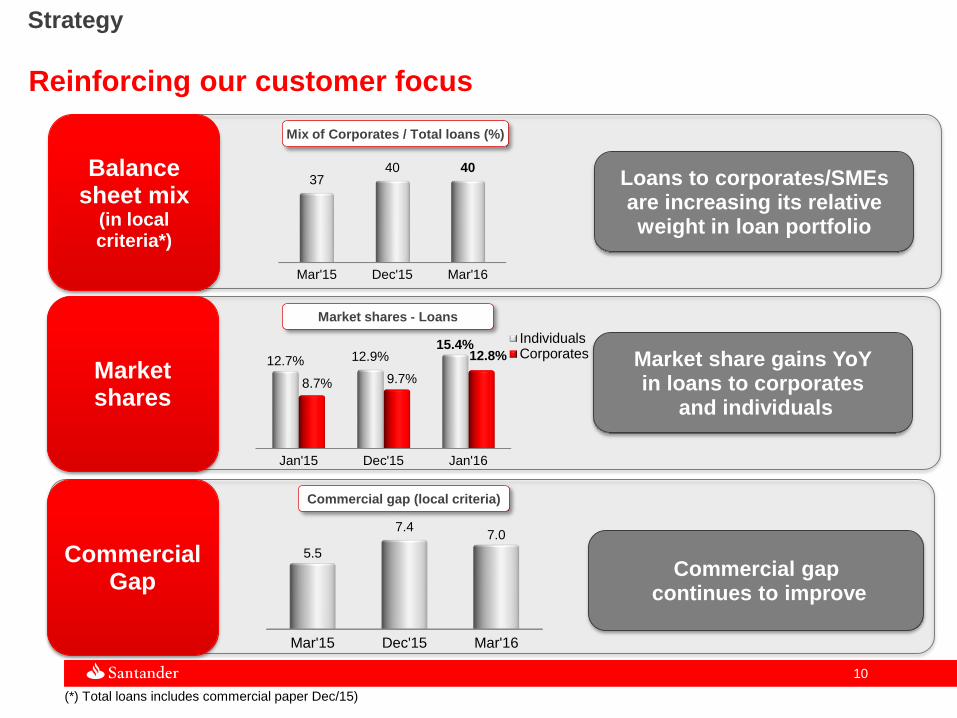
Strategy
Reinforcing our customer focus
Mar'15 Dec'15 Mar'16
3740 40Balance
sheet mix(in local criteria*)
Mix of Corporates / Total loans (%)
Loans to corporates/SMEs are increasing its relative weight in loan portfolio
Jan'15 Dec'15 Jan'16
12.7% 12.9%15.4%
8.7% 9.7%
12.8%
IndividualsCorporates
Market shares
Market shares - Loans
Market share gains YoY in loans to corporates
and individuals
(*) Total loans includes commercial paper Dec/15)
Commercial gap (local criteria)
Commercial gapcontinues to improve
Mar'15 Dec'15 Mar'16
5.5
7.47.0
Commercial Gap
1111
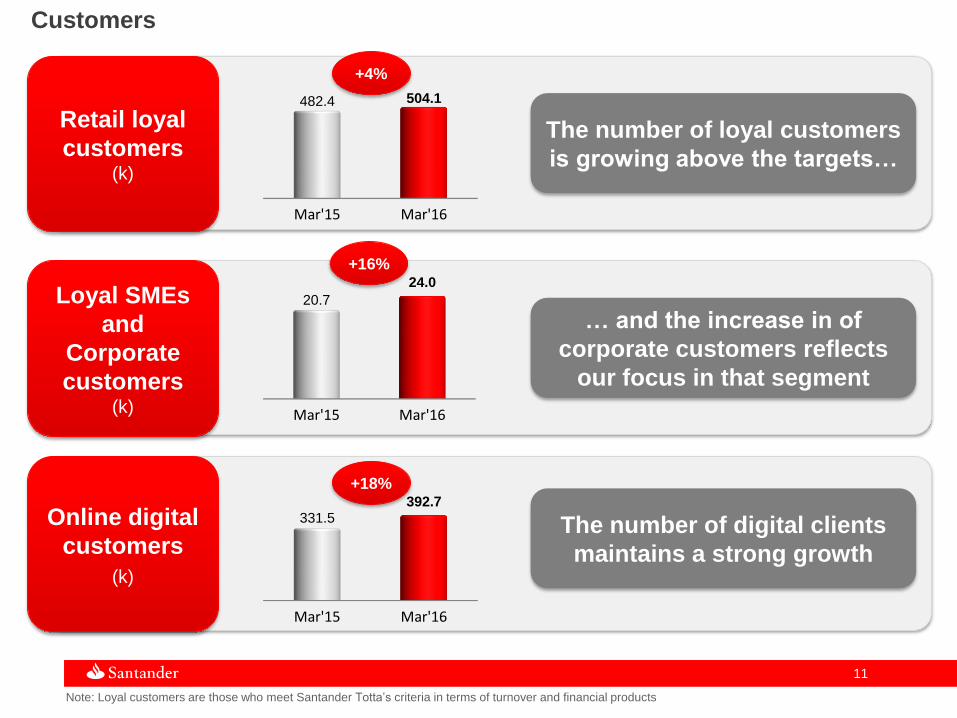
Mar'15 Mar'16
20.7
24.0
Note: Loyal customers are those who meet Santander Totta’s criteria in terms of turnover and financial products
Customers
+4%
Retail loyal
customers(k)
The number of loyal customers
is growing above the targets…
Online digital
customers
(k)
The number of digital clients
maintains a strong growth
Mar'15 Mar'16
482.4 504.1
+18%
Mar'15 Mar'16
331.5392.7
+16%
Loyal SMEs
and
Corporate
customers(k)
… and the increase in of
corporate customers reflects
our focus in that segment
1212
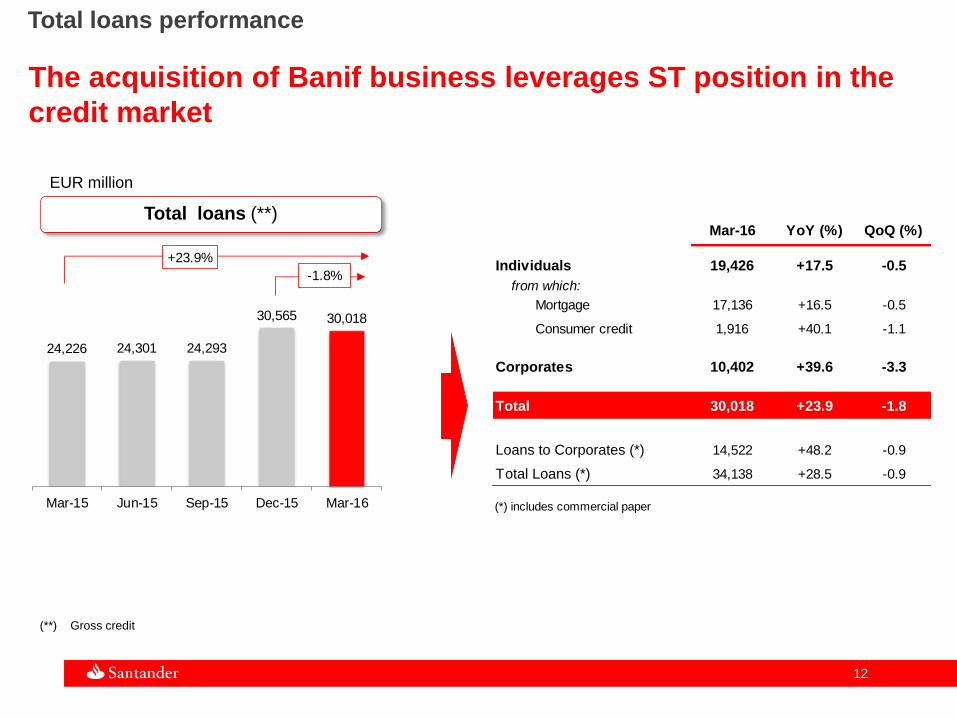
Total loans performance
The acquisition of Banif business leverages ST position in the
credit market
Total loans (**)
EUR million
(**) Gross credit
24,226 24,301 24,293
30,565 30,018
Mar-15 Jun-15 Sep-15 Dec-15 Mar-16
+23.9%
-1.8%
Mar-16 YoY (%) QoQ (%)
Individuals 19,426 +17.5 -0.5
from which:
Mortgage 17,136 +16.5 -0.5
Consumer credit 1,916 +40.1 -1.1
Corporates 10,402 +39.6 -3.3
Total 30,018 +23.9 -1.8
Loans to Corporates (*) 14,522 +48.2 -0.9
Total Loans (*) 34,138 +28.5 -0.9
(*) includes commercial paper
1313
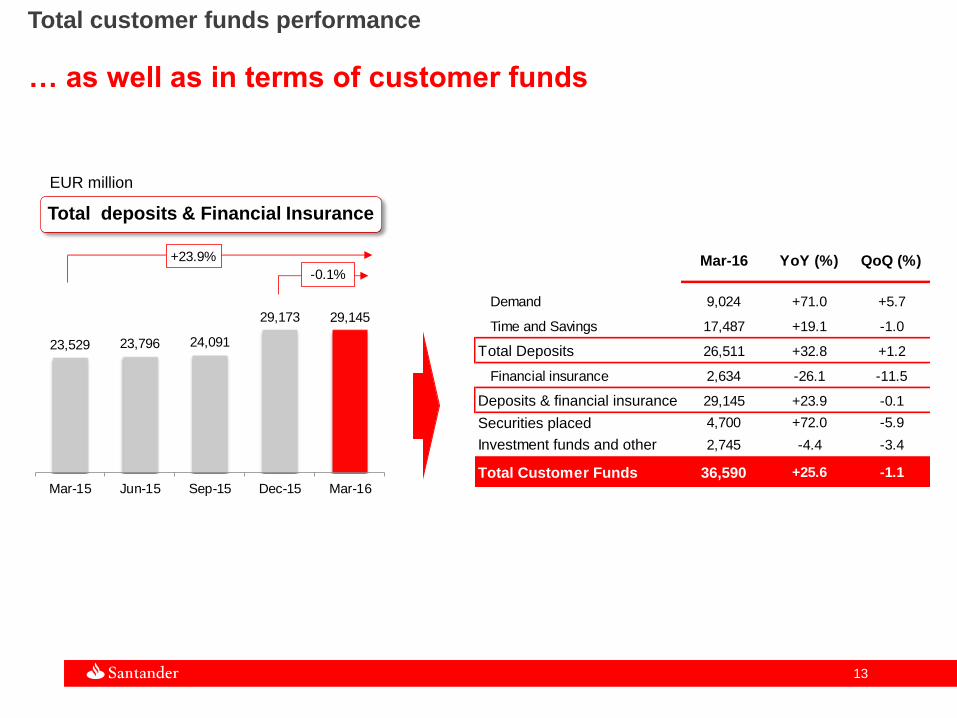
Total customer funds performance
… as well as in terms of customer funds
Total deposits & Financial Insurance
EUR million
23,529 23,796 24,091
29,173 29,145
Mar-15 Jun-15 Sep-15 Dec-15 Mar-16
+23.9%
-0.1%Mar-16 YoY (%) QoQ (%)
Demand 9,024 +71.0 +5.7
Time and Savings 17,487 +19.1 -1.0
Total Deposits 26,511 +32.8 +1.2
Financial insurance 2,634 -26.1 -11.5
Deposits & financial insurance 29,145 +23.9 -0.1
Securities placed 4,700 +72.0 -5.9
Investment funds and other 2,745 -4.4 -3.4
Total Customer Funds 36,590 +25.6 -1.1

Agenda
■ Macro-economic environment and financial system
■ Strategy and business
■ Results
■ Appendix
1515
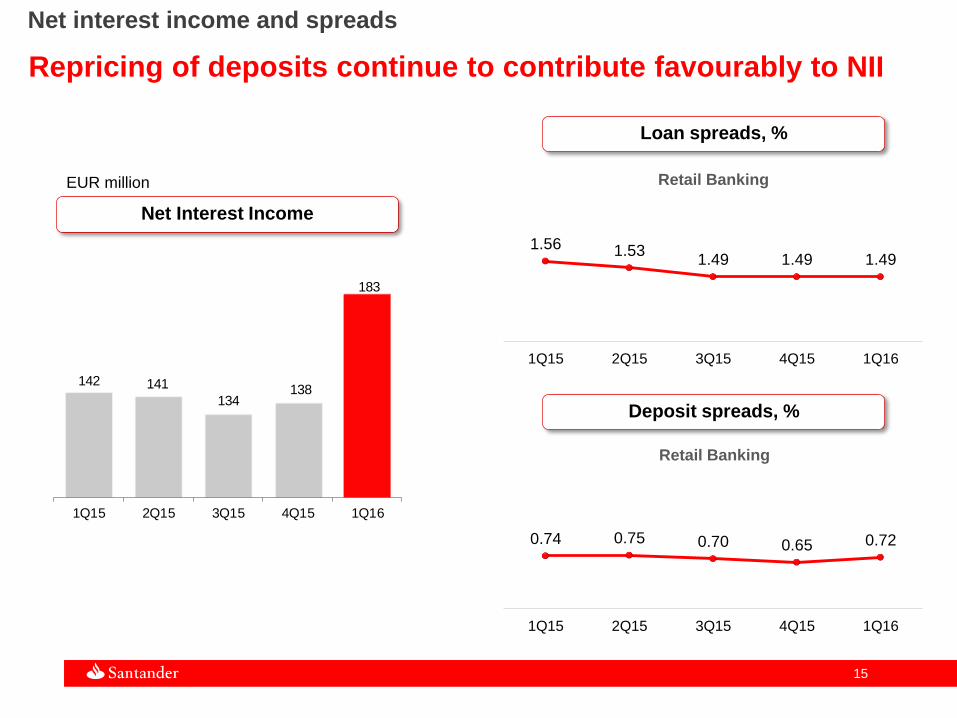
EUR million
Net interest income and spreads
Repricing of deposits continue to contribute favourably to NII
0.74 0.75 0.70 0.65 0.72
1Q15 2Q15 3Q15 4Q15 1Q16
1.56 1.531.49 1.49 1.49
1Q15 2Q15 3Q15 4Q15 1Q16
Retail Banking
Retail Banking
Net Interest Income
Loan spreads, %
Deposit spreads, %
142 141
134138
183
1Q15 2Q15 3Q15 4Q15 1Q16
1616
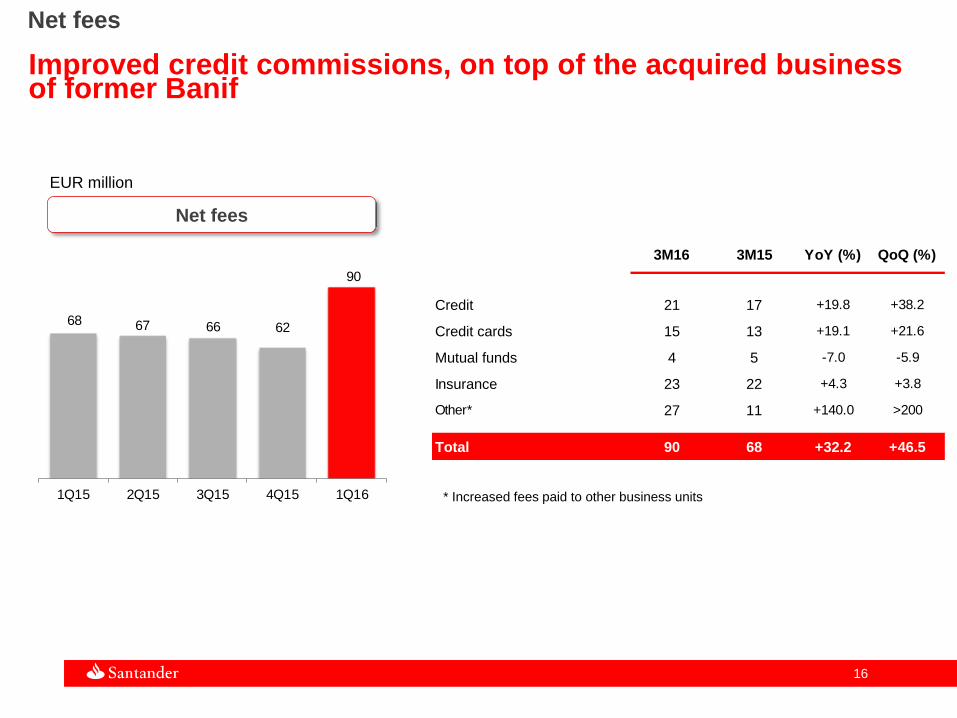
Net fees
Improved credit commissions, on top of the acquired business of former Banif
Net fees
* Increased fees paid to other business units
EUR million
68 67 66 62
90
1Q15 2Q15 3Q15 4Q15 1Q16
3M16 3M15 YoY (%) QoQ (%)
Credit 21 17 +19.8 +38.2
Credit cards 15 13 +19.1 +21.6
Mutual funds 4 5 -7.0 -5.9
Insurance 23 22 +4.3 +3.8
Other* 27 11 +140.0 >200
Total 90 68 +32.2 +46.5
1717
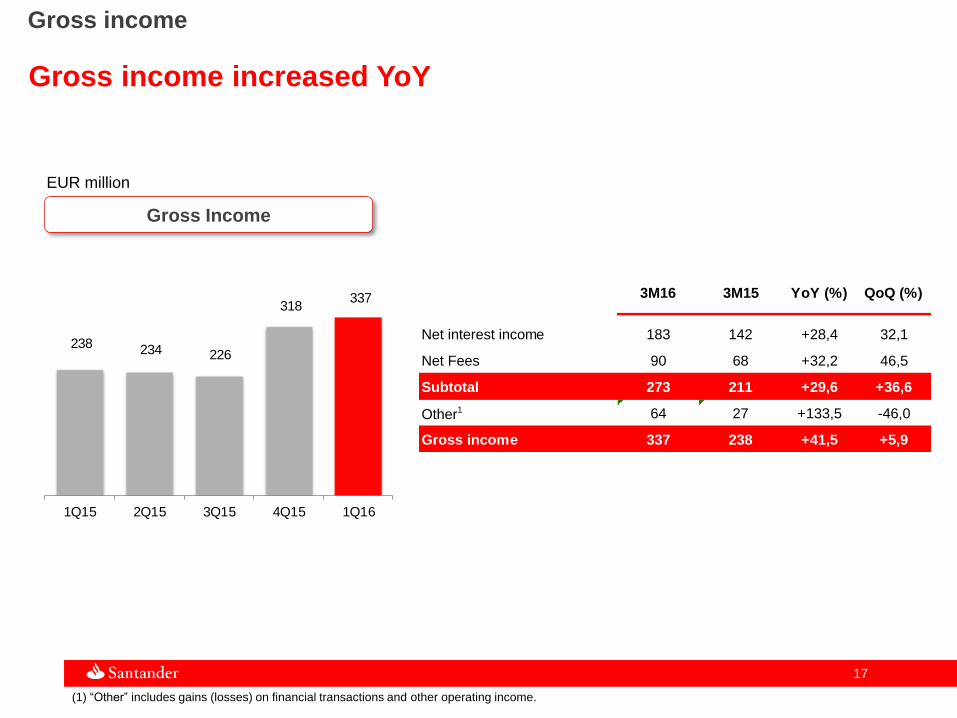
Gross income
Gross income increased YoY
Gross Income
EUR million
(1) “Other” includes gains (losses) on financial transactions and other operating income.
238 234 226
318337
1Q15 2Q15 3Q15 4Q15 1Q16
3M16 3M15 YoY (%) QoQ (%)
Net interest income 183 142 +28,4 32,1
Net Fees 90 68 +32,2 46,5
Subtotal 273 211 +29,6 +36,6
Other1 64 27 +133,5 -46,0
Gross income 337 238 +41,5 +5,9
1818
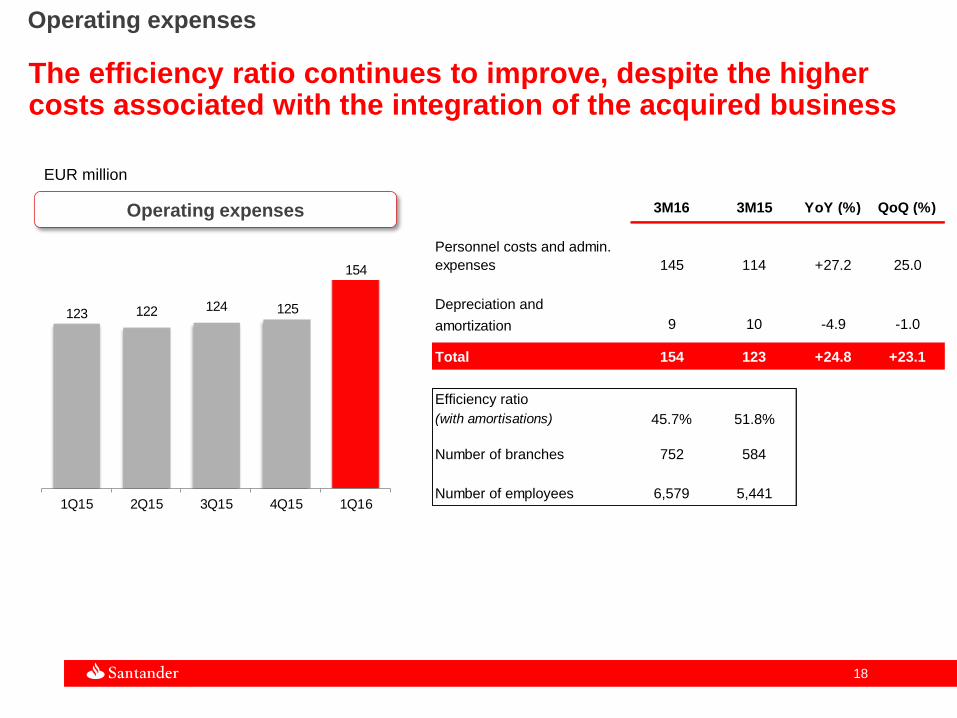
Operating expenses
The efficiency ratio continues to improve, despite the higher costs associated with the integration of the acquired business
Operating expenses
EUR million
123 122 124 125
154
1Q15 2Q15 3Q15 4Q15 1Q16
3M16 3M15 YoY (%) QoQ (%)
Personnel costs and admin.
expenses 145 114 +27.2 25.0
Depreciation and
amortization 9 10 -4.9 -1.0
Total 154 123 +24.8 +23.1
Efficiency ratio
(with amortisations) 45.7% 51.8%
Number of branches 752 584
Number of employees 6,579 5,441
1919
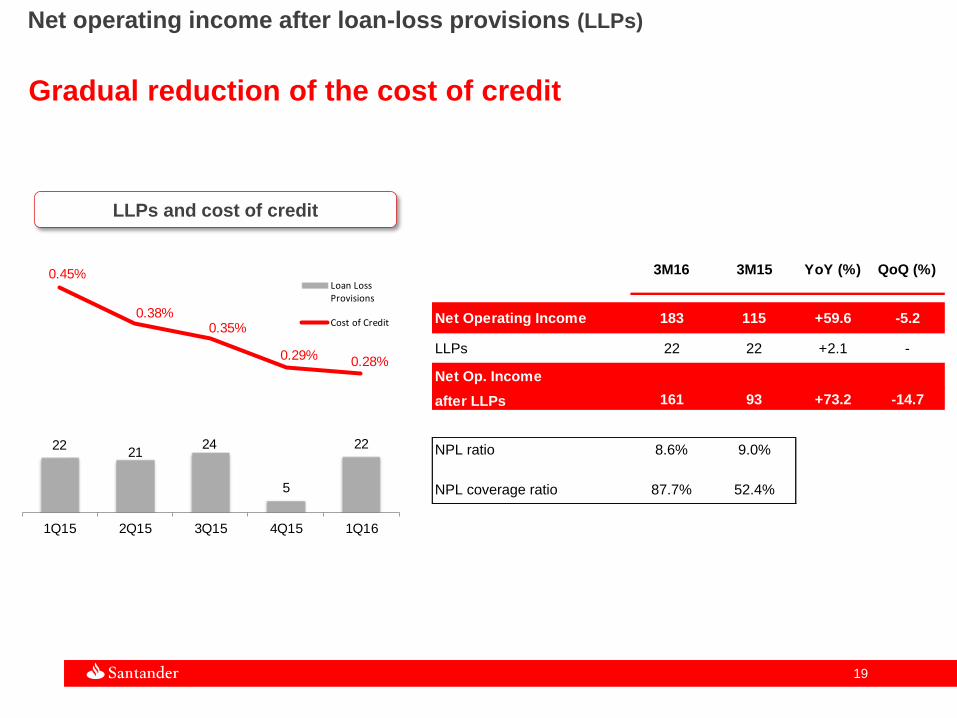
Net operating income after loan-loss provisions (LLPs)
Gradual reduction of the cost of credit
LLPs and cost of credit
2221
24
5
22
0.45%
0.38%0.35%
0.29%0.28%
1Q15 2Q15 3Q15 4Q15 1Q16
Loan LossProvisions
Cost of Credit
3M16 3M15 YoY (%) QoQ (%)
Net Operating Income 183 115 +59.6 -5.2
LLPs 22 22 +2.1 -
Net Op. Income
after LLPs 161 93 +73.2 -14.7
NPL ratio 8.6% 9.0%
NPL coverage ratio 87.7% 52.4%
2020
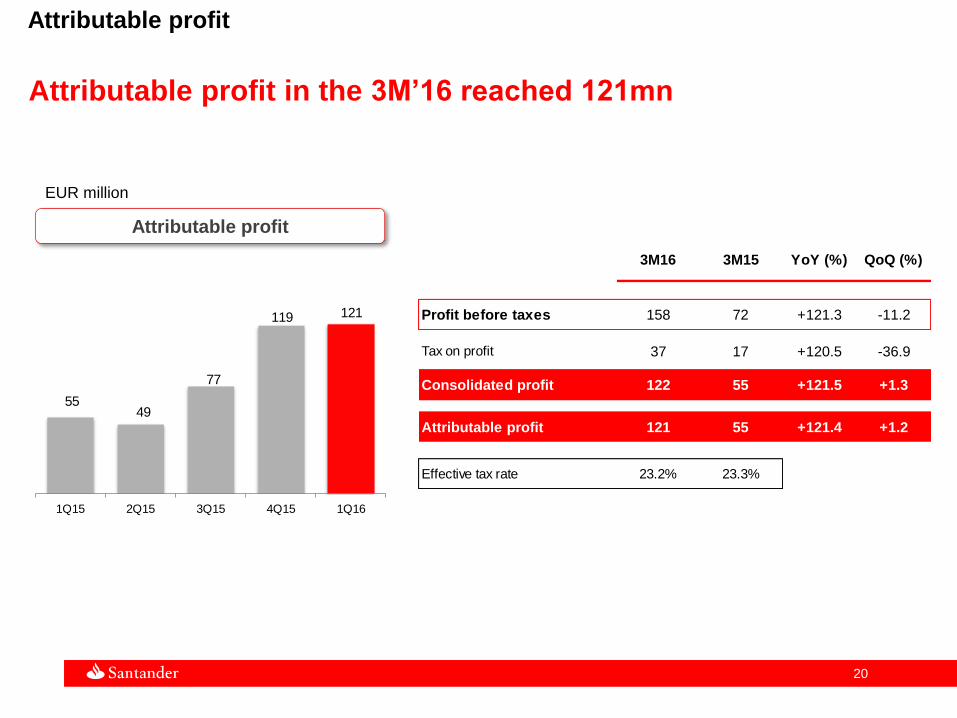
Attributable profit
Attributable profit in the 3M’16 reached 121mn
Attributable profit
EUR million
5549
77
119 121
1Q15 2Q15 3Q15 4Q15 1Q16
3M16 3M15 YoY (%) QoQ (%)
Profit before taxes 158 72 +121.3 -11.2
Tax on profit 37 17 +120.5 -36.9
Consolidated profit 122 55 +121.5 +1.3
Attributable profit 121 55 +121.4 +1.2
Effective tax rate 23.2% 23.3%
2121
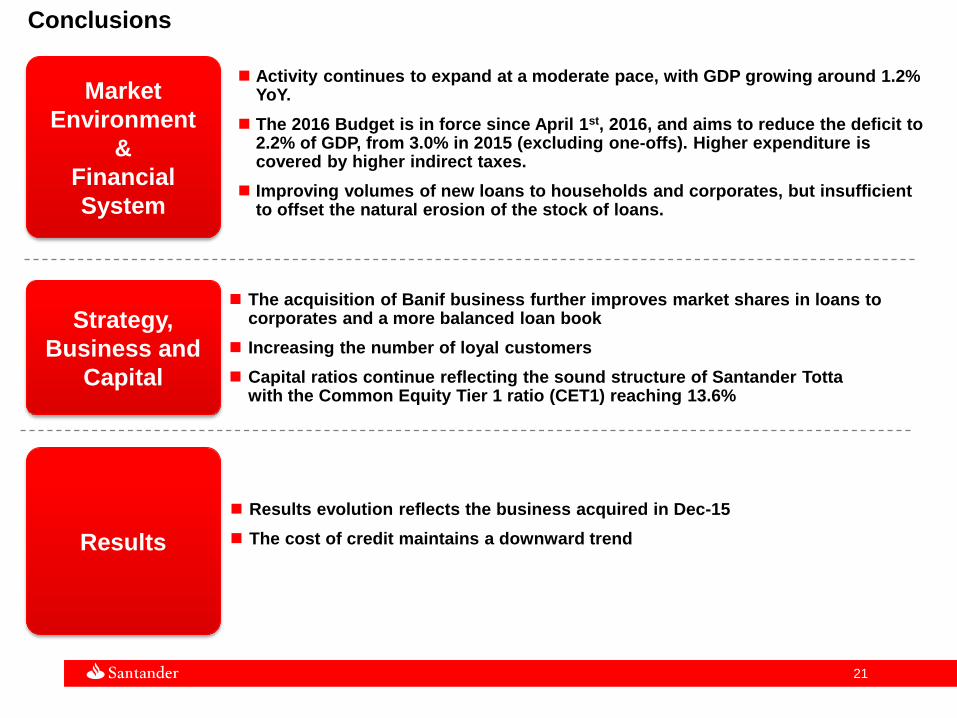
Conclusions
Market
Environment
&
Financial
System
Strategy,
Business and
Capital
Results
The acquisition of Banif business further improves market shares in loans to corporates and a more balanced loan book
Increasing the number of loyal customers
Capital ratios continue reflecting the sound structure of Santander Tottawith the Common Equity Tier 1 ratio (CET1) reaching 13.6%
Results evolution reflects the business acquired in Dec-15
The cost of credit maintains a downward trend
Activity continues to expand at a moderate pace, with GDP growing around 1.2% YoY.
The 2016 Budget is in force since April 1st, 2016, and aims to reduce the deficit to 2.2% of GDP, from 3.0% in 2015 (excluding one-offs). Higher expenditure is covered by higher indirect taxes.
Improving volumes of new loans to households and corporates, but insufficient to offset the natural erosion of the stock of loans.
Agenda
■ Macro-economic environment and financial system
■ Strategy and business
■ Results
■ Appendix
2323
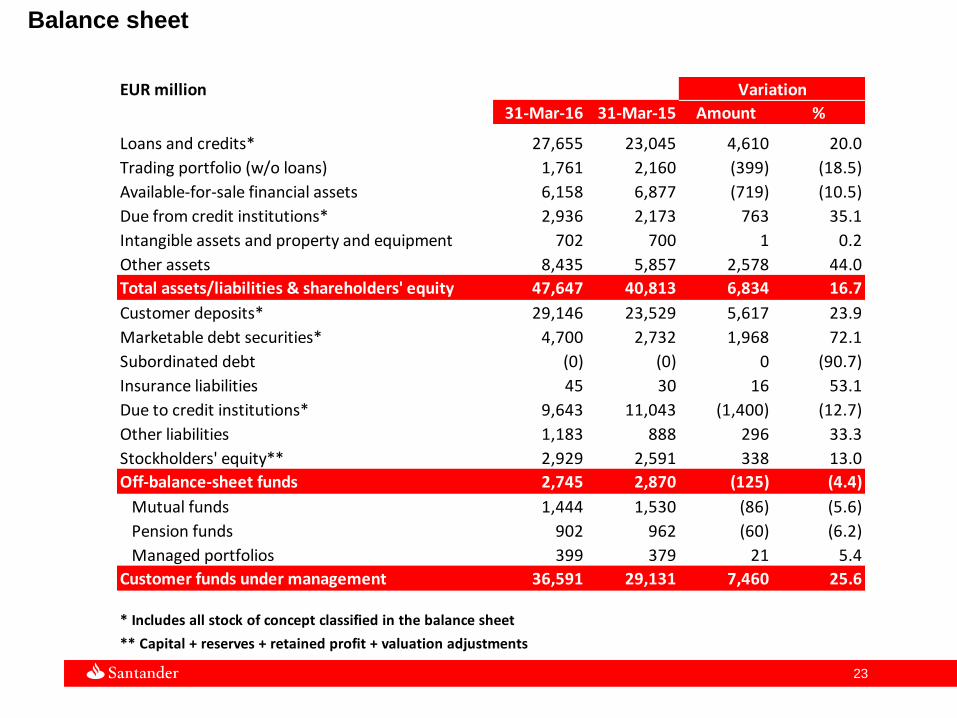
Balance sheet
EUR million Variation
31-Mar-16 31-Mar-15 Amount %
Loans and credits* 27,655 23,045 4,610 20.0
Trading portfolio (w/o loans) 1,761 2,160 (399) (18.5)
Available-for-sale financial assets 6,158 6,877 (719) (10.5)
Due from credit institutions* 2,936 2,173 763 35.1
Intangible assets and property and equipment 702 700 1 0.2
Other assets 8,435 5,857 2,578 44.0
Total assets/liabilities & shareholders' equity 47,647 40,813 6,834 16.7
Customer deposits* 29,146 23,529 5,617 23.9
Marketable debt securities* 4,700 2,732 1,968 72.1
Subordinated debt (0) (0) 0 (90.7)
Insurance liabilities 45 30 16 53.1
Due to credit institutions* 9,643 11,043 (1,400) (12.7)
Other liabilities 1,183 888 296 33.3
Stockholders' equity** 2,929 2,591 338 13.0
Off-balance-sheet funds 2,745 2,870 (125) (4.4)
Mutual funds 1,444 1,530 (86) (5.6)
Pension funds 902 962 (60) (6.2)
Managed portfolios 399 379 21 5.4
Customer funds under management 36,591 29,131 7,460 25.6
* Includes all stock of concept classified in the balance sheet
** Capital + reserves + retained profit + valuation adjustments
2424
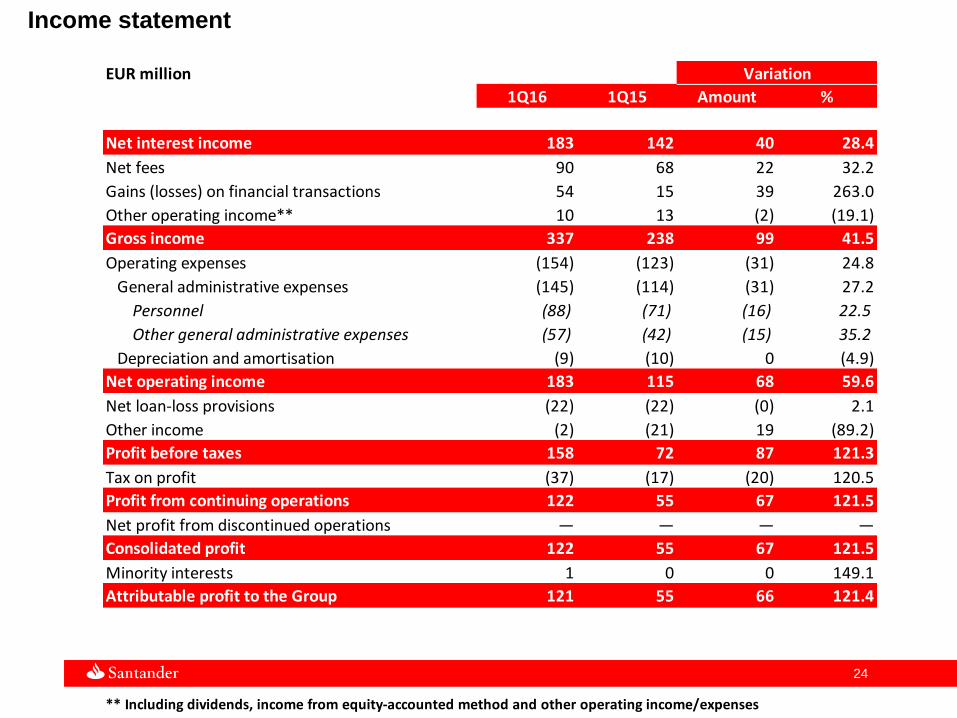
Income statement
EUR million Variation
1Q16 1Q15 Amount %
Net interest income 183 142 40 28.4
Net fees 90 68 22 32.2
Gains (losses) on financial transactions 54 15 39 263.0
Other operating income** 10 13 (2) (19.1)
Gross income 337 238 99 41.5
Operating expenses (154) (123) (31) 24.8
General administrative expenses (145) (114) (31) 27.2
Personnel (88) (71) (16) 22.5
Other general administrative expenses (57) (42) (15) 35.2
Depreciation and amortisation (9) (10) 0 (4.9)
Net operating income 183 115 68 59.6
Net loan-loss provisions (22) (22) (0) 2.1
Other income (2) (21) 19 (89.2)
Profit before taxes 158 72 87 121.3
Tax on profit (37) (17) (20) 120.5
Profit from continuing operations 122 55 67 121.5
Net profit from discontinued operations — — — —
Consolidated profit 122 55 67 121.5
Minority interests 1 0 0 149.1
Attributable profit to the Group 121 55 66 121.4
** Including dividends, income from equity-accounted method and other operating income/expenses
2525
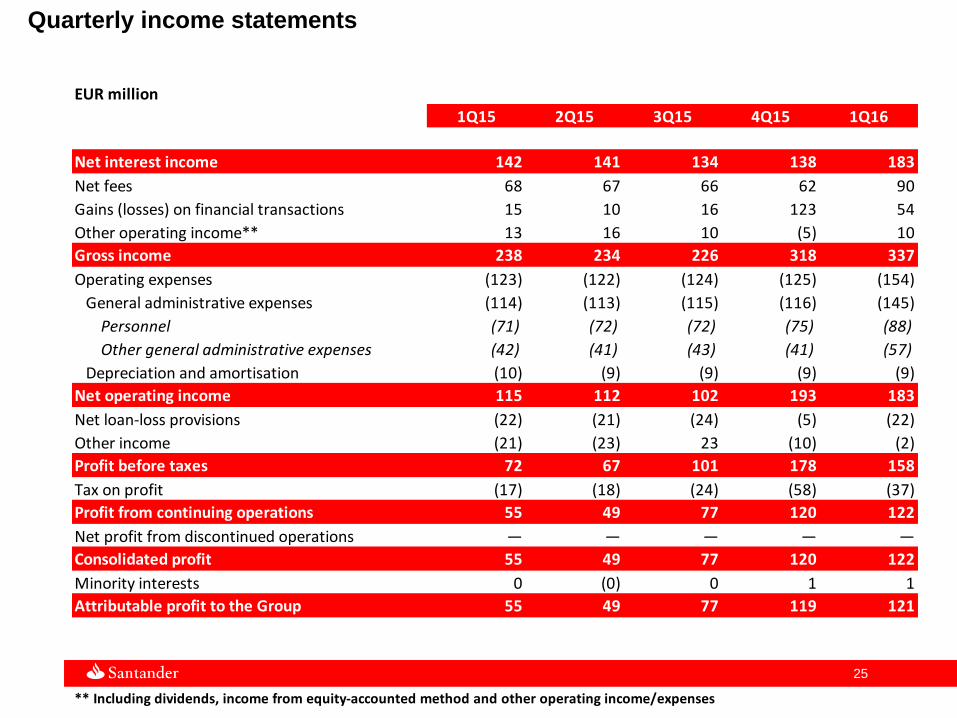
Quarterly income statements
EUR million
1Q15 2Q15 3Q15 4Q15 1Q16
Net interest income 142 141 134 138 183
Net fees 68 67 66 62 90
Gains (losses) on financial transactions 15 10 16 123 54
Other operating income** 13 16 10 (5) 10
Gross income 238 234 226 318 337
Operating expenses (123) (122) (124) (125) (154)
General administrative expenses (114) (113) (115) (116) (145)
Personnel (71) (72) (72) (75) (88)
Other general administrative expenses (42) (41) (43) (41) (57)
Depreciation and amortisation (10) (9) (9) (9) (9)
Net operating income 115 112 102 193 183
Net loan-loss provisions (22) (21) (24) (5) (22)
Other income (21) (23) 23 (10) (2)
Profit before taxes 72 67 101 178 158
Tax on profit (17) (18) (24) (58) (37)
Profit from continuing operations 55 49 77 120 122
Net profit from discontinued operations — — — — —
Consolidated profit 55 49 77 120 122
Minority interests 0 (0) 0 1 1
Attributable profit to the Group 55 49 77 119 121
** Including dividends, income from equity-accounted method and other operating income/expenses
Nuestra misión es contribuir al progreso de
las personas y de las empresas.
Nuestra cultura se basa en la creencia de
que todo lo que hacemos debe ser
Thank you
Our purpose is to help people and
businesses prosper.
Our culture is based on the belief that
everything we do should be