234 61 47 46 179 74 37 130 172 q3 & 9m fy17 results ... 17/results... · this presentation,...
TRANSCRIPT

234 61 47
46 179 74
37 130 172
177 177 177
133 41 30
9 83 113
43 126 62
247 223 60
233 233 233
88 89 91
235 174 173
161 227 179
172 216 236
Q3 & 9M FY17
Results Presentation February 02, 2017
* in terms of number of screens.

234 61 47
46 179 74
37 130 172
177 177 177
133 41 30
9 83 113
43 126 62
247 223 60
233 233 233
88 89 91
235 174 173
161 227 179
172 216 236
Safe Harbour
The presentation has been prepared by UFO Moviez India Limited together with its subsidiaries (the “Company”), for informational purpose only
and does not constitute or form part of an offer, solicitation or invitation of any offer to purchase or subscribe for any securities of the Company in
any jurisdiction, nor should this presentation or any part thereof form the basis of, or be relied upon in any connection with, any contract,
commitment or investment decision whatsoever.
This presentation has not been independently verified. No representation or warranty, expressed or implied, is made and no reliance should be
placed on the accuracy, fairness or completeness of the information presented or contained in the presentation. None of the Company or any of
its affiliates, advisers or representatives accepts any liability whatsoever for any loss howsoever arising from any information presented or
contained in these materials. The information presented or contained in this presentation is subject to change without notice and its accuracy is
not guaranteed.
This presentation, except for the historical information, may contain forward looking statements, including the words or phrases such as
“expects”, “anticipates”, “intends”, “will”, “would”, “undertakes”, “aims”, “estimates”, “contemplates”, “seeks to”, “objective”, “goal”, “projects”,
“should” and similar expressions or variations of these expressions or negatives of these terms indicating future performance or results, financial
or otherwise, which are forward looking statements. These forward looking statements are based on certain expectations, assumptions,
anticipated developments and other factors which are not limited to, risk and uncertainties regarding fluctuations in earnings, market growth,
intense competition and the pricing environment in the market, ability to maintain and manage key customer relationship and supply chain
sources and those factors which may affect our ability to implement business strategies successfully, namely changes in regulatory
environments, political instability and new or changed priorities of the trade. The Company, therefore, cannot guarantee that the forward looking
statements made herein shall be realized. The Company, based on changes as stated above, may alter, amend, modify or make necessary
corrective changes in any manner to any such forward looking statement contained herein or make written or oral forward looking statements as
may be required from time to time on the basis of subsequent developments and events. The Company does not undertake any obligation to
update forward looking statements that may be made from time to time by or on behalf of the Company to reflect the events or circumstances
after the date hereof.
1

234 61 47
46 179 74
37 130 172
177 177 177
133 41 30
9 83 113
43 126 62
247 223 60
233 233 233
88 89 91
235 174 173
161 227 179
172 216 236
UFO Moviez at a Glance
2
India’s Largest Digital Cinema Network and In-Cinema Advertising Platform
Indian Film Industry’s Largest
Content Distribution Highway
India’s Largest In-cinema
High Impact Advertising Platform
5,052* Digital Screens in India
3,737 In Cinema Advertising Screens
~2.10 million Seating capacity per show
with an average weekly seating capacity of
~49 million
Digitally Delivered 462 Movies
for 1,160 Distributors in Q3FY17 1,090 Advertisers in Q3FY17
Across 1,950 Locations
Across 1,911 Locations
Data as on December 31, 2016
* Nepal forms a part of the Indian Film Territory, hence the # of digital screens includes 121 screens in Nepal
234 61 47
46 179 74
37 130 172
177 177 177
133 41 30
9 83 113
43 126 62
247 223 60
233 233 233
88 89 91
235 174 173
161 227 179
172 216 236
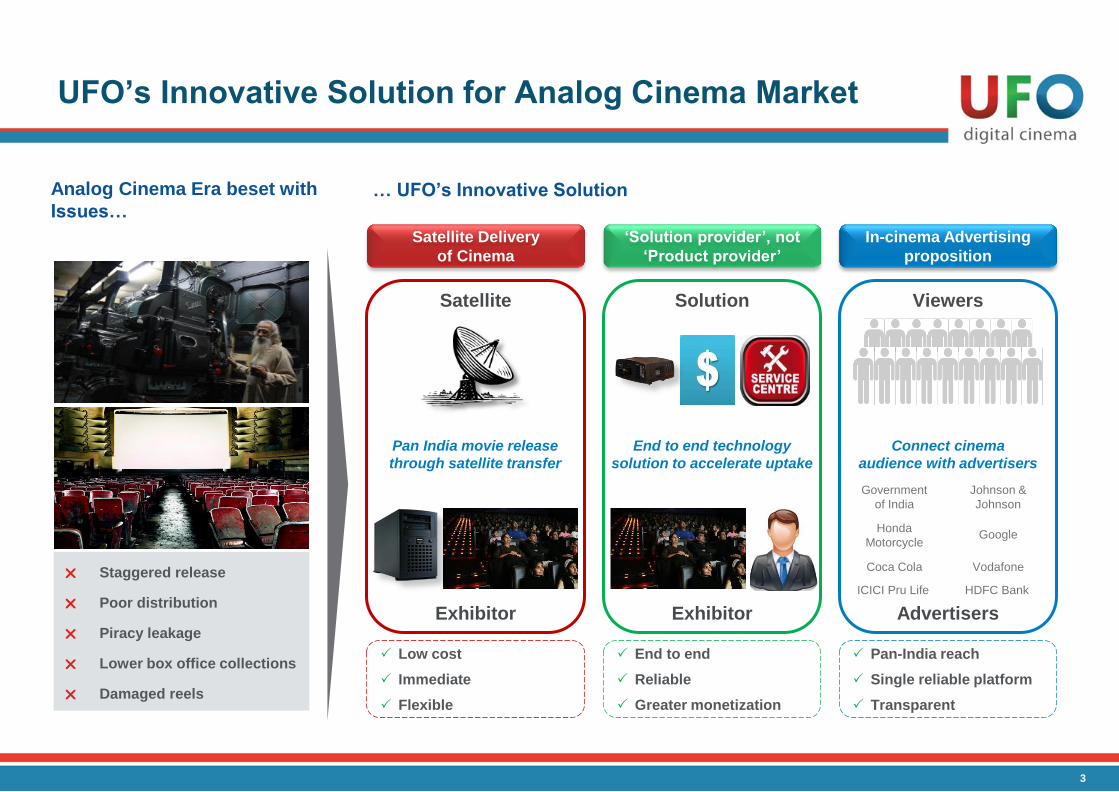
UFO’s Innovative Solution for Analog Cinema Market
Satellite Delivery
of Cinema
‘Solution provider’, not
‘Product provider’
Satellite
Exhibitor
Solution
Exhibitor
Pan India movie release
through satellite transfer
End to end technology
solution to accelerate uptake
In-cinema Advertising
proposition
Viewers
Advertisers
Connect cinema
audience with advertisers
Low cost
Immediate
Flexible
End to end
Reliable
Greater monetization
Pan-India reach
Single reliable platform
Transparent
Staggered release
Poor distribution
Piracy leakage
Lower box office collections
Damaged reels
Analog Cinema Era beset with
Issues… … UFO’s Innovative Solution
Government
of India
Johnson &
Johnson
Vodafone Coca Cola
Honda
Motorcycle
HDFC Bank ICICI Pru Life
3
234 61 47
46 179 74
37 130 172
177 177 177
133 41 30
9 83 113
43 126 62
247 223 60
233 233 233
88 89 91
235 174 173
161 227 179
172 216 236
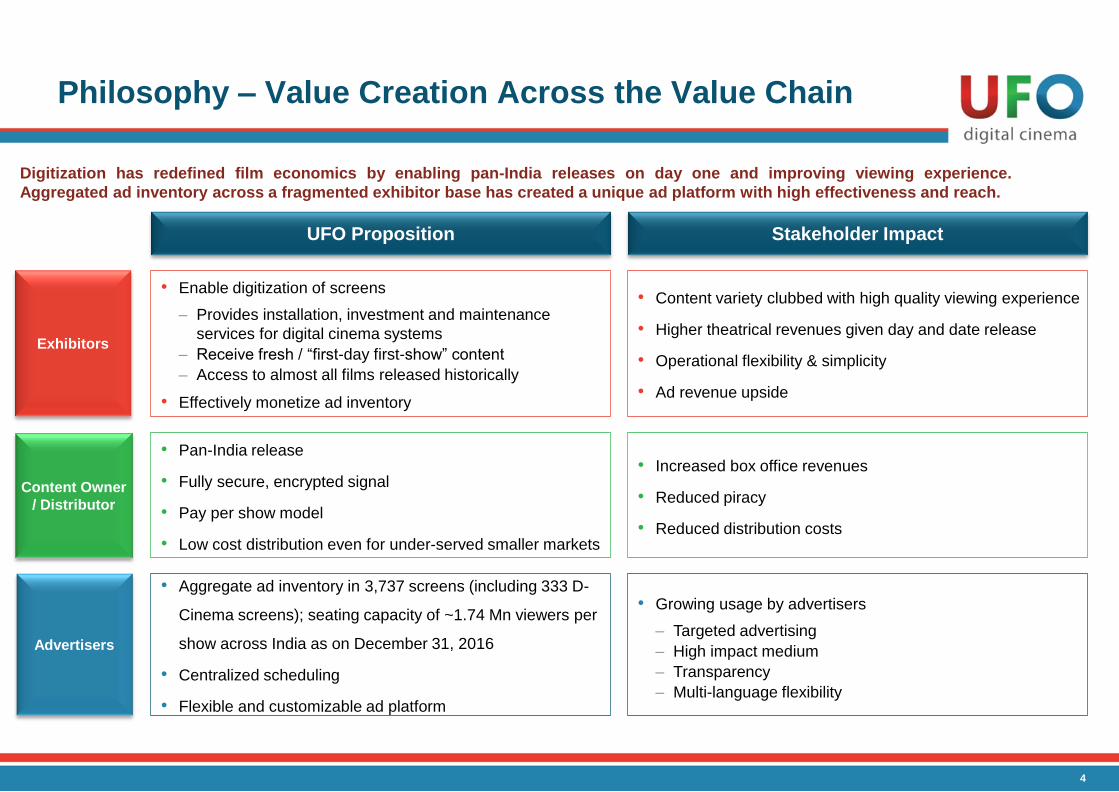
Philosophy – Value Creation Across the Value Chain
4
Digitization has redefined film economics by enabling pan-India releases on day one and improving viewing experience.
Aggregated ad inventory across a fragmented exhibitor base has created a unique ad platform with high effectiveness and reach.
Content Owner
/ Distributor
Exhibitors
Advertisers
UFO Proposition Stakeholder Impact
• Pan-India release
• Fully secure, encrypted signal
• Pay per show model
• Low cost distribution even for under-served smaller markets
• Increased box office revenues
• Reduced piracy
• Reduced distribution costs
• Enable digitization of screens
– Provides installation, investment and maintenance
services for digital cinema systems
– Receive fresh / “first-day first-show” content
– Access to almost all films released historically
• Effectively monetize ad inventory
• Content variety clubbed with high quality viewing experience
• Higher theatrical revenues given day and date release
• Operational flexibility & simplicity
• Ad revenue upside
• Aggregate ad inventory in 3,737 screens (including 333 D-
Cinema screens); seating capacity of ~1.74 Mn viewers per
show across India as on December 31, 2016
• Centralized scheduling
• Flexible and customizable ad platform
• Growing usage by advertisers
– Targeted advertising
– High impact medium
– Transparency
– Multi-language flexibility
234 61 47
46 179 74
37 130 172
177 177 177
133 41 30
9 83 113
43 126 62
247 223 60
233 233 233
88 89 91
235 174 173
161 227 179
172 216 236
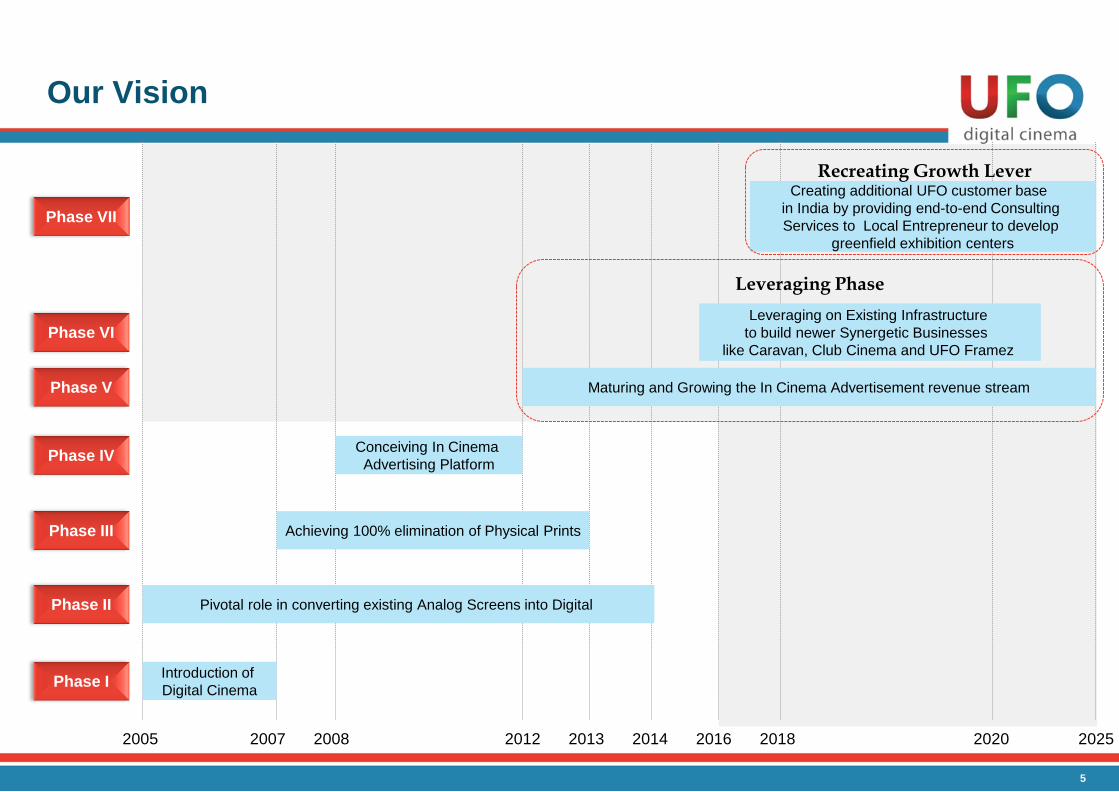
Our Vision
Phase III
Phase IV
Phase V
Phase VI
2005 2007 2008 2012 2013 2016 2014 2025 2018 2020
Phase II
Phase I Introduction of
Digital Cinema
Pivotal role in converting existing Analog Screens into Digital
Achieving 100% elimination of Physical Prints
Conceiving In Cinema
Advertising Platform
Maturing and Growing the In Cinema Advertisement revenue stream
Leveraging on Existing Infrastructure
to build newer Synergetic Businesses
like Caravan, Club Cinema and UFO Framez
Leveraging Phase
5
Phase VII
Creating additional UFO customer base
in India by providing end-to-end Consulting
Services to Local Entrepreneur to develop
greenfield exhibition centers
Recreating Growth Lever

234 61 47
46 179 74
37 130 172
177 177 177
133 41 30
9 83 113
43 126 62
247 223 60
233 233 233
88 89 91
235 174 173
161 227 179
172 216 236
Shareholder Value Creation
Initial high capital intensity over; poised to generate higher revenues with lower
incremental capex.
Network Effect and Operational Efficiencies lead to increasing RoCE.
Intent to grow only in synergistic businesses with low content risk.
Intent to distribute ≥ 25% of PAT annually.
Capital Intensity
Capital Efficiency
Capital Allocation
Capital Distribution
6

234 61 47
46 179 74
37 130 172
177 177 177
133 41 30
9 83 113
43 126 62
247 223 60
233 233 233
88 89 91
235 174 173
161 227 179
172 216 236
Financial and Operating Highlights
7

234 61 47
46 179 74
37 130 172
177 177 177
133 41 30
9 83 113
43 126 62
247 223 60
233 233 233
88 89 91
235 174 173
161 227 179
172 216 236
Financial Highlights – Q3FY17 vs Q3FY16
1,452 1,488
Q3FY16 Q3FY17
Total Revenue (INR Mn)
449 434
30.9% 29.1%
Q3FY16 Q3FY17
EBITDA (INR Mn) & Margin (%)
160 136
11.0%
9.1%
Q3FY16 Q3FY17
PAT** (INR Mn) & Margin (%)
2.5% 15.2% 3.4%
8
Consolidated
238 209
16.4%
14.1%
Q3FY16 Q3FY17
PBT (INR Mn) & Margin (%)
12.0%
Consolidated, excluding VDSPL*
1,437 1,473
Q3FY16 Q3FY17
Total Revenue (INR Mn)
476 453
33.1% 30.8%
Q3FY16 Q3FY17
EBITDA (INR Mn) & Margin (%)
197 179
13.7%
12.1%
Q3FY16 Q3FY17
PAT** (INR Mn) & Margin (%)
2.5% 9.2% 4.7%
274 252
19.1%
17.1%
Q3FY16 Q3FY17
PBT (INR Mn) & Margin (%)
8.1%
**PAT after Minority Interest
*VDSPL includes Caravan Talkies and Club Cinema businesses

234 61 47
46 179 74
37 130 172
177 177 177
133 41 30
9 83 113
43 126 62
247 223 60
233 233 233
88 89 91
235 174 173
161 227 179
172 216 236
Financial Highlights – 9MFY17 vs 9MFY16
9
Consolidated
4,254 4,433
9MFY16 9MFY17
Total Revenue (INR Mn)
1,317 1,354
31.0% 30.5%
9MFY16 9MFY17
EBITDA (INR Mn) & Margin (%)
457 437
10.7% 9.8%
9MFY16 9MFY17
PAT** (INR Mn) & Margin (%)
659 689
15.5% 15.5%
9MFY16 9MFY17
PBT (INR Mn) & Margin (%)
4.2% 4.5% 2.8% 4.6%
4,220 4,401
9MFY16 9MFY17
Total Revenue (INR Mn)
1,359 1,423
32.2% 32.3%
9MFY16 9MFY17
EBITDA (INR Mn) & Margin (%)
520 571
12.3% 13.0%
9MFY16 9MFY17
PAT** (INR Mn) & Margin (%)
Consolidated, excluding VDSPL*
722 823
17.1% 18.7%
9MFY16 9MFY17
PBT (INR Mn) & Margin (%)
4.3% 9.7% 4.7% 14.0%
**PAT after Minority Interest
*VDSPL includes Caravan Talkies and Club Cinema businesses
234 61 47
46 179 74
37 130 172
177 177 177
133 41 30
9 83 113
43 126 62
247 223 60
233 233 233
88 89 91
235 174 173
161 227 179
172 216 236
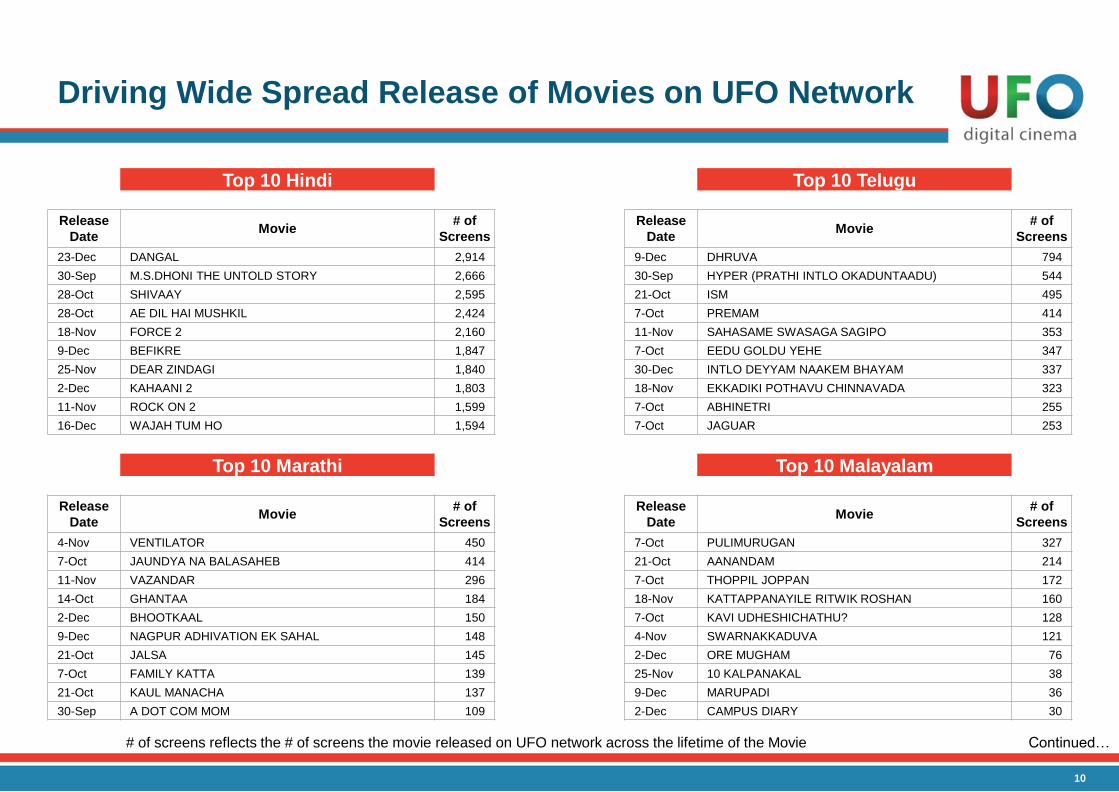
Driving Wide Spread Release of Movies on UFO Network
Continued… # of screens reflects the # of screens the movie released on UFO network across the lifetime of the Movie
10
Top 10 Hindi Top 10 Telugu
Release
Date Movie
# of
Screens
Release
Date Movie
# of
Screens
23-Dec DANGAL 2,914 9-Dec DHRUVA 794
30-Sep M.S.DHONI THE UNTOLD STORY 2,666 30-Sep HYPER (PRATHI INTLO OKADUNTAADU) 544
28-Oct SHIVAAY 2,595 21-Oct ISM 495
28-Oct AE DIL HAI MUSHKIL 2,424 7-Oct PREMAM 414
18-Nov FORCE 2 2,160 11-Nov SAHASAME SWASAGA SAGIPO 353
9-Dec BEFIKRE 1,847 7-Oct EEDU GOLDU YEHE 347
25-Nov DEAR ZINDAGI 1,840 30-Dec INTLO DEYYAM NAAKEM BHAYAM 337
2-Dec KAHAANI 2 1,803 18-Nov EKKADIKI POTHAVU CHINNAVADA 323
11-Nov ROCK ON 2 1,599 7-Oct ABHINETRI 255
16-Dec WAJAH TUM HO 1,594 7-Oct JAGUAR 253
Top 10 Marathi Top 10 Malayalam
Release
Date Movie
# of
Screens
Release
Date Movie
# of
Screens
4-Nov VENTILATOR 450 7-Oct PULIMURUGAN 327
7-Oct JAUNDYA NA BALASAHEB 414 21-Oct AANANDAM 214
11-Nov VAZANDAR 296 7-Oct THOPPIL JOPPAN 172
14-Oct GHANTAA 184 18-Nov KATTAPPANAYILE RITWIK ROSHAN 160
2-Dec BHOOTKAAL 150 7-Oct KAVI UDHESHICHATHU? 128
9-Dec NAGPUR ADHIVATION EK SAHAL 148 4-Nov SWARNAKKADUVA 121
21-Oct JALSA 145 2-Dec ORE MUGHAM 76
7-Oct FAMILY KATTA 139 25-Nov 10 KALPANAKAL 38
21-Oct KAUL MANACHA 137 9-Dec MARUPADI 36
30-Sep A DOT COM MOM 109 2-Dec CAMPUS DIARY 30

234 61 47
46 179 74
37 130 172
177 177 177
133 41 30
9 83 113
43 126 62
247 223 60
233 233 233
88 89 91
235 174 173
161 227 179
172 216 236
Driving Wide Spread Release of Movies on UFO Network
# of screens reflects the # of screens the movie released on UFO network across the lifetime of the Movie
11
Top 10 Tamil Top 10 Kannada
Release
Date Movie
# of
Screens
Release
Date Movie
# of
Screens
28-Oct KODI 299 30-Sep DODMANE HUDGA 276
11-Nov ACHCHAM YENBADHU MADAMAIYADA 253 14-Oct NAGARAHAVU 239
7-Oct REMO 250 28-Oct MUKUNDA MURARI 216
28-Oct KAASHMORA 249 28-Oct SANTHU STRAIGHT FORWARD 205
2-Dec SAITHAN 218 7-Oct JAGUAR 195
25-Nov KAVALAI VENDAM 210 7-Oct DANA KAYONU 168
23-Dec KATHTHI SANDAI 196 18-Nov NATARAJA SERVICE 160
9-Dec CHENNAI 600028 II 158 23-Dec SUNDARANGA JANA 142
7-Oct DEVI 141 9-Dec JOHN JANI JANARDHAN 130
7-Oct REKKA 133 25-Nov MADHA MATTHU MANASI 118
Top 10 Gujarati Top 10 Bhojpuri
Release
Date Movie
# of
Screens
Release
Date Movie
# of
Screens
4-Nov PASSPORT 164 7-Oct MOKAMA 0 KM 154
4-Nov LAVARI 130 28-Oct BETA 126
11-Nov KAIK KARNE YAAR 113 7-Oct HAMAR TRIDEV 125
11-Nov HARDIK ABHINANDAN 75 7-Oct HOGI PYAR KI JEET 122
14-Oct KOI AANE PARNAVO 72 4-Nov JWALA 90
9-Dec MISSION MUMMY 72 28-Oct TRUCK DRIVER 2 85
28-Oct PATEL NI PATLAI ANE THAKOR NEE KHANDANI 66 18-Nov DHARM KE SAUDAGAR 50
30-Dec PATEL PAACHHO NA PADE THAKOR KOI THI NA DARE 52 23-Dec BALLIA KE DABANGAI 13
30-Dec KOOKH 43 30-Sep MAAI KE BIRUVA 12
4-Nov COMMITMENT 33 2-Dec RAJU BANAL COLLECTOR BABU 11

234 61 47
46 179 74
37 130 172
177 177 177
133 41 30
9 83 113
43 126 62
247 223 60
233 233 233
88 89 91
235 174 173
161 227 179
172 216 236
Consolidated Revenue Mix
12
391 27%
651 45%
406 28%
Q3FY16
432 29%
627 42%
427 29%
Q3FY17
Exhibitor Revenue Distributor Revenue Advertisement Revenue
1,448 1,486
(INR Mn)
1,128 26%
1,954 44%
1,341 30%
1,219 29%
1,905 45%
1,112 26%
4,423 4,236
9MFY16 9MFY17
(INR Mn) Q3FY17 Q3FY16 Growth 9MFY17 9MFY16 Growth
Advertisement revenue 427 406 5.2% 1,341 1,112 20.5%
Virtual Print Fees - E-Cinema 261 256 1.9% 784 740 6.0%
Virtual Print Fees - D-Cinema 351 381 -8.0% 1,124 1,120 0.4%
Lease rental income - E-Cinema 113 100 13.9% 335 292 14.6%
Lease rental income - D-Cinema 32 37 -15.8% 110 118 -7.1%
Other Operating Revenues 110 69 60.2% 201 163 23.6%
Total Sale of Services 1,294 1,249 3.6% 3,895 3,545 9.9%
Total Sales of Products 192 199 -3.0% 528 691 -23.6%
Revenue from operations 1,486 1,448 2.7% 4,423 4,236 4.4%
* Excludes Other Income

234 61 47
46 179 74
37 130 172
177 177 177
133 41 30
9 83 113
43 126 62
247 223 60
233 233 233
88 89 91
235 174 173
161 227 179
172 216 236
In Cinema Advertising Performance
13
234 61 47
46 179 74
37 130 172
177 177 177
133 41 30
9 83 113
43 126 62
247 223 60
233 233 233
88 89 91
235 174 173
161 227 179
172 216 236
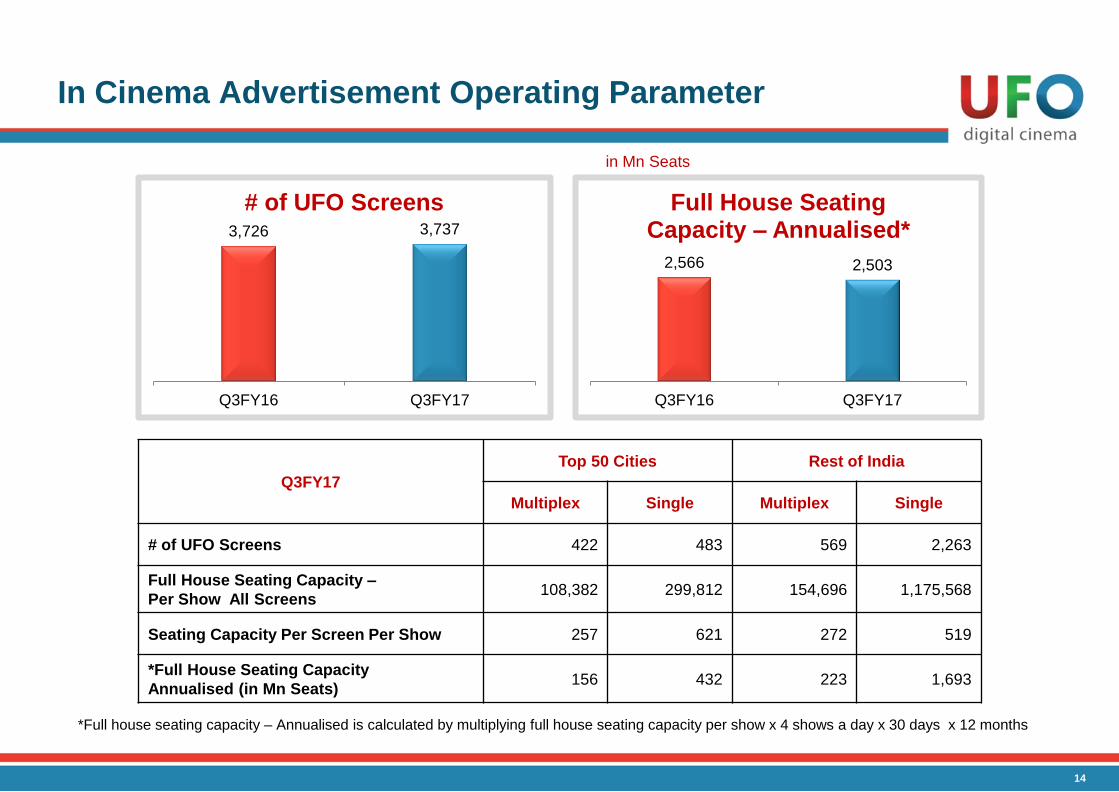
In Cinema Advertisement Operating Parameter
2,566 2,503
Q3FY16 Q3FY17
Full House Seating Capacity – Annualised*
Q3FY17
Top 50 Cities Rest of India
Multiplex Single Multiplex Single
# of UFO Screens 422 483 569 2,263
Full House Seating Capacity –
Per Show All Screens 108,382 299,812 154,696 1,175,568
Seating Capacity Per Screen Per Show 257 621 272 519
*Full House Seating Capacity
Annualised (in Mn Seats) 156 432 223 1,693
*Full house seating capacity – Annualised is calculated by multiplying full house seating capacity per show x 4 shows a day x 30 days x 12 months
in Mn Seats
14
3,726 3,737
Q3FY16 Q3FY17
# of UFO Screens

234 61 47
46 179 74
37 130 172
177 177 177
133 41 30
9 83 113
43 126 62
247 223 60
233 233 233
88 89 91
235 174 173
161 227 179
172 216 236
Advertisement Revenue Analysis
Average # of minutes sold / show / Ad Screen is calculated by dividing total # of advertisement minutes sold by average # of Screens with Ad Rights during the period
Average # of Advertising Screens = (Sum of # of Opening Advertisement Screens and # of Closing Advertisement Screens) / 2
15
48% 50% 45%
54% 52% 50%
55%
46%
Q3FY16 Q3FY17 9MFY16 9MFY17
Government + PSU Corporate + Hyperlocal + Caravan
406 427
INR Mn
In Cinema Advertisement Q3FY17 Q3FY16 9MFY17 9MFY16
Ad Revenue / Screen for the period (Avg) (Rs.) 111,770 105,976 354,474 288,960
Average # of minutes sold / show / Ad Screen 3.88 4.36 4.32 3.97
# of In Cinema Advertising Clients 1,090 1,076 2,442 2,182
1,112
1,341

234 61 47
46 179 74
37 130 172
177 177 177
133 41 30
9 83 113
43 126 62
247 223 60
233 233 233
88 89 91
235 174 173
161 227 179
172 216 236
Theatrical Revenues
16

234 61 47
46 179 74
37 130 172
177 177 177
133 41 30
9 83 113
43 126 62
247 223 60
233 233 233
88 89 91
235 174 173
161 227 179
172 216 236
Theatrical revenues from Distributors
E – Cinema - VPF
D – Cinema - VPF
Gross Revenue
Net Revenue
Domestic includes revenues generated from screens in Nepal
Net Revenue = Gross Revenue less Revenue Share with the Exhibitors
17
256 261
740 784
250 249
722 746
Q3FY16 Q3FY17 9MFY16 9MFY17
Domestic Revenue (INR Mn)
208 188
613 627
151 137
431 438
Q3FY16 Q3FY17 9MFY16 9MFY17
Domestic Revenue (INR Mn)
174 163
507 497
54 52
163 159
Q3FY16 Q3FY17 9MFY16 9MFY17
International Revenue (INR Mn)
234 61 47
46 179 74
37 130 172
177 177 177
133 41 30
9 83 113
43 126 62
247 223 60
233 233 233
88 89 91
235 174 173
161 227 179
172 216 236
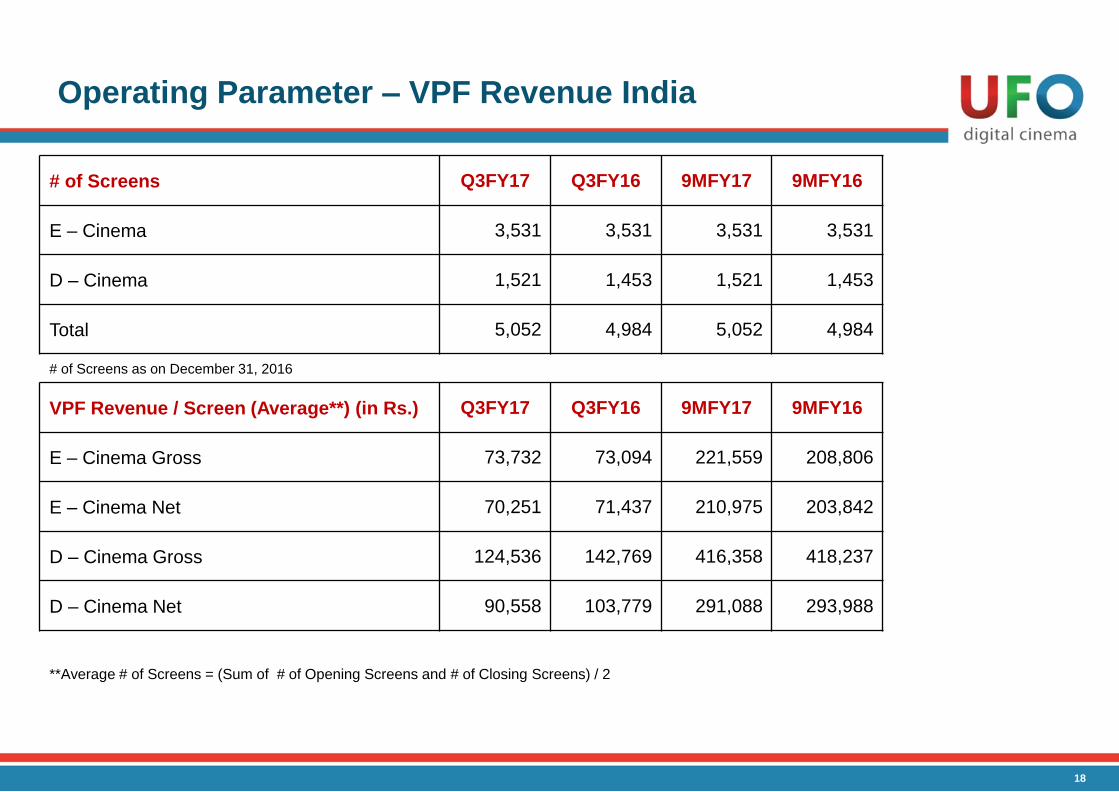
Operating Parameter – VPF Revenue India
**Average # of Screens = (Sum of # of Opening Screens and # of Closing Screens) / 2
18
# of Screens Q3FY17 Q3FY16 9MFY17 9MFY16
E – Cinema 3,531 3,531 3,531 3,531
D – Cinema 1,521 1,453 1,521 1,453
Total 5,052 4,984 5,052 4,984
# of Screens as on December 31, 2016
VPF Revenue / Screen (Average**) (in Rs.) Q3FY17 Q3FY16 9MFY17 9MFY16
E – Cinema Gross 73,732 73,094 221,559 208,806
E – Cinema Net 70,251 71,437 210,975 203,842
D – Cinema Gross 124,536 142,769 416,358 418,237
D – Cinema Net 90,558 103,779 291,088 293,988
234 61 47
46 179 74
37 130 172
177 177 177
133 41 30
9 83 113
43 126 62
247 223 60
233 233 233
88 89 91
235 174 173
161 227 179
172 216 236
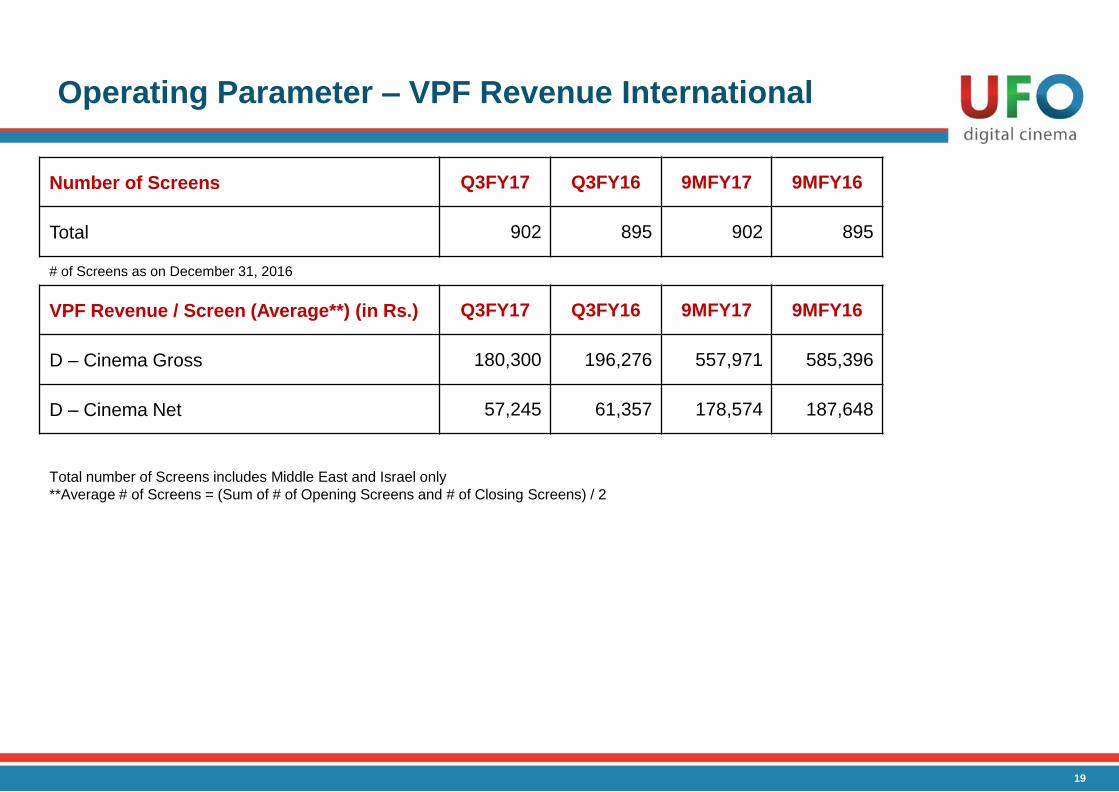
Operating Parameter – VPF Revenue International
Total number of Screens includes Middle East and Israel only
**Average # of Screens = (Sum of # of Opening Screens and # of Closing Screens) / 2
19
Number of Screens Q3FY17 Q3FY16 9MFY17 9MFY16
Total 902 895 902 895
# of Screens as on December 31, 2016
VPF Revenue / Screen (Average**) (in Rs.) Q3FY17 Q3FY16 9MFY17 9MFY16
D – Cinema Gross 180,300 196,276 557,971 585,396
D – Cinema Net 57,245 61,357 178,574 187,648

234 61 47
46 179 74
37 130 172
177 177 177
133 41 30
9 83 113
43 126 62
247 223 60
233 233 233
88 89 91
235 174 173
161 227 179
172 216 236
Impact of Demonetization on Q3FY17 Performance
• Caravan Talkies re-commenced operations on October 10, 2016 due to extended monsoons
• As on November 8, 2016, 44 vans were operational
• Demonetization adversely impacted the performance of Caravan Talkies
• New media platforms were the most impacted amongst other mediums
• India’s rural economy was the most hit by demonetization
• Decline in consumer demand in rural areas led to withdrawal of advertisement contracts
• Operating losses reduced during the quarter owing to cost optimization initiatives undertaken
Progress of Caravan Talkies
20
234 61 47
46 179 74
37 130 172
177 177 177
133 41 30
9 83 113
43 126 62
247 223 60
233 233 233
88 89 91
235 174 173
161 227 179
172 216 236
Financial Performance
21
234 61 47
46 179 74
37 130 172
177 177 177
133 41 30
9 83 113
43 126 62
247 223 60
233 233 233
88 89 91
235 174 173
161 227 179
172 216 236
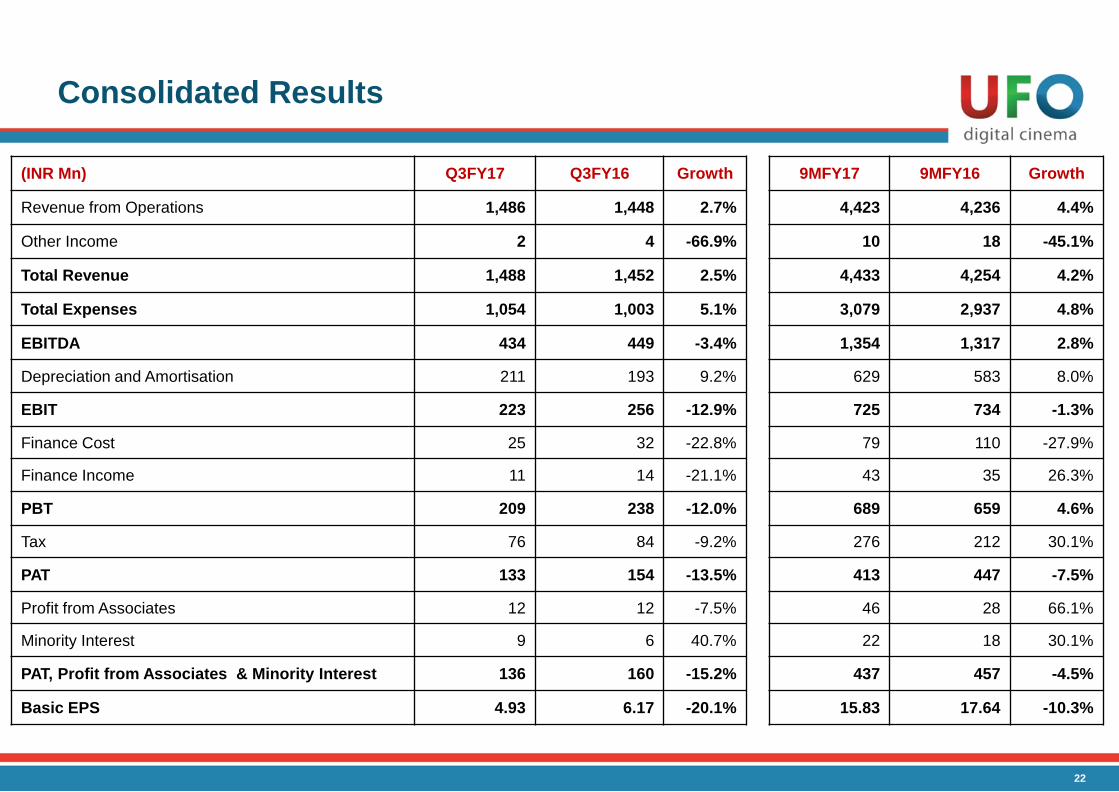
Consolidated Results
22
(INR Mn) Q3FY17 Q3FY16 Growth
9MFY17 9MFY16 Growth
Revenue from Operations 1,486 1,448 2.7%
4,423 4,236 4.4%
Other Income 2 4 -66.9%
10 18 -45.1%
Total Revenue 1,488 1,452 2.5%
4,433 4,254 4.2%
Total Expenses 1,054 1,003 5.1%
3,079 2,937 4.8%
EBITDA 434 449 -3.4%
1,354 1,317 2.8%
Depreciation and Amortisation 211 193 9.2% 629 583 8.0%
EBIT 223 256 -12.9%
725 734 -1.3%
Finance Cost 25 32 -22.8% 79 110 -27.9%
Finance Income 11 14 -21.1% 43 35 26.3%
PBT 209 238 -12.0%
689 659 4.6%
Tax 76 84 -9.2% 276 212 30.1%
PAT 133 154 -13.5%
413 447 -7.5%
Profit from Associates 12 12 -7.5% 46 28 66.1%
Minority Interest 9 6 40.7% 22 18 30.1%
PAT, Profit from Associates & Minority Interest 136 160 -15.2%
437 457 -4.5%
Basic EPS 4.93 6.17 -20.1%
15.83 17.64 -10.3%
234 61 47
46 179 74
37 130 172
177 177 177
133 41 30
9 83 113
43 126 62
247 223 60
233 233 233
88 89 91
235 174 173
161 227 179
172 216 236
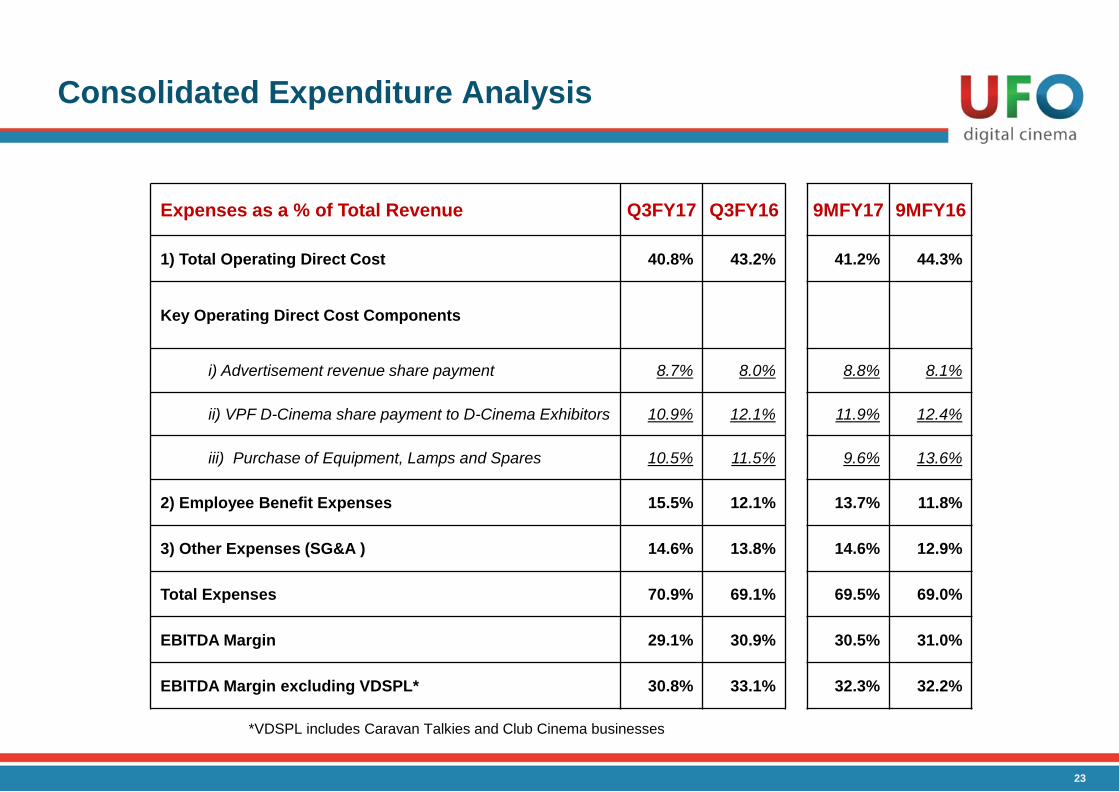
Consolidated Expenditure Analysis
23
*VDSPL includes Caravan Talkies and Club Cinema businesses
Expenses as a % of Total Revenue Q3FY17 Q3FY16 9MFY17 9MFY16
1) Total Operating Direct Cost 40.8% 43.2% 41.2% 44.3%
Key Operating Direct Cost Components
i) Advertisement revenue share payment 8.7% 8.0% 8.8% 8.1%
ii) VPF D-Cinema share payment to D-Cinema Exhibitors 10.9% 12.1% 11.9% 12.4%
iii) Purchase of Equipment, Lamps and Spares 10.5% 11.5% 9.6% 13.6%
2) Employee Benefit Expenses 15.5% 12.1% 13.7% 11.8%
3) Other Expenses (SG&A ) 14.6% 13.8% 14.6% 12.9%
Total Expenses 70.9% 69.1% 69.5% 69.0%
EBITDA Margin 29.1% 30.9% 30.5% 31.0%
EBITDA Margin excluding VDSPL* 30.8% 33.1% 32.3% 32.2%

234 61 47
46 179 74
37 130 172
177 177 177
133 41 30
9 83 113
43 126 62
247 223 60
233 233 233
88 89 91
235 174 173
161 227 179
172 216 236
Financial Performance excluding VDSPL
Reconciliation to EBITDA excluding VDSPL*
Reconciliation to PAT excluding VDSPL*
*VDSPL includes Caravan Talkies and Club Cinema businesses
**PAT after Minority Interest
24
(INR Mn) Q3FY17 Q3FY16 Growth 9MFY17 9MFY16 Growth
Reported EBITDA including VDSPL 434 449 -3.4% 1,354 1,317 2.8%
Margin 29.1% 30.9% 30.5% 31.0%
VDSPL EBITDA Loss 19 27 69 42
EBITDA Excluding VDSPL 453 476 -4.7% 1,423 1,359 4.7%
Margin 30.8% 33.1% 32.3% 32.2%
(INR Mn) Q3FY17 Q3FY16 Growth 9MFY17 9MFY16 Growth
Reported PAT** Including VDSPL 136 160 -15.2% 437 457 -4.5%
Margin 9.1% 11.0% 9.8% 10.7%
VDSPL PAT Loss 43 37 134 63
PAT Excluding VDSPL 179 197 -9.2% 571 520 9.7%
Margin 12.1% 13.7% 13.0% 12.3%

234 61 47
46 179 74
37 130 172
177 177 177
133 41 30
9 83 113
43 126 62
247 223 60
233 233 233
88 89 91
235 174 173
161 227 179
172 216 236
Annexure
25
234 61 47
46 179 74
37 130 172
177 177 177
133 41 30
9 83 113
43 126 62
247 223 60
233 233 233
88 89 91
235 174 173
161 227 179
172 216 236
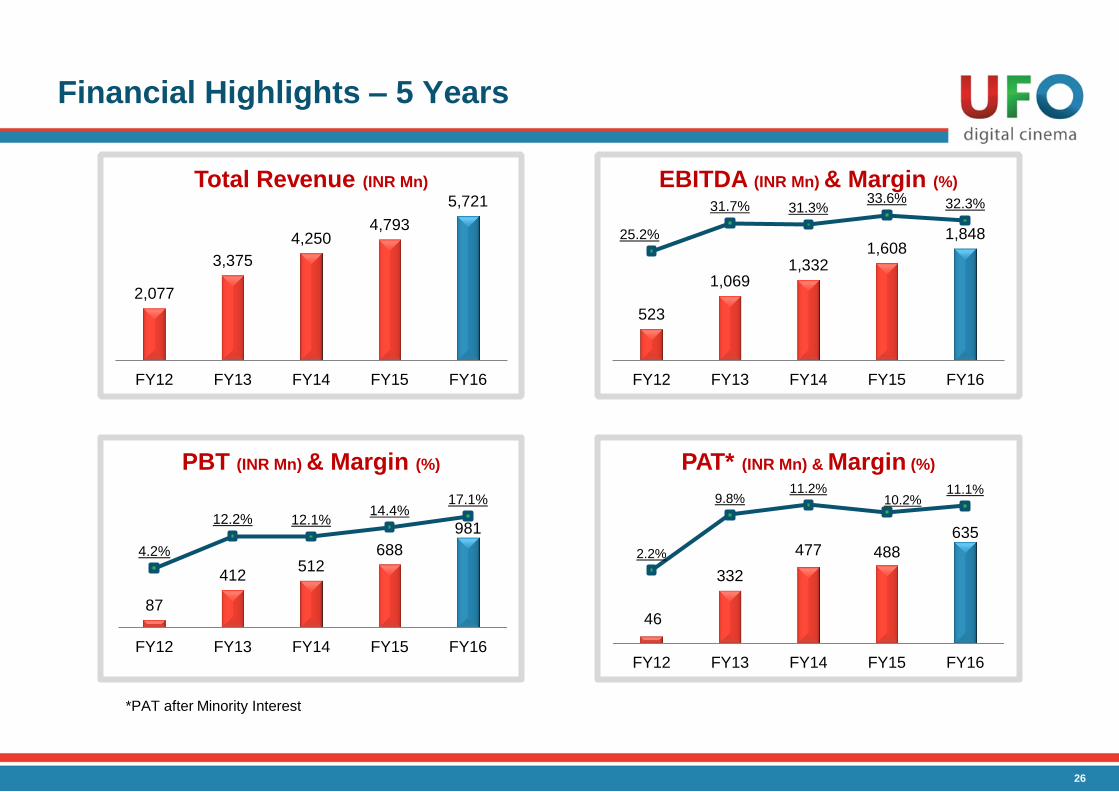
Financial Highlights – 5 Years
46
332
477 488
635
2.2%
9.8% 11.2%
10.2% 11.1%
FY12 FY13 FY14 FY15 FY16
PAT* (INR Mn) & Margin (%)
2,077
3,375
4,250 4,793
5,721
FY12 FY13 FY14 FY15 FY16
Total Revenue (INR Mn)
523
1,069 1,332
1,608 1,848 25.2%
31.7% 31.3% 33.6% 32.3%
FY12 FY13 FY14 FY15 FY16
EBITDA (INR Mn) & Margin (%)
87
412 512
688
981
4.2%
12.2% 12.1% 14.4%
17.1%
FY12 FY13 FY14 FY15 FY16
PBT (INR Mn) & Margin (%)
*PAT after Minority Interest
26
234 61 47
46 179 74
37 130 172
177 177 177
133 41 30
9 83 113
43 126 62
247 223 60
233 233 233
88 89 91
235 174 173
161 227 179
172 216 236
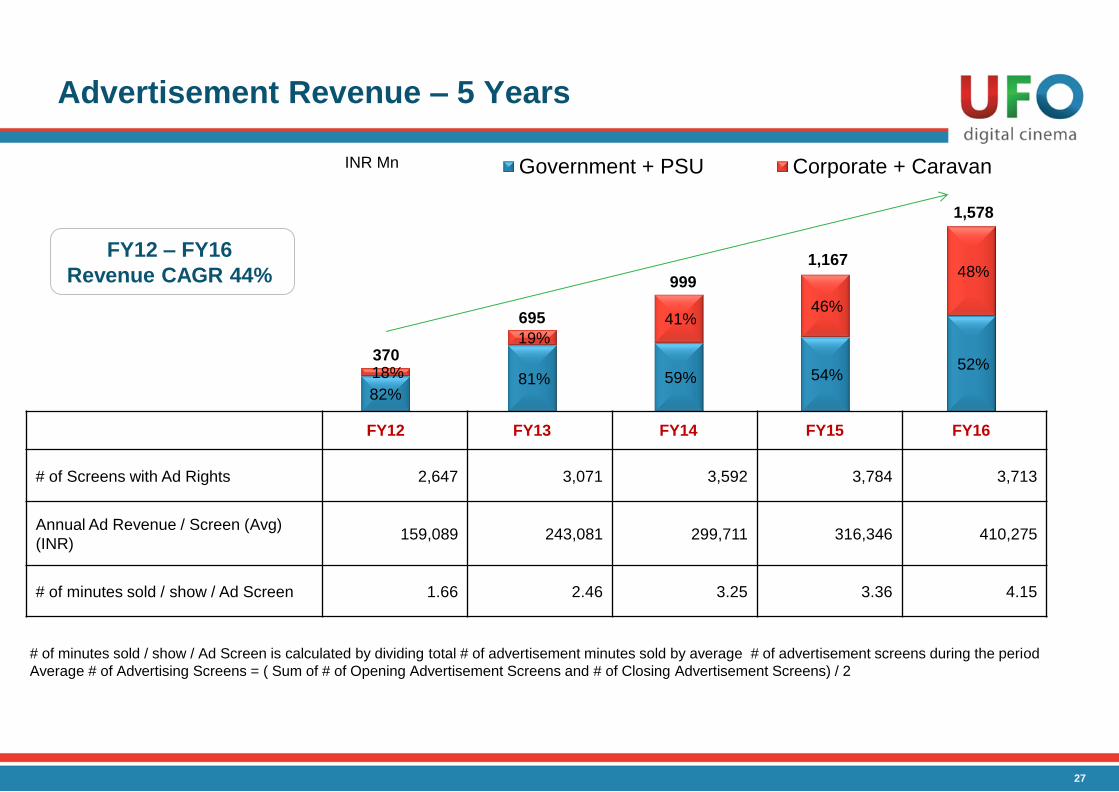
82% 81% 59% 54%
52% 18%
19%
41% 46%
48%
FY12 FY13 FY14 FY15 FY16
Government + PSU Corporate + Caravan
Advertisement Revenue – 5 Years
# of Screens with Ad Rights 2,647 3,071 3,592 3,784 3,713
Annual Ad Revenue / Screen (Avg)
(INR) 159,089 243,081 299,711 316,346 410,275
# of minutes sold / show / Ad Screen 1.66 2.46 3.25 3.36 4.15
370
695
999
1,167
1,578
INR Mn
FY12 – FY16
Revenue CAGR 44%
# of minutes sold / show / Ad Screen is calculated by dividing total # of advertisement minutes sold by average # of advertisement screens during the period
Average # of Advertising Screens = ( Sum of # of Opening Advertisement Screens and # of Closing Advertisement Screens) / 2
27

234 61 47
46 179 74
37 130 172
177 177 177
133 41 30
9 83 113
43 126 62
247 223 60
233 233 233
88 89 91
235 174 173
161 227 179
172 216 236
2.06%
10.10%
12.83% 11.49%
13.09%
FY12 FY13 FY14 FY15 FY16
RoE (%)
4.51%
12.01% 12.66% 14.34%
17.63%
FY12 FY13 FY14 FY15 FY16
RoCE (%)
0.46
0.65
0.83
0.32
0.01
FY12 FY13 FY14 FY15 FY16
Net Debt / EBITDA (X)
242
691
1,108
507
24
FY12 FY13 FY14 FY15 FY16
Net Debt* (INR Mn)
Key Financial Parameters – 5 Years
*Net Debt = Total Debt less Cash and Cash Equivalents
RoCE = EBIT/Average (Networth + Long Term Debt + Short Term Debt + Current Maturing Long Term Debt + Minority Interest)
RoE = PAT after Minority Interest / Average Networth
28

234 61 47
46 179 74
37 130 172
177 177 177
133 41 30
9 83 113
43 126 62
247 223 60
233 233 233
88 89 91
235 174 173
161 227 179
172 216 236
Shareholding
Marquee Institutional Investors*
29
(% of Total # of shares) December 31, 2016
Promoters 28.86%
Foreign Venture Capital Investors 19.03%
FII 5.46%
DII 21.46%
Corporate Bodies 7.08%
Foreign Bodies 1.14%
Others 16.97%
Total # of Shares 27,600,801
SBI Mutual Fund
Reliance Capital Asset Management
DSP Blackrock
Equinox Partners
Max Life Insurance
Grandeur Peak Global Advisors
Nomura Singapore
Reliance Nippon Life Insurance
Union Asset Management
*As on December 31, 2016
234 61 47
46 179 74
37 130 172
177 177 177
133 41 30
9 83 113
43 126 62
247 223 60
233 233 233
88 89 91
235 174 173
161 227 179
172 216 236
UFO Moviez India Limited
UFO Moviez India Limited (BSE Code: 539141; NSE Code: UFO) is India’s largest digital cinema distribution network and in-cinema advertising platform in
terms of number of screens. UFO operates India’s largest satellite-based, digital cinema distribution network using its UFO-M4 platform, as well as India’s
largest D-Cinema network. As on December 31, 2016, UFO’s global network, along with subsidiaries and associates, spans 6,674 screens worldwide, including
5,052 screens across India and 1,622 screens across the Middle East, Israel, Mexico and the USA.
UFO’s digitization and delivery model has been a key driver of extensive digitization of Indian cinemas and has enabled wide-spread, same day release of
movies across India. UFO adds value to all stakeholders in the movie value chain, spanning movie producers, distributors, exhibitors and the cinema-going
audience. UFO provides value to movie producers and distributors by reducing distribution costs, providing reach to a wide network, providing a faster method of
delivery of content and reducing piracy through encryption and other security measures. We provide value to movie exhibitors throughout India by providing
access to first day release of movies on our digital platform. Audiences benefit from faster access to new movie releases and a consistently high quality viewing
experience.
UFO has created a pan India, high impact in-cinema advertising platform with generally long-term advertising rights to 3,737 screens, with an aggregate seating
capacity of approximately 1.74 million viewers and a reach of 1,911 locations across India, as on December 31, 2016. UFO’s in-cinema advertising platform
enables advertisers to reach a targeted, captive audience with high flexibility and control over the advertising process. UFO’s in-cinema advertising platform also
allows small exhibitors who otherwise are not able to effectively monetise their advertising inventory due to their limited scale and reach to receive a greater
share of advertisement revenue than they are able to using traditional advertising methods.
About Us
Visit us at www.ufomoviez.com. For further details, contact:
Ashwin Chhugani
Sr. Manager – Investor Relations
Tel: : +91 22 4045 0713
Email: [email protected]
Shruti Mangar
Executive – Investor Relations
Tel: +91 22 4030 5126
Email: [email protected]
30