23 august 2017 fy17 results - my asp.net application · fy17 results presentation 23 august 2017 17...
TRANSCRIPT

isentia.com
FY17 RESULTSChief Executive Officer : John Croll Chief Financial Officer : James Orlando
23 AUGUST 2017

Overview of FY17 Results
Strategic Focus
FY17 Financial Performance
Q&A
AGENDA
John Croll
John Croll
James Orlando
John Croll & James Orlando

FY17 RESULTS PRESENTATION 23 August 20173
FY17 RESULT OVERVIEW
$M FY17 FY16 VAR %
REVENUE 155.1 156.0 (1%)
ANZ 107.9 107.0 1%
ASIA 32.9 28.5 16%
CM 14.4 20.6 (30%)
EXPENSES 113.7 105.0 (8%)
EBITDA 41.5 51.0 (19%)
• Revenue was slightly below the prior year with strong growth in Asia partially offsetting the decline in Content Marketing (CM)
• ANZ revenue impacted by customer churn and competition in FY17 H1 relating to the copyright agreement
• ANZ competitive environment stabilised in FY17 H2. Full year revenue growth of 2.6% after normalizing for reclassification of Two Social revenue
• Increase in expenses mainly due to $5.3m copyright cost increase and acquisition related costs in Asia
• Strong balance sheet and cash flow• Isentia declares a 50% franked final dividend of 3.08 cents
per share

11 countries5,000+ clients13,000 broadcast summaries daily30,000 print items daily300,000 FB comments/posts daily 1,200,000 online news items daily3,200,000 forum posts daily4,500,000 tweets daily
FY17 RESULTS PRESENTATION 23 August 20174
REAL DATA AND INSIGHTS

• Core media intelligence business is the market leader across Asia-Pacific• Continued investment in technology and SaaS platforms is further improving Isentia’s
competitive position in ANZ and Asian markets• Copyright payments are stable for FY18• STORIES and further improvements to the Mediaportal platform will deliver improved
revenue growth• Insights business continues to experience double digit revenue growth in ANZ and Asia• A clear plan for our content marketing business will see it fully integrated into Isentia and
delivering a positive EBITDA contribution
FY17 RESULTS PRESENTATION 23 August 20175
ISENTIA: MARKET LEADER IN ASIA-PACIFIC

• Isentia is the market leader in the ANZ media intelligence marketo Strong relationships with government and corporate clientso An essential service becoming more essential with media complexityo High recurring revenue with more than 85% of client subscriptions now fixedo Generates strong cash flow through scalable technology platforms
• ANZ Media Intelligence business initiativeso Product Improvements to Mediaportal have improved client retention and increased Isentia’s competitive
positiono STORIES delivered to market with positive feedback from clients. Will become revenue generating in
FY18o Client retention is strong with stable client numbers in Q4o The ANZ business reorganised to provide increased focus on retention and new saleso Product pipeline strong for H1 FY18 in ANZ markets
FY17 RESULTS PRESENTATION 23 August 20176
FY18 ANZ – A FOCUS ON THE CORE

FY17 RESULTS PRESENTATION 23 August 20177
Reports & AlertsMEDIAPORTAL PRODUCT INITIATIVES
• The most used function on Mediaportal is being totally redesigned and updated
• Supports clients in designing and building their own customised reports
• Flexible formats for any device• Integrates Isentia’s content into clients’ daily workflow• Imports data from external or client’s own sources• To be released to clients in September to further
improve market leadership and client retention

FY17 RESULTS PRESENTATION 23 August 20178
STORIES – Integrated Media IntelligenceNEW PRODUCT INITIATIVES
• Fully integrates print, broadcast, online and social media content
• Reduces time and effort for clients to understand depth and breadth of a story
• Trial rolled out to 300 clients in FY17 Q4 with positive feedback
• Clients being provided a free trial prior to making a decision on an opt out basis
• Will be sold to clients as a new product with separate pricing structure

• Isentia is the market leader in the Asian media intelligence marketo Isentia has the most comprehensive data and media sources across Asiao Technology platform fully supports all Asian languageso High recurring revenue with 100% of client subscriptions fixedo Recent acquisitions fully integrated into Isentia
• Full rollout of Mediaportal to further improve competitive position in Asiao Mediaportal to be delivered to the Korean market in Septembero Taiwan office opened in July with Mediaportal to be delivered to the market soon after
the Korean implementationo The cloud based Mediaportal version to be rolled out to all Asian officeso A focus on client retention to deliver improved results
FY17 RESULTS PRESENTATION 23 August 20179
FY18 ASIA – A FOCUS ON THE CORE
FY17 RESULTS PRESENTATION 23 August 201710
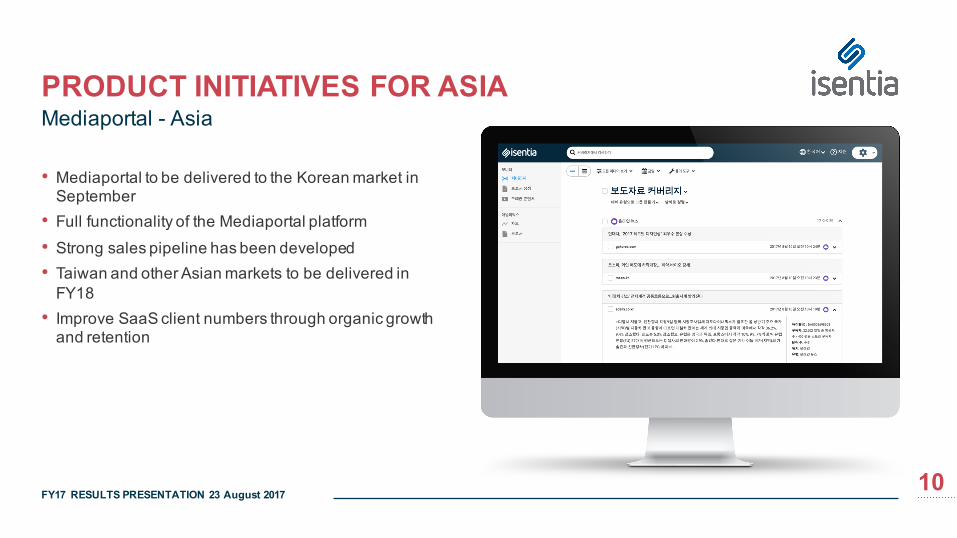
PRODUCT INITIATIVES FOR ASIA
• Mediaportal to be delivered to the Korean market in September
• Full functionality of the Mediaportal platform• Strong sales pipeline has been developed• Taiwan and other Asian markets to be delivered in
FY18• Improve SaaS client numbers through organic growth
and retention
Mediaportal - Asia

isentia.com
FY17 FINANCIAL PERFORMANCE

FY17 RESULTS PRESENTATION 23 August 201712
FY17 FINANCIAL RESULTS - SUMMARY
Key messages:• SaaS growth slower in ANZ (1%) than Asia
(3%)• Normalised VAS revenue growth of 19%• Increase in copyright costs following
renegotiation of the copyright contract in Australia
• EBITDA includes $4.4m loss for King Content, core EBITDA of $45.9m
• King Content impairment in FY17 of $39.4m
GROUP P&L - FY17 YEAR
$ M FY17 FY16 Variance $M Variance %
SaaS – Media Intelligence 103.3 101.9 1.4 1%
VAS 37.5 33.5 4.0 12%
Content Marketing 14.4 20.6 (6.3) (30%)
Revenue 155.1 156.0 (0.9) (1%)
Copyright expenses (17.7) (12.4) (5.3) (43%)
Other expenses (96.0) (92.6) (3.3) (4%)
Expenses (113.7) (105.0) (8.7) (8%)
EBITDA 41.5 51.0 (9.5) (19%)
EBITDA Margin 27% 33%
NPAT (13.5) 24.3 (37.8) (156%)
Underlying NPATA* 24.7 32.6 (7.9) (24%)
Earnings per share (cents) 12.4 16.3 (4.0) (24%)
* Underlying NPATA excludes non-recurring items

FY17 RESULTS PRESENTATION 23 August 201713
ANZ RESULTS SUMMARY
Key messages:• SaaS growth impacted by churn in H1• VAS normalised revenue growth of 12% • Copyright impact of $5.3m vs. prior comparative
period • EBITDA increased 5.1% excluding Copyright
Agency Limited (CAL) cost increase• Business line EBITDA does not include direct
service delivery costs – currently in head office
ANZ P&L - FY17 YEAR
$ M FY17 FY16 Variance %
Revenue
SaaS – Media Intelligence 87.5 86.7 1%
VAS 20.4 20.3 0%
Total SaaS/VAS 107.9 107.0 1%
ANZ EBITDA 46.6 49.4 (6%)
EBITDA Margin 43% 46%
Content Marketing Revenue* 8.6 12.4 (30%)
* See page 15

FY17 RESULTS PRESENTATION 23 August 201714
ASIA RESULTS SUMMARY
Key messages:• SaaS impacted by delay in rollout of Mediaportal in
Korea• Acquisitions including Boomerang (Vietnam), SNC
and Beyond (Korea) and New Point (Hong Kong) supported strong YoY VAS revenue growth
• EBITDA impacted by:o Higher data costs in North Asia predominantly
China and Koreao Bad debt clean up of $0.5m
• Business line EBITDA does not include direct service delivery costs – currently in head office
ASIA P&L - FY17 YEAR
$ M FY17 FY16 Variance %
Revenue
SaaS – Media Intelligence 15.8 15.3 3%
VAS 17.1 13.2 30%
Total SaaS/VAS 32.9 28.5 16%
ASIA EBITDA 6.6 6.9 (5%)
EBITDA Margin 20% 24%
Content Marketing Revenue* 5.7 8.3 (31%)
* See page 15

FY17 RESULTS PRESENTATION 23 August 201715
CONTENT MARKETING
Key messages:• Focus on key customers only• Targeted up/cross sell• Hard decisions have been taken on right sizing the
business
CONTENT MARKETING P&L - FY17 YEAR
$ M FY17 FY16 Variance %
Revenue
Content Marketing 14.4 20.6 (30%)
CM EBITDA (4.4) 3.6 (221%)
EBITDA Margin (31%) 18%

FY17 RESULTS PRESENTATION 23 August 201716
OPERATING EXPENSES
Key messages:• Staff costs: o Continued actions to move production to Manila
Content Hub from higher cost locations o Specific automation projects underway to
reduce overall staff cost• Copyright: o Cost increase due to CAL renegotiation o Operating cost increase ex CAL of 3.2%. o Stable outlook for FY18
• Other COS increase driven by Korea Acquisition content requirements
• ANZ headcount decrease of 46 offset by increases in Asia related to acquisitions
GROUP EXPENSES - FY17 YEAR
$ M FY17 FY16 Variance $M Variance %
Employee expenses 63.2 62.8 0.6 1%
Copyright 17.7 12.4 5.3 43%
Cost of sales 14.3 13.0 1.3 10%
Occupancy 5.7 5.4 0.3 5%
Software and support 4.1 3.5 0.6 16%
Communication and Marketing 3.8 3.2 0.6 17%
Other operating expenses 5.0 4.9 0.1 2%
Total operating expenses 113.7 105.0 8.7 8%
Headcount 1175 1195 (20.0) (2%)

FY17 RESULTS PRESENTATION 23 August 201717
FINANCIAL RESULTS OVERVIEWGROUP P&L CGU – FY17 YEAR
$M FY17 FY16 Variance $M Variance %
ANZ 116.5 119.3 (2.8) (2%)SaaS – Media Intelligence 87.5 86.7 0.8 1%VAS 20.4 20.3 0.1 0%Content Marketing 8.6 12.4 (3.7) (30%)
Asia 38.6 36.7 1.9 5%SaaS – Media Intelligence 15.8 15.3 0.5 3%VAS 17.1 13.2 3.9 30%Content Marketing 5.7 8.3 (2.6) (31%)
Revenue 155.1 156.0 (0.9) (1%)Expenses (113.7) (105.0) (8.7) (8%)EBITDA 41.5 51.0 (9.5) (19%)EBITDA margin 27% 33%
Depreciation and amortisation (5.7) (4.7) (1.1) (23%)Amortisation of acquired intangibles (10.4) (9.0) (1.4) (16%)Finance costs (2.8) (2.8) 0.0 (1%)
Profit/(loss) before tax 22.5 34.5 (12.0) (35%)Tax (5.7) (8.6) 2.9 34%Non-recurring items (net of tax) (30.2) (1.6) (28.5)Amortisation of acquired intangibles (Add back) 8.0 6.8 1.2 17%
NPATA (5.5) 31.1 (36.5) (118%)Underlying NPATA 24.7 32.6 (7.9) (24%)
Underlying earnings per share (cents) 12.4 16.3 (4.0) (24%)
Key messages:• Increase in Depreciation and
Amortisation driven by internal product development for STORIES, Mediaportal Recharge and the mobile app
• Amortisation increased due to Asia acquisitions
• Non-recurring items include King Content impairment, fair value adjustments

FY17 RESULTS PRESENTATION 23 August 201718
Strong operating cash performance as Isentia focuses on coreCASH FLOW$ M FY17 FY16Cash flows from operating activitiesReceipts from customers (inclusive of GST) 179.6 167.5Payments to suppliers and employees (inclusive of GST) (136.1) (127.5)Net interest (2.9) (2.6)Income taxes paid (6.9) (6.6)Net cash from operating activities 33.7 30.8Cash flows from investing activitiesPayment for purchase of business, net of cash acquired (29.2)Payment to vendors for prior year assets acquisition (7.0) (0.3)Payment for security deposits (0.4)Payment for property, plant and equipment (2.8) (2.4)Payments for intangibles (11.5) (6.7)Payment for purchase of asset acquisition (1.2) (1.2)Net cash used in investing activities (22.6) (40.3)Cash flows from financing activitiesProceeds from borrowing 9.0 38.5Repayment of borrowing (11.5)Dividends paid (15.1) (15.0)Net cash from (used in) financing activities (6.1) 12.0Net increase in cash and cash equivalents 5.1 2.4Cash and cash equivalents at the beginning of the financial year 8.1 5.7Cash and cash equivalents at the end of the financial year 13.3 8.1
FY17 RESULTS PRESENTATION 23 August 201719
FY18 OUTLOOK
• Management intend to provide guidance at the Annual General Meeting scheduled for late November 2017

isentia.com
Q & A

isentia.com
APPENDIX

FY17 RESULTS PRESENTATION 23 August 201722
BALANCE SHEET AND CAPITAL STRUCTURE$ M FY17 FY16Current assetsCash and cash equivalents 13.3 8.1Trade and other receivables 31.2 40.0Other 3.1 2.1Total current assets 47.6 50.3Non-current assetsProperty, plant and equipment 4.7 3.9Intangibles 153.0 196.3Other 5.4 8.1Total non-current assets 163.0 208.4Current LiabilitiesTrade and other payables 19.3 19.3Contingent consideration 3.0 7.0Borrowings - 55.9Other 5.9 9.3Total current liabilities 28.2 91.4Non-current liabilitiesBorrowings 64.9 -Contingent consideration 5.0 21.7Other 17.8 19.9Total non-current liabilities 87.7 41.6Total equity 94.7 125.7
$ M FACILITYCOMMITMENT DRAWDOWN
Facility A 65.0 65.0
Facility B 10.0 0.0
Total debt 75.0 65.0
Cash and cash equivalents and prepayments 13.3
Net debt 51.7
Leverage ratio 1.25x

FY17 RESULTS PRESENTATION 23 August 201723
Reported NPAT to Underlying NPATARECONCILIATION
ISD FY17 Reported NPAT to underlying NPATA reconciliation $M
NPAT (13.5)
Add: Amortisation of customer relationships and contracts 8.3
Amortisation of acquired software 2.1
Net of tax on amortisation of customer relationship/contracts and acquired software (2.4)
NPATA (5.5)
Add: Impairment of assets 39.4
Less: Net gain recognised on reversal of contingent consideration (13.8)
Add: Non-recurring items including acquisition costs 4.6
Underlying NPATA 24.7

This presentation contains general information about the activities of Isentia’s Holdings Pty Limited (ACN 144 573 795) (Isentia or Company) which is current as at 23 August 2017. It is in summary form and does not purport to be complete. It presents financial information on both a statutory basis (prepared in accordance with Australian accounting standards which comply with the International Financial Reporting Standards (IFRS) as well as information provided on a non-IFRS basis. This presentation is not a recommendation or advice in relation to Isentia or any product or service offered by Isentia’s subsidiaries. It is not intended to be relied upon as advice to investors or potential investors, and does not contain all information relevant or necessary for an investment decision. It should be read in conjunction with Isentia’s other periodic and continuous disclosure announcements filed with the Australian Securities Exchange, and in particular the Full Year Results for the period to 30 June 2017. These are also available at www.isentia.com.
No representation or warranty, express or implied, is made as to the accuracy, adequacy or reliability of any statements, estimates or opinions or other information contained in this presentation. To the maximum extent permitted by law, Isentia, its subsidiaries and their respective directors, officers, employees and agents disclaim all liability and responsibility for any direct or indirect loss or damage which may be suffered by any recipient through use of or reliance on anything contained in or omitted with this presentation. No recommendation is made as to how investors should make an investment decision. Investors must rely on their own examination of Isentia, including the merits and risks involved. Investors should consult with their own professional advisors in connection with any acquisition or securities.
The information in this presentation is for general information only. To the extent that certain statements contained in this presentation may constitute “forward-looking statements” or statements about “future matters”, the information reflects Isentia’s intent, belief, or expectations at the date of this presentation. Subject to any continuing obligations under applicable law or any relevant listing rules of the Australian Securities Exchange, Isentia disclaims any obligation or undertakings to disseminate any updates or revisions to this information over time. Any forward-looking statements, including
projections, guidance on future revenues, earnings and estimates, are provided as a general guide only and should not be relied upon as an indication or guarantee of future performance. Forward-looking statements involve known and unknown risks, uncertainties and other factors that may cause Isentia’s actual results, performance or achievements to differ materially from any future results, performance or achievements expressed or implied by these forward-looking statements. Any forward-looking statements, opinions and estimates in this presentation are based on assumptions and contingencies which are subject to change without notice, as are statements about market and industry trends, which are based on interpretations of current market conditions. For example, the factors that are likely to affect the results of Isentia include, but are not limited to, general economic conditions in Australia and Asia, exchange rates, competition in the markets in which Isentia will operate and the inherent regulatory risks in the business of Isentia. Neither Isentia, nor any other person, gives any representation, assurance or guarantee that the occurrence of the events expressed or implied in any forward-looking statements in this presentation will actually occur. In addition, please note that past performance is no guarantee or indication of future performance.
This presentation does not constitute an offer to issue or sell, or solicitation of an offer to buy, any securities or other financial products in any jurisdiction. The distribution of this presentation outside Australia may be restricted by law. Any recipient of this presentation outside Australia must seek advice on and observe any such restrictions. This presentation may not be reproduced or published, in whole or in part, for any purpose without the prior written permission of Isentia.
All amounts are in Australian dollars.
All references starting with FY refer to the financial period ended 30 June. For example, FY17 refers to
the period ended 30 June 2017.
FY17 RESULTS PRESENTATION 23 August 2017
