2/24/21 overview of current situation (2/24/21 1024) …
TRANSCRIPT
2/24/21
\\ochca.com\hcashares\AOC\1 REAL EVENTS\COVID -19\3) MHOAC\DAILY POLICY GROUP Page 1 of 14
OVERVIEW OF CURRENT SITUATION (2/24/21 1024) Source: Johns Hopkins University & Medicine https://coronavirus.jhu.edu/map.html
Cases / Deaths
Worldwide: 112,314,455 / 2,490,087
Nationwide: 28,276,238 / 503,529
California: 3,543,340 / 49,037
Orange Co: 245,135 / 3,848 Source: Orange County COVID-19 Case Counts & Testing Figures *Reporting 2/23/21
ORANGE COUNTY PUBLIC HEALTH (as of 2/23/21 1023)
Orange County COVID-19 Summary* click for full details
Wed
2/17/21
Thu
2/18/21
Fri
2/19/21
Sat
2/20/21
Sun
2/21/21
Mon
2/22/21
Tue
2/23/21
Cases Reported to Date 243,329 243,665 243,989 244,380 244,632 244,885 245,135
Deaths Reported to Date 3,644 3,685 3,726 3,770 3,810 3,848 3,848
Tests Reported Today 8,591 13,950 19,987 17,530 12,110 5,125 12,783
Cumulative Tests to Date 2,899,182 2,913,132 2,933,119 2,950,649 2,962,759 2,967,884 2,980,667
*Data posted is always preliminary & subject to change. More information may become available as
individual case investigations are completed. LOCAL DATA MAY BE DIFFERENT FROM THE
STATE WEBSITE DATA.
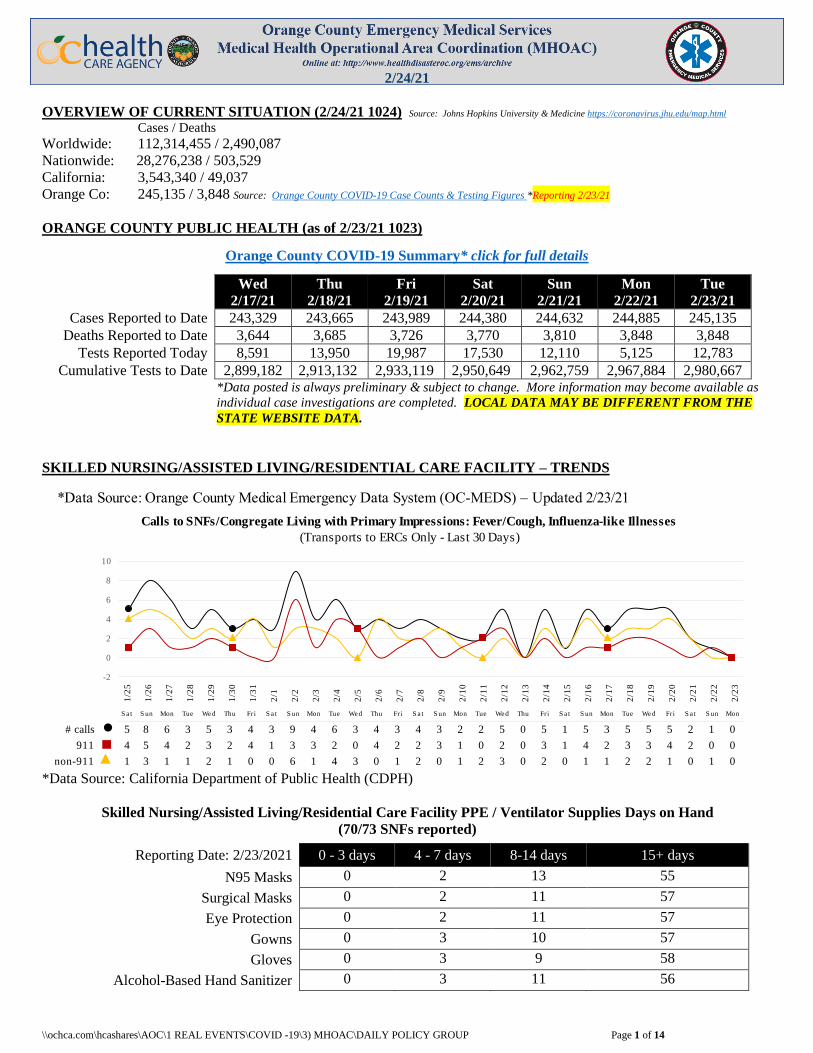
SKILLED NURSING/ASSISTED LIVING/RESIDENTIAL CARE FACILITY – TRENDS
*Data Source: California Department of Public Health (CDPH)
Skilled Nursing/Assisted Living/Residential Care Facility PPE / Ventilator Supplies Days on Hand
(70/73 SNFs reported)
Reporting Date: 2/23/2021 0 - 3 days 4 - 7 days 8-14 days 15+ days
N95 Masks 0 2 13 55
Surgical Masks 0 2 11 57
Eye Protection 0 2 11 57
Gowns 0 3 10 57
Gloves 0 3 9 58
Alcohol-Based Hand Sanitizer 0 3 11 56
S a t S un Mon Tue Wed Thu Fri S a t S un Mon Tue Wed Thu Fri S a t S un Mon Tue Wed Thu Fri S a t S un Mon Tue Wed Fri S a t S un Mon
● 5 8 6 3 5 3 4 3 9 4 6 3 4 3 4 3 2 2 5 0 5 1 5 3 5 5 5 2 1 0
■ 4 5 4 2 3 2 4 1 3 3 2 0 4 2 2 3 1 0 2 0 3 1 4 2 3 3 4 2 0 0
▲ 1 3 1 1 2 1 0 0 6 1 4 3 0 1 2 0 1 2 3 0 2 0 1 1 2 2 1 0 1 0
2/1
3
2/2
0
2/2
1
2/2
2
2/2
3
2/1
5
2/1
6
2/1
7
2/1
8
2/1
9
non-911
1/2
5
1/2
6
# calls
911
*Data Source: Orange County Medical Emergency Data System (OC-MEDS) – Updated 2/23/21
Calls to SNFs/Congregate Living with Primary Impressions: Fever/Cough, Influenza-like Illnesses
(Transports to ERCs Only - Last 30 Days)
2/1
2/2
2/3
2/4
2/5
2/6
2/7
2/8
2/1
4
2/9
2/1
0
2/1
1
2/1
2
1/2
9
1/3
0
1/3
1
1/2
7
1/2
8
-2
0
2
4
6
8
10
2/24/21
\\ochca.com\hcashares\AOC\1 REAL EVENTS\COVID -19\3) MHOAC\DAILY POLICY GROUP Page 2 of 14
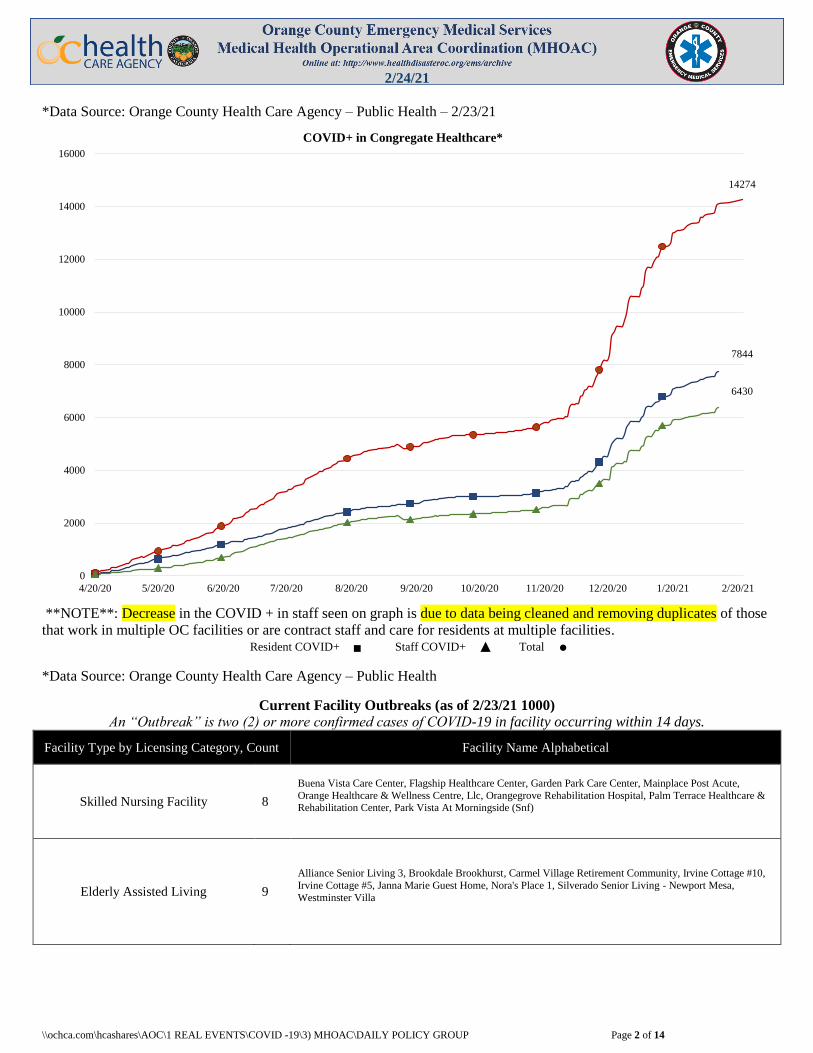
*Data Source: Orange County Health Care Agency – Public Health – 2/23/21
**NOTE**: Decrease in the COVID + in staff seen on graph is due to data being cleaned and removing duplicates of those
that work in multiple OC facilities or are contract staff and care for residents at multiple facilities. Resident COVID+ ■ Staff COVID+ ▲ Total ●
*Data Source: Orange County Health Care Agency – Public Health
Current Facility Outbreaks (as of 2/23/21 1000)
An “Outbreak” is two (2) or more confirmed cases of COVID-19 in facility occurring within 14 days.
Facility Type by Licensing Category, Count Facility Name Alphabetical
Skilled Nursing Facility 8
Buena Vista Care Center, Flagship Healthcare Center, Garden Park Care Center, Mainplace Post Acute,
Orange Healthcare & Wellness Centre, Llc, Orangegrove Rehabilitation Hospital, Palm Terrace Healthcare & Rehabilitation Center, Park Vista At Morningside (Snf)
Elderly Assisted Living 9
Alliance Senior Living 3, Brookdale Brookhurst, Carmel Village Retirement Community, Irvine Cottage #10,
Irvine Cottage #5, Janna Marie Guest Home, Nora's Place 1, Silverado Senior Living - Newport Mesa,
Westminster Villa
6430
7844
14274
0
2000
4000
6000
8000
10000
12000
14000
16000
4/20/20 5/20/20 6/20/20 7/20/20 8/20/20 9/20/20 10/20/20 11/20/20 12/20/20 1/20/21 2/20/21
COVID+ in Congregate Healthcare*
2/24/21
\\ochca.com\hcashares\AOC\1 REAL EVENTS\COVID -19\3) MHOAC\DAILY POLICY GROUP Page 3 of 14
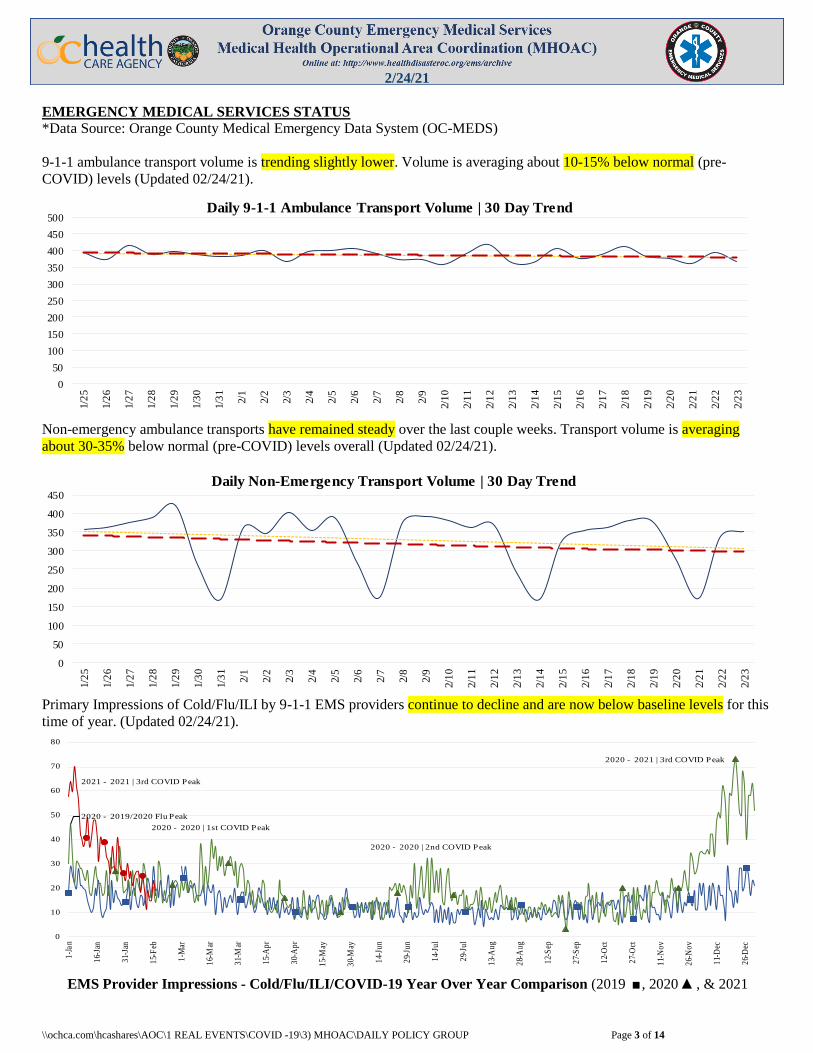
EMERGENCY MEDICAL SERVICES STATUS
*Data Source: Orange County Medical Emergency Data System (OC-MEDS)
9-1-1 ambulance transport volume is trending slightly lower. Volume is averaging about 10-15% below normal (pre-
COVID) levels (Updated 02/24/21).
Non-emergency ambulance transports have remained steady over the last couple weeks. Transport volume is averaging
about 30-35% below normal (pre-COVID) levels overall (Updated 02/24/21).
Primary Impressions of Cold/Flu/ILI by 9-1-1 EMS providers continue to decline and are now below baseline levels for this
time of year. (Updated 02/24/21).
EMS Provider Impressions - Cold/Flu/ILI/COVID-19 Year Over Year Comparison (2019 ■, 2020 ▲, & 2021
Daily 9-1-1 Ambulance Transport Volume | 30 Day Trend
0
50
100
150
200
250
300
350
400
450
500
1/2
5
1/2
6
1/2
7
1/2
8
1/2
9
1/3
0
1/3
1
2/1
2/2
2/3
2/4
2/5
2/6
2/7
2/8
2/9
2/1
0
2/1
1
2/1
2
2/1
3
2/1
4
2/1
5
2/1
6
2/1
7
2/1
8
2/1
9
2/2
0
2/2
1
2/2
2
2/2
3
Daily Non-Emergency Transport Volume | 30 Day Trend
0
50
100
150
200
250
300
350
400
450
1/2
5
1/2
6
1/2
7
1/2
8
1/2
9
1/3
0
1/3
1
2/1
2/2
2/3
2/4
2/5
2/6
2/7
2/8
2/9
2/1
0
2/1
1
2/1
2
2/1
3
2/1
4
2/1
5
2/1
6
2/1
7
2/1
8
2/1
9
2/2
0
2/2
1
2/2
2
2/2
3
2020 - 2019/2020 Flu Peak
2020 - 2020 | 1st COVID Peak
2020 - 2020 | 2nd COVID Peak
2020 - 2021 | 3rd COVID Peak
2021 - 2021 | 3rd COVID Peak
0
10
20
30
40
50
60
70
80
1-J
an
16-
Jan
31-
Jan
15-
Feb
1-M
ar
16-
Mar
31-
Mar
15-
Ap
r
30-
Ap
r
15-
May
30-
May
14-
Jun
29-
Jun
14-
Jul
29-
Jul
13-
Au
g
28-
Au
g
12-
Sep
27-
Sep
12-
Oct
27-
Oct
11-
No
v
26-
No
v
11-
Dec
26-
Dec
2/24/21
\\ochca.com\hcashares\AOC\1 REAL EVENTS\COVID -19\3) MHOAC\DAILY POLICY GROUP Page 4 of 14
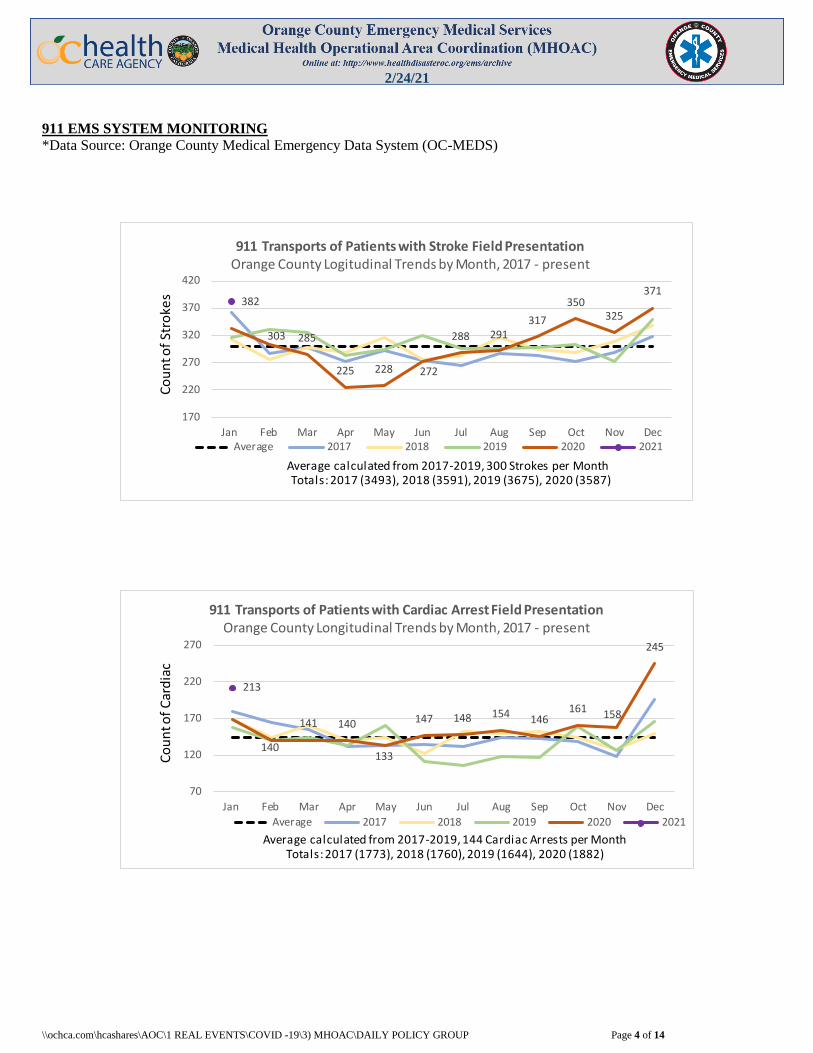
911 EMS SYSTEM MONITORING
*Data Source: Orange County Medical Emergency Data System (OC-MEDS)
303 285
225 228 272
288 291317
350325
371382
170
220
270
320
370
420
Jan Feb Mar Apr May Jun Jul Aug Sep Oct Nov Dec
911 Transports of Patients with Stroke Field Presentation Orange County Logitudinal Trends by Month, 2017 - present
Average 2017 2018 2019 2020 2021
Co
un
t of
Stro
kes
Average calculated from 2017-2019, 300 Strokes per MonthTotals: 2017 (3493), 2018 (3591), 2019 (3675), 2020 (3587)
140
141 140
133
147 148 154 146161 158
245
213
70
120
170
220
270
Jan Feb Mar Apr May Jun Jul Aug Sep Oct Nov Dec
911 Transports of Patients with Cardiac Arrest Field PresentationOrange County Longitudinal Trends by Month, 2017 - present
Average 2017 2018 2019 2020 2021
Co
un
t of
Car
dia
c
Average calculated from 2017-2019, 144 Cardiac Arrests per MonthTotals: 2017 (1773), 2018 (1760), 2019 (1644), 2020 (1882)
2/24/21
\\ochca.com\hcashares\AOC\1 REAL EVENTS\COVID -19\3) MHOAC\DAILY POLICY GROUP Page 5 of 14
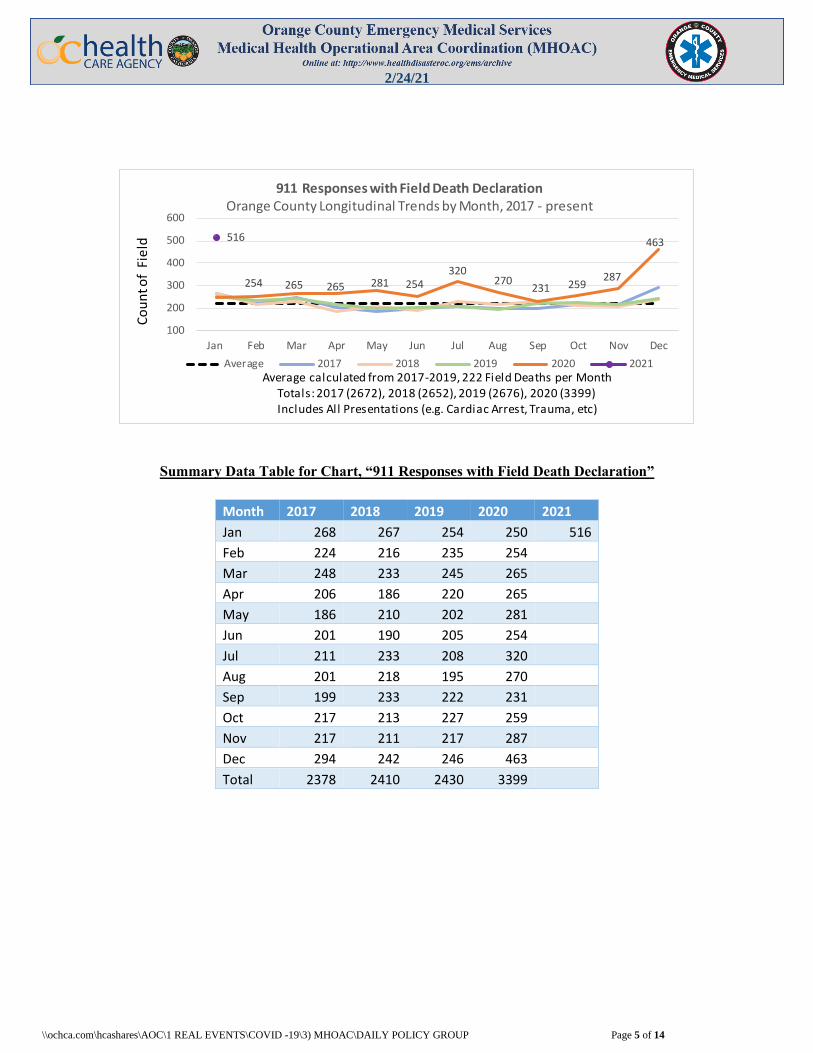
Summary Data Table for Chart, “911 Responses with Field Death Declaration”
Month 2017 2018 2019 2020 2021
Jan 268 267 254 250 516
Feb 224 216 235 254 Mar 248 233 245 265 Apr 206 186 220 265 May 186 210 202 281 Jun 201 190 205 254 Jul 211 233 208 320 Aug 201 218 195 270 Sep 199 233 222 231 Oct 217 213 227 259 Nov 217 211 217 287 Dec 294 242 246 463 Total 2378 2410 2430 3399
254 265 265 281 254320
270231 259
287
463516
100
200
300
400
500
600
Jan Feb Mar Apr May Jun Jul Aug Sep Oct Nov Dec
911 Responses with Field Death DeclarationOrange County Longitudinal Trends by Month, 2017 - present
Average 2017 2018 2019 2020 2021
Co
un
t of
Fie
ld
Average calculated from 2017-2019, 222 Field Deaths per MonthTotals: 2017 (2672), 2018 (2652), 2019 (2676), 2020 (3399)Includes All Presentations (e.g. Cardiac Arrest, Trauma, etc)
2/24/21
\\ochca.com\hcashares\AOC\1 REAL EVENTS\COVID -19\3) MHOAC\DAILY POLICY GROUP Page 6 of 14
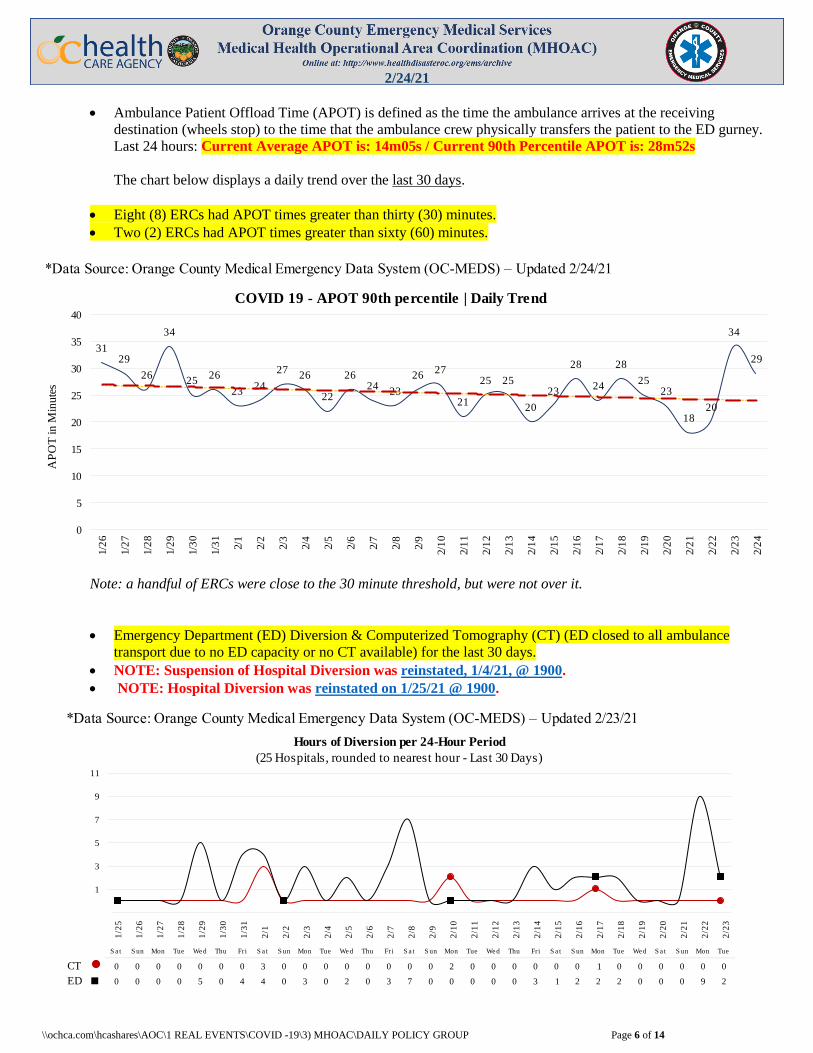
Ambulance Patient Offload Time (APOT) is defined as the time the ambulance arrives at the receiving
destination (wheels stop) to the time that the ambulance crew physically transfers the patient to the ED gurney.
Last 24 hours: Current Average APOT is: 14m05s / Current 90th Percentile APOT is: 28m52s
The chart below displays a daily trend over the last 30 days.
Eight (8) ERCs had APOT times greater than thirty (30) minutes.
Two (2) ERCs had APOT times greater than sixty (60) minutes.
Note: a handful of ERCs were close to the 30 minute threshold, but were not over it.
Emergency Department (ED) Diversion & Computerized Tomography (CT) (ED closed to all ambulance
transport due to no ED capacity or no CT available) for the last 30 days.
NOTE: Suspension of Hospital Diversion was reinstated, 1/4/21, @ 1900.
NOTE: Hospital Diversion was reinstated on 1/25/21 @ 1900.
*Data Source: Orange County Medical Emergency Data System (OC-MEDS) – Updated 2/24/21
COVID 19 - APOT 90th percentile | Daily Trend
AP
OT
in
Min
ute
s
3129
26
34
2526
2324
2726
22
2624
23
2627
21
25 25
20
23
28
24
28
2523
1820
34
29
0
5
10
15
20
25
30
35
40
1/2
6
1/2
7
1/2
8
1/2
9
1/3
0
1/3
1
2/1
2/2
2/3
2/4
2/5
2/6
2/7
2/8
2/9
2/1
0
2/1
1
2/1
2
2/1
3
2/1
4
2/1
5
2/1
6
2/1
7
2/1
8
2/1
9
2/2
0
2/2
1
2/2
2
2/2
3
2/2
4
S a t S un Mon Tue Wed Thu Fri S a t S un Mon Tue Wed Thu Fri S a t S un Mon Tue Wed Thu Fri S a t S un Mon Tue Wed S a t S un Mon Tue
CT ● 0 0 0 0 0 0 0 3 0 0 0 0 0 0 0 0 2 0 0 0 0 0 0 1 0 0 0 0 0 0
ED ■ 0 0 0 0 5 0 4 4 0 3 0 2 0 3 7 0 0 0 0 0 3 1 2 2 2 0 0 0 9 2
*Data Source: Orange County Medical Emergency Data System (OC-MEDS) – Updated 2/23/21
2/1
1
(25 Hospitals, rounded to nearest hour - Last 30 Days)
2/2
1
2/2
2
2/1
3
2/1
4
2/1
5
2/1
6
2/1
7
2/7
2/8
2/5
2/1
9
2/2
0
2/9
2/1
0
2/6
2/1
2
2/2
3
2/1
8
Hours of Diversion per 24-Hour Period
1/2
5
1/2
6
1/2
7
1/2
8
1/2
9
1/3
0
1/3
1
2/1
2/2
2/3
2/4
-1
1
3
5
7
9
11
2/24/21
\\ochca.com\hcashares\AOC\1 REAL EVENTS\COVID -19\3) MHOAC\DAILY POLICY GROUP Page 7 of 14
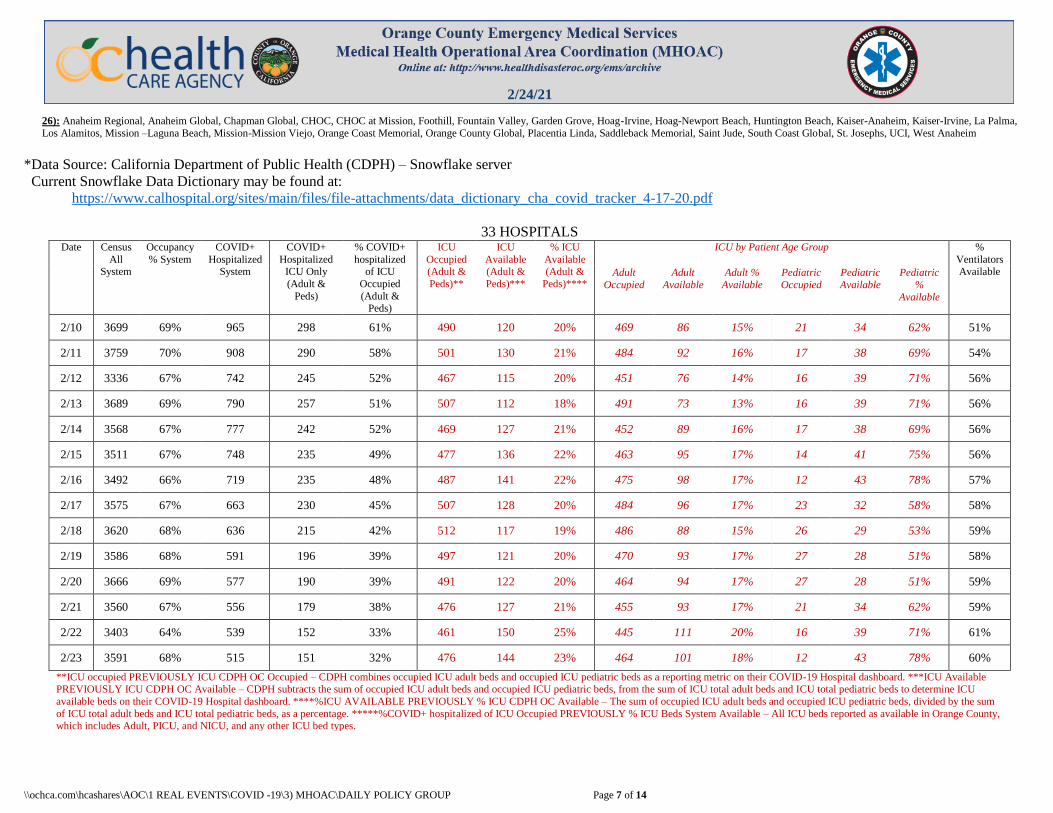
26): Anaheim Regional, Anaheim Global, Chapman Global, CHOC, CHOC at Mission, Foothill, Fountain Valley, Garden Grove, Hoag-Irvine, Hoag-Newport Beach, Huntington Beach, Kaiser-Anaheim, Kaiser-Irvine, La Palma,
Los Alamitos, Mission –Laguna Beach, Mission-Mission Viejo, Orange Coast Memorial, Orange County Global, Placentia Linda, Saddleback Memorial, Saint Jude, South Coast Global, St. Josephs, UCI, West Anaheim
*Data Source: California Department of Public Health (CDPH) – Snowflake server
Current Snowflake Data Dictionary may be found at:
https://www.calhospital.org/sites/main/files/file-attachments/data_dictionary_cha_covid_tracker_4-17-20.pdf
33 HOSPITALS Date Census
All System
Occupancy
% System
COVID+
Hospitalized System
COVID+
Hospitalized ICU Only
(Adult &
Peds)
% COVID+
hospitalized of ICU
Occupied
(Adult & Peds)
ICU
Occupied (Adult &
Peds)**
ICU
Available (Adult &
Peds)***
% ICU
Available (Adult &
Peds)****
ICU by Patient Age Group %
Ventilators Available Adult
Occupied
Adult
Available
Adult %
Available
Pediatric
Occupied
Pediatric
Available
Pediatric
%
Available
2/10 3699 69% 965 298 61% 490 120 20% 469 86 15% 21 34 62% 51%
2/11 3759 70% 908 290 58% 501 130 21% 484 92 16% 17 38 69% 54%
2/12 3336 67% 742 245 52% 467 115 20% 451 76 14% 16 39 71% 56%
2/13 3689 69% 790 257 51% 507 112 18% 491 73 13% 16 39 71% 56%
2/14 3568 67% 777 242 52% 469 127 21% 452 89 16% 17 38 69% 56%
2/15 3511 67% 748 235 49% 477 136 22% 463 95 17% 14 41 75% 56%
2/16 3492 66% 719 235 48% 487 141 22% 475 98 17% 12 43 78% 57%
2/17 3575 67% 663 230 45% 507 128 20% 484 96 17% 23 32 58% 58%
2/18 3620 68% 636 215 42% 512 117 19% 486 88 15% 26 29 53% 59%
2/19 3586 68% 591 196 39% 497 121 20% 470 93 17% 27 28 51% 58%
2/20 3666 69% 577 190 39% 491 122 20% 464 94 17% 27 28 51% 59%
2/21 3560 67% 556 179 38% 476 127 21% 455 93 17% 21 34 62% 59%
2/22 3403 64% 539 152 33% 461 150 25% 445 111 20% 16 39 71% 61%
2/23 3591 68% 515 151 32% 476 144 23% 464 101 18% 12 43 78% 60%
**ICU occupied PREVIOUSLY ICU CDPH OC Occupied – CDPH combines occupied ICU adult beds and occupied ICU pediatric beds as a reporting metric on their COVID-19 Hospital dashboard. ***ICU Available PREVIOUSLY ICU CDPH OC Available – CDPH subtracts the sum of occupied ICU adult beds and occupied ICU pediatric beds, from the sum of ICU total adult beds and ICU total pediatric beds to determine ICU
available beds on their COVID-19 Hospital dashboard. ****%ICU AVAILABLE PREVIOUSLY % ICU CDPH OC Available – The sum of occupied ICU adult beds and occupied ICU pediatric beds, divided by the sum
of ICU total adult beds and ICU total pediatric beds, as a percentage. *****%COVID+ hospitalized of ICU Occupied PREVIOUSLY % ICU Beds System Available – All ICU beds reported as available in Orange County, which includes Adult, PICU, and NICU, and any other ICU bed types.
2/24/21
\\ochca.com\hcashares\AOC\1 REAL EVENTS\COVID -19\3) MHOAC\DAILY POLICY GROUP Page 8 of 14
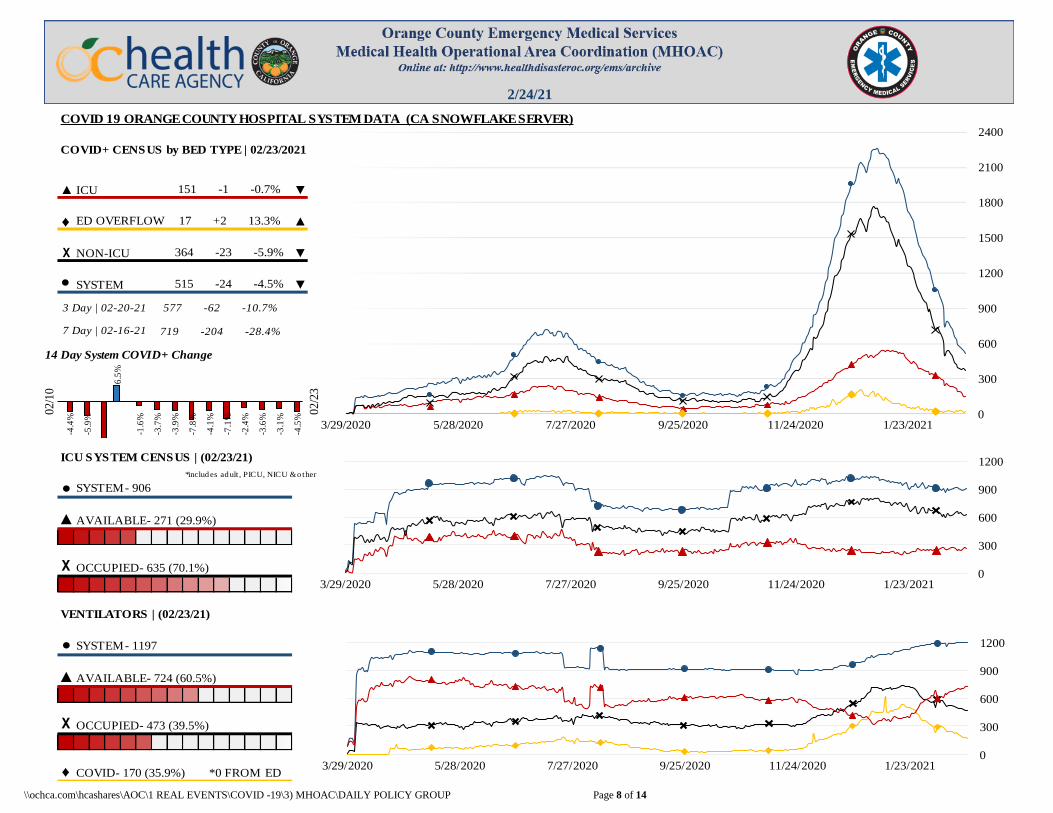
▲ ICU ▼
♦ ▲
Х NON-ICU ▼
● SYSTEM ▼
▲
ICU SYSTEM CENSUS | (02/23/21)
*includes adult , PICU, NICU & o ther
SYSTEM- 906
VENTILATORS | (02/23/21)
●
▲ AVAILABLE- 271 (29.9%)
02/2
3
515 -24 -4.5%
3 Day | 02-20-21 577 -62 -10.7%
02/1
0
7 Day | 02-16-21 719 -204 -28.4%
14 Day System COVID+ Change
Х
♦
SYSTEM- 1197
AVAILABLE- 724 (60.5%)
OCCUPIED- 473 (39.5%)
●
▲
Х OCCUPIED- 635 (70.1%)
COVID- 170 (35.9%) *0 FROM ED
COVID 19 ORANGE COUNTY HOSPITAL SYSTEM DATA (CA SNOWFLAKE SERVER)
COVID+ CENSUS by BED TYPE | 02/23/2021
364 -23 -5.9%
151 -1 -0.7%
ED OVERFLOW 17 +2 13.3%
0
300
600
900
1200
1500
1800
2100
2400
3/29/2020 5/28/2020 7/27/2020 9/25/2020 11/24/2020 1/23/2021
6.5
%
-4.4
%
-5.9
%
-1.6
%
-3.7
%
-3.9
%
-7.8
%
-4.1
%
-7.1
%
-2.4
%
-3.6
%
-3.1
%
-4.5
%
0
300
600
900
1200
3/29/2020 5/28/2020 7/27/2020 9/25/2020 11/24/2020 1/23/2021
0
300
600
900
1200
3/29/2020 5/28/2020 7/27/2020 9/25/2020 11/24/2020 1/23/2021
2/24/21
\\ochca.com\hcashares\AOC\1 REAL EVENTS\COVID -19\3) MHOAC\DAILY POLICY GROUP Page 9 of 14
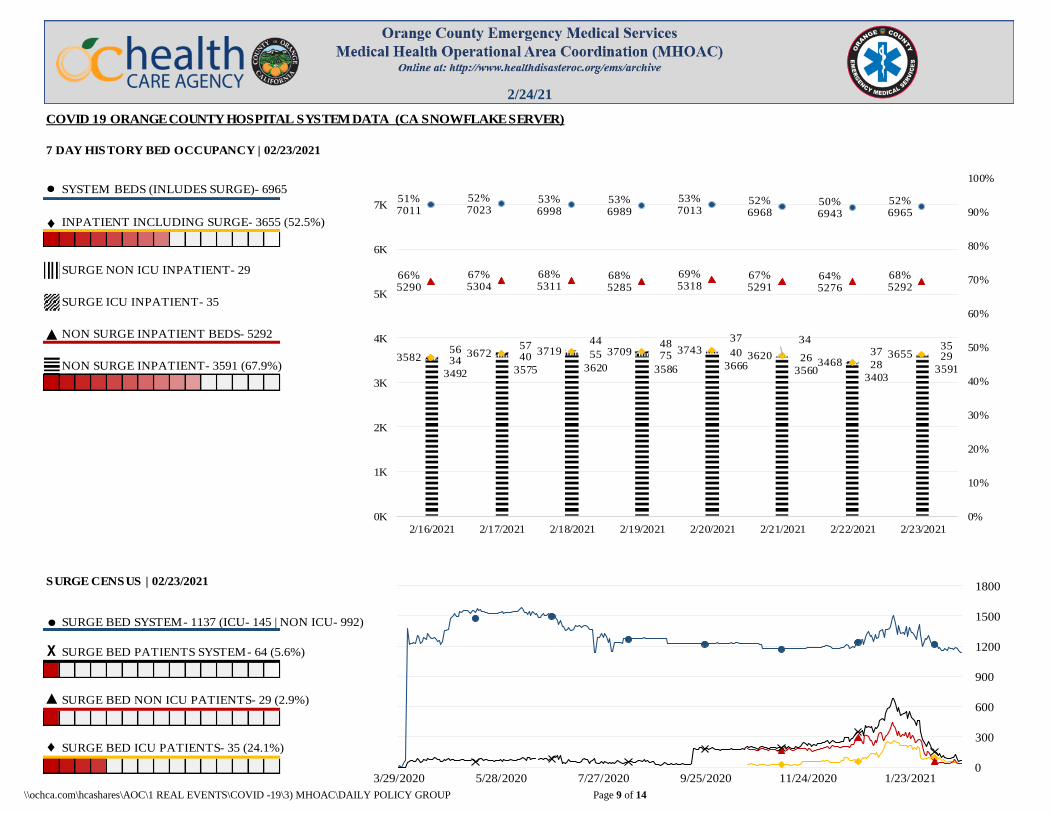
● SYSTEM BEDS (INLUDES SURGE)- 6965
♦
▲
● SURGE BED SYSTEM- 1137 (ICU- 145 | NON ICU- 992)
▲ SURGE BED NON ICU PATIENTS- 29 (2.9%)
♦ SURGE BED ICU PATIENTS- 35 (24.1%)
SURGE CENSUS | 02/23/2021
Х SURGE BED PATIENTS SYSTEM- 64 (5.6%)
INPATIENT INCLUDING SURGE- 3655 (52.5%)
NON SURGE INPATIENT BEDS- 5292
NON SURGE INPATIENT- 3591 (67.9%)
SURGE NON ICU INPATIENT- 29
SURGE ICU INPATIENT- 35
COVID 19 ORANGE COUNTY HOSPITAL SYSTEM DATA (CA SNOWFLAKE SERVER)
7 DAY HISTORY BED OCCUPANCY | 02/23/2021
3492 3575 3620 3586 3666 35603403
359134 40 55 75 40
2628
2956 57 44 48
37 3437
353582 3672 3719 3709 3743
36203468
3655
66%5290
67%5304
68%5311
68%5285
69%5318
67%5291
64%5276
68%5292
51%7011
52%7023
53%6998
53%6989
53%7013
52%6968
50%6943
52%6965
0%
10%
20%
30%
40%
50%
60%
70%
80%
90%
100%
0K
1K
2K
3K
4K
5K
6K
7K
2/16/2021 2/17/2021 2/18/2021 2/19/2021 2/20/2021 2/21/2021 2/22/2021 2/23/2021
0
300
600
900
1200
1500
1800
3/29/2020 5/28/2020 7/27/2020 9/25/2020 11/24/2020 1/23/2021
2/24/21
\\ochca.com\hcashares\AOC\1 REAL EVENTS\COVID -19\3) MHOAC\DAILY POLICY GROUP Page 10 of 14
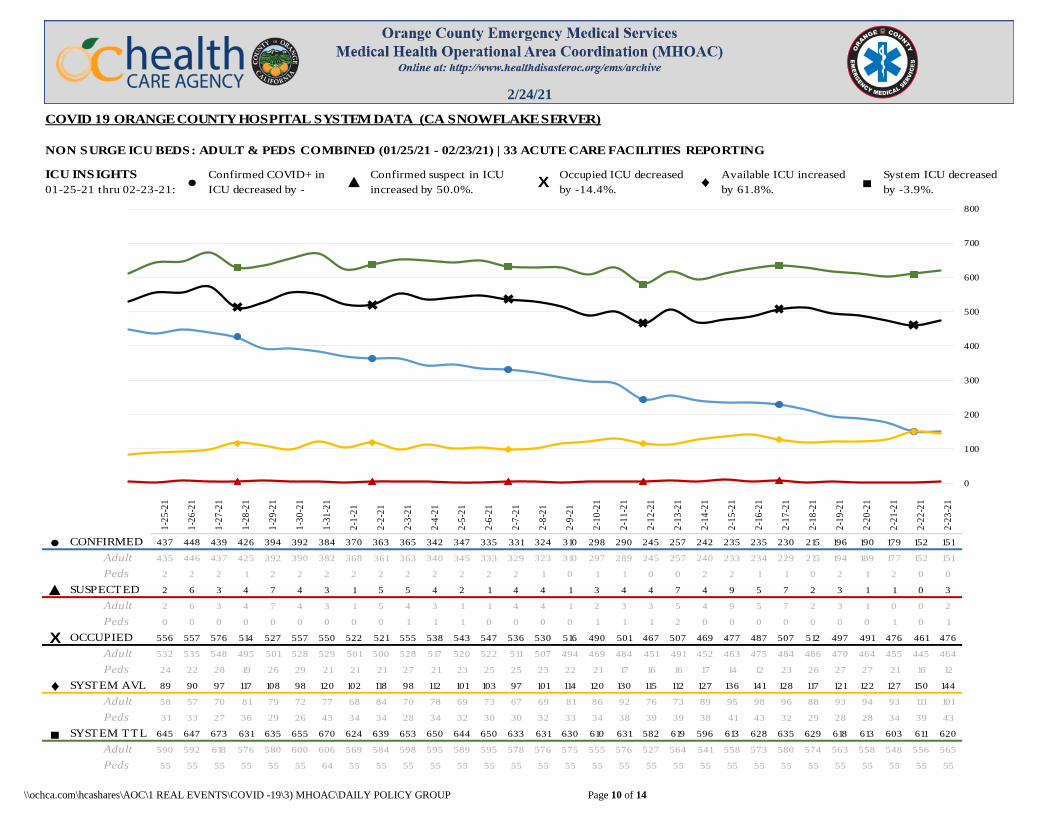
● CONFIRMED 437 448 439 426 394 392 384 370 363 365 342 347 335 331 324 310 298 290 245 257 242 235 235 230 215 196 190 179 152 151
Adult 435 446 437 425 392 390 382 368 361 363 340 345 333 329 323 310 297 289 245 257 240 233 234 229 215 194 189 177 152 151
Peds 2 2 2 1 2 2 2 2 2 2 2 2 2 2 1 0 1 1 0 0 2 2 1 1 0 2 1 2 0 0
▲ SUSPECTED 2 6 3 4 7 4 3 1 5 5 4 2 1 4 4 1 3 4 4 7 4 9 5 7 2 3 1 1 0 3
Adult 2 6 3 4 7 4 3 1 5 4 3 1 1 4 4 1 2 3 3 5 4 9 5 7 2 3 1 0 0 2
Peds 0 0 0 0 0 0 0 0 0 1 1 1 0 0 0 0 1 1 1 2 0 0 0 0 0 0 0 1 0 1
X OCCUPIED 556 557 576 514 527 557 550 522 521 555 538 543 547 536 530 516 490 501 467 507 469 477 487 507 512 497 491 476 461 476
Adult 532 535 548 495 501 528 529 501 500 528 517 520 522 511 507 494 469 484 451 491 452 463 475 484 486 470 464 455 445 464
Peds 24 22 28 19 26 29 21 21 21 27 21 23 25 25 23 22 21 17 16 16 17 14 12 23 26 27 27 21 16 12
♦ SYSTEM AVL 89 90 97 117 108 98 120 102 118 98 112 101 103 97 101 114 120 130 115 112 127 136 141 128 117 121 122 127 150 144
Adult 58 57 70 81 79 72 77 68 84 70 78 69 73 67 69 81 86 92 76 73 89 95 98 96 88 93 94 93 111 101
Peds 31 33 27 36 29 26 43 34 34 28 34 32 30 30 32 33 34 38 39 39 38 41 43 32 29 28 28 34 39 43
■ SYSTEM TTL 645 647 673 631 635 655 670 624 639 653 650 644 650 633 631 630 610 631 582 619 596 613 628 635 629 618 613 603 611 620
Adult 590 592 618 576 580 600 606 569 584 598 595 589 595 578 576 575 555 576 527 564 541 558 573 580 574 563 558 548 556 565
Peds 55 55 55 55 55 55 64 55 55 55 55 55 55 55 55 55 55 55 55 55 55 55 55 55 55 55 55 55 55 55
1-2
8-2
1
1-2
9-2
1
1-3
0-2
1
1-3
1-2
1
2-1
-21
1-2
5-2
1
1-2
6-2
1
1-2
7-2
1
COVID 19 ORANGE COUNTY HOSPITAL SYSTEM DATA (CA SNOWFLAKE SERVER)
NON SURGE ICU BEDS: ADULT & PEDS COMBINED (01/25/21 - 02/23/21) | 33 ACUTE CARE FACILITIES REPORTING
ICU INSIGHTS
01-25-21 thru 02-23-21:
2-2
3-2
1
2-2
2-2
1
2-1
7-2
1
2-1
8-2
1
2-1
9-2
1
2-2
0-2
1
2-2
1-2
1
2-1
2-2
1
2-1
3-2
1
2-1
4-2
1
2-1
5-2
1
2-1
6-2
1
2-7
-21
2-8
-21
2-9
-21
2-1
0-2
1
2-1
1-2
1
2-2
-21
2-3
-21
2-4
-21
2-5
-21
2-6
-21
System ICU decreased
by -3.9%.● ▲ X ♦ ■
Confirmed COVID+ in
ICU decreased by -
65.4%.
Available ICU increased
by 61.8%.
Confirmed suspect in ICU
increased by 50.0%.
Occupied ICU decreased
by -14.4%.
0
100
200
300
400
500
600
700
800
2/24/21
\\ochca.com\hcashares\AOC\1 REAL EVENTS\COVID -19\3) MHOAC\DAILY POLICY GROUP Page 11 of 14
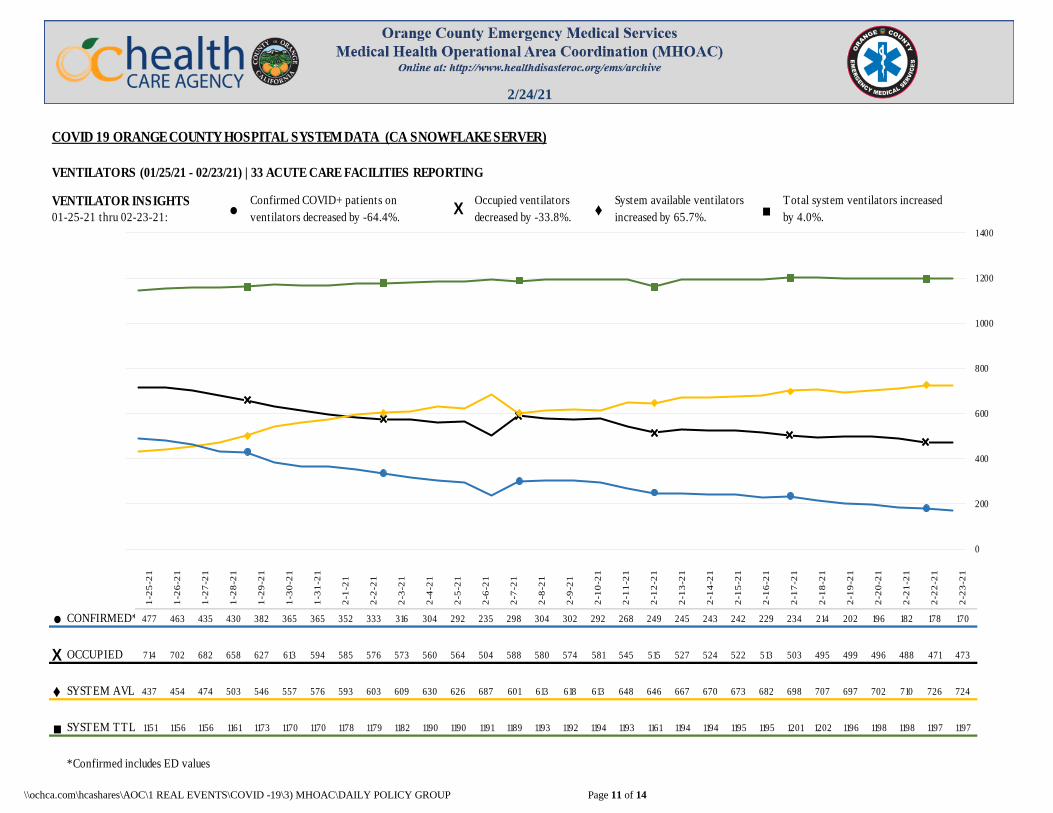
VENTILATOR INSIGHTS
01-25-21 thru 02-23-21:
● CONFIRMED* 477 463 435 430 382 365 365 352 333 316 304 292 235 298 304 302 292 268 249 245 243 242 229 234 214 202 196 182 178 170
X OCCUPIED 714 702 682 658 627 613 594 585 576 573 560 564 504 588 580 574 581 545 515 527 524 522 513 503 495 499 496 488 471 473
♦ SYSTEM AVL 437 454 474 503 546 557 576 593 603 609 630 626 687 601 613 618 613 648 646 667 670 673 682 698 707 697 702 710 726 724
■ SYSTEM TTL 1151 1156 1156 1161 1173 1170 1170 1178 1179 1182 1190 1190 1191 1189 1193 1192 1194 1193 1161 1194 1194 1195 1195 1201 1202 1196 1198 1198 1197 1197
*Confirmed includes ED values
X
2-1
8-2
1
2-1
9-2
1
COVID 19 ORANGE COUNTY HOSPITAL SYSTEM DATA (CA SNOWFLAKE SERVER)
VENTILATORS (01/25/21 - 02/23/21) | 33 ACUTE CARE FACILITIES REPORTING
2-1
6-2
1
2-1
5-2
1
2-1
7-2
1
Occupied ventilators
decreased by -33.8%. ♦System available ventilators
increased by 65.7%. ■Total system ventilators increased
by 4.0%.
2-6
-21
2-7
-21
2-8
-21
2-9
-21
2-1
0-2
1
2-1
1-2
1
2-1
2-2
1
2-2
3-2
1
1-2
5-2
1
1-2
6-2
1
1-2
7-2
1
1-2
8-2
1
1-2
9-2
1
1-3
0-2
1
1-3
1-2
1
2-1
-21
2-2
-21
2-3
-21
2-4
-21
2-5
-21
2-2
0-2
1
2-2
1-2
1
2-2
2-2
1
2-1
3-2
1
2-1
4-2
1
●Confirmed COVID+ patients on
ventilators decreased by -64.4%.
0
200
400
600
800
1000
1200
1400
2/24/21
\\ochca.com\hcashares\AOC\1 REAL EVENTS\COVID -19\3) MHOAC\DAILY POLICY GROUP Page 12 of 14
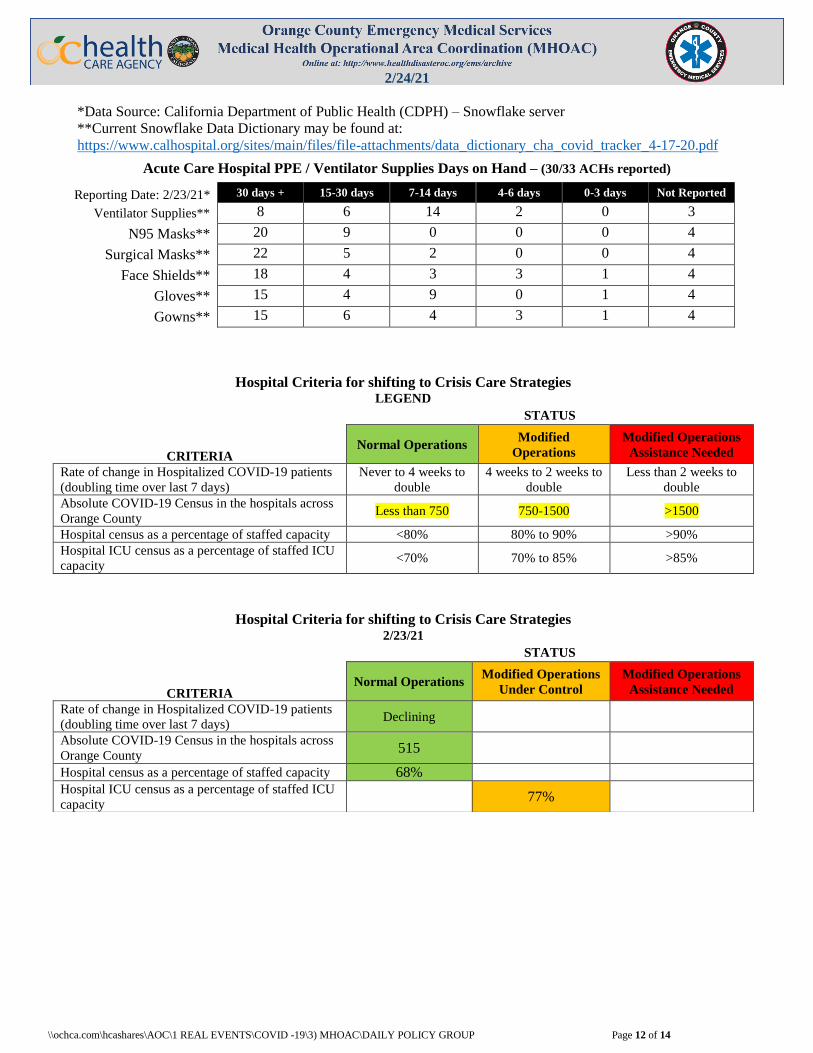
*Data Source: California Department of Public Health (CDPH) – Snowflake server
**Current Snowflake Data Dictionary may be found at:
https://www.calhospital.org/sites/main/files/file-attachments/data_dictionary_cha_covid_tracker_4-17-20.pdf
Acute Care Hospital PPE / Ventilator Supplies Days on Hand – (30/33 ACHs reported)
Reporting Date: 2/23/21* 30 days + 15-30 days 7-14 days 4-6 days 0-3 days Not Reported
Ventilator Supplies** 8 6 14 2 0 3
N95 Masks** 20 9 0 0 0 4
Surgical Masks** 22 5 2 0 0 4
Face Shields** 18 4 3 3 1 4
Gloves** 15 4 9 0 1 4
Gowns** 15 6 4 3 1 4
Hospital Criteria for shifting to Crisis Care Strategies LEGEND
CRITERIA
STATUS
Normal Operations Modified
Operations Modified Operations
Assistance Needed
Rate of change in Hospitalized COVID-19 patients
(doubling time over last 7 days)
Never to 4 weeks to
double
4 weeks to 2 weeks to
double
Less than 2 weeks to
double
Absolute COVID-19 Census in the hospitals across
Orange County Less than 750 750-1500 >1500
Hospital census as a percentage of staffed capacity <80% 80% to 90% >90%
Hospital ICU census as a percentage of staffed ICU
capacity <70% 70% to 85% >85%
Hospital Criteria for shifting to Crisis Care Strategies
2/23/21
CRITERIA
STATUS
Normal Operations Modified Operations
Under Control
Modified Operations
Assistance Needed
Rate of change in Hospitalized COVID-19 patients
(doubling time over last 7 days) Declining
Absolute COVID-19 Census in the hospitals across
Orange County 515
Hospital census as a percentage of staffed capacity 68%
Hospital ICU census as a percentage of staffed ICU
capacity 77%
2/24/21
\\ochca.com\hcashares\AOC\1 REAL EVENTS\COVID -19\3) MHOAC\DAILY POLICY GROUP Page 13 of 14
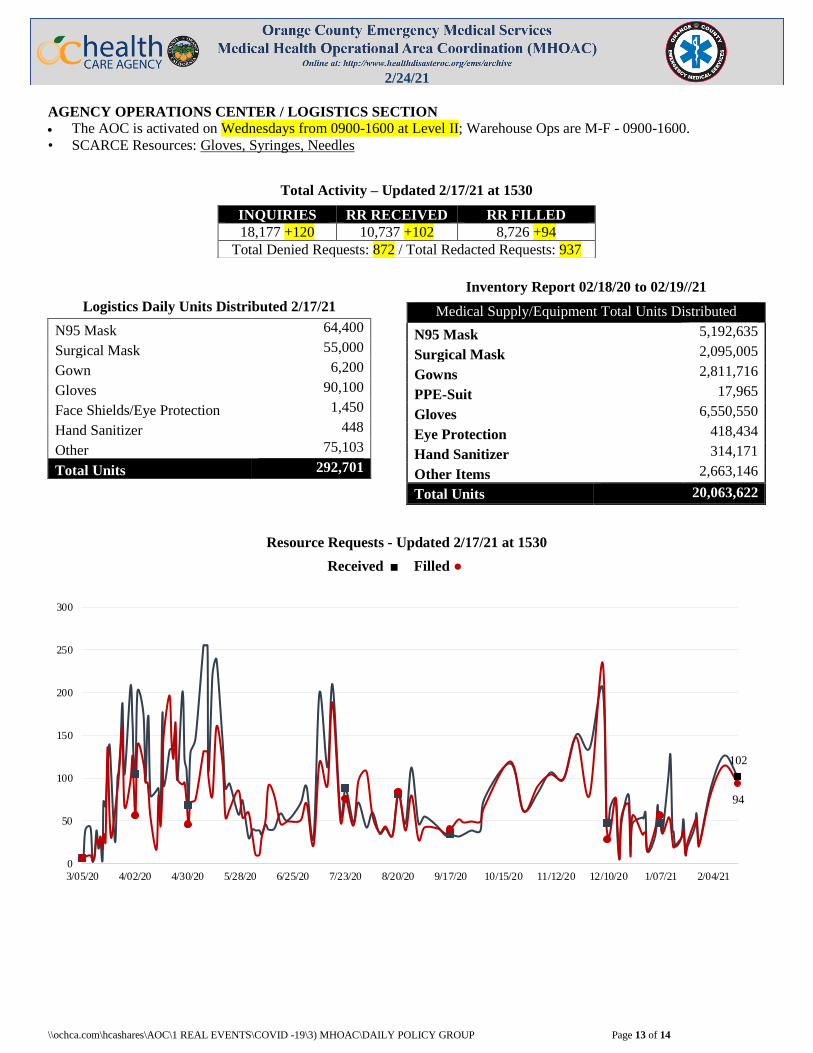
AGENCY OPERATIONS CENTER / LOGISTICS SECTION
The AOC is activated on Wednesdays from 0900-1600 at Level II; Warehouse Ops are M-F - 0900-1600.
• SCARCE Resources: Gloves, Syringes, Needles
Total Activity – Updated 2/17/21 at 1530
INQUIRIES RR RECEIVED RR FILLED
18,177 +120 10,737 +102 8,726 +94
Total Denied Requests: 872 / Total Redacted Requests: 937
Logistics Daily Units Distributed 2/17/21
N95 Mask 64,400
Surgical Mask 55,000
Gown 6,200
Gloves 90,100
Face Shields/Eye Protection 1,450
Hand Sanitizer 448
Other 75,103
Total Units 292,701
Inventory Report 02/18/20 to 02/19//21
Medical Supply/Equipment Total Units Distributed
N95 Mask 5,192,635
Surgical Mask 2,095,005
Gowns 2,811,716
PPE-Suit 17,965
Gloves 6,550,550
Eye Protection 418,434
Hand Sanitizer 314,171
Other Items 2,663,146
Total Units 20,063,622
Resource Requests - Updated 2/17/21 at 1530
Received ■ Filled ●
102
94
0
50
100
150
200
250
300
3/05/20 4/02/20 4/30/20 5/28/20 6/25/20 7/23/20 8/20/20 9/17/20 10/15/20 11/12/20 12/10/20 1/07/21 2/04/21
2/24/21
\\ochca.com\hcashares\AOC\1 REAL EVENTS\COVID -19\3) MHOAC\DAILY POLICY GROUP Page 14 of 14
ALTERNATE CARE SITE (ACS)
Fairview Alternate Care Site (FACS) opened for admissions on TUESDAY, 12/15/20 @ 1800
FACS will be placed into a “warm close” status on MONDAY, 03/15/2021. A “warm close” will allow the State of
California to maintain the ACS in a semi-ready state and will enable the site to reopen within 72 hours if needed.
FACS Admissions Guidelines (updated 12.16.20) may be found on the OCEMS website at:
https://www.healthdisasteroc.org/civicax/filebank/blobdload.aspx?BlobID=118724
Fairview (COVID-19 +)
Patient Census (as of 2/24/2021 09:00) CURRENT TOTAL
Orange County 12 134
LA County 4 69
Riverside 2 6
San Bernardino County 0 4
Ventura County 0 1
Total patients CENSUS / TOTAL ACCEPTED 18 214
Patients Discharged TOTAL DISCHARGED 196
Memory Care Unit (MCU) Census (as of 2/24/2021 17:00)
MCU Patient Census 11 49
Patients Discharged from MCU TOTAL
MCU - DISCHARGED 38
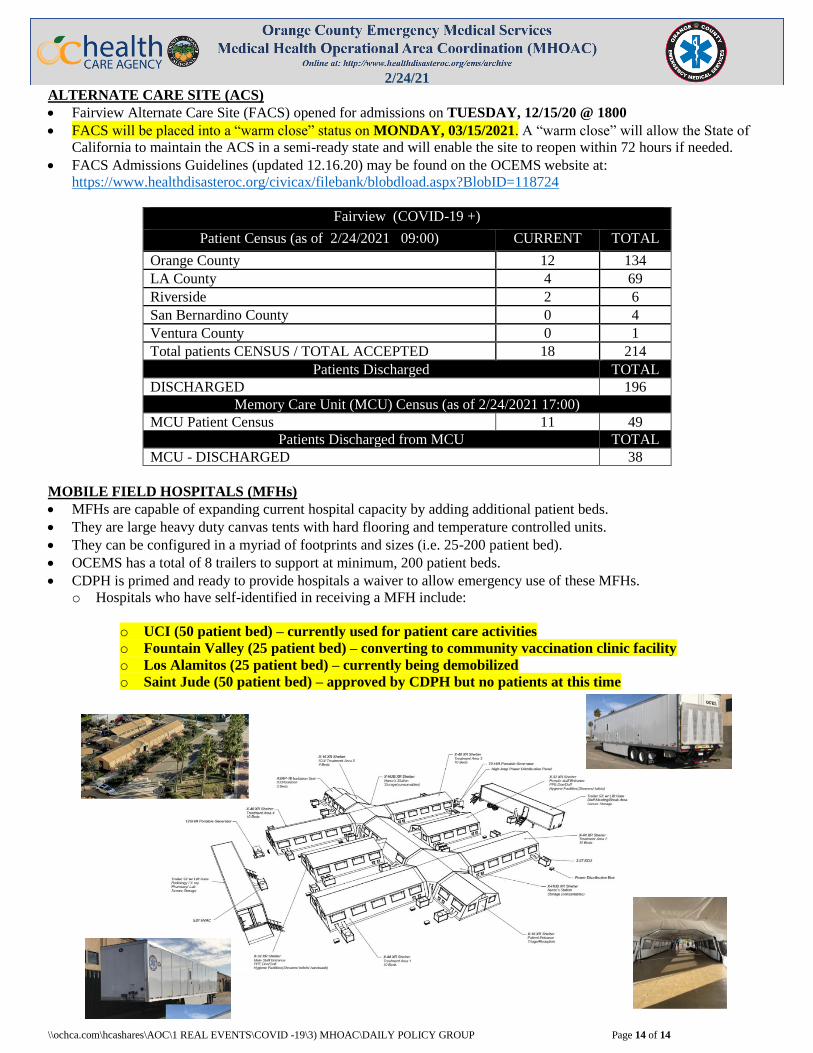
MOBILE FIELD HOSPITALS (MFHs)
MFHs are capable of expanding current hospital capacity by adding additional patient beds.
They are large heavy duty canvas tents with hard flooring and temperature controlled units.
They can be configured in a myriad of footprints and sizes (i.e. 25-200 patient bed).
OCEMS has a total of 8 trailers to support at minimum, 200 patient beds.
CDPH is primed and ready to provide hospitals a waiver to allow emergency use of these MFHs.
o Hospitals who have self-identified in receiving a MFH include:
o UCI (50 patient bed) – currently used for patient care activities
o Fountain Valley (25 patient bed) – converting to community vaccination clinic facility
o Los Alamitos (25 patient bed) – currently being demobilized
o Saint Jude (50 patient bed) – approved by CDPH but no patients at this time