2.13 air quality - dot.ca.gov air quality.pdf · include certain air toxics in their general...
TRANSCRIPT
Chapter 2 Affected Environment, Environmental Consequences, and Avoidance, Minimization, and/or Mitigation Measures
SR-55 Improvement Project Initial Study/Environmental Assessment 2.13-1
2.13 Air Quality
2.13.1 Regulatory Setting
The Federal Clean Air Act (FCAA), as amended, is the primary federal law that governs air quality while the California Clean Air Act is its companion state law. These laws, and related regulations by the United States Environmental Protection Agency (U.S. EPA) and California Air Resources Board (ARB), set standards for the concentration of pollutants in the air. At the federal level, these standards are called National Ambient Air Quality Standards (NAAQS). NAAQS and state ambient air quality standards have been established for six transportation-related criteria pollutants that have been linked to potential health concerns: carbon monoxide (CO), nitrogen dioxide (NO2), ozone (O3), particulate matter (PM), which is broken down for regulatory purposes into particles of 10 micrometers or smaller—(PM10) and particles of 2.5 micrometers and smaller—(PM2.5), and sulfur dioxide (SO2). In addition, national and state standards exist for lead (Pb) and state standards exist for visibility reducing particles, sulfates, hydrogen sulfide (H2S), and vinyl chloride. The NAAQS and state standards are set at a level that protects public health with a margin of safety, and are subject to periodic review and revision. Both state and federal regulatory schemes also cover toxic air contaminants (air toxics); some criteria pollutants are also air toxics or may include certain air toxics in their general definition.
Federal air quality standards and regulations provide the basic scheme for project-level air quality analysis under the National Environmental Policy Act (NEPA). In addition to this environmental analysis, a parallel “Conformity” requirement under the FCAA also applies.
2.13.1.1 Conformity
The conformity requirement is based on Federal Clean Air Act Section 176(c), which prohibits the U.S. Department of Transportation (USDOT) and other federal agencies from funding, authorizing, or approving plans, programs, or projects that do not conform to State Implementation Plan (SIP) for attainting the NAAQS. “Transportation Conformity” applies to highway and transit projects and takes place on two levels: the regional, or planning and programming, level, and the project level. The proposed project must conform at both levels to be approved.
Conformity requirements apply only in nonattainment and “maintenance” (former nonattainment) areas for the NAAQS, and only for the specific NAAQS that are or were violated. U.S. EPA regulations at 40 Code of Federal Regulation (CFR) 93 govern the conformity process. Conformity requirements do not apply in unclassifiable/attainment areas for NAAQS and do not apply at all for state standards regardless of the status of the area.
Regional conformity is concerned with how well the regional transportation system supports plans for attaining the NAAQS for carbon monoxide (CO), nitrogen dioxide (NO2), ozone (O3), particulate matter (PM10 and PM2.5), and in some areas (although not in California) sulfur dioxide (SO2). California has attainment or maintenance areas for all of these transportation-related “criteria pollutants” except SO2, and also has a nonattainment area for lead (Pb); however, lead is not currently required by the FCAA to be covered in transportation conformity analysis. Regional conformity is based on emission analysis of Regional Transportation Plans (RTPs) and Federal Transportation Improvement Programs (FTIPs) that include all transportation projects planned for a region over a period of at least 20 years (for the RTP) and 4 years (for the FTIP). RTP and FTIP conformity uses travel demand and emission models to determine whether or not the implementation of those projects would conform to emission budgets or other tests at various analysis years showing that requirements of the Clean Air Act and the SIP are met. If the conformity analysis is successful, the Metropolitan Planning Organization (MPO), Federal Highway Administration
Chapter 2 Affected Environment, Environmental Consequences, and Avoidance, Minimization, and/or Mitigation Measures
2.13-2 SR-55 Improvement Project Initial Study/Environmental Assessment
(FHWA), and Federal Transit Administration (FTA), make determinations that the RTP and FTIP are in conformity with the SIP for achieving the goals of the FCAA. Otherwise, the projects in the RTP and/or FTIP must be modified until conformity is attained. If the design concept, scope, and “open-to-traffic” schedule of a proposed transportation project are the same as described in the RTP and FTIP, then the proposed project meets regional conformity requirements for purposes of project-level analysis.
Conformity analysis at the project-level includes verification that the project is included in the regional conformity analysis and a “hot-spot” analysis if an area is “nonattainment” or “maintenance” for carbon monoxide (CO) and/or particulate matter (PM10 or PM2.5). A region is “nonattainment” if one or more of the monitoring stations in the region measures a violation of the relevant standard and the U.S. EPA officially designates the area nonattainment. Areas that were previously designated as nonattainment areas but subsequently meet the standard may be officially redesignated to attainment by U.S. EPA and are then called “maintenance” areas. “Hot-spot” analysis is essentially the same, for technical purposes, as CO or particulate matter analysis performed for NEPA purposes. Conformity does include some specific procedural and documentation standards for projects that require a hot-spot analysis. In general, projects must not cause the “hot-spot” related standard to be violated, and must not cause any increase in the number and severity of violations in nonattainment areas. If a known CO or particulate matter violation is located in the project vicinity, the project must include measures to reduce or eliminate the existing violation(s) as well.
2.13.2 Affected Environment
This section is based on the Air Quality Assessment Report (2015) and the Supplemental Air Quality Analysis (2016) prepared for the project.
2.13.2.1 Climate
The project segment of State Route 55 (SR-55) is located in Orange County, an area within the South Coast Air Basin (Basin), which includes Orange County and the non-desert portions of Los Angeles, Riverside, and San Bernardino Counties. Air quality regulation in the Basin is administered by the South Coast Air Quality Management District (SCAQMD), a regional agency created for the Basin.
The Basin climate is determined by its terrain and geographical location. The Basin is a coastal plain with connecting broad valleys and low hills. The Pacific Ocean forms the southwestern boundary, and high mountains surround the rest of the Basin. The region lies in the semipermanent high pressure zone of the eastern Pacific. The resulting climate is mild and tempered by cool ocean breezes. This climatological pattern is rarely interrupted. However, periods of extremely hot weather, winter storms, and Santa Ana wind conditions do occur.
The annual average temperature varies little throughout the Basin, ranging from the low to middle 60s, measured in degrees Fahrenheit (°F). With a more pronounced oceanic influence, coastal areas show less variability in annual minimum and maximum temperatures than inland areas. The climatological station closest to the project site that monitors temperature is the Tustin Irvine Ranch Station. The annual average maximum temperature recorded at that station is 75.4°F, and the annual average minimum is 49.4°F. January is typically the coldest month in this area of the Basin.
The majority of annual rainfall in the Basin occurs between November and April. Summer rainfall is minimal and generally limited to scattered thundershowers in coastal regions and slightly heavier showers in the eastern part of the Basin along the coastal side of the

Chapter 2 Affected Environment, Environmental Consequences, and Avoidance, Minimization, and/or Mitigation Measures
SR-55 Improvement Project Initial Study/Environmental Assessment 2.13-3
mountains. The climatological station closest to the project site that monitors precipitation is the Tustin Irvine Ranch Station. Average rainfall measured at that station varied from 2.67 inches in February to 0.29 inches or less between May and September, with an average annual total of 12.86 inches. Patterns in monthly and yearly rainfall totals are unpredictable due to fluctuations in the weather.
The Basin experiences a persistent temperature inversion (increasing temperature with increasing altitude) as a result of the Pacific high. This inversion limits the vertical dispersion of air contaminants, holding them relatively near the ground. As the sun warms the ground and the lower air layer, the temperature of the lower air layer approaches the temperature of the base of the inversion (upper) layer until the inversion layer finally breaks, allowing vertical mixing with the lower layer. This phenomenon is observed from midafternoon to late afternoon on hot summer days, when the smog appears to clear up suddenly. Winter inversions frequently break by midmorning.
Inversion layers are essential in determining O3 formation. O3 and its precursors will mix and react to produce higher concentrations under an inversion. The inversion will also simultaneously trap and hold directly emitted pollutants such as CO. PM10 is both directly emitted and created indirectly in the atmosphere as a result of chemical reactions. Concentration levels are directly related to inversion layers due to the limitation of mixing space.
Surface or radiation inversions are formed when the ground surface becomes cooler than the air above it during the night. The earth’s surface goes through a radiative process on clear nights, when heat energy is transferred from the ground to a cooler night sky. As the earth’s surface cools during the evening hours, the air directly above it also cools, while air higher up remains relatively warm. The inversion is destroyed when heat from the sun warms the ground, which in turn heats the lower layers of air; this heating stimulates the ground level air to float up through the inversion layer.
The combination of stagnant wind conditions and low inversions produces the greatest concentration of pollutants. On days of no inversion or high wind speeds, ambient air pollutant concentrations are the lowest. During periods of low inversions and low wind speeds, air pollutants generated in urbanized areas are transported predominantly onshore into Riverside and San Bernardino Counties. In the winter, the greatest pollution problems are from CO and oxides of nitrogen (NOX) because of extremely low inversions and air stagnation during the night and early morning hours. In the summer, the longer daylight hours and the brighter sunshine combine to cause a reaction between hydrocarbons and NOX to form photochemical smog.
2.13.2.2 Monitored Air Quality
The SCAQMD operates several air quality monitoring stations within the Basin. The air quality monitoring station closest to the project site is the Costa Mesa Air Quality Monitoring Station, and its air quality trends are representative of the ambient air quality in the project area. The pollutants monitored at this station are O3, SO2, NO2, and CO. The closest air quality monitoring site that monitors PM10 and PM2.5 is the Anaheim Station, and its air quality trends are also representative of the ambient air quality in the project area. Air quality trends identified from data collected at both air quality monitoring stations between 2012 and 2014 are listed in Table 2.13.1.
2.13.2.3 Sensitive Receptors
Sensitive populations (sensitive receptors) are more susceptible to the effects of air pollution than the general population. Sensitive populations in proximity to localized sources of toxics

Chapter 2 Affected Environment, Environmental Consequences, and Avoidance, Minimization, and/or Mitigation Measures
2.13-4 SR-55 Improvement Project Initial Study/Environmental Assessment
and CO are of particular concern. Land uses that are considered sensitive receptors include residences, hotels, schools, playgrounds, childcare centers, athletic facilities, long-term healthcare facilities, rehabilitation centers, convalescent centers, and retirement homes. The sensitive land uses along the project segment of SR-55 consist primarily of residences and hotels. The sensitive land uses in the project area, their addresses, and their distances from the edge of pavement on SR-55 are listed in Table 2.13.2.
2.13.2.4 Criteria Pollutant Attainment/Nonattainment Status
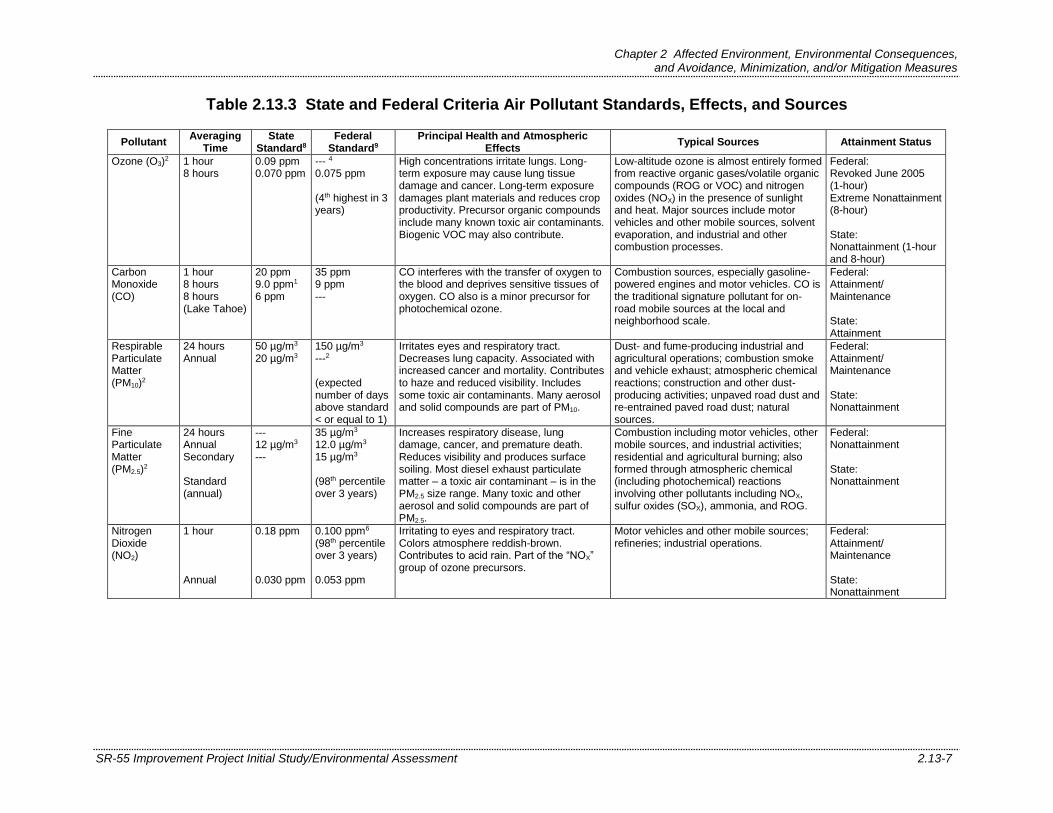
As noted earlier, the six criteria pollutants are O3, CO, PM (including both PM2.5 and PM10), NO2, SO2, and lead. The primary standards for these criteria pollutants are shown in Table 2.13.3 along with a brief description of the health effects associated with exposures to these pollutants and the typical sources of these pollutants. The NAAQS are two-tiered: primary, to protect public health, and secondary, to prevent degradation to the environment (e.g., impairment of visibility, damage to vegetation and property).

Chapter 2 Affected Environment, Environmental Consequences, and Avoidance, Minimization, and/or Mitigation Measures
SR-55 Improvement Project Initial Study/Environmental Assessment 2.13-5
Table 2.13.1 Local Air Quality Levels
Pollutant Primary Standard5
Year Maximum
Concentration1 Number of Days State/Federal
Standard Exceeded California Federal
Carbon Monoxide (CO) (1 hr)
20.0 ppm for 1 hr
35.0 ppm for 1 hr
2012 2.1 ppm 0 / 0
2013 2.4 ppm 0 / 0
2014 2.7 ppm 0 / 0
Carbon Monoxide (CO) (8 hrs)
9.0 ppm for 8 hrs
9 ppm for 8 hrs
2012 1.7 ppm 0 / 0
2013 2.0 ppm 0 / 0
2014 1.9 ppm 0 / 0
Ozone (O3) (1 hr) 0.09 ppm for 1 hr
N/A
2012 0.090 ppm 0 / N/A
2013 0.095 ppm 1 / N/A
2014 0.096 ppm 1 / N/A
Ozone (O3) (8 hrs) 0.07 ppm for 8 hrs
0.075 ppm for 8 hrs
2012 0.076 ppm 1 / 1
2013 0.084 ppm 2 / 1
2014 0.080 ppm 6 / 4
Nitrogen Dioxide (NO2) 0.18 ppm for 1 hr
0.100 ppm for 1 hr
2012 0.074 ppm 0 / 0
2013 0.075 ppm 0 / 0
2014 0.060 ppm 0 / 0
Sulfur Dioxide (SO2) 0.25 ppm for 1 hr
0.075 ppm for 1 hr
2012 0.0062 ppm 0 / 0
2013 0.0041 ppm 0 / 0
2014 0.0088 ppm 0 / 0
Coarse Particulate Matter (PM10)
2,3 50 µg/m3
for 24 hrs 150 µg/m3 for 24 hrs
2012 48.0 µg/m3 0 / 0
2013 77.0 µg/m3 1 / 0
2014 85.0 µg/m3 2 / 0
Fine Particulate Matter (PM2.5)
2,4 N/A
35 µg/m3 for 24 hrs
2012 50.1 µg/m3 N/A / 4
2013 37.8 µg/m3 N/A / 1
2014 56.2 µg/m3 N/A / 6
Source: Air Quality Assessment Report (2015). 1 Maximum concentration is measured over the same period as the California standard. 2 Measurement taken at the Anaheim Air Quality Monitoring Station. 3 PM10 and PM2.5 exceedances are derived from the number of samples exceeded, not days. 4 PM2.5 exceedances are based on the U.S. EPA’s revision of the standard to 35 µg/m3. 5 For more information pertaining to California and Federal Criteria Air Quality Standards, refer to Table 2.13.3. µg/m3 = micrograms per cubic meter ADAM = Aerometric Data Analysis and Management System hr/hrs = hour/hours N/A = not applicable PM10 = particulate matter less than 10 microns in size PM2.5 = particulate matter less than 2.5 microns in size ppm = parts per million U.S. EPA = United States Environmental Protection Agency

Chapter 2 Affected Environment, Environmental Consequences, and Avoidance, Minimization, and/or Mitigation Measures
2.13-6 SR-55 Improvement Project Initial Study/Environmental Assessment
Table 2.13.2 Sensitive Land Uses in the Project Area
Land Use Type Address Distance from Edge of Pavement on SR-55 (ft)
Hotel Hutton Centre Drive, Santa Ana, CA 130
Hotel Grand Avenue, Santa Ana, CA 185
Hotel Dyer Road, Santa Ana, CA 115
Hotel Newport Avenue/Edinger Avenue, Tustin, CA 150
Residential Tustin Grove Drive, Tustin, CA 100
Residential Kenyon Drive, Tustin, CA 50
Residential Altadena Drive, Tustin, CA 25
Residential 15863 Pasadena Avenue, Tustin, CA 65
Residential 15829 Pasadena Avenue, Tustin, CA 50
Residential Medallion Avenue, Tustin, CA 60
Residential Whitby Circle, Tustin, CA 35
Residential 15641 Pasadena Avenue, Tustin, CA 80
Residential Boleyn Circle, Tustin, CA 35
Residential 15501 Pasadena Avenue, Tustin, CA 110
Residential 15491 Pasadena Avenue, Tustin, CA 150
Residential 15660 Tustin Village Way, Tustin, CA 50
Residential 15620 Tustin Village Way, Tustin, CA 65
Residential 15580 Tustin Village Way, Tustin, CA 70
Residential 15520 Tustin Village Way, Tustin, CA 135
Residential 15440 Tustin Village Way, Tustin, CA 50
Residential De Anza Lane, Tustin, CA 35 Source: Air Quality Assessment Report (2015). CA = California ft = feet SR-55 = State Route 55
Chapter 2 Affected Environment, Environmental Consequences, and Avoidance, Minimization, and/or Mitigation Measures
SR-55 Improvement Project Initial Study/Environmental Assessment 2.13-7
Table 2.13.3 State and Federal Criteria Air Pollutant Standards, Effects, and Sources
Pollutant Averaging
Time State
Standard8 Federal
Standard9 Principal Health and Atmospheric
Effects Typical Sources Attainment Status
Ozone (O3)2 1 hour
8 hours
0.09 ppm 0.070 ppm
--- 4 0.075 ppm (4th highest in 3 years)
High concentrations irritate lungs. Long-term exposure may cause lung tissue damage and cancer. Long-term exposure damages plant materials and reduces crop productivity. Precursor organic compounds include many known toxic air contaminants. Biogenic VOC may also contribute.
Low-altitude ozone is almost entirely formed from reactive organic gases/volatile organic compounds (ROG or VOC) and nitrogen oxides (NOX) in the presence of sunlight and heat. Major sources include motor vehicles and other mobile sources, solvent evaporation, and industrial and other combustion processes.
Federal: Revoked June 2005 (1-hour) Extreme Nonattainment (8-hour) State: Nonattainment (1-hour and 8-hour)
Carbon Monoxide (CO)
1 hour 8 hours 8 hours (Lake Tahoe)
20 ppm 9.0 ppm1 6 ppm
35 ppm 9 ppm ---
CO interferes with the transfer of oxygen to the blood and deprives sensitive tissues of oxygen. CO also is a minor precursor for photochemical ozone.
Combustion sources, especially gasoline-powered engines and motor vehicles. CO is the traditional signature pollutant for on-road mobile sources at the local and neighborhood scale.
Federal: Attainment/ Maintenance State: Attainment
Respirable Particulate Matter (PM10)
2
24 hours Annual
50 µg/m3 20 µg/m3
150 µg/m3 ---2
(expected number of days above standard < or equal to 1)
Irritates eyes and respiratory tract. Decreases lung capacity. Associated with increased cancer and mortality. Contributes to haze and reduced visibility. Includes some toxic air contaminants. Many aerosol and solid compounds are part of PM10.
Dust- and fume-producing industrial and agricultural operations; combustion smoke and vehicle exhaust; atmospheric chemical reactions; construction and other dust-producing activities; unpaved road dust and re-entrained paved road dust; natural sources.
Federal: Attainment/ Maintenance State: Nonattainment
Fine Particulate Matter (PM2.5)
2
24 hours Annual Secondary Standard (annual)
---
12 µg/m3 ---
35 µg/m3 12.0 µg/m3 15 µg/m3
(98th percentile over 3 years)
Increases respiratory disease, lung damage, cancer, and premature death. Reduces visibility and produces surface soiling. Most diesel exhaust particulate matter – a toxic air contaminant – is in the PM2.5 size range. Many toxic and other aerosol and solid compounds are part of PM2.5.
Combustion including motor vehicles, other mobile sources, and industrial activities; residential and agricultural burning; also formed through atmospheric chemical (including photochemical) reactions involving other pollutants including NOX, sulfur oxides (SOX), ammonia, and ROG.
Federal: Nonattainment State: Nonattainment
Nitrogen Dioxide (NO2)
1 hour Annual
0.18 ppm 0.030 ppm
0.100 ppm6 (98th percentile over 3 years) 0.053 ppm
Irritating to eyes and respiratory tract. Colors atmosphere reddish-brown. Contributes to acid rain. Part of the “NOX” group of ozone precursors.
Motor vehicles and other mobile sources; refineries; industrial operations.
Federal: Attainment/ Maintenance State: Nonattainment

Chapter 2 Affected Environment, Environmental Consequences, and Avoidance, Minimization, and/or Mitigation Measures
2.13-8 SR-55 Improvement Project Initial Study/Environmental Assessment
Table 2.13.3 State and Federal Criteria Air Pollutant Standards, Effects, and Sources
Pollutant Averaging
Time State
Standard8 Federal
Standard9 Principal Health and Atmospheric
Effects Typical Sources Attainment Status
Sulfur Dioxide (SO2)
1 hour 3 hours 24 hours
0.25 ppm
---
0.04 ppm
0.075 ppm7 (98th percentile over 3 years) 0.5 ppm
Irritates respiratory tract; injures lung tissue. Can yellow plant leaves. Destructive to marble, iron, steel. Contributes to acid rain. Limits visibility.
Fuel combustion (especially coal and high-sulfur oil), chemical plants, sulfur recovery plants, metal processing; some natural sources like active volcanoes. Limited contribution possible from heavy-duty diesel vehicles if ultra-low sulfur fuel not used.
Federal: Attainment/ Unclassified State: Attainment/ Unclassified
Lead (Pb)3 Monthly Rolling 3-month average
1.5 µg/m3 ---
---
0.15 µg/m3 10
Disturbs gastrointestinal system. Causes anemia, kidney disease, and neuromuscular and neurological dysfunction. Also a toxic air contaminant and water pollutant.
Lead-based industrial processes like battery production and smelters. Lead paint, leaded gasoline. Aerially deposited lead from gasoline may exist in soils along major roads.
Federal: Nonattainment (Los Angeles County only) State: Nonattainment (Los Angeles County only)
Sulfate 24 hours 25 µg/m3 --- Premature mortality and respiratory effects. Contributes to acid rain. Some toxic air contaminants attach to sulfate aerosol particles.
Industrial processes, refineries and oil fields, mines, natural sources like volcanic areas, salt-covered dry lakes, and large sulfide rock areas.
Federal: Attainment/ Unclassified State: Attainment/ Unclassified
Hydrogen Sulfide (H2S)
1 hour 0.03 ppm --- Colorless, flammable, poisonous. Respiratory irritant. Neurological damage and premature death. Headache, nausea.
Industrial processes such as: refineries and oil fields, asphalt plants, livestock operations, sewage treatment plants, and mines. Some natural sources like volcanic areas and hot springs.
Federal: Attainment/ Unclassified State: Attainment/ Unclassified
Visibility Reducing Particles (VRP)
8 hours Visibility of 10 miles or more (Tahoe: 30 miles) at relative humidity less than 70 percent
--- Reduces visibility. Produces haze. NOTE: not related to the Regional Haze program under the Federal Clean Air Act, which is oriented primarily toward visibility issues in National Parks and other “Class I” areas.
See particulate matter above. Federal: Attainment/ Unclassified State: Attainment/ Unclassified
Chapter 2 Affected Environment, Environmental Consequences, and Avoidance, Minimization, and/or Mitigation Measures
SR-55 Improvement Project Initial Study/Environmental Assessment 2.13-9
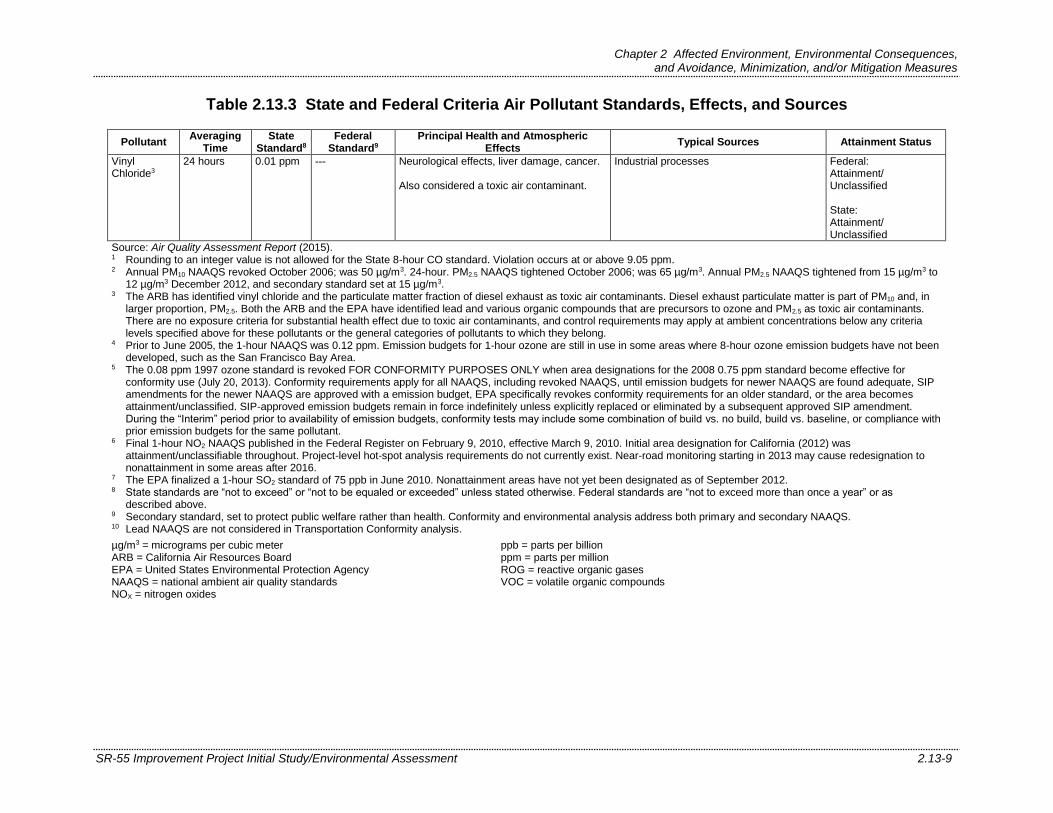
Table 2.13.3 State and Federal Criteria Air Pollutant Standards, Effects, and Sources
Pollutant Averaging
Time State
Standard8 Federal
Standard9 Principal Health and Atmospheric
Effects Typical Sources Attainment Status
Vinyl Chloride3
24 hours 0.01 ppm --- Neurological effects, liver damage, cancer. Also considered a toxic air contaminant.
Industrial processes Federal: Attainment/ Unclassified State: Attainment/ Unclassified
Source: Air Quality Assessment Report (2015). 1 Rounding to an integer value is not allowed for the State 8-hour CO standard. Violation occurs at or above 9.05 ppm. 2 Annual PM10 NAAQS revoked October 2006; was 50 µg/m3. 24-hour. PM2.5 NAAQS tightened October 2006; was 65 µg/m3. Annual PM2.5 NAAQS tightened from 15 µg/m3 to
12 µg/m3 December 2012, and secondary standard set at 15 µg/m3. 3 The ARB has identified vinyl chloride and the particulate matter fraction of diesel exhaust as toxic air contaminants. Diesel exhaust particulate matter is part of PM10 and, in
larger proportion, PM2.5. Both the ARB and the EPA have identified lead and various organic compounds that are precursors to ozone and PM2.5 as toxic air contaminants. There are no exposure criteria for substantial health effect due to toxic air contaminants, and control requirements may apply at ambient concentrations below any criteria levels specified above for these pollutants or the general categories of pollutants to which they belong.
4 Prior to June 2005, the 1-hour NAAQS was 0.12 ppm. Emission budgets for 1-hour ozone are still in use in some areas where 8-hour ozone emission budgets have not been developed, such as the San Francisco Bay Area.
5 The 0.08 ppm 1997 ozone standard is revoked FOR CONFORMITY PURPOSES ONLY when area designations for the 2008 0.75 ppm standard become effective for conformity use (July 20, 2013). Conformity requirements apply for all NAAQS, including revoked NAAQS, until emission budgets for newer NAAQS are found adequate, SIP amendments for the newer NAAQS are approved with a emission budget, EPA specifically revokes conformity requirements for an older standard, or the area becomes attainment/unclassified. SIP-approved emission budgets remain in force indefinitely unless explicitly replaced or eliminated by a subsequent approved SIP amendment. During the “Interim” period prior to availability of emission budgets, conformity tests may include some combination of build vs. no build, build vs. baseline, or compliance with prior emission budgets for the same pollutant.
6 Final 1-hour NO2 NAAQS published in the Federal Register on February 9, 2010, effective March 9, 2010. Initial area designation for California (2012) was attainment/unclassifiable throughout. Project-level hot-spot analysis requirements do not currently exist. Near-road monitoring starting in 2013 may cause redesignation to nonattainment in some areas after 2016.
7 The EPA finalized a 1-hour SO2 standard of 75 ppb in June 2010. Nonattainment areas have not yet been designated as of September 2012. 8 State standards are “not to exceed” or “not to be equaled or exceeded” unless stated otherwise. Federal standards are “not to exceed more than once a year” or as
described above. 9 Secondary standard, set to protect public welfare rather than health. Conformity and environmental analysis address both primary and secondary NAAQS. 10 Lead NAAQS are not considered in Transportation Conformity analysis.
µg/m3 = micrograms per cubic meter ARB = California Air Resources Board EPA = United States Environmental Protection Agency NAAQS = national ambient air quality standards NOX = nitrogen oxides
ppb = parts per billion ppm = parts per million ROG = reactive organic gases VOC = volatile organic compounds
Chapter 2 Affected Environment, Environmental Consequences, and Avoidance, Minimization, and/or Mitigation Measures
2.13-10 SR-55 Improvement Project Initial Study/Environmental Assessment
This page intentionally left blank
Chapter 2 Affected Environment, Environmental Consequences, and Avoidance, Minimization, and/or Mitigation Measures
SR-55 Improvement Project Initial Study/Environmental Assessment 2.13-11
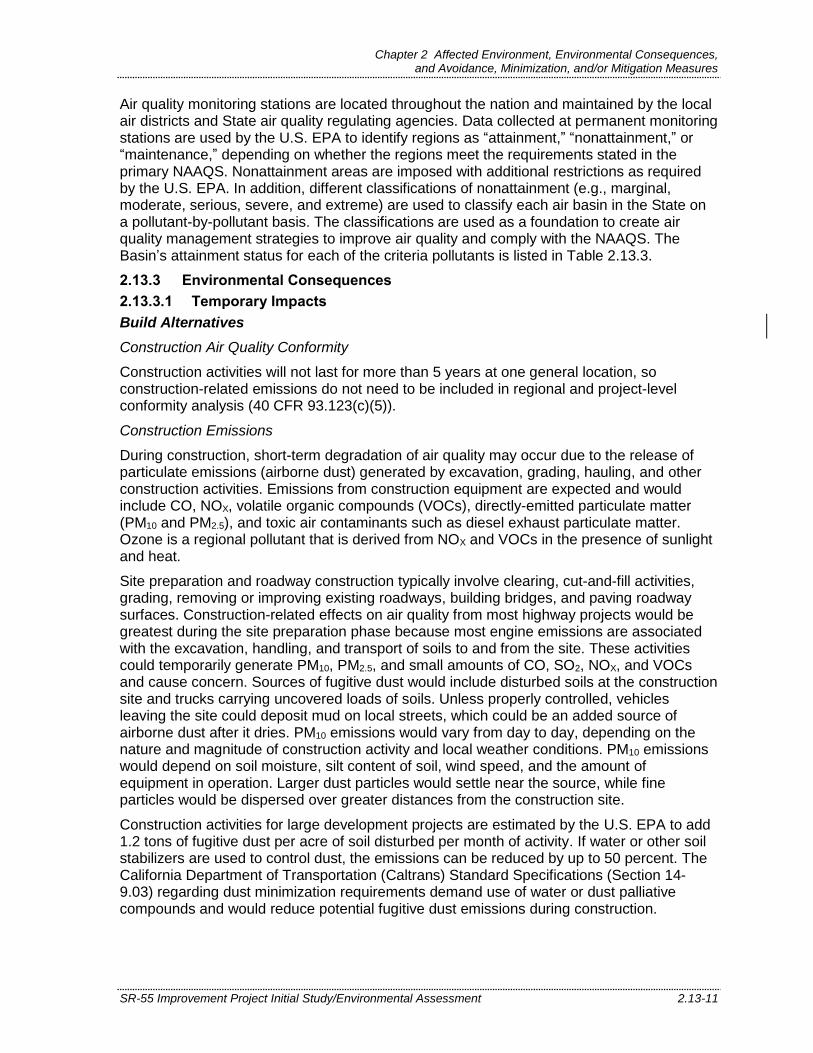
Air quality monitoring stations are located throughout the nation and maintained by the local air districts and State air quality regulating agencies. Data collected at permanent monitoring stations are used by the U.S. EPA to identify regions as “attainment,” “nonattainment,” or “maintenance,” depending on whether the regions meet the requirements stated in the primary NAAQS. Nonattainment areas are imposed with additional restrictions as required by the U.S. EPA. In addition, different classifications of nonattainment (e.g., marginal, moderate, serious, severe, and extreme) are used to classify each air basin in the State on a pollutant-by-pollutant basis. The classifications are used as a foundation to create air quality management strategies to improve air quality and comply with the NAAQS. The Basin’s attainment status for each of the criteria pollutants is listed in Table 2.13.3.
2.13.3 Environmental Consequences
2.13.3.1 Temporary Impacts
Build Alternatives
Construction Air Quality Conformity
Construction activities will not last for more than 5 years at one general location, so construction-related emissions do not need to be included in regional and project-level conformity analysis (40 CFR 93.123(c)(5)).
Construction Emissions
During construction, short-term degradation of air quality may occur due to the release of particulate emissions (airborne dust) generated by excavation, grading, hauling, and other construction activities. Emissions from construction equipment are expected and would include CO, NOX, volatile organic compounds (VOCs), directly-emitted particulate matter (PM10 and PM2.5), and toxic air contaminants such as diesel exhaust particulate matter. Ozone is a regional pollutant that is derived from NOX and VOCs in the presence of sunlight and heat.
Site preparation and roadway construction typically involve clearing, cut-and-fill activities, grading, removing or improving existing roadways, building bridges, and paving roadway surfaces. Construction-related effects on air quality from most highway projects would be greatest during the site preparation phase because most engine emissions are associated with the excavation, handling, and transport of soils to and from the site. These activities could temporarily generate PM10, PM2.5, and small amounts of CO, SO2, NOX, and VOCs and cause concern. Sources of fugitive dust would include disturbed soils at the construction site and trucks carrying uncovered loads of soils. Unless properly controlled, vehicles leaving the site could deposit mud on local streets, which could be an added source of airborne dust after it dries. PM10 emissions would vary from day to day, depending on the nature and magnitude of construction activity and local weather conditions. PM10 emissions would depend on soil moisture, silt content of soil, wind speed, and the amount of equipment in operation. Larger dust particles would settle near the source, while fine particles would be dispersed over greater distances from the construction site.
Construction activities for large development projects are estimated by the U.S. EPA to add 1.2 tons of fugitive dust per acre of soil disturbed per month of activity. If water or other soil stabilizers are used to control dust, the emissions can be reduced by up to 50 percent. The California Department of Transportation (Caltrans) Standard Specifications (Section 14-9.03) regarding dust minimization requirements demand use of water or dust palliative compounds and would reduce potential fugitive dust emissions during construction.

Chapter 2 Affected Environment, Environmental Consequences, and Avoidance, Minimization, and/or Mitigation Measures
2.13-12 SR-55 Improvement Project Initial Study/Environmental Assessment
In addition to dust-related PM10 emissions, heavy-duty trucks and construction equipment powered by gasoline and diesel engines would generate CO, SO2, NOX, VOCs, and some soot particulate (PM10 and PM2.5) in exhaust emissions. If construction activities were to increase traffic congestion in the area, CO and other emissions from traffic would increase slightly while those vehicles are delayed. These emissions would be temporary and limited to the immediate area surrounding the construction site.
SO2 is generated by oxidation during combustion of organic sulfur compounds contained in diesel fuel. Under California law and ARB regulations, off-road diesel fuel used in California must meet the same sulfur and additional standards as on-road diesel fuel (not more than 15 parts per million [ppm] sulfur), and as such, SO2-related issues due to diesel exhaust would be minimal.
Some phases of construction, particularly asphalt paving, would result in short-term odors in the immediate area of each paving site(s). Such odors would quickly disperse to below detectable thresholds as distance from the site(s) increases.
The estimated peak-day construction emissions for the Build Alternatives are summarized in Table 2.13.4. Because the construction activities would be similar for each Build Alternative, the peak-day construction emissions would be the same for each Build Alternative.
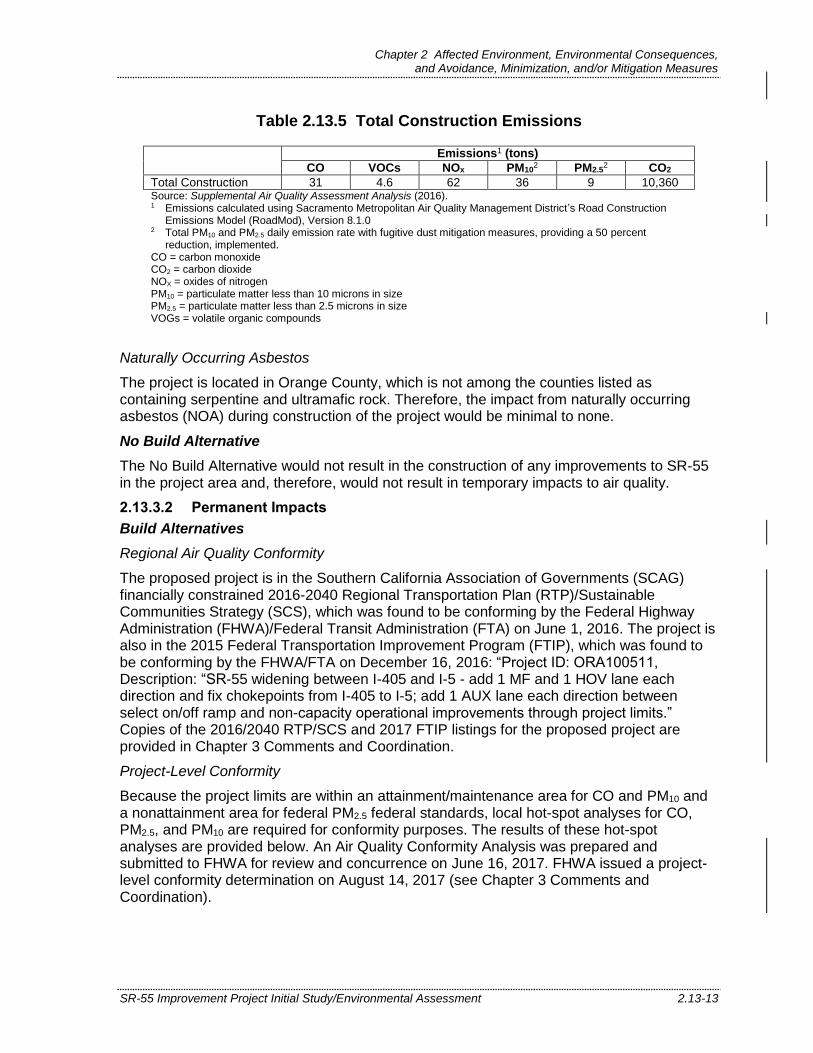
Table 2.13.5 summarizes the total construction emissions (in tons) generated during the approximately 36-month project construction schedule. The total area disturbed during construction would range from a low of 38.9 acres (ac) for Alternative 1 to a high of 77.2 ac for Alternative 3 and 3M. The construction emission calculations are based on the larger disturbance area required for Alternative 3 and 3M.
Table 2.13.4 Peak-Day Construction Emissions by Construction Phase
Construction Phase Emissions1 (lbs/day)
CO VOCs NOx PM102 PM2.5
2
Grubbing/Land Clearing 59 8.2 96 104 25
Grading/Excavation 105 17 256 110 29
Drainage/Utilities/Sub-Grade 67 8.5 81 104 25
Paving 42 4.2 41 2.3 2.1 Source: Supplemental Air Quality Analysis (2016). 1 Emissions calculated using Sacramento Metropolitan Air Quality Management District’s Road
Construction Emissions Model (RoadMod), Version 8.1.0. 2 Total PM10 and PM2.5 daily emission rate with fugitive dust mitigation measures, providing a 50
percent reduction, implemented. CO = carbon monoxide lbs/day = pounds per day NOX = oxides of nitrogen PM10 = particulate matter less than 10 microns in size PM2.5 = particulate matter less than 2.5 microns in size VOGs = volatile organic compounds
Chapter 2 Affected Environment, Environmental Consequences, and Avoidance, Minimization, and/or Mitigation Measures
SR-55 Improvement Project Initial Study/Environmental Assessment 2.13-13
Table 2.13.5 Total Construction Emissions
Emissions1 (tons)
CO VOCs NOx PM102 PM2.5
2 CO2
Total Construction 31 4.6 62 36 9 10,360 Source: Supplemental Air Quality Assessment Analysis (2016). 1 Emissions calculated using Sacramento Metropolitan Air Quality Management District’s Road Construction
Emissions Model (RoadMod), Version 8.1.0 2 Total PM10 and PM2.5 daily emission rate with fugitive dust mitigation measures, providing a 50 percent
reduction, implemented. CO = carbon monoxide CO2 = carbon dioxide NOX = oxides of nitrogen PM10 = particulate matter less than 10 microns in size PM2.5 = particulate matter less than 2.5 microns in size VOGs = volatile organic compounds
Naturally Occurring Asbestos
The project is located in Orange County, which is not among the counties listed as containing serpentine and ultramafic rock. Therefore, the impact from naturally occurring asbestos (NOA) during construction of the project would be minimal to none.
No Build Alternative
The No Build Alternative would not result in the construction of any improvements to SR-55 in the project area and, therefore, would not result in temporary impacts to air quality.
2.13.3.2 Permanent Impacts
Build Alternatives
Regional Air Quality Conformity
The proposed project is in the Southern California Association of Governments (SCAG) financially constrained 2016-2040 Regional Transportation Plan (RTP)/Sustainable Communities Strategy (SCS), which was found to be conforming by the Federal Highway Administration (FHWA)/Federal Transit Administration (FTA) on June 1, 2016. The project is also in the 2015 Federal Transportation Improvement Program (FTIP), which was found to be conforming by the FHWA/FTA on December 16, 2016: “Project ID: ORA100511, Description: “SR-55 widening between I-405 and I-5 - add 1 MF and 1 HOV lane each direction and fix chokepoints from I-405 to I-5; add 1 AUX lane each direction between select on/off ramp and non-capacity operational improvements through project limits.” Copies of the 2016/2040 RTP/SCS and 2017 FTIP listings for the proposed project are provided in Chapter 3 Comments and Coordination.
Project-Level Conformity
Because the project limits are within an attainment/maintenance area for CO and PM10 and a nonattainment area for federal PM2.5 federal standards, local hot-spot analyses for CO, PM2.5, and PM10 are required for conformity purposes. The results of these hot-spot analyses are provided below. An Air Quality Conformity Analysis was prepared and submitted to FHWA for review and concurrence on June 16, 2017. FHWA issued a project-level conformity determination on August 14, 2017 (see Chapter 3 Comments and Coordination).

Chapter 2 Affected Environment, Environmental Consequences, and Avoidance, Minimization, and/or Mitigation Measures
2.13-14 SR-55 Improvement Project Initial Study/Environmental Assessment
Carbon Monoxide
The methodology required for a CO local analysis is summarized in the Caltrans Transportation Project-Level Carbon Monoxide Protocol (Protocol), Sections 3 (Determination of Project Requirements) and 4 (Local Analysis). In Section 3, the Protocol provides two conformity requirement decision flowcharts that are designed to assist project sponsors in evaluating the requirements that apply to specific projects. The flowchart in Figure 1 of the Protocol (provided as Appendix B in the Air Quality Assessment Report) applies to new projects and was used in this local analysis conformity decision. Below is a step-by-step explanation of the flow chart. Each level cited is followed by a response, which in turn determines the next applicable level of the flowchart for the project. The flowchart begins with Section 3.1.1:
3.1.1. Is this project exempt from all emissions analyses?
NO.
Table 1 of the Protocol is Table 2 of Section 93.126 of 40 CFR. Section 3.1.1 is inquiring if the project is exempt. Such projects appear in Table 1 of the Protocol. The proposed project would be widening an existing highway; therefore, the project is not exempt from all emissions analyses.
3.1.2. Is the project exempt from regional emissions analyses?
NO.
Table 2 of the Protocol is Table 3 of Section 93.127 of 40 CFR. The question is attempting to determine whether the project is listed in Table 2. Projects that are included in Table 2 of the Protocol are exempt from regional conformity. The proposed project would be widening an existing highway; therefore, it is not exempt from regional emissions analysis.
3.1.3. Is the project locally defined as regionally significant?
YES.
As mentioned above, the proposed project would be widening an existing highway; therefore, the project is potentially regionally significant.
3.1.4. Is the project in a federal attainment area?
NO.
The project is located in an attainment/maintenance area for the federal CO standard; therefore, the project is subject to a regional conformity determination.
3.1.5. Are there a currently conforming Regional Transportation Plan [RTP] and transportation improvement program [TIP]?
YES.
3.1.6. Is the project included in the regional emissions analysis supporting the currently conforming Regional Transportation Plan [RTP] and transportation improvement program [TIP]?
YES.
The project is included in the Southern California Association of Governments (SCAG) 2016-2040 RTP/SCS and the 2017 Federal Transportation Improvement Program
Chapter 2 Affected Environment, Environmental Consequences, and Avoidance, Minimization, and/or Mitigation Measures
SR-55 Improvement Project Initial Study/Environmental Assessment 2.13-15
(FTIP). Project ID: ORA100511, Description: “SR-55 widening between I-405 and I-5 - add 1 MF and 1 HOV lane each direction and fix chokepoints from I-405 to I-5; add 1 AUX lane each direction between select on/off ramp and non-capacity operational improvements through project limits.” Copies of the 2016/2040 RTP and 2017 FTIP listings are included in Chapter 3 Comments and Coordination.
3.1.7. Has the project design concept and/or scope changed significantly from that in the regional analysis?
NO.
3.1.9. Examine local impacts.
Section 3.1.9 of the flowchart directs the project evaluation to Section 4 (Local Analysis) of the Protocol. This includes Figure 1.
Section 4 contains Figure 3 (Local CO Analysis). This flowchart is used to determine the type of CO analysis required for the Build Alternatives. Below is a step-by-step explanation of the flowchart. Each level cited is followed by a response, which in turn determines the next applicable level of the flowchart for the Build Alternatives. The flowchart begins at Level 1:
Level 1. Is the project in a CO non-attainment area?
NO.
The project site is located in an area that has demonstrated attainment with the federal CO standard.
Level 1 (cont.). Was the area redesignated as “attainment” after the 1990 Clean Air Act?
YES.
Level 1 (cont.). Has “continued attainment” been verified with the local Air District, if appropriate?
YES.
The Basin was designated as attainment/maintenance by the U.S. EPA on June 11, 2007. (Proceed to Level 7.)
Level 7. Does the project worsen air quality?
YES.
Because two of the following conditions (listed in Section 4.7.1 of the CO Protocol) are met, the project would potentially worsen air quality:
a. The project significantly increases the percentage of vehicles operating in cold start mode. Increasing the number of vehicles operating in cold start mode by as little as 2 percent should be considered potentially significant. It is assumed that all vehicles on the freeway and in the intersections are in a fully warmed-up mode. Therefore, this criterion is not met.
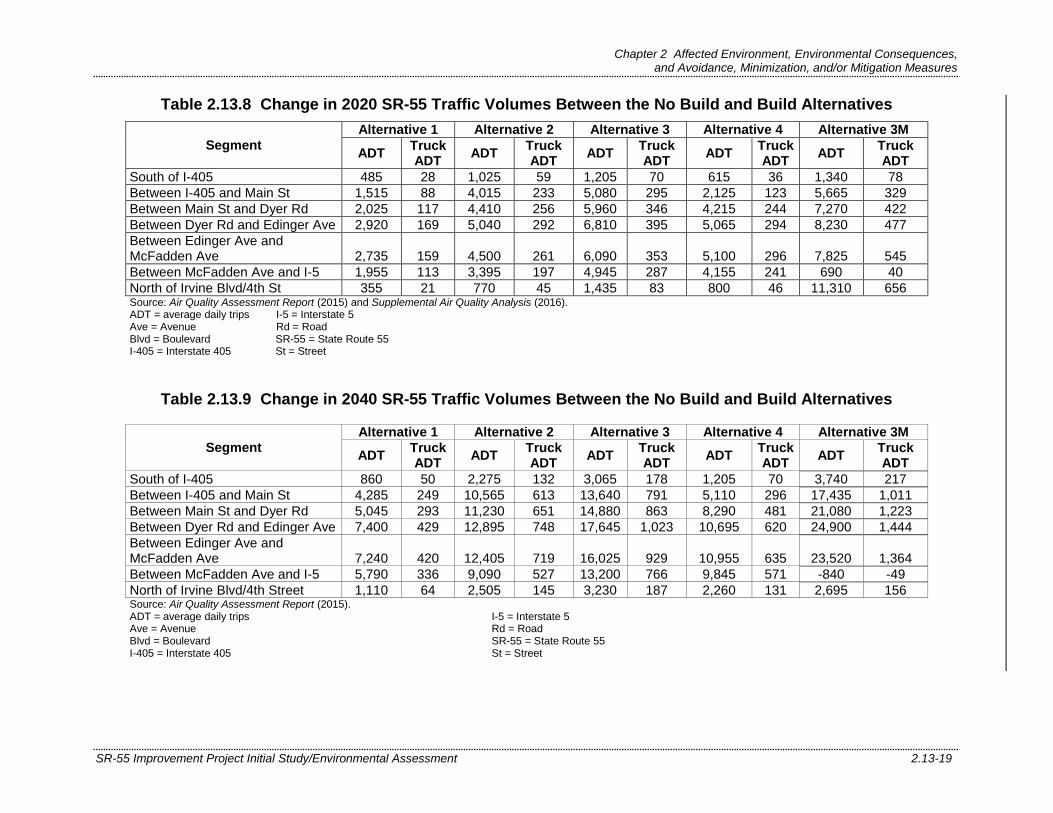
b. The project significantly increases traffic volumes. Increases in traffic volumes in excess of 5 percent should be considered potentially significant. Increasing the traffic volume by less than 5 percent may still be potentially significant if there is also a reduction in average speeds. As shown in Tables 2.13.6 through 2.13.9, the proposed project would increase traffic volumes along SR-55 by up to 24,900
Chapter 2 Affected Environment, Environmental Consequences, and Avoidance, Minimization, and/or Mitigation Measures
2.13-16 SR-55 Improvement Project Initial Study/Environmental Assessment
vehicles per day, which is an increase of 7 percent over the No Build Alternative. Therefore, this criterion is met.
c. The project worsens traffic flow. For uninterrupted roadway segments, a reduction in average speeds (within a range of 3 to 50 miles per hour [mph]) should be regarded as worsening traffic flow. For intersection segments, a reduction in average speed or an increase in average delay should be considered as worsening traffic flow. As shown in Tables 9-A through 9-D in the Final Traffic Operations Report (2016), the proposed project would increase the peak-hour delay at several ramps and highway segments along SR-55. These tables are also included in Appendix B in the Supplemental Air Quality Assessment Report (2016). Therefore, this criterion is met.
Level 7 (cont.). Is the project suspected of resulting in higher CO concentrations than those existing within the region at the time of attainment demonstration?
NO.
Therefore, the project has been determined to be satisfactory. No further analysis is needed.
Chapter 2 Affected Environment, Environmental Consequences, and Avoidance, Minimization, and/or Mitigation Measures
SR-55 Improvement Project Initial Study/Environmental Assessment 2.13-17
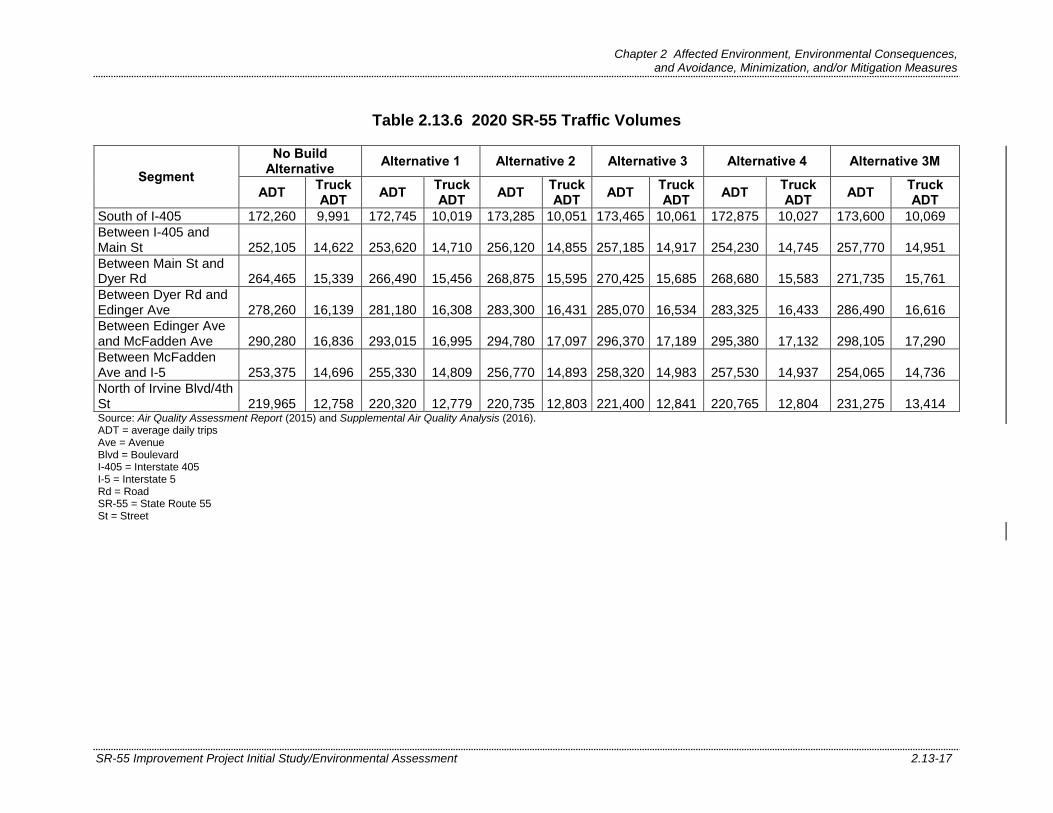
Table 2.13.6 2020 SR-55 Traffic Volumes
Segment
No Build Alternative
Alternative 1 Alternative 2 Alternative 3 Alternative 4 Alternative 3M
ADT Truck ADT
ADT Truck ADT
ADT Truck ADT
ADT Truck ADT
ADT Truck ADT
ADT Truck ADT
South of I-405 172,260 9,991 172,745 10,019 173,285 10,051 173,465 10,061 172,875 10,027 173,600 10,069
Between I-405 and Main St 252,105 14,622 253,620 14,710 256,120 14,855 257,185 14,917 254,230 14,745 257,770 14,951
Between Main St and Dyer Rd 264,465 15,339 266,490 15,456 268,875 15,595 270,425 15,685 268,680 15,583 271,735 15,761
Between Dyer Rd and Edinger Ave 278,260 16,139 281,180 16,308 283,300 16,431 285,070 16,534 283,325 16,433 286,490 16,616
Between Edinger Ave and McFadden Ave 290,280 16,836 293,015 16,995 294,780 17,097 296,370 17,189 295,380 17,132 298,105 17,290
Between McFadden Ave and I-5 253,375 14,696 255,330 14,809 256,770 14,893 258,320 14,983 257,530 14,937 254,065 14,736
North of Irvine Blvd/4th St 219,965 12,758 220,320 12,779 220,735 12,803 221,400 12,841 220,765 12,804 231,275 13,414 Source: Air Quality Assessment Report (2015) and Supplemental Air Quality Analysis (2016). ADT = average daily trips Ave = Avenue Blvd = Boulevard I-405 = Interstate 405 I-5 = Interstate 5 Rd = Road SR-55 = State Route 55 St = Street

Chapter 2 Affected Environment, Environmental Consequences, and Avoidance, Minimization, and/or Mitigation Measures
2.13-18 SR-55 Improvement Project Initial Study/Environmental Assessment
Table 2.13.7 2040 SR-55 Traffic Volumes
Segment
No Build Alternative
Alternative 1 Alternative 2 Alternative 3 Alternative 4 Alternative 3M
ADT Truck ADT
ADT Truck ADT
ADT Truck ADT
ADT Truck ADT
ADT Truck ADT
ADT Truck ADT
South of I-405 178,455 10,350 179,315 10,400 180,730 10,482 181,520 10,528 179,660 10,420 182,195 10,567
Between I-405 and Main St 260,950 15,135 265,235 15,384 271,515 15,748 274,590 15,926 266,060 15,431 278,385 16,146
Between Main St and Dyer Rd 270,250 15,675 275,295 15,967 281,480 16,326 285,130 16,538 278,540 16,155 291,330 16,897
Between Dyer Rd and Edinger Ave 281,920 16,351 289,320 16,781 294,815 17,099 299,565 17,375 292,615 16,972 306,820 17,796
Between Edinger Ave and McFadden Ave 293,650 17,032 300,890 17,452 306,055 17,751 309,675 17,961 304,605 17,667 317,170 18,396
Between McFadden Ave and I-5 267,135 15,494 272,925 15,830 276,225 16,021 280,335 16,259 276,980 16,065 266,295 15,445
North of Irvine Blvd/4th St 262,025 15,197 263,135 15,262 264,530 15,343 265,255 15,385 264,285 15,329 264,720 15,354 Source: Air Quality Assessment Report (2015) and Supplemental Air Quality Analysis (2016). ADT = average daily trips Ave = Avenue Blvd = Boulevard I-405 = Interstate 405 I-5 = Interstate 5 Rd = Road SR-55 = State Route 55 St = Street
Chapter 2 Affected Environment, Environmental Consequences, and Avoidance, Minimization, and/or Mitigation Measures
SR-55 Improvement Project Initial Study/Environmental Assessment 2.13-19
Table 2.13.8 Change in 2020 SR-55 Traffic Volumes Between the No Build and Build Alternatives
Segment
Alternative 1 Alternative 2 Alternative 3 Alternative 4 Alternative 3M
ADT Truck ADT
ADT Truck ADT
ADT Truck ADT
ADT Truck ADT
ADT Truck ADT
South of I-405 485 28 1,025 59 1,205 70 615 36 1,340 78
Between I-405 and Main St 1,515 88 4,015 233 5,080 295 2,125 123 5,665 329
Between Main St and Dyer Rd 2,025 117 4,410 256 5,960 346 4,215 244 7,270 422
Between Dyer Rd and Edinger Ave 2,920 169 5,040 292 6,810 395 5,065 294 8,230 477
Between Edinger Ave and McFadden Ave 2,735 159 4,500 261 6,090 353 5,100 296 7,825 545
Between McFadden Ave and I-5 1,955 113 3,395 197 4,945 287 4,155 241 690 40
North of Irvine Blvd/4th St 355 21 770 45 1,435 83 800 46 11,310 656 Source: Air Quality Assessment Report (2015) and Supplemental Air Quality Analysis (2016). ADT = average daily trips I-5 = Interstate 5 Ave = Avenue Rd = Road Blvd = Boulevard SR-55 = State Route 55 I-405 = Interstate 405 St = Street
Table 2.13.9 Change in 2040 SR-55 Traffic Volumes Between the No Build and Build Alternatives
Segment Alternative 1 Alternative 2 Alternative 3 Alternative 4 Alternative 3M
ADT Truck ADT
ADT Truck ADT
ADT Truck ADT
ADT Truck ADT
ADT Truck ADT
South of I-405 860 50 2,275 132 3,065 178 1,205 70 3,740 217
Between I-405 and Main St 4,285 249 10,565 613 13,640 791 5,110 296 17,435 1,011
Between Main St and Dyer Rd 5,045 293 11,230 651 14,880 863 8,290 481 21,080 1,223
Between Dyer Rd and Edinger Ave 7,400 429 12,895 748 17,645 1,023 10,695 620 24,900 1,444
Between Edinger Ave and McFadden Ave 7,240 420 12,405 719 16,025 929 10,955 635 23,520 1,364
Between McFadden Ave and I-5 5,790 336 9,090 527 13,200 766 9,845 571 -840 -49
North of Irvine Blvd/4th Street 1,110 64 2,505 145 3,230 187 2,260 131 2,695 156 Source: Air Quality Assessment Report (2015). ADT = average daily trips Ave = Avenue Blvd = Boulevard I-405 = Interstate 405
I-5 = Interstate 5 Rd = Road SR-55 = State Route 55 St = Street

Chapter 2 Affected Environment, Environmental Consequences, and Avoidance, Minimization, and/or Mitigation Measures
2.13-20 SR-55 Improvement Project Initial Study/Environmental Assessment
This page intentionally left blank

Chapter 2 Affected Environment, Environmental Consequences, and Avoidance, Minimization, and/or Mitigation Measures
SR-55 Improvement Project Initial Study/Environmental Assessment 2.13-21
CO concentrations at the intersections under study would be lower than those reported for the maximum of the intersections analyzed in the CO attainment plan because all the following conditions, listed in Section 4.7.2 of the CO Protocol, are satisfied:
a. The receptor locations at the intersections under study are at the same distance or farther from the traveled roadway than the receptor locations used in the intersections in the attainment plan. The attainment plan evaluates the CO concentrations at a distance of 10 feet (ft) from the edges of the roadways. The CO Protocol does not permit the modeling of receptor locations closer than this distance.
b. The project intersection traffic volumes and geometries are not substantially different from those included in the attainment plan. Also, the intersections under study have less total traffic and the same number of lanes or fewer than the intersections in the attainment plan.
c. The assumed meteorology for the intersections under study is the same as the assumed meteorology for the intersections in the attainment plan. Both use the worst-case scenario meteorology settings in the CALINE4 and/or CAL3QHC models.
d. As shown in Table 2.13.10, traffic lane volumes for all approach and departure segments are lower for the intersections under study than those assumed for the intersections in the attainment plan. The intersections in the attainment plan include Wilshire Boulevard/Veteran Avenue, Sunset Boulevard/Highland Avenue, La Cienega Boulevard/Century Boulevard, and Long Beach Boulevard/Imperial Highway. The intersections under study were selected based on their levels of service (LOS) and the proposed project’s contribution to the total traffic volumes.
e. The percentages of vehicles operating in cold start mode are the same or lower for the intersections under study compared to those used for the intersections in the attainment plan. It is assumed that all vehicles in the intersections are operating in fully warmed-up mode.
f. The percentages of heavy-duty gas trucks in the intersections under study are the same or lower than the percentages used for the intersections in the attainment plan analysis. It is assumed that traffic distribution at the intersections under study does not vary from the EMFAC2007 standards.

Chapter 2 Affected Environment, Environmental Consequences, and Avoidance, Minimization, and/or Mitigation Measures
2.13-22 SR-55 Improvement Project Initial Study/Environmental Assessment
Table 2.13.10 Traffic Volume Comparison
Attainment Plan Maximum Volumes
Intersection 1 Intersection 2 Intersection 3 Intersection 4
AM PM AM PM AM PM AM PM
Existing Traffic Volumes Wilshire Blvd/ Veteran Ave
Sunset Blvd/ Highland Ave
La Cienega Blvd/Century Blvd
Long Beach Blvd/Imperial Hwy
Intersection Total 8,062 7,719 6,614 7,374 6,635 8,674 4,212 5,514
Turn Maximum 384 780 200 263 700 1,187 176 202
Build Alternative Maximum Volumes
Intersection 1 Intersection 2 Intersection 3 Intersection 4
AM PM AM PM AM PM AM PM
2040 No Build Conditions SR-55 NB
Ramps/ Irvine Blvd
SR-55 SB Ramps/ Edinger Ave
SR-55 SB Ramps/ MacArthur Blvd
SR-55 NB Ramps/ MacArthur Blvd
Intersection Total 3,920 4,170 4,845 5,060 5,465 5,700 4,955 5,350
Turn Maximum 775 825 500 440 825 1,080 1,035 1,040
2040 Alt 1 Build Conditions SR-55 NB
Ramps/ Irvine Blvd
SR-55 SB Ramps/ Edinger Ave
SR-55 SB Ramps/ MacArthur Blvd
SR-55 NB Ramps/ MacArthur Blvd
Intersection Total 3,785 3,915 4,845 5,075 5,515 5,750 5,015 5,430
Turn Maximum 750 595 500 445 825 1,080 1,035 1,070
2040 Alt 2 Build Conditions SR-55 NB
Ramps/ Irvine Blvd
SR-55 SB Ramps/ Edinger Ave
SR-55 SB Ramps/ MacArthur Blvd
SR-55 NB Ramps/ MacArthur Blvd
Intersection Total 3,785 3,920 4,845 5,110 5,545 5,800 5,045 5,500
Turn Maximum 750 600 500 465 825 1,080 1,035 1,090
2040 Alt 3 Build Conditions SR-55 NB
Ramps/ Irvine Blvd
SR-55 SB Ramps/ Edinger Ave
SR-55 SB Ramps/ MacArthur Blvd
SR-55 NB Ramps/ MacArthur Blvd
Intersection Total 3,795 3,940 4,865 5,140 5,565 5,830 5,080 5,560
Turn Maximum 755 600 520 495 825 1,080 1,035 1,120
2040 Alt 4 Build Conditions SR-55 NB
Ramps/ Irvine Blvd
SR-55 SB Ramps/ Edinger Ave
SR-55 SB Ramps/ MacArthur Blvd
SR-55 NB Ramps/ MacArthur Blvd
Intersection Total 3,800 3,925 4,845 5,085 5,525 5,760 5,050 5,480
Turn Maximum 765 595 500 445 830 1,080 1,035 1,110
2040 Alt 3M Build Conditions SR-55 NB
Ramps/ Irvine Blvd
SR-55 SB Ramps/ Edinger Ave
SR-55 SB Ramps/ MacArthur Blvd
SR-55 NB Ramps/ MacArthur Blvd
Intersection Total 3,880 4,215 4,850 5,130 5,505 5,690 4,975 5,360
Turn Maximum 790 840 565 505 845 1,080 1,030 1.065
Source: Air Quality Assessment Report (2015) and Supplemental Air Quality Analysis (2016). Alt = Alternative Ave = Avenue Blvd = Boulevard Hwy = Highway NB = northbound SB = southbound SR-55 = State Route 55
g. Average delay and queue length for each approach are the same or less for the intersections under study compared to those found in the intersections in the attainment plan. The predicted LOS for the intersections under study range from LOS A to LOS F. The LOS for the intersections in the attainment plan are not listed; however, the traffic counts and intersection geometries correspond to LOS F for three of the four intersections in the attainment plan.
h. The background CO concentrations in the area of the intersections under study are 2.7 ppm for 1 hour and 2.0 ppm for 8 hours, which is lower than the background concentrations for the intersections in the attainment plan. These varied from 5.3 to 13.2 ppm for 1 hour and 3.7 to 9.9 ppm for 8 hours.

Chapter 2 Affected Environment, Environmental Consequences, and Avoidance, Minimization, and/or Mitigation Measures
SR-55 Improvement Project Initial Study/Environmental Assessment 2.13-23
The project is not expected to result in any concentrations exceeding the 1-hour or 8-hour CO standards. Therefore, a detailed CALINE4 CO hot-spot analysis is not required.
Particulate Matter (PM10 and PM2.5)
The proposed project is within a nonattainment area for the federal PM2.5 and PM10 standards. Therefore, per 40 CFR Part 93, analyses are required for conformity purposes. The U.S. EPA specified in 40 CFR 93.123(b)(1) of the 2006 Final Rule that projects of air quality concern (POAQCs) are certain highway and transit projects that involve significant levels of diesel vehicle traffic, or any other project that is identified in the PM2.5 and PM10 SIP as a localized air quality concern. The 2006 Final Rule defines the POAQCs that require a PM2.5 and PM10 hot-spot analysis in 40 CFR 93.123(b)(1) as:
i. New or expanded highway projects that have a significant number of or significant increase in diesel vehicles;
ii. Projects affecting intersections that are at LOS D, E, or F with a significant number of diesel vehicles, or those that will change to LOS D, E, or F because of increased traffic volumes from a significant number of diesel vehicles related to the project;
iii. New bus and rail terminals and transfer points that have a significant number of diesel vehicles congregating at a single location;
iv. Expanded bus and rail terminals and transfer points that significantly increase the number of diesel vehicles congregating at a single location; or
v. Projects in or affecting locations, areas, or categories of sites that are identified in the PM2.5 and PM10 applicable implementation plan or implementation plan submission, as appropriate, as sites of violation or possible violation.
A PM Conformity Hot Spot Analysis for the SR-55 Improvement Project was presented to the SCAG Transportation Conformity Working Group (TCWG) on June 26, 2012. The TCWG determined that the proposed project would meet Criterion (i) because it would expand an existing freeway with existing and future high truck volumes. Because the proposed project meets one of the five criteria listed above, it is considered to be a POAQC, and a qualitative project-level PM2.5 and PM10 hot-spot analysis was conducted to assess whether the project would cause or contribute to any new localized PM2.5 or PM10 violations, increase the frequency or severity of any existing violations, or delay timely attainment of the PM2.5 and PM10 NAAQS. A copy of the draft PM hot-spot analysis is provided in Appendix E in the Air Quality Assessment Report. At the December 3, 2013, SCAG meeting, the TCWG determined that the detailed analysis was acceptable for NEPA circulation. Subsequent to the TCWG approval, the forecasted SR-55 traffic volumes were updated. On July 28, 2015, the TCWG determined the updated SR-55 traffic volumes would not affect the conclusions of the qualitative PM hot-spot analysis and reaffirmed that the analysis was acceptable for NEPA circulation. On August 23, 2016 the TCWG determined Alternative 3M (Preferred Alternative)SR-55 traffic volumes would not affect the conclusions of the qualitative PM hot-spot analysis and again reaffirmed that the analysis was acceptable for NEPA circulation. Copies of the TCWG determinations are provided in Chapter 3, Comments and Coordination, and are also included in Appendix G of the Supplemental Air Quality Analysis (2016). FHWA issued a project-level conformity determination on August 14, 2017 (see Chapter 3 Comments and Coordination.

Chapter 2 Affected Environment, Environmental Consequences, and Avoidance, Minimization, and/or Mitigation Measures
2.13-24 SR-55 Improvement Project Initial Study/Environmental Assessment
Mobile-Source Air Toxics
In addition to the criteria air pollutants for which there are NAAQS, the U.S. EPA also regulates air toxics. Most air toxics originate from human-made sources, including on-road mobile sources, nonroad mobile sources (e.g., airplanes), area sources (e.g., dry cleaners), and stationary sources (e.g., factories or refineries).
Controlling air toxic emissions became a national priority with the passage of the Clean Air Act Amendments (CAAA) of 1990, whereby Congress mandated that the U.S. EPA regulate 188 air toxics, also known as hazardous air pollutants. The U.S. EPA has assessed this expansive list in its latest rule on the Control of Hazardous Air Pollutants from Mobile Sources and identified a group of 93 compounds emitted from mobile sources that are listed in its Integrated Risk Information System (IRIS). In addition, the U.S. EPA identified seven compounds with significant contributions from mobile sources that are among the national and regional-scale cancer risk drivers from its 1999 National Air Toxics Assessment (NATA). These are acrolein, benzene, 1,3-butadiene, diesel particulate matter plus diesel exhaust organic gases (diesel PM), formaldehyde, naphthalene, and polycyclic organic matter (POM). While the FHWA considers these the priority Mobile Source Air Toxics (MSATs), the list is subject to change and may be adjusted in consideration of future U.S. EPA rules.
The 2008 U.S. EPA rule described above requires controls that will dramatically decrease MSAT emissions through cleaner fuels and cleaner engines. According to an FHWA analysis using the U.S. EPA Motor Vehicle Emissions Simulator (MOVES) [2014b] model, even if vehicle activity (in terms of vehicle miles traveled [VMT]) increases by 91 percent as assumed, a combined reduction of 72 percent in the total annual emission rate for the priority MSATs is projected from 1999 to 2050, as shown on Figure 2.13-1. The projected reduction in MSAT emissions would be slightly different in California due to the use of the CT-EMFAC 2014 (Version 6.0 based on EMFAC2014) emission model in place of the MOVES 2014b model.

Chapter 2 Affected Environment, Environmental Consequences, and Avoidance, Minimization, and/or Mitigation Measures
SR-55 Improvement Project Initial Study/Environmental Assessment 2.13-25
Source: Supplemental Air Quality Analysis (2016).
Figure 2.13-1 National MSAT Emission Trends
Air toxics analysis is a continuing area of research. While much work has been done to assess the overall health risk of air toxics, many questions remain unanswered. In particular, the tools and techniques for assessing project-specific health outcomes as a result of lifetime MSAT exposure remain limited. These limitations impede the ability to evaluate how the potential health risks posed by MSAT exposure should be factored into project-level decision-making within the context of NEPA.
Nonetheless, air toxics concerns continue to be raised on highway projects during the NEPA process. Even as the science emerges, we are duly expected by the public and other agencies to address MSAT impacts in our environmental documents. The FHWA, the U.S. EPA, the Health Effects Institute, and others have funded and conducted research studies to try to more clearly define potential risks from MSAT emissions associated with highway projects. The FHWA will continue to monitor the developing research in this field.
NEPA requires, to the fullest extent possible, that the policies, regulations, and laws of the federal government be interpreted and administered in accordance with its environmental protection goals. NEPA also requires federal agencies to use an interdisciplinary approach in planning and decision-making for any action that adversely impacts the environment. NEPA requires, and FHWA is committed to, the examination and avoidance of potential impacts to the natural and human environment when considering approval of proposed transportation projects. In addition to evaluating the potential environmental effects, we must
Chapter 2 Affected Environment, Environmental Consequences, and Avoidance, Minimization, and/or Mitigation Measures
2.13-26 SR-55 Improvement Project Initial Study/Environmental Assessment
also take into account the need for safe and efficient transportation in reaching a decision that is in the best overall public interest. The FHWA policies and procedures for implementing NEPA are contained in regulations at 23 CFR Part 771.
In December 2012, the FHWA issued guidance to advise FHWA division offices as to when and how to analyze MSATs in the NEPA process for highways. This document is an update to the guidance released in February 2006 and September 2009. The guidance is described as interim because MSAT science is still evolving. As the science progresses, FHWA will update the guidance. This analysis follows the FHWA guidance.
Information that is Unavailable or Incomplete
In FHWA’s view, information is incomplete or unavailable to credibly predict the project-specific health impacts due to changes in MSAT emissions associated with a proposed set of highway alternatives. The outcome of such an assessment, adverse or not, would be influenced more by the uncertainty introduced into the process through assumption and speculation rather than any genuine insight into the actual health impacts directly attributable to MSAT exposure associated with a proposed action.
The EPA is responsible for protecting the public health and welfare from any known or anticipated effect of an air pollutant. It is the lead authority for administering the Clean Air Act (CAA) and its amendments and has specific statutory obligations with respect to hazardous air pollutants and MSATs. The U.S. EPA is in the continual process of assessing human health effects, exposures, and risks posed by air pollutants, and maintains the IRIS (Integrated Risk Information System), which is “a compilation of electronic reports on specific substances found in the environment and their potential to cause human health effects.” Each report contains assessments of noncancerous and cancerous effects for individual compounds and quantitative estimates of risk levels from lifetime oral and inhalation exposures with uncertainty spanning perhaps an order of magnitude.
Other organizations are also active in the research and analyses of the human health effects of MSATs, including the Health Effects Institute. Two Health Effects Institute studies are summarized in Appendix D in FHWA’s Interim Guidance Update on Mobile Source Air Toxic Analysis in NEPA Documents. Among the adverse health effects linked to MSAT compounds at high exposures are cancer in humans in occupational settings, cancer in animals, and irritation to the respiratory tract, including the exacerbation of asthma. Less obvious is the adverse human health effects of MSAT compounds at current environmental concentrations or in the future, as vehicle emissions substantially decrease.
The methodologies for forecasting health impacts include emissions modeling, dispersion modeling, exposure modeling, and then final determination of health impacts. Each step in the process builds on the model predictions obtained in the previous step. All are encumbered by technical shortcomings or uncertain science that prevent a more complete differentiation of the MSAT health impacts among a set of project alternatives. These difficulties are magnified due to required lifetime (i.e., 70-year) exposure methodologies, particularly because unsupportable assumptions would have to be made regarding changes in travel patterns and vehicle technology (which affect emissions rates) over that time frame because such information is unavailable. The results produced by the U.S. EPA MOBILE 6.2 model, the California EPA EMFAC2007 model, and the U.S. EPA Draft Motor Vehicle Emission Simulator (MOVES) 2009 model in forecasting MSAT emissions are highly inconsistent. Indications from the development of the MOVES model are that MOBILE 6.2 significantly underestimates diesel particulate matter (Diesel PM) emissions and significantly overestimates benzene emissions.
Chapter 2 Affected Environment, Environmental Consequences, and Avoidance, Minimization, and/or Mitigation Measures
SR-55 Improvement Project Initial Study/Environmental Assessment 2.13-27
Regarding air dispersion modeling, an extensive evaluation of the U.S. EPA’s guideline CAL3QHC model was conducted in a National Cooperative Highway Research Program (NCHRP) study, which documents poor model performance at 10 sites across the country: 3 where intensive monitoring was conducted plus an additional 7 with less intensive monitoring. The study indicates a bias of the CAL3QHC model to overestimate concentrations near highly congested intersections and underestimate concentrations near uncongested intersections. The consequence of this is a tendency to overstate the air quality benefits of mitigating congestion at intersections. Such poor model performance is less difficult to manage for demonstrating compliance with NAAQS for relatively short time frames than it is for forecasting individual exposure over an entire lifetime, especially given that some information needed for estimating 70-year lifetime exposure is unavailable. It is particularly difficult to reliably forecast MSAT exposure near roads and to determine the amount of time that people are actually exposed at a specific location.
There are considerable uncertainties associated with the existing estimates of toxicity of the various MSATs because of factors such as low-dose extrapolation and translation of occupational exposure data to the general population, which is a concern expressed by the Health Effects Institute. As a result, there is no national consensus on air dose-response values assumed to protect the public health and welfare for MSAT compounds, and for Diesel PM in particular. The U.S. EPA and the Health Effects Institute have not established a basis for quantitative risk assessment of Diesel PM in ambient settings.
There is also the lack of a national consensus on an acceptable level of risk. The current context is the process used by the U.S. EPA as provided by the FCAA to determine whether more stringent controls are required in order to provide an ample margin of safety to protect public health or to prevent an adverse environmental effect for industrial sources subject to the maximum achievable control technology standards (e.g., benzene emissions from refineries). The decision framework is a two-step process. The first step requires the U.S. EPA to determine a “safe” or “acceptable” level of risk due to emissions from a source, which is generally no greater than approximately 100 in a million. Additional factors are considered in the second step, the goal of which is to maximize the number of people with risks to less than 1 per million due to emissions from a source. The results of this statutory two-step process do not guarantee that cancer risks from exposure to air toxics are less than 1 per million; in some cases, the residual risk determination could result in maximum individual cancer risks that are as high as approximately 100 per million. In a June 2008 decision, the United States Court of Appeals for the District of Columbia Circuit upheld the U.S. EPA’s approach to addressing risk in its two-step decision framework. Information is incomplete or unavailable to establish that even the largest of highway projects would result in levels of risk greater than safe or acceptable.
Because of these limitations in the methodologies for forecasting health impacts, any predicted difference in health impacts among alternatives is likely to be much smaller than the uncertainties associated with predicting the impacts. Consequently, the results of such assessments would not be useful to decision-makers, who would need to weigh this information against project benefits (e.g., reducing traffic congestion, accident rates, and fatalities, plus improved access for emergency response) that are better suited for quantitative analysis.
Quantitative Project-Level MSAT Analysis
As indicated in Tables 2.13.6 and 2.13.7, average daily traffic (ADT) volumes on SR-55 in the project area would exceed 140,000 vehicles per day. Consequently, this project is

Chapter 2 Affected Environment, Environmental Consequences, and Avoidance, Minimization, and/or Mitigation Measures
2.13-28 SR-55 Improvement Project Initial Study/Environmental Assessment
considered to have higher potential MSAT effects, and a quantitative analysis of MSAT emissions is required. The results of this analysis are summarized below.
The results of the analyses are tabulated in Table 2.13.11 and included in Appendix D in the Supplemental Air Quality Analysis (2016). As speciation factors are not available for naphthalene and POM, the emissions for these pollutants are not included in Table 2.13.11. However, as with benzene, 1,3-butadiene, and formaldehyde, these pollutants are a subset of total organic gases. Therefore, the future with and without project naphthalene and POM emissions would have a similar increase or decrease as the other MSATs.
Table 2.13.11 MSAT Emissions for the SR-55 Region
Alternative
Emissions (lbs/day)
Diesel PM Benzene 1,3-Butadiene Naphthalene POM Acrolein Formaldehyde
Existing (2011) 147 39 8.2 NA NA 1.7 72
2020 No Build 26 14 2.9 NA NA 0.4 16
2020 Alt 1 31 24 3 NA NA 1 19
2020 Alt 2 31 24 3 NA NA 1 19
2020 Alt 3 31 24 3 NA NA 1 19
2020 Alt 4 31 24 3 NA NA 1 19
2020 Alt 3M 26 14 2.9 NA NA 0.6 25
2040 No Build 4 9 1.8 NA NA 0.5 13
2040 Alt 1 21 16 2 NA NA 0.5 13
2040 Alt 2 21 16 2 NA NA 0.5 13
2040 Alt 3 21 16 2 NA NA 0.5 13
2040 Alt 4 21 16 2 NA NA 0.5 13
2040 Alt 3M 4 9 1.9 NA NA 0.4 16
Source: Air Quality Assessment (2015) and Supplemental Air Quality Analysis (2016).
The analysis indicates that a substantial decrease in MSAT emissions can be expected between the existing (2011) and future (2020 and 2040) No Build conditions (No Build Alternative). This decrease is prevalent throughout the highest priority MSATs and the analyzed alternatives. This decrease is also consistent with a U.S. EPA study that projects a substantial reduction in on-highway emissions of benzene, formaldehyde, 1,3-butadiene, and acetaldehyde between 2000 and 2050. Based on the analysis for this project, reductions in MSATs expected by 2040 are: 64 percent of Diesel PM, 66 percent of benzene, 77 percent of 1,3-butadiene, 77 percent of acrolein, and 69 percent of formaldehyde. These projected reductions are achieved while total VMTs increase by 5.5 percent between 2011 and 2040 for the No Build Alternative. As shown in Table 2.13.11, implementation of the project alternatives would result in a negligible change in MSAT emissions in the project vicinity.
In summary, while the alternatives for the proposed project would result in a negligible increase in localized MSAT emissions, the U.S. EPA vehicle and fuel regulations, coupled with fleet turnover, would cause substantial reductions over time that would cause regionwide MSAT levels to be substantially lower than they are today.
Long-Term Regional Vehicle Emissions Impacts
The Build Alternatives would not generate new vehicular traffic trips because they would not include the construction of new homes or businesses. However, there is a possibility that some traffic currently utilizing other routes would be attracted to the improved facility, thus resulting in a change in regional VMT. Therefore, the potential impact of the proposed SR-
Chapter 2 Affected Environment, Environmental Consequences, and Avoidance, Minimization, and/or Mitigation Measures
SR-55 Improvement Project Initial Study/Environmental Assessment 2.13-29
55 project on regional vehicle emissions was calculated using regional traffic data and emission rates from the CT-EMFAC2014 emission model.1
Supplemental traffic data estimated the impact that the proposed project would have on regional VMT and vehicle hours traveled (VHT).
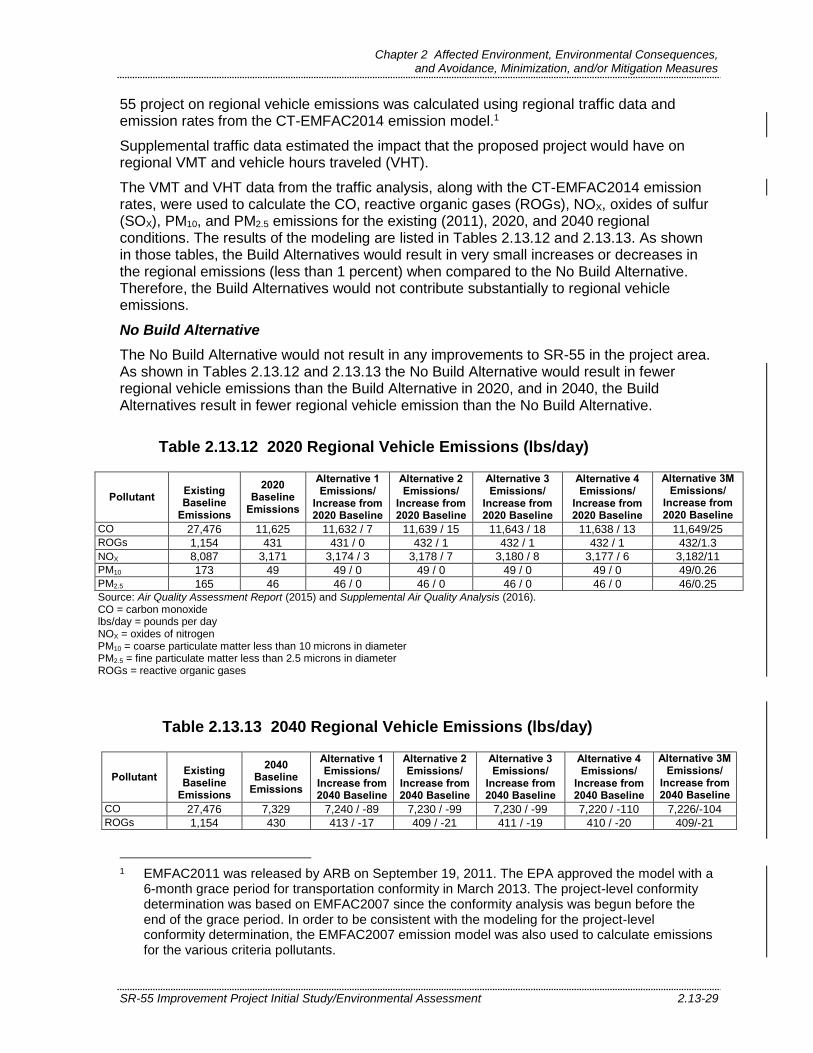
The VMT and VHT data from the traffic analysis, along with the CT-EMFAC2014 emission rates, were used to calculate the CO, reactive organic gases (ROGs), NOX, oxides of sulfur (SOX), PM10, and PM2.5 emissions for the existing (2011), 2020, and 2040 regional conditions. The results of the modeling are listed in Tables 2.13.12 and 2.13.13. As shown in those tables, the Build Alternatives would result in very small increases or decreases in the regional emissions (less than 1 percent) when compared to the No Build Alternative. Therefore, the Build Alternatives would not contribute substantially to regional vehicle emissions.
No Build Alternative
The No Build Alternative would not result in any improvements to SR-55 in the project area. As shown in Tables 2.13.12 and 2.13.13 the No Build Alternative would result in fewer regional vehicle emissions than the Build Alternative in 2020, and in 2040, the Build Alternatives result in fewer regional vehicle emission than the No Build Alternative.
Table 2.13.12 2020 Regional Vehicle Emissions (lbs/day)
Pollutant
Existing Baseline
Emissions
2020 Baseline
Emissions
Alternative 1 Emissions/
Increase from 2020 Baseline
Alternative 2 Emissions/
Increase from 2020 Baseline
Alternative 3 Emissions/
Increase from 2020 Baseline
Alternative 4 Emissions/
Increase from 2020 Baseline
Alternative 3M Emissions/
Increase from 2020 Baseline
CO 27,476 11,625 11,632 / 7 11,639 / 15 11,643 / 18 11,638 / 13 11,649/25 ROGs 1,154 431 431 / 0 432 / 1 432 / 1 432 / 1 432/1.3
NOX 8,087 3,171 3,174 / 3 3,178 / 7 3,180 / 8 3,177 / 6 3,182/11 PM10 173 49 49 / 0 49 / 0 49 / 0 49 / 0 49/0.26 PM2.5 165 46 46 / 0 46 / 0 46 / 0 46 / 0 46/0.25 Source: Air Quality Assessment Report (2015) and Supplemental Air Quality Analysis (2016). CO = carbon monoxide lbs/day = pounds per day NOX = oxides of nitrogen PM10 = coarse particulate matter less than 10 microns in diameter PM2.5 = fine particulate matter less than 2.5 microns in diameter ROGs = reactive organic gases
Table 2.13.13 2040 Regional Vehicle Emissions (lbs/day)
Pollutant
Existing Baseline
Emissions
2040 Baseline
Emissions
Alternative 1 Emissions/
Increase from 2040 Baseline
Alternative 2 Emissions/
Increase from 2040 Baseline
Alternative 3 Emissions/
Increase from 2040 Baseline
Alternative 4 Emissions/
Increase from 2040 Baseline
Alternative 3M Emissions/
Increase from 2040 Baseline
CO 27,476 7,329 7,240 / -89 7,230 / -99 7,230 / -99 7,220 / -110 7,226/-104 ROGs 1,154 430 413 / -17 409 / -21 411 / -19 410 / -20 409/-21
1 EMFAC2011 was released by ARB on September 19, 2011. The EPA approved the model with a
6-month grace period for transportation conformity in March 2013. The project-level conformity determination was based on EMFAC2007 since the conformity analysis was begun before the end of the grace period. In order to be consistent with the modeling for the project-level conformity determination, the EMFAC2007 emission model was also used to calculate emissions for the various criteria pollutants.
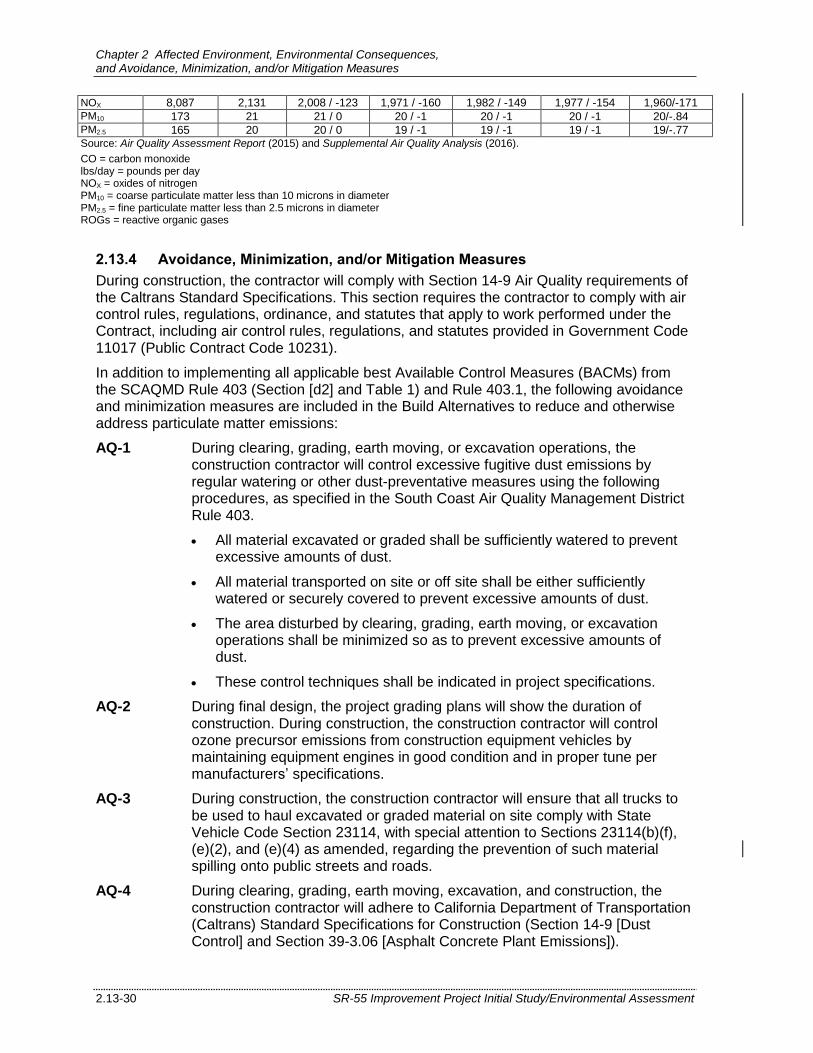
Chapter 2 Affected Environment, Environmental Consequences, and Avoidance, Minimization, and/or Mitigation Measures
2.13-30 SR-55 Improvement Project Initial Study/Environmental Assessment
NOX 8,087 2,131 2,008 / -123 1,971 / -160 1,982 / -149 1,977 / -154 1,960/-171 PM10 173 21 21 / 0 20 / -1 20 / -1 20 / -1 20/-.84 PM2.5 165 20 20 / 0 19 / -1 19 / -1 19 / -1 19/-.77 Source: Air Quality Assessment Report (2015) and Supplemental Air Quality Analysis (2016).
CO = carbon monoxide lbs/day = pounds per day NOX = oxides of nitrogen PM10 = coarse particulate matter less than 10 microns in diameter PM2.5 = fine particulate matter less than 2.5 microns in diameter ROGs = reactive organic gases
2.13.4 Avoidance, Minimization, and/or Mitigation Measures
During construction, the contractor will comply with Section 14-9 Air Quality requirements of the Caltrans Standard Specifications. This section requires the contractor to comply with air control rules, regulations, ordinance, and statutes that apply to work performed under the Contract, including air control rules, regulations, and statutes provided in Government Code 11017 (Public Contract Code 10231).
In addition to implementing all applicable best Available Control Measures (BACMs) from the SCAQMD Rule 403 (Section [d2] and Table 1) and Rule 403.1, the following avoidance and minimization measures are included in the Build Alternatives to reduce and otherwise address particulate matter emissions:
AQ-1 During clearing, grading, earth moving, or excavation operations, the construction contractor will control excessive fugitive dust emissions by regular watering or other dust-preventative measures using the following procedures, as specified in the South Coast Air Quality Management District Rule 403.
All material excavated or graded shall be sufficiently watered to prevent excessive amounts of dust.
All material transported on site or off site shall be either sufficiently watered or securely covered to prevent excessive amounts of dust.
The area disturbed by clearing, grading, earth moving, or excavation operations shall be minimized so as to prevent excessive amounts of dust.
These control techniques shall be indicated in project specifications.
AQ-2 During final design, the project grading plans will show the duration of construction. During construction, the construction contractor will control ozone precursor emissions from construction equipment vehicles by maintaining equipment engines in good condition and in proper tune per manufacturers’ specifications.
AQ-3 During construction, the construction contractor will ensure that all trucks to be used to haul excavated or graded material on site comply with State Vehicle Code Section 23114, with special attention to Sections 23114(b)(f), (e)(2), and (e)(4) as amended, regarding the prevention of such material spilling onto public streets and roads.
AQ-4 During clearing, grading, earth moving, excavation, and construction, the construction contractor will adhere to California Department of Transportation (Caltrans) Standard Specifications for Construction (Section 14-9 [Dust Control] and Section 39-3.06 [Asphalt Concrete Plant Emissions]).
Chapter 2 Affected Environment, Environmental Consequences, and Avoidance, Minimization, and/or Mitigation Measures
SR-55 Improvement Project Initial Study/Environmental Assessment 2.13-31
AQ-5 Should the project geologist determine that asbestos-containing materials (ACMs) are present in the project disturbance limits during final inspection prior to construction, the construction contractor will implement the appropriate methods to remove the ACMs prior to any ground disturbance or other construction activities in those areas.
2.13.5 Climate Change
Neither the United States Environmental Protection Agency (U.S. EPA) nor the Federal Highway Administration (FHWA) has issued explicit guidance or methods to conduct project-level greenhouse gas analysis. FHWA emphasizes concepts of resilience and sustainability in highway planning, project development, design, operations, and maintenance. Because there have been requirements set forth in California legislation and executive orders on climate change, the issue is addressed for the California Environmental Quality Act (CEQA) in Section 2.20, Climate Change, of this document. The CEQA analysis may be used to inform the National Environmental Policy Act (NEPA) determination for the project.

Chapter 2 Affected Environment, Environmental Consequences, and Avoidance, Minimization, and/or Mitigation Measures
2.13-32 SR-55 Improvement Project Initial Study/Environmental Assessment
This page intentionally left blank