210520 the role of oncology clinical pathways slides
TRANSCRIPT

May 20, 2021
1
Achieving Value-Based Care: The Role of Oncology Clinical Pathways
Proprietary and Confidential. Do not distribute. 2
Learning objectives
• At the end of this educational activity, participants should be able to:
• Examine the role of evidence-based, patient-centric clinical pathways in oncology.
• State the current status, benefits and impact of pathways in the delivery of high-quality cancer care.
• Explore the future applications, including potential challenges, of oncology clinical pathways.
• Implement clinical pathways to optimize the quality of care, cost-efficiency and health outcomes in oncology.
1
2

May 20, 2021
2
Proprietary and Confidential. Do not distribute. 3
Innovation drives new therapies
• 57 molecules with 89 oncology indications approved 2014 – 2018
• 1170 oncology clinical trials started in 2018
- 27% increase from 2017 and 68% increase from 2015
• 302 drugs approved 2009 – 2017
- 17.5% anticancer drugs
- Anticancer drugs generated more fast-track, accelerated, and priority approvals than any other therapeutic area
• 85 cancer drugs approved 2006 – 2018, based on response rates
- 14 (16%) had RR < 20%,
- 28 (33%) had an RR < 30%,
- 40 (47%) had an RR < 40%
Source: Batta A et al, J Family Med Prim Care. 2020; 9(1): 105 – 114 2. Chen EY et al, JAMA Intern Med. 2019;179(7):915-921. doi:10.1001/jamainternmed.2019.0583, 3. IQVIA Institute, Apr 2019
Proprietary and Confidential. Do not distribute. 4
$183B$201B
$222B$246B
$0
$50
$100
$150
$200
$250
$300
2015 2020 2025 2030
Spending in care in 2019 billions of dollars
34% increase
Cancer treatment costs projected to reach $246B by 20301
Financial burden of cancer care
1. Source: Mariotto AM, Enewold L, Zhao J, Zeruto, CA. Yabroff KR. Medical Care Costs Associated with Cancer Survivorship in the United States. Cancer Epidemiol Biomarkers Prev June 10- 2020 DOI: 10.1158/1056-9965.EPI-19-1534
3
4

May 20, 2021
3
Proprietary and Confidential. Do not distribute. 5
Financial burden of cancer care
• Financial issues one of the top concerns amongst cancer survivors
• In 2018, cancer patients in the U.S. paid $5.6 billion out of pocket for cancer treatments
Medicare33%
Private insurance
49%
Patient out-of-pocket
5%
Other4%
Everyone pays the cost of treatment
Sources: National Coalition for Cancer Survivorship 2020 State of Cancer Survivorship Survey: https://canceradvocacy.org/policy/2020-state-of-cancer-survivorship-survey/. Accessed 4/20/2021. Data retrieved from the Agency for Healthcare Research and Quality, Medical Expenditure Panel Survey, 2018: https://meps.ahrz.gov/mepsweb. Percentages in chart have been rounded. Accessed 4/20/2021
Proprietary and Confidential. Do not distribute. 6
Family health care costs outpace earnings
11% 29%40% 51%14%
34%50% 68%
0%
57%
119%
182%
239%
0%
56%
117%
196%
259%
0%
100%
200%
300%
400%
500%
600%
700%
1999 2003 2008 2013 2018
Cumulative increases in family premiums, workers’ contributions, inflation, and workers’ earnings
Overall Inflation Workers' Earnings Family Premiums Worker Contributions
Source: KFF Employer Health Benefits Survey, 2018; Kaiser/HRET Survey of Employer-Sponsored Health Benefits, 1999-82017. Bureau of Labor Statistics, Consumer Price Index, US City Average of Annual Inflation, 1999-2018 (April to April); Bureau of Labor Statistics, Seasonally Adjusted Data from the Current Employment Statistics Survey, 1999-2018 (April to April)
5
6

May 20, 2021
4
Proprietary and Confidential. Do not distribute. 7
Pathways: A tool for improving quality of care and outcomes
• Increase adoption of evidence-based care
• Diminish unwarranted variation in care
• Improve health outcomes
• Decrease ED visits and hospitalizations resulting from treatment toxicity
• Decrease total cost of care
Source: Clin Pathways. 2019;5(1):36-39. doi:10.25270/jcp.2019.02.00060, ASCO Clinical Pathways Resources
“High-quality oncology clinical pathways are detailed, evidence-based treatment protocols for delivering cancer care to patients with specific disease types and stages. When properly designed and implemented, oncology pathways can serve as an important tool in improving care quality and reducing costs” - ASCO: Clinical Pathways
Proprietary and Confidential. Do not distribute. 8
Guidelines are broad and inclusive
Source: National Comprehensive Cancer Network." NCCN Clinical Practice Guidelines in Oncology. Accessed March 1, 2021.
NCCN includes ~70 treatment options for first line therapy of non-small cell lung cancer
7
8
May 20, 2021
5
Proprietary and Confidential. Do not distribute. 9
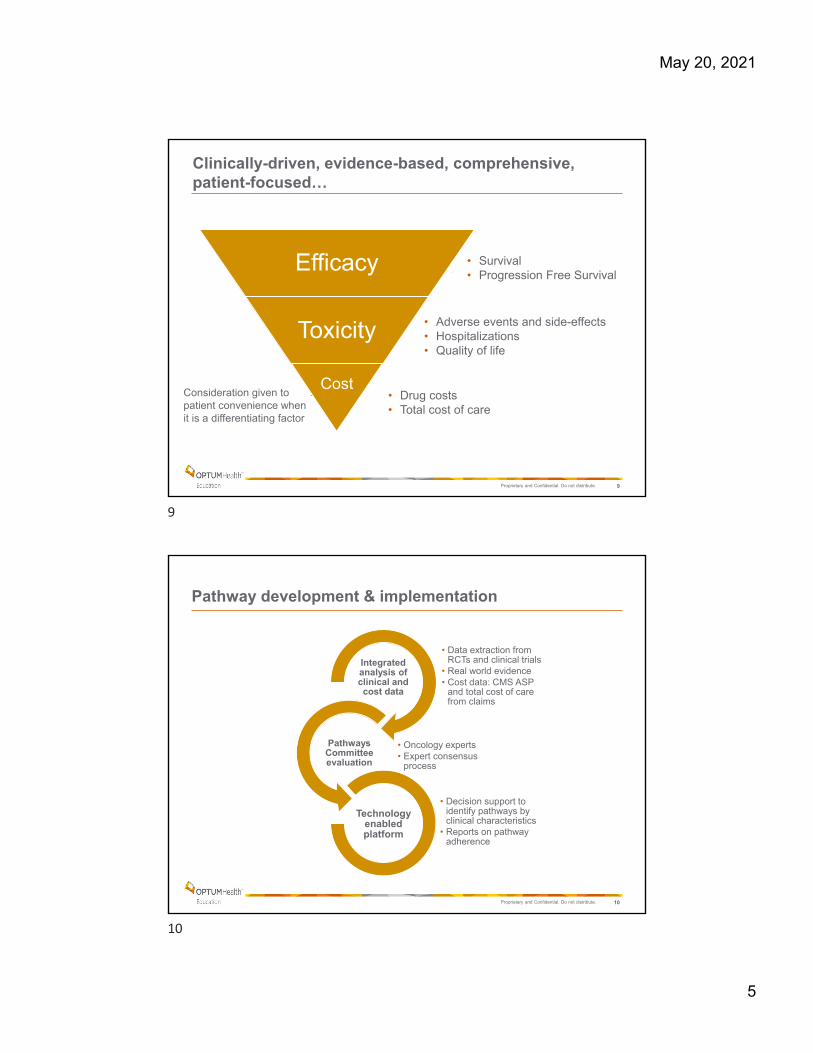
Clinically-driven, evidence-based, comprehensive, patient-focused…
• Survival• Progression Free Survival
• Adverse events and side-effects• Hospitalizations • Quality of life
• Drug costs• Total cost of care
Efficacy
Toxicity
CostConsideration given to patient convenience when it is a differentiating factor
Proprietary and Confidential. Do not distribute. 10
Pathway development & implementation
• Data extraction from RCTs and clinical trials
• Real world evidence• Cost data: CMS ASP
and total cost of care from claims
Integrated analysis of clinical and cost data
• Oncology experts• Expert consensus
process
Pathways Committee evaluation
• Decision support to identify pathways by clinical characteristics
• Reports on pathway adherence
Technology enabled platform
9
10

May 20, 2021
6
Proprietary and Confidential. Do not distribute. 11
ASCO best practices for pathways
Criteria focus on 3 key areas: • Development• Implementation and use• Analytics
Source: ASCO: https://www.asco.org/sites/new-www.asco.org/files/content-files/ASCO-Clinical-Pathways-Checklist.pdf. Accessed 4/20/21
Proprietary and Confidential. Do not distribute. 12
RegimenOS
(months)Toxicity
HospitalizationIncidence*
Drug Cost (monthly)§
Median (Mean) duration (days)*
Total Cost of Care*
FOLFIRINOX 11.1
FN – 5%Vomiting – 15%Diarrhea – 13%Neuropathy – 9%
34% $300 85 (112) $87,971
Gemcitabine + nab-paclitaxel 8.5
FN – 3%Diarrhea – 6%Vomiting – NRNeuropathy – 17%
37% $8,139 80 (101) $80,132
Gemcitabine + Erlotinib 6.2
Diarrhea – 6%Infections – 17% No data $7,629 No data No data
Gemcitabine + Capecitabine
7.1Vomiting – 6%Diarrhea – 5%Hand Foot Syndrome – 4%
No data $837 No data No data
Gemcitabine6.8
FN – 1%Vomiting – 8%Diarrhea – 2%Neuropathy – 0%
37% $157 40 (62) $35,083
Capecitabine 6.0Vomiting – 5%Diarrhea – 16% Hand Foot Syndrome – 17%
No data $794 No data No data
5-FU 4.4Vomiting – 5%Diarrhea – 5% No data $24 No data No data
Pathways development case studyMetastatic Pancreas Cancer – 1st line
*UHC data§ CMS Average Sales Price (April 2019) or WAC
Source: Conroy NEJM 2011; Mahaseth Pancreas 2013; Von Hoff NEJM 2013; Moore JCO 2007; Sinn JCO 2017; Cunningham JCO 2009; Herrmann JCO 2007; Colucci JCO 2007; Rothenberg Annals Onc 1996; Cartwright JCO 2002; Burris JCO 1997
= UHC Pathway regimen
11
12

May 20, 2021
7
Proprietary and Confidential. Do not distribute. 13
Regimen OS (months) PFS (months) ToxicityDrug Cost (monthly)§
Erlotinib 22.8 – 31.8 10.2-13.1Nausea/Vomiting: 0%Diarrhea: 5%Interstitial lung disease: 2%
$4,640
Gefitinib 26.8 - 31.8 9.2 – 10.2Nausea/Vomiting: <1%Diarrhea: 4%Interstitial lung disease: 3%
$7,800
Dacomitinib 34.1 14.7Nausea/Vomiting: 1%Diarrhea: 9%Interstitial lung disease: 1%
$12,400
Afatinib 23.1 - 31.6 11.0Nausea/Vomiting: 1%Diarrhea: 5- 14%Interstitial lung disease: 1%
$8,800
Osimertinib 38.6 18.9
Nausea/Vomiting: 1%Diarrhea: 2%Interstitial lung disease: 4%QT prolong: 2%
$14,900
Erlotinib + Ramucirumab
‘not reached’ 19.4
Nausea/Vomiting: 1%Diarrhea: 7%Hypertension: 24%Pneumonia: 3%Interstitial lung disease: <1%
$26,050
Pathways development case study:Metastatic Lung Cancer – EGFR +
§ CMS Average Sales Price (April 2019) or WAC
Source: Rosell Lancet Oncology 2012; Zhou Annals Onc 2015; Soria NEJM 2018; Ramalingam ESMO 2019; Mok NEJM 2009; Inoue NEJM 2013; Wu Lancet Oncol 2017; Mok JCO 2018; Urata JCO 2016; Sequist JCO 2013; Wu Lancet Oncol 2014; Yang Lancet Oncol 2015; Paz-Ares Annals Oncol 2017; Planchard Clin Cancer Res2019; Mok NEJM 2017; Nakagawa Lancet Oncol 2019; Saito Lancet Oncol 2019; Holleman Onco Targets Ther 2019.
= UHC Pathway regimen
Proprietary and Confidential. Do not distribute. 14
Regimen OS DFS/iDFS ToxicityHospitalization
Incidence*Total Drug
Cost§
Median (Mean) duration (days)*
Total Cost of Care*
AC TH 3yr: 94%A3yr: 96%
3yr DFS: 87% A3yr iDFS: 93%
FN: 11%Diarrhea: 3% Neuropathy: 1%CHF: <1%
11% $87,070 274 (280) $180,164
AC TH-PNo DataA3yr: 97%
No DataA3yr iDFS: 94%
FN: 13%Diarrhea: 8%Neuropathy: NRCHF: <1%
25% $184,398 300 (284) $279,114
Paclitaxel wkly +Trastuzumab
NR3yr iDFS: 99% (Stage 1)
FN: NRDiarrhea: 2%Neuropathy: 3%CHF: <1%
8% $85,318 223 (216) $134,108
TCH5yr: 91% A3yr: 96%
5yr DFS: 81%A3yr iDFS: 93%
FN: 10-12%Diarrhea: 5-6%CHF: <1%Decrease LVEF: 9%
13% $114,268 252 (229) $166,371
TCH-P No DataA3yr: 97%
No DataA3yr iDFS: 94%
FN: 10%Diarrhea: 18%CHF: <1%
24% $211,656 231 (228) $232,803
AC docetaxel+ trastuzumab
5yr: 92% 5yr DFS: 84%
FN: 11%Diarrhea: 6%CHF: 2%Decrease LVEF: 19%
33% $87,650 378 (335) $221,046
Pathways development case study:Her2 + Breast Cancer – Adjuvant
A Data not specific to chemotherapy regimen reported in APHINITY trial*UHC data § CMS Average Sales Price (April 2019) or WAC
Source: Romond NEJM 2005; Perez JCO 2014; Piccart-Gebhart NEJM 2005; Cameron Lancet 2017; Gianni Lancet Oncol. 2014; Von MinckwitzNEJM 2017; Tolaney NEJM 2015; Slamon NEJM 2011; Burstein JCO 2012; Schneeweiss Ann Oncol 2013.
= UHC Pathway regimen
13
14

May 20, 2021
8
Proprietary and Confidential. Do not distribute. 15
Chemotherapy + Trastuzumab + Pertuzumab
Chemotherapy + Trastuzumab
Evaluation
Efficacy 3yr OS: 97% 6yr OS: 95%3yr invasive DFS: 94%6yr invasive DFS: 91%LN + iDFS: 88%
3yr OS: 96% 6yr OS: 94%3yr invasive DFS: 93%6yr invasive DFS: 88%
LN+ iDFS: 83%
No difference in OS (p=0.17)1% absolute benefit in iDFS at 3 years and 3% (4.5% in LN+) at 6 years that did not translate to OS increase not clinically meaningful.
Toxicity
Grade 3/4
Febrile neutropenia: 10 - 13%Diarrhea: 8 - 18%NYHA class III/IV CHF: 0.4 - 0.7%Cardiac events: 0.4% - 0.8%
Febrile neutropenia: 10% - 12%Diarrhea: 3 - 6%NYHA class III/IV CHF: 0.2 - 0.3%Cardiac events: 0.2 - 0.4%
Increase in toxicity with pertuzumab primarily related to diarrhea.
Hospitalization Incidence*
24% 12% Although studies report minimal toxicity difference, 12% increase in hospitalizations associated with pertuzumab containing regimens in RWE.
Drug Cost§ $184,400 - $211,600 $85,300 - $114,200 >$100,000
Total Cost* $232,800- $279,100 $134,100 - $180,100 >$100,000
Pathways development case study:Her2 + Breast Cancer – Adjuvant
Evaluating impact of pertuzumab on efficacy, toxicity and cost
Source: Von Minckwitz NEJM 2017
Chemotherapy = FEC/FAC docetaxel or paclitaxel, AC/EC docetaxel or paclitaxel; or docetaxel/carboplatin
*UHC data§ CMS Average Sales Price (April 2019) or WAC
Proprietary and Confidential. Do not distribute. 16
Improved outcomes with pathways Colorectal cancer survival
1-yr DFS (adjuvant therapy for stage III CRC): 91% (on-pathway) vs 72% (off-pathway)
1-yr OS (1st line therapy for metastatic CRC): 80% (on-pathway) vs 74% (off-pathway)
Retrospective study evaluated clinical outcomes and the economic impact of pathway adherence in the treatment of colon cancer
Source: Hoverman JR et al. J Oncol Pract 2011; J Oncol Pract. 2011 May;7(3 Suppl):52s-9s.
15
16

May 20, 2021
9
Proprietary and Confidential. Do not distribute. 17
1-yr OS pre-pathway vs. post-pathway
Introduction of Dana-Farber Cancer Institute (DFCI) Pathways for non–small cell lung cancer in January 2014 was associated with improved overall survival (10.7 months before v 11.2 months after pathways) although the difference was not statistically significant (P = 0.08).
Improved outcomes with pathways Stage IV lung cancer survival
Source: Jackman et al. J Oncol Pract. 2017 Apr;13(4):e346-e352.
Proprietary and Confidential. Do not distribute. 18
Introduction of Dana-Farber Cancer Institute (DFCI) Pathways for non–small cell lung cancer in January 2014 was associated with decreased health care costs
Improved outcomes with pathways Stage IV lung cancer cost
Source: Jackman et al. J Oncol Pract. 2017 Apr;13(4):e346-e352.
Cost analysis for patients with Stage IV non-small-cell lung cancer before and after pathways
17
18

May 20, 2021
10
Proprietary and Confidential. Do not distribute. 19
Improved outcomes with pathways
0.727
0.9260.989
0.040.135
0.21
-0.004
0.017 0.011
0.764
1.079
1.19
-0.2
0
0.2
0.4
0.6
0.8
1
1.2
1.4
Year 1 Year 2 Year 3
Drugs Inpatient ED Total
Pathway adherence leads to saving on drugs, inpatient admissions, ED visits
ED indicates emergency department. Source: Hoverman JR, Klein I. Harrison DW, et al. J Oncol Pract 2014; 10(1):63-67
Proprietary and Confidential. Do not distribute. 20
Tracking your practice’s pathways adherence
19
20

May 20, 2021
11
Proprietary and Confidential. Do not distribute. 21
Pathway P4P program associated with increased evidence-based regimen prescribing
A national pathways pay for performance (P4P) program was associated with an increase in evidence-based regimens prescribing from 57% to 62% (P < .001)
Source: Bekelman et al. Journal of Clinical Oncology 2020 384055-4063.
0.8
0.9
1
1.1
1.2
1.3
1.4
1.5
1.6
> 12 monthsbefore
12 – 6 monthsbefore
0 – 6 monthsafter
6 – 12 monthsafter
> 12 monthsafter
Ad
just
ed
odd
s ra
tio f
or
pre
scrib
ing
pro
gra
m-
en
do
rsed
evi
de
nce
-bas
ed
dru
g re
gim
en
s (9
5%
CI)
Time passage relative to 6-month period immediately before rollout in each region
Rollout date in each region
Proprietary and Confidential. Do not distribute. 22
Sharing best practices
Driving performance across US oncology network
• Embedded UHC Cancer Therapy Pathways into Clear Value Plus
• Enabled point-of-care clinical decision support for providers using iKnowMedG1/G2
EHR interoperability
• Provide direct training to staff responsible for requesting prior authorizations
• Clearly define the unique prior authorization workflow and pathways selection necessary to meets UHC’s reimbursement requirements
• Created a guide to help Providers and Pharmacists easily compare the UHC Pathways to The US Oncology Network Value Pathways
Focused training
• Access the UHC Performance Dashboard monthly to monitor performance
• Review past prior authorization requests to determine the cause of non-concordance regimen selections and follow-up with staff and providers as needed
Trust but verify
21
22

May 20, 2021
12
Proprietary and Confidential. Do not distribute. 23
Resources
• ASCO-Clinical-Pathways-Checklist.pdf
• American Society of Clinical Oncology Criteria for High-Quality Clinical Pathways in Oncology | JCO Oncology Practice (ascopubs.org)
• UnitedHealthcare Cancer Therapy Pathways Program (uhcprovider.com)
Thank You.
Contact information
Name, Title
Telephone number
Email address
23
24