21 more graphs and equations
TRANSCRIPT

21 MORE GRAPHS AND EQUATIONS
502502
In this chapter you will: recognise and draw graphs of quadratic
functions use graphs to solve quadratic equations recognise and draw graphs of cubic, reciprocal
and exponential functions fi nd approximate solutions of equations by using
a systematic method.
Different-shaped curves are seen in many areas of mathematics, science, engineering and the social sciences. For example, Galileo showed that if an object is thrown it traces out a type of curve called a parabola. Many bridges are also built in the shape of a parabola. The bridge in the photo is the Butterfl y Bridge in Bedford and it actually has two arches, both in the shape of a parabola.
Objectives Before you start
You should be able to: draw straight-line graphs work out the value of a given expression by
substituting values.
HI-RES STILL TO
BE SUPPLIED

503area formula square rectangle triangle parallelogramquadratic function parabola minimum point maximum point line of symmetry 503
21.1 Graphs of quadratic functions
You can recognise and draw graphs of quadratic functions.
You can use graphs to solve quadratic equations.
Objectives
You can use quadratic functions to represent the path of projectiles, such as the trajectory of a cannonball or of a drop-goal in rugby.
Why do this?
1. Draw the graph of y 2x 3 for values of x from 3 to 3.2. Work out the value of x2 5 when a x 1 b x 33. Work out the value of 2x2 when a x 1 b x 3
Get Ready
A quadratic function (or expression) is one in which the highest power of x is x2.
All quadratic functions can be written in the form ax2 bx c where a, b and c represent numbers.Examples of quadratic functions include x2 1, x2 2x 3, 3x2 x 2, and 3 x2.
The graph of a quadratic function is called a parabola. It has a smooth or shape according to whethera 0 or a 0.
The lowest point of a quadratic graph is where the graph turns, and is called the minimum point.
The highest point of a quadratic graph is where the graph turns, and is called the maximum point.
All quadratic graphs have a line of symmetry.
You can solve quadratic equations by using a quadratic graph.
You can solve quadratic equations of the form ax2 bx c 0 by reading off the x-coordinate where y ax2 bx c crosses the x-axis.
You can solve quadratic equations of the form ax2 bx c mx k by reading off the x-coordinate at the point of intersection of y ax2 bx c with the straight-line graph y mx k.
Key Points
Draw the graph of y x2 1 taking values of x from 3 to 3.
When x 3, y 3 3 1 10When x 2, y 2 2 1 5When x 1, y 1 1 1 2When x 0, y 0 0 1 1When x 1, y (1) (1) 1 2When x 2, y (2) (2) 1 5When x 3, y (3) (3) 1 10
x 3 2 1 0 1 2 3
y 10 5 2 1 2 5 10
Example 1
Work out the value of y for each value of x.
Put negative values of x in brackets when substituting them.
21.1 Graphs of quadratic functions
These results can be shown in a table of values.

Chapter 21 More graphs and equations
504 table of values
a Complete the table of values for y x2 2x 4.
x 2 1 0 1 2 3 4
y 1 4 1
b Draw the graph of y x2 2x 4 for x 2 to x 4.c Write down the equation of the line of symmetry of this curve.d Write down the values of x where the graph crosses the x-axis.
a When x 4, y 42 2 4 4 16 8 4 4When x 2, y 22 2 2 4 4 4 4 4When x 1, y 12 2 1 4 1 2 4 5When x 2, y (2)2 2 (2) 4 4 4 4 4
x 2 1 0 1 2 3 4
y 4 1 4 5 4 1 4
b
c The line of symmetry has equation x 1.d x 1.2 and x 3.2
Example 2
Be careful to plot the points accurately.Use a sharp pencil cross for each point.Join your points with a smooth curve.
�1
1
�4 �3 �2 �1 1O 2
y � x2 � 1
3 4
2
3
4
5
6
7
8
9
10
x
y
�6
�4
�2 2
y � x2 � 2x � 4
x � 3.2x � �1.2
4
�2
2
4
x
y
O
Work out the value of y for each value of x in turn.
Look at the values of y in the table to determine the extent of the y-axis.Use values of 6 to 5.
Draw a smooth symmetrical curve through all the plo� ed points.
The curve has a line of symmetry.
Read off the values where the curve crosses the x-axis.
This is the minimum point.
Examiner’s Tip
Make sure your curve passes through all the points.

505
21.1 Graphs of quadratic functions
1 Here is the table of values for y x2 3.
x 3 2 1 0 1 2 3
y 6 2 3 6
a Copy and complete the table of values.b Draw the graph of y x2 3 for x 3 to x 3.c Write down the equation of the line of symmetry of your graph.d Write down the coordinates of the minimum point.
2 a Copy and complete the table of values for y 4 x2.
x 3 2 1 0 1 2 3
y 8 5 4 13
b Draw the graph of y 4 x2 for x 3 to x 3.c Write down the coordinates of the minimum point.d Write down the values of x where the graph crosses the x-axis.
3 a Copy and complete the table of values for y 2x2 2.
x 3 2 1 0 1 2 3
y 20 4 2 20
b Draw the graph of y 2x2 2 for x 3 to x 3.c Use your graph to fi nd:
i the value of y when x 1.5 ii the two values of x when y 11.
4 a Make a table of values for y x2 x, taking values of x from 3 to 4.b Draw the graph of y x2 x.c Label the minimum point M with a cross.d Use your graph to fi nd an estimate for the minimum value of y.
5 Here is the table of values for y x2 2x 3.
x 4 3 2 1 0 1 2
y 2 6 6 3
a Copy and complete the table of values.b Draw the graph of y x2 2x 3 for x 4 to x 2.c Write down the equation of the line of symmetry of your graph.d Use your graph to fi nd:
i the value of y when x 0.5 ii the two values of x when y 1.
Exercise 21A Questions in this chapter are targeted at the grades indicated.
B

Chapter 21 More graphs and equations
506
6 Draw the graph for each of the following equations.a y x2 4x 1 for values of x from 2 to 6b y 2x2 4x 3 for values of x from 2 to 4c y (x 2)2 for values of x from 6 to 2d y 5 3x 2x2 for values of x from 2 to 4For each case use your graphs to:
i write down the values of x when the graph crosses the x-axis ii draw in and write down the equation of the line of symmetry.
Here is the graph of y x2 2x 2.
a Use the graph to solve the equation x2 2x 2 0.Give your answers correct to 1 decimal place.
b Use the graph to solve the equation x2 2x 5 0.Give your answers correct to 1 decimal place.
a
x2 2x 2 0
x 0.7 andx 2.7
b
x2 2x 5 0
x2 2x 2 3
x 1.4 andx 3.4
Example 3
Find where the graph crosses the x-axis – that is where y 0.
Read off the values.
Rearrange the equation so that one side is x2 2x 2.
Add 3 to each side of the equation.Find wherex2 2x 2intersects y 3.
Read off the x values.
�4
�2
2
�2 2
y � x2 � 2x � 2
4
4
6
x
y
O
�4
�2
2
�2 2
y � x2 � 2x � 2
4
4
6
x
y
O
�4
�2
2
�2 2
y � x2 � 2x � 2
y � 3
4
4
6
x
y
O
B
507
21.1 Graphs of quadratic functions
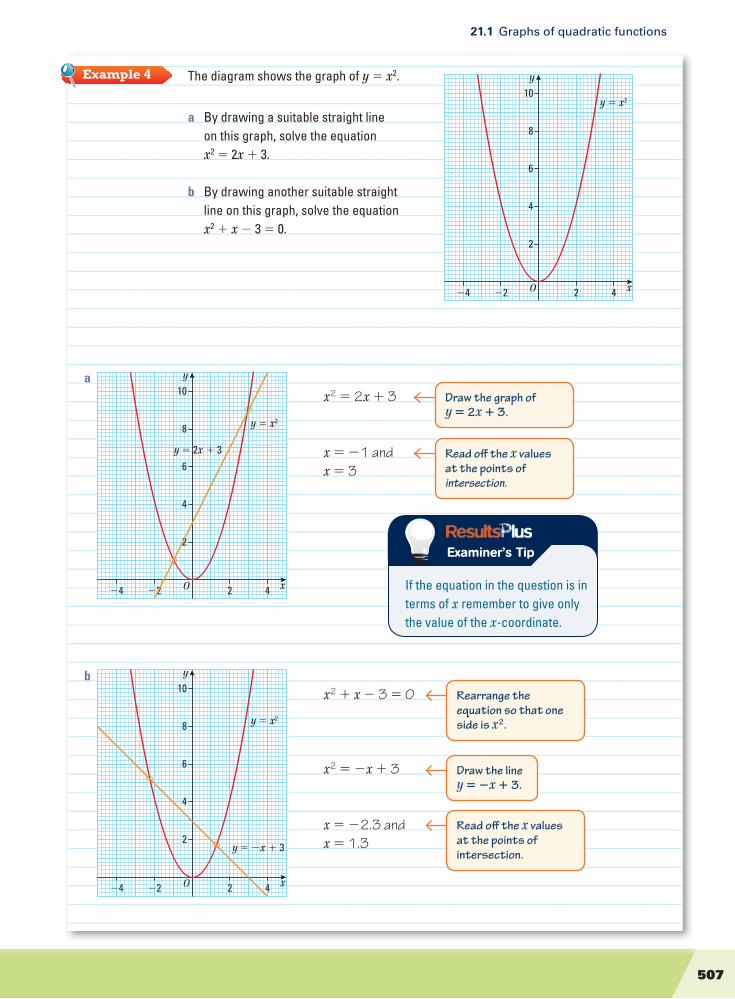
The diagram shows the graph of y x2.
a By drawing a suitable straight line on this graph, solve the equation x2 2x 3.
b By drawing another suitable straight line on this graph, solve the equation x2 x 3 0.
a x2 2x 3
x 1 andx 3
b x2 x 3 0
x2 x 3
x 2.3 andx 1.3
Example 4
2
4
6
�2�4 2
y � x2
4
8
10
x
y
O
Rearrange the equation so that one side is x2.
Draw the line y x 3.
Read off the x values at the points of intersection.
2
4
6
�2�4 2
y � x2
y � 2x � 3
4
8
10
x
y
O
2
4
6
�2�4 2
y � x2
y � �x � 3
4
8
10
x
y
O
Draw the graph of y 2x 3.
Read off the x values at the points of intersection.
Examiner’s Tip
If the equation in the question is in terms of x remember to give only the value of the x-coordinate.

Chapter 21 More graphs and equations
508
1 Here are four graphs.
Use these graphs to solve the equationsa 3x x2 0 b x2 3x 4 0c 2x2 3x 7 0 d 6 2x x2 0
2 Use the graphs in question 1 to solve the equations a 3x x2 1 b x2 3x 4 5c 2x2 3x 10 0 d 4 2x x2 0
3 a Copy and complete the table of values for y x2 3x 4.
x 5 4 3 2 1 0 1 2
y 6 0 6 4
b Draw the graph of y x2 3x 4.c Use your graph to solve the equation x2 3x 4 2.d By drawing a suitable straight line on your graph, solve the equation x2 3x 4 x 1.
Exercise 21B
�4
�2
�2 2
y � 3x � x2
4 6
2
x
y
O
�4
�6
�2
�2 2
y � x2 � 3x � 4
4 6
2
x
y
O
�4
�6
�8
�10
�2
�2 2
y � 2x2 � 3x � 7
4
2
4
x
y
O
�4
�2
�2�4 2
y � 6 � 2x � x2
4 6
2
4
6
8
x
y
O
BAO2
AO2
AO2AO3

509cubic function
21.2 Graphs of cubic functions
4 Here is a table of values for y 1 2x x2.
x 2 1 0 1 2 3 4
y 2 2 1 7a Copy and complete the table.b Draw the graph of y 1 2x x2.c By drawing a suitable line on your graph, solve the equation 2 4x 2x2 2 2x.
5 a Make a table of values for y 3x2 x 2, taking values of x from 3 to 3. b Draw the graph of y 3x2 x 2.c By drawing a suitable line on your graph, solve the equation 3x2 3x 2 0.
21.2 Graphs of cubic functions
You can recognise and draw graphs of cubic functions.
Objective
Engineers use cubic models, for example, when testing the strength of rubber in car tyres.
Why do this?
1. Write down the fi rst fi ve cube numbers. 2. Work out the value of x3 when
a x 10 b x 10
Get Ready
A cubic function (or expression) is one in which the highest power of x is x3.
All cubic functions can be written in the form ax3 bx2 cx d where a, b, c and d represent numbers.Examples of cubic functions include 4 x3 and x3 2x2 3.
The graph of a cubic function has one of the following shapes. for a 0 for a 0
To draw the graph of a cubic function, make a table of values, then plot the points from your table and join them with a smooth curve.
Key Points
y
xO
y
xO
y
xO
y
xO
BAO3
AO3

Chapter 21 More graphs and equations
510
a Complete the table of values for y 2x3.
x 2 1.5 1 0.5 0 0.5 1 1.5 2
y 16 0.25 0 2 6.75
b Draw the graph of y 2x3 for 2 x 2.
a When x 2, y 2 23 2 8 16
When x 0.5, y 2 (0.5)3 2 0.125 0.25When x 1, y 2 (1)3 2 1 2When x 1.5, y 2 (1.5)3 2 3.375 6.75
x 2 1.5 1 0.5 0 0.5 1 1.5 2
y 16 6.75 2 0.25 0 0.25 2 6.75 16
b
Example 5
Substitute x 2, into y 2x3 and work out the value.
Repeat the process for x 0.5, x 1 and x 1.5.
Plot the points accurately.Join the points with a smooth curve.
�8
�12
�16
�20
�4
�2 2
y � 2x3
4
8
12
16
20
x
y
O

511
21.2 Graphs of cubic functions
a Draw the graph of y x3 4x2 5 for 2 x 5.b Use your graph to solve the equation x3 4x2 x 5 0.
a When x 5, y 53 4 52 5 30When x 4, y 43 4 42 5 5When x 3, y 33 4 32 5 4When x 2, y 23 4 22 5 3When x 1, y 13 4 12 5 2When x 0, y 03 4 02 5 5When x 1, y (1)3 4 (1)2 5 0When x 2, y (2)3 4 (2)2 5 19
x 2 1 0 1 2 3 4 5
y 19 0 5 2 3 4 5 30
b x3 4x2 x 5 0x3 4x2 5 x
The solutions are x 1.1, x 1.1 and x 3.8.
Example 6
Work out y for each value of x.
�8
�12
�16
�20
�4
�2 2 4 6
y � x3 � 4x2 � 5
y � x4
8
12
16
20
24
28
32
x
y
O
Plot the points and draw a smooth curve through all the points.
Draw y x on the graph and fi nd where it intersects withy x3 4x2 5.
Compare the expression to y x3 4x2 5.Add x to each side of the equation.
Make a table of values.
Examiner’s Tip
Take care drawing the graph of y x if there are different scales on the axes.

Chapter 21 More graphs and equations
512
1 a Copy and complete the table of values for y x3 2.
x 3 2 1 0 1 2 3
y
b Draw the graph of y x3 2 for 3 x 3.c Use your graph to fi nd the value of y when x 2.5.
2 Here is a table of values for y x3 9x.
x 4 3 2 1 0 1 2 3 4
y 28 0 8 0 10 28
a Copy and complete the table.b Draw the graph of y x3 9x for 4 x 4.c Use your graph to fi nd the solutions to the equation x3 9x 0.
3 a Copy and complete the table of values for y 12x 3x2 2x3.
x 3 2 1 0 1 2 3 4
y +45 7 +13 20 32
b Draw the graph of y 12x 3x2 2x3 for 3 x 4.c By drawing a suitable line on your diagram,
solve the equation 12x 3x2 2x3 2x 1.
4 Here are four graphs. A B
Exercise 21C
�20
�25
�30
�10
�15
�5
10
�2�4 2 4
20
30
5
15
25
x
y
O
�20
�25
�30
�10
�15
�5
10
�2�4 2 4
20
30
5
15
25
x
y
O
B
AAO2
AO3
AO2AO3

513reciprocal function
21.3 Graphs of reciprocal functions
C D
Here are four equations i y x3 3x2 9x ii y x3 x2 8x 12 iii y 2x 3x2 x3 iv y 9 9x x2 x3
Match each equation to one of the graphs.Give reasons for your answers.
�20
�25
�30
�10
�15
�5
10
�2 2 4 6
20
30
5
15
25
x
y
O
�20
�25
�30
�10
�15
�5
10
�2 2 4
20
30
5
15
25
x
y
O
21.3 Graphs of reciprocal functions
You can recognise and draw graphs of reciprocal functions.
Objective
You might see a reciprocal graph if you’re doing an experiment on volume and pressure. If you compress gas in a container, the volume will decrease but the pressure will increase, and vice-versa.
Why do this?
1. Work out the value of 1 __ x when
a x 4 b x 1 _ 4 c x 2.5 d x 0.4
2. Explain what happens to the value of 1 __ x as x gets bigger.
Get Ready
The reciprocal of x is 1 __ x 1 x.
Expressions of the form k __ x , where k is a number are called reciprocal functions.
The reciprocal of 0 is not defi ned since division by 0 is not possible.
This means that the graph of y 1 __ x does not have a point on the y-axis where x 0.
Key Points
A

Chapter 21 More graphs and equations
514 discontinuous
The graphs of reciprocal functions have similar shapes. They are discontinuous and have two parts. They do not cross or touch the x-axis or the y-axis, but get nearer and nearer to them. We say that the axes are
asymptotes to the graphs. Here are the general shapes of reciprocal functions of the form y k __
x .
x
y
O
k � O
x
y
O
k � O
a Draw the graph of y 1 __ x where x 0.
b Write down the equations of any lines of symmetry of the graph.
a
b
Example 7
x 4 3 2 1 1 __ 2 1 __ 4 1 __ 4 1 __ 2 1 2 3 4
y 1 __ 4 1 __ 3 1 __ 2 1 2 4 4 2 1 1 __ 2 1 __ 3 1 __ 4
Plot the points and join the two parts with smooth curves.
Make a table of values.
The equations of the lines of symmetry of the graph are y x and y x.
�4
�2
�2�4 2 4
y �
2
4
x
y
O
1x
�4
�2
�2�4 2 4
y �
y � x
y � �x
2
4
x
y
O
1x

515exponential functions continuous
21.4 Graphs of exponential functions
1 a Copy and complete the table of values for y 5 __ x for 0 x 20.
x 0.2 0.4 0.5 1 2 4 5 10 20
y 25 12.5 5 2.5 0.5
b Using your answer to part a, copy and complete the following table of values for
y 5 __ x for 20 x 0.
x 20 10 5 4 2 1 0.5 0.4 0.2
y
c Draw the graph of y 5 __ x for 20 x 20.
2 Draw the graph of y 2 __ x for 10 x 10.
3 a Draw the graph of y 12 _____ x 1 for 5 x 3.
b Write down the value of x for which y 12 _____ x 1 is not defi ned.
Exercise 21D
21.4 Graphs of exponential functions
You can recognise and draw graphs of exponential functions.
Objective
Scientists work out how quickly radioactive materials will break down using a graph of their radioactive half-life, which is an exponential graph.
Why do this?
1. Work out the values ofa 34 b 30 c 32
2. Find the value of x in each of these equations.a 2x 16 b 5x 25 c 10x 1000
Get Ready
Expressions of the form ax, where a is a positive number are called exponential functions. Examples are 2x, 10x, (� 1 _ 2 ) x and (1.05)x.
The graphs of exponential functions have similar shapes. They are continuous and always lie above the x-axis. They increase very quickly at one end and get nearer and nearer to the x-axis at the other end.
Key Points
B
A
A
AO3
AO3

Chapter 21 More graphs and equations
516
They cross the y-axis at (0, 1) since a0 1 for all values of a. Here are the general shapes of exponential functions of the form y ax and y ax.
x
1
y � axy
O x
1
y
O
y � a�x
a Draw the graph of y 2x, for values of x from 3 to 3.b Use your graph to fi nd an estimate for the solution of the equation 2x 6.
a When x 0, y 20 1
When x 1, y 21 2
When x 2, y 22 4
When x 3, y 23 8
When x 1, y 21 1 __ 21 0.5
When x 2, y 22 1 __ 22 0.25
When x 3, y 23 1 __ 23 0.125
x 3 2 1 0 1 2 3
y 0.125 0.25 0.5 1 2 4 8
b x 2.6
Example 8
Substitute x 0 into y 2x and work out the value.
Repeat the process for other integer values of x.
Use the result an 1 ___ an to work out the values for
negative values of x (see Unit 2 section 5.1).
Make a table of values.
Draw the graph from the table of values.
�2 2
2
4
y � 2x
6
8
x
y
O
Use your graph to fi nd the value of x when y 6.
Examiner’s Tip
Make sure your curve gets nearer and nearer to the x-axis without touching it.

517
21.4 Graphs of exponential functions
The sketch shows part of the graph of y pqx. The points with coordinates (0, 5) and (2, 45) lie on the graph.a Work out the value of p and of q.b Find the value of y when x 3.
a y pqx
The point (0, 5) lies on the graph so 5 p q0
5 p 1 p 5
So the equation of the curve is y 5qx.The point (2, 45) also lies on the graph so
45 5 q2 9 q2
q 3p 5, q 3
b y pqx so y 5 3x
When x 3 y 5 33
5 27 135 y 135
Example 9
Substitute x 0, y 5 into y pqx.Use the result q0 1.
x
5
(2, 45)
y
O
Put x 3 into y 5 3x.
Substitute p 5, q 3 into y pqx.
Substitute x 2, y 45.Solve the equation.Work out the positive value of q.
1 a Copy and complete the table of values for y 3x. Give the values correct to 2 decimal places.
x 3 2 1 0 1 2 3
y 0.04 0.33 3 27
b Draw the graph of y 3x for 3 x 3.c Use your graph to fi nd an estimate for:
i the value of y when x 1.5 ii the value of x when y 15.
2 The diagram shows the graphs of y 2x, y 5x, y (� 1 _ 2 ) x and y 3x.
Match each graph to its equation.
Exercise 21E
x
y
1
2
3
4
5
�5 �4 �3 �2 �1 1 2 3 4 5
A B C D
A
AAO3

Chapter 21 More graphs and equations
518 trial and improvement approximation method of trial and improvement
3 The number of bacteria, n, after time t minutes is modelled by the equation n 10 2t. a Work out the number of bacteria initially (when t 0).b Work out the number of bacteria after 5 minutes.c Find the time taken for the number of bacteria to increase to one million. Give your answer to the
nearest minute.
4 The points with coordinates (1, 10) and (3, 2560) lie on the graph with equation y pqx where p and q are constants. Work out the values of p and q.
21.5 Solving equations by the trial and improvement method
You can use a systematic method to solve an equation to any degree of accuracy.
Objectives
Computers can be programmed to solve complex equations using the trial and improvement method.
Why do this?
1. Write these numbers correct to 1 decimal place (1 d.p.).a 4.613 b 2.157 c 1.498
2. Show that x 1 is a solution of the equation x 1 __ x 2
3. Work out the value of x3 3x when a x 1 b x 2
Get Ready
A trial and improvement method is a systematic way of fi nding solutions of equations to any degree of accuracy.
A fi rst approximation is found for the solution then the method of trial and improvement is used to obtain a more accurate answer. The process can be repeated in order to get closer to the correct value.
Key Points
a Show that the equation x3 2x 15 has a solution between 2 and 3.b Use a trial and improvement method to fi nd this solution correct to 1 decimal place.
a x x3 2x Too high or too low Comment2 23 2 2 4 too low since 4 is x is greater less than 15 than 2
3 33 2 3 21 too high since 21 x is between is more than 15 2 and 3
So the solution is between x 2 and x 3 since when x 2, x3 2x is too low and when x 3, x3 2x is too high.
Example 10
Substitute x 2 into the left-hand side of the equation and compare your answer with 15.
Substitute x 3 into the left-hand side of the equation and compare your answer with 15.
AAO3
AO3

519consecutive numbers
21.5 Solving equations by the trial and improvement method
b x x3 2x Too high Comment or too low2.5 2.53 2.5 2 too low x is between 10.625 2.5 and 3
2.6 2.63 2 2.6 too low x is between 12.376 2.6 and 3
2.7 2.73 2 2.7 too low x is between 14.283 2.7 and 3
2.8 2.83 2 2.8 too high x is between 16.352 2.7 and 2.8
2.75 2.753 2 2.75 too high x is between 15.297 2.7 and 2.75
x lies between 2.7 and 2.75.So the solution is x 2.7 correct to 1 decimal place.We write x 2.7 (1 d.p.).
Use a trial and improvement method to fi nd a solution of the equation x2 3 __ x 1 correct
to 2 decimal places.
x x2 3 __ x 1 H or L Comment
1 12 3 __ 1 2 L x 1
2 22 3 __ 2 2.5 H 1 x 2
1.5 1.52 3 ___ 1.5 0.25 L 1.5 x 2
1.7 1.72 3 ___ 1.7 1.125… H 1.5 x 1.7
1.6 1.62 3 ___ 1.6 0.685 L 1.6 x 1.7
1.65 1.652 3 ____ 1.65 0.904… L 1.65 x 1.7
1.66 1.662 3 ____ 1.66 0.948… L 1.66 x 1.7
Substitute x 2.5 into the left-hand side of the equation and decide whether your answer is too high or too low. Record the interval in which it lies.
Choose a value between 2.5 and 3 and decide on a new interval.
Choose a value between 2.6 and 3 and decide on a new interval.
Choose a value between 2.7 and 3 and decide on a new interval.
Substitute x 2.75 as you know x is between 2.7 and 2.8.
Example 11
Substitute values until you fi nd two consecutive numbers with a diff erence of 0.1 between which the solution lies:in this case x 1.6 and x 1.7.
Try substituting whole-number values until you fi nd two consecutive integers between which the solution lies: in this case x 1 and x 2.
A02

Chapter 21 More graphs and equations
520
1.67 1.672 3 ____ 1.67 0.992… L 1.67 x 1.7
1.68 1.682 3 ____ 1.68 1.036… H 1.67 x 1.68
1.675 1.6752 3 ____ 1.675 1.014… H 1.67 x 1.675
x lies between 1.670 and 1.675so x 1.67 (2 d.p.).
Substitute the value halfway between 1.67 and 1.68 to fi nd out whether the solution is nearer 1.67 or nearer to 1.68.
Substitute values until you fi nd two consecutive numbers with a diff erence of 0.01 between which the solution lies:in this case x 1.67 and x 1.68.
1 For each of the following equations fi nd two consecutive whole numbers between which a solution lies.
a x3 2x 4 b x3 x2 1 c 2x3 95 d x2 10 __ x 0
2 Find two pairs of consecutive whole numbers between which the solutions of x 1 __ x2 5 lie.
3 Use a trial and improvement method to fi nd one solution of these equations correct to 1 decimal place.
a x3 x 7 b x3 x2 4 0 c x 1 __ x 5
4 Use a trial and improvement method to fi nd a positive solution of these equations correct to 2 decimal places.a x3 x 25 b 2x2 1 __
x 9 c x2(x 2) 150
5 A cuboid has height x cm. The length of the cuboid is 2 cm more than its height.The width of the cuboid is 2 cm less than its height.The volume of the cuboid is 600 cm3.a Show that x satisfi es the equation x3 4x 600.b Use a trial and improvement method to solve the equation x3 4x 600 correct to 1 decimal place.c Write down the length, width and height of the cuboid.
Exercise 21F
A quadratic function is an expression of the form ax2 bx c where the highest power of x is x2. The graph of a quadratic function is called a parabola. It has one of the following shapes.
y ax2 bx c, a 0 y ax2 bx c, a 0
C
B AO2AO3
Chapter review

521
Chapter review
The graph of a quadratic function has one line of symmetry.
The lowest point of a quadratic graph is where the graph turns, and is called the minimum point.
The highest point of a quadratic graph is where the graph turns, and is called the maximum point.
You can solve quadratic equations of the form ax2 bx c 0 by reading off the x-coordinate where y ax2 bx c crosses the x-axis.
You can solve quadratic equations of the form ax2 bx c mx k by reading off the x-coordinate at the point of intersection of y ax2 bx c with the straight-line graph y mx k.
A cubic function is an expression of the form ax3 bx2 cx d where the highest power of x is x3.
The graph of a cubic function has one of the following shapes.
y ax3 bx2 cx d, a 0 y ax3 bx2 cx d, a 0
A reciprocal function is an expression of the form k __ x .
The graph of a reciprocal function has one of the following shapes.
y k __ x , k 0 y k __
x , k 0
An exponential function is an expression of the form ax or ax, where a 0.
The graph of an exponential function has one of the following shapes.
y ax, a 0 y ax, a 0
The graphs cross the y-axis at (0, 1) since a0 1 for all values of a.
You can fi nd approximate solutions to equations which cannot be solved exactly by using a trial and improvement method.
x
y
O x
y
O
x
y
O x
y
O

Chapter 21 More graphs and equations
522
1 a Copy and complete the table of values for y x2 2x.
x 4 3 2 1 0 1 2
y 8 0 1 8
b Draw the graph of y x2 2x for x 4 to x 2.c Write down the equation for the line of symmetry of this curve.d Use your graph to fi nd:
i the value of y when x 0.5 ii the values of x when y 6.
2 a Make a table of values for y 2 x x2 for 3 x 3. b Draw the graph of y 2 x x2 for 3 x 3.c Solve the equations
i 2 x x2 0 ii 5 x x2 0
d Write down the coordinates of the maximum point of the graph of y 2 x x2
3 a Show that the equation x2 3x 2 x 2 can be rewritten as x2 4x 0.
b Solve the equation x2 4x 0.c The equation x2 2x 4 0 can be solved
by fi nding the intersection of the graph of y x2 3x 2 with the graph of a suitable straight line. Find the equation of this straight line.
4 a Show that there is a solution of the equation x2 2 __ x 3 0 between x 0.5 and x 1.
b Use a trial and improvement method to fi nd this solution correct to 2 decimal places.
5 a Copy and complete the table of values for y x3 2x2 4x.
x 2 1 0 1 2 3 4
y 1 0 5 3
b Draw the graph of y x3 2x2 4x for x 2 to x 4.c Solve the equations:
i x3 2x2 4x 0 ii x3 2x2 4x 5 0
6 a Copy and complete the table of values for y 3 2 __ x x 0
x 3 2 1 0.5 0.1 0.1 1 2 3
y 3.7 5 7 17 2
b Draw the graph of y 3 2 __ x for 3 x 3.
c This graph approaches two lines without touching them. These lines are called asymptotes. Write down the equation of each of these two lines.
Review exercise
�4
�2
�2 2 4
y � x2 � 3x � 2
y � x � 22
4
x
y
O
B
AO2
AO2AO3
AO2AO3
AO3

523
Chapter review
7 a Copy and complete this table of values for y 4 __ x
x 0.5 1 2 3 4
y 4
b Draw the graph of y 4 __ x for values of x from 0.5 to 4
c Use the graph to fi nd an estimate for the solution of 4 __ x 4 x
d Use the method of trial and improvement to fi nd this value correct to 2 decimal places.
8 The diagram shows a rectangle.All the measurements are in cm.The width is x and the length is 3 cm more than the width.The area of the rectangle is 20 cm2
a Draw a suitable graphb Find an estimate for the value of x
9 The diagram shows a cuboid.The base of the cuboid is a square of side x cm.The height of the cuboid is (x 4) cm The volume of the cuboid is 100 cm3.Find the height of the cuboid.
June 2005, paper 4
10 Match each of the equations with its graph.
a y 1 __ x b y 3x c y x2 4
d y x3 e y x3 x2 6x
A B C
�10
�2�4 2 4
10
20
x
y
O
�2
�3
�1
�2�4 2 4
1
2
3
x
y
O
�20
�30
�40
�50
�10
�2�4 2 4
10
20
x
y
O
Length
x
xx
x � 4 Diagram NOTaccurately drawn
B
A
A
AO2
AO3
AO3
AO2AO3

Chapter 21 More graphs and equations
524
D E
11 The sketch graph shows a curve with equation The curve passes through the points (1, 5) and (4, 320)Calculate the value of p and the value of q.
Nov 2005, Paper 6
12 The diagram shows a sketch of the graph of y abx The curve passes through the points A (0.5, 1) and B (2, 8)The point C (0.5, k) lies on the curve.Find the value of k
June 2006 Paper 6
�100
�150
�50
�2�4 2 4
50
100
150
x
y
O
�10
�1 1 2 3
5
10
15
20
25
30
x
y
O
x
(1, 5)
(4, 320)
y
O
O x
y
2
4
6
8
10
�4 �2 2
A(0.5, 1)
B(2, 8)
4
A
AO2
AO2