205482 geophysics ธรณีฟิสกสิ์ · geophysics physics of the earth = applies...
TRANSCRIPT

205482Geophysics
ธรณฟสกส
อ.ดร. สวมล อดพวยE-mail: [email protected]
Office: GB111-4
ภาควชาธรณวทยา คณะวทยาศาสตร
มหาวทยาลยเชยงใหมมหาวทยาลยเชยงใหม
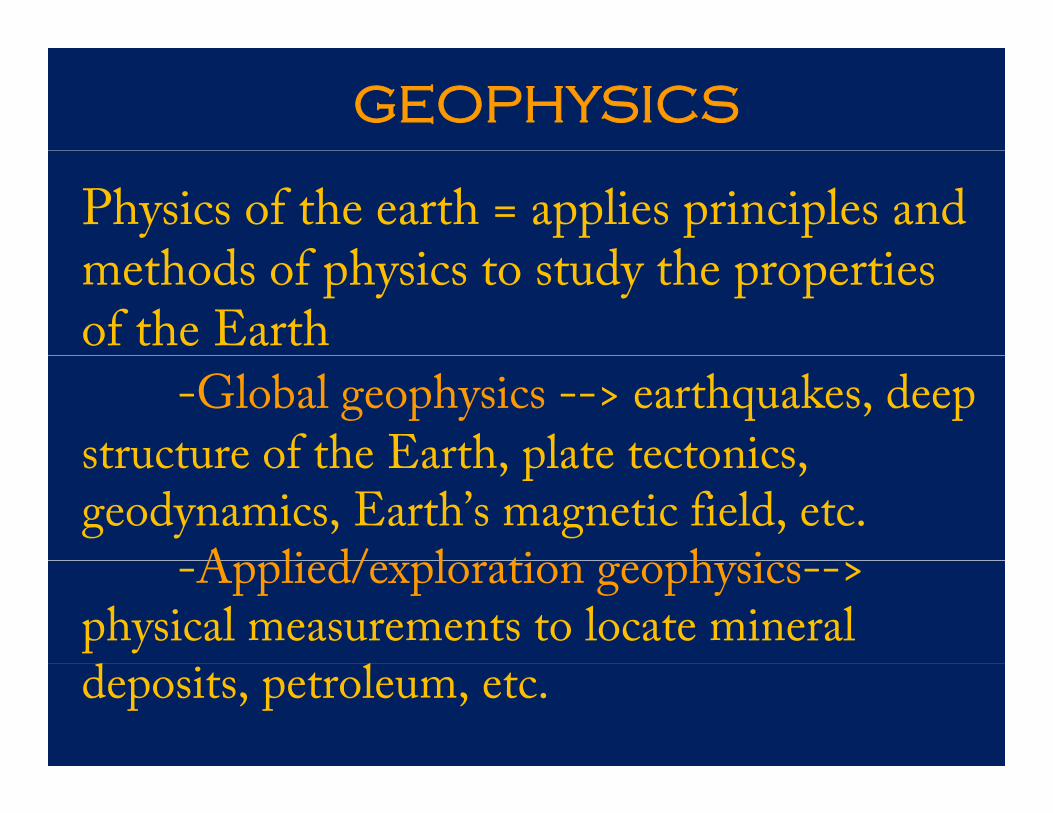
GEOPHYSICS
Physics of the earth = applies principles and h d f h i d h imethods of physics to study the properties
of the Earth-Global geophysics --> earthquakes, deep
structure of the Earth plate tectonicsstructure of the Earth, plate tectonics, geodynamics, Earth’s magnetic field, etc.
A li d/ l ti h i-Applied/exploration geophysics-->physical measurements to locate mineral deposits, petroleum, etc.
Lecture Outline
•Resistivity, Induced polarization & Self-potential methods 9 Lectures
การสารวจทางดานไฟฟา
•Electromagnetic method 3 Lectures
การสารวจทางดานแมเหลกไฟฟาการสารวจทางดานแมเหลกไฟฟา
•Ground penetrating radar method 3 Lectures
การสารวจทางดานเรดารผานทะลพนดน
•Gravity Method 3 Lectures
การสารวจทางดานความโนมถวง
•Magnetic Method 3 Lectures•Magnetic Method 3 Lectures
การสารวจทางดานแมเหลก
•Seismic method 9 Lectures
ไ การสารวจทางดานคลนไหวสะเทอน

Lab OutlineWeek1 (7, 9 Nov) Field 1D Resistivity Survey (Schlumberger)/(Wenner)
Week2 (14, 16 Nov) Field 2D Resistivity & IP surveys (Dipole - Dipole)
Week3 (21, 23 Nov) Resistivity curve matching
Week4 (28, 30 Nov) Resist87/RES1D
Week5 (5, 7 Nov) No lab (หยดวนพอแหงชาต)
Week6 (12, 14 Nov) No lab (หยดชดเชยวนรฐธรรมนญ) ฐ ญ
Week7 (19, 21 Dec) Res2DInv
Week8 (26, 28 Dec) No lab (สปดาหสอบกลางภาค)
Week9 (2 4 Jan) No lab (หยดชดเชยวนสนปและวนขนปใหม)Week9 (2, 4 Jan) No lab (หยดชดเชยวนสนปและวนขนปใหม)
Week10 (9, 12 Jan) Field Gravity & Magnetic Surveys
Week11 (16, 18 Jan) Surfer & Gravity Correction
Week12 (23 25 Jan) Surfer & Magnetic CorrectionWeek12 (23, 25 Jan) Surfer & Magnetic Correction
Week13 (30 Jan, 1 Feb) Field Refraction & Reflection Seismic Surveys
Week14 (6, 8 Feb) Grapher & Refraction Seismic Interpretation
Week15 (13, 15 Feb) Reflection Seismic InterpretationWeek15 (13, 15 Feb) Reflection Seismic Interpretation
Week16 ( 20, 23 Feb) RockWorks
Electrical Resistivity Survey• To investigate the subsurface resistivity distribution beneath
an area of interest. • In general, an electric current (direct current, dc) is injected g , ( , ) j
into the ground, and the resulting voltage differences are measured at the surface of the Earth.
• True resistivity of the subsurface can be estimated from this• True resistivity of the subsurface can be estimated from this voltage measurement.
• Anomalous conditions or inhomogeneities within the ground, h l ti l d ti i ti i f dsuch as relatively conducting or resistive zones, are inferred
from the fact that they deflect the current and distort surface potential readings.
• The ground resistivity is related to various geological parameters such as the mineral and fluid content, porosity and degree of water saturation in the rock.
• Have been used in hydrogeological, mining, and geotechnical investigations, and for environmental surveys.
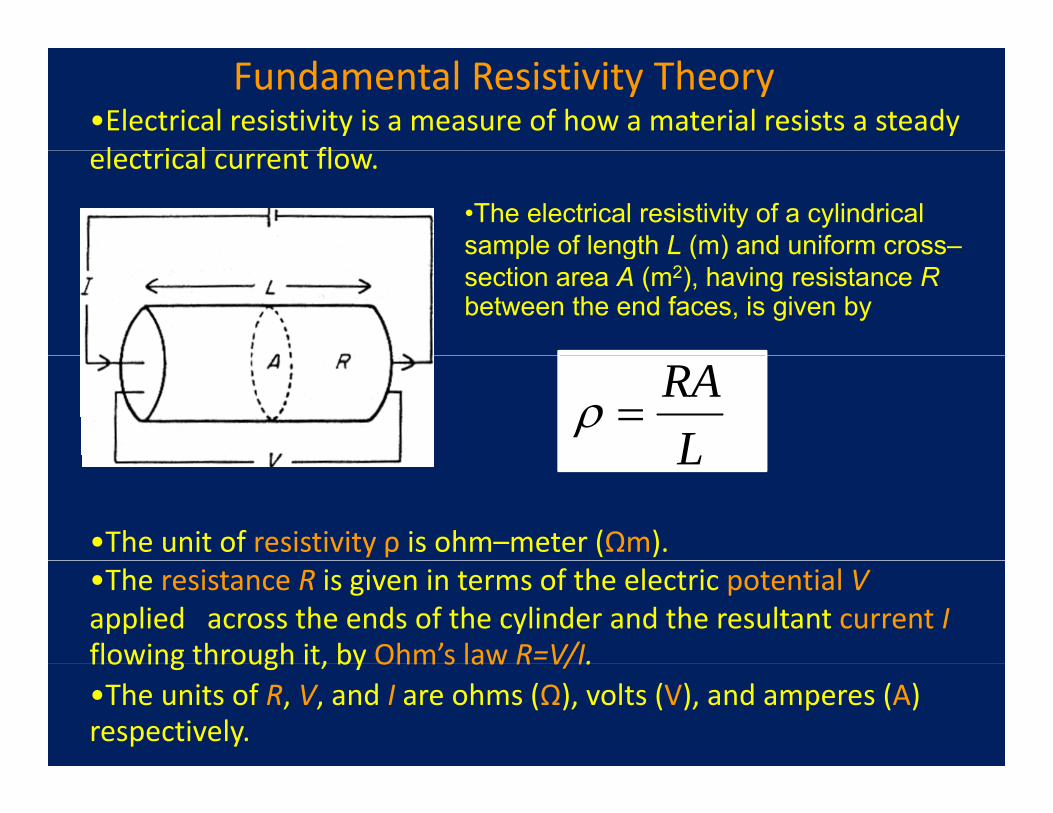
•Electrical resistivity is a measure of how a material resists a steady l t i l t fl
Fundamental Resistivity Theory
electrical current flow.
•The electrical resistivity of a cylindrical sample of length L (m) and uniform cross–sample of length L (m) and uniform crosssection area A (m2), having resistance Rbetween the end faces, is given by
LRA
=ρ
•The unit of resistivity ρ is ohm–meter (Ωm).
L
•The resistance R is given in terms of the electric potential Vapplied across the ends of the cylinder and the resultant current Iflowing through it, by Ohm’s law R=V/I.flowing through it, by Ohm s law R V/I.•The units of R, V, and I are ohms (Ω), volts (V), and amperes (A) respectively.
Fundamental Resistivity Theory
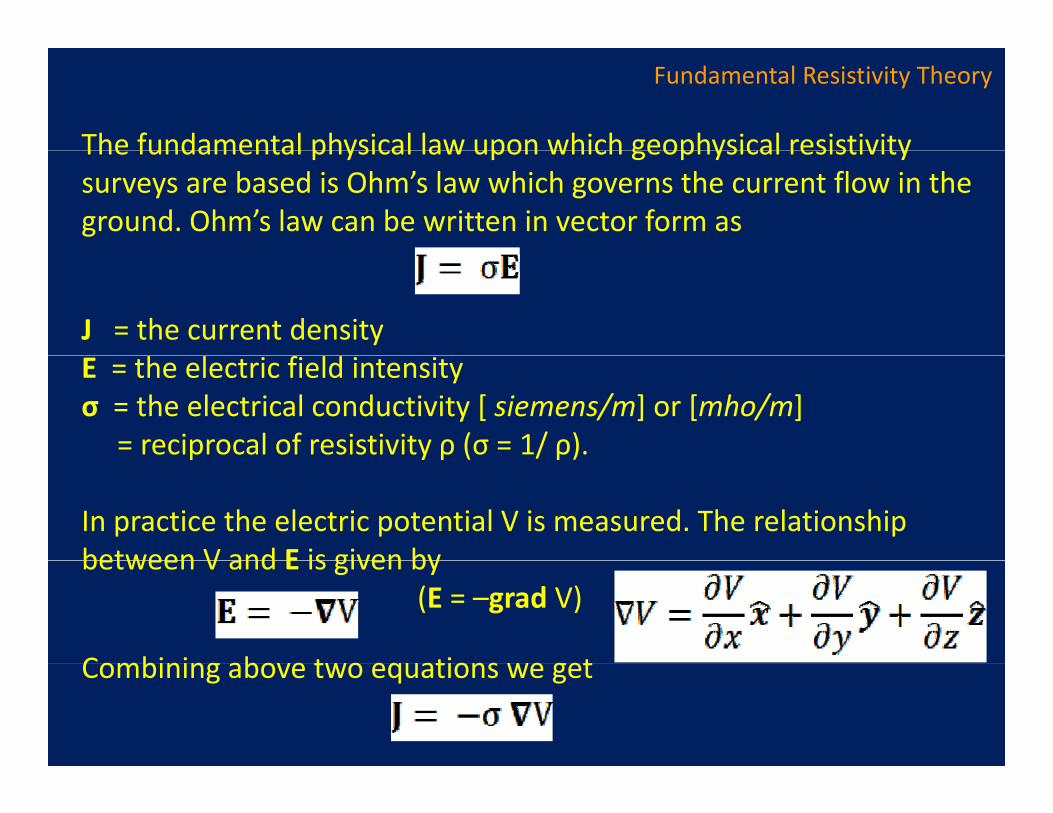
The fundamental physical law upon which geophysical resistivityThe fundamental physical law upon which geophysical resistivity surveys are based is Ohm’s law which governs the current flow in the ground. Ohm’s law can be written in vector form as
J = the current densityE = the electric field intensityσ = the electrical conductivity [ siemens/m] or [mho/m]
= reciprocal of resistivity ρ (σ = 1/ ρ). p y ρ ( / ρ)
In practice the electric potential V is measured. The relationship between V and E is given bybetween V and E is given by
(E = –grad V)
Combining above two equations we getCombining above two equations we get
The simplest approach to the theoretical study of the current flow in
Fundamental Resistivity Theory
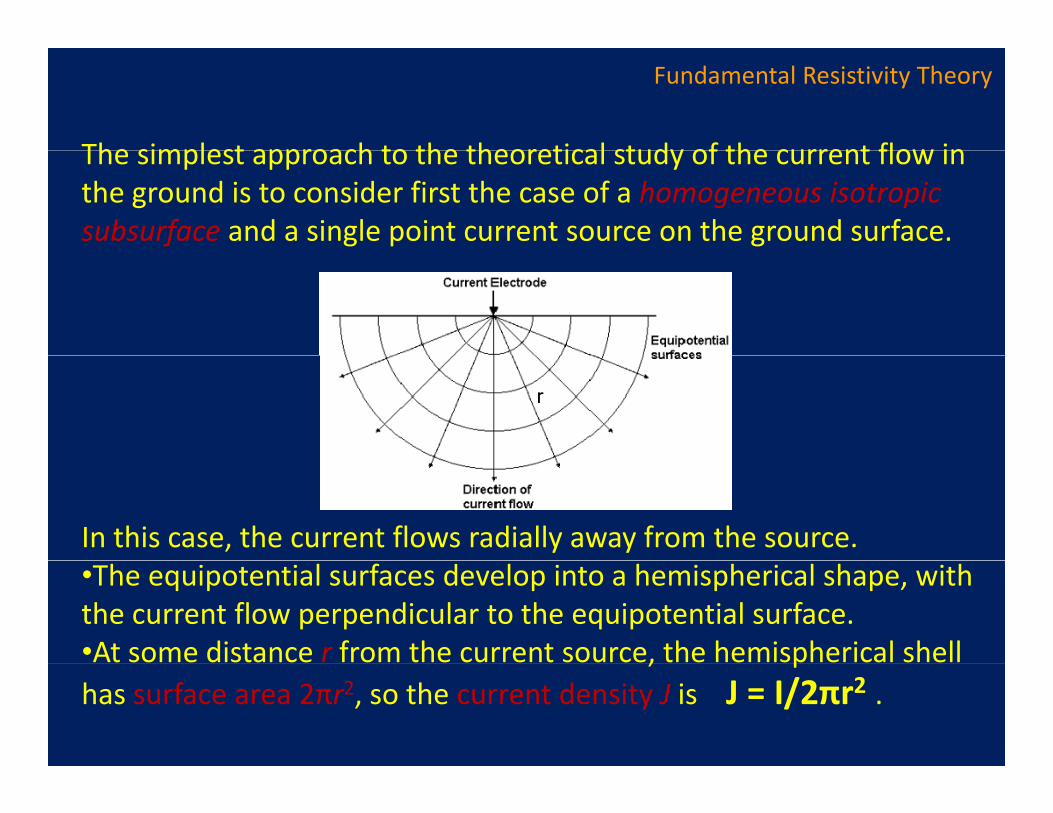
The simplest approach to the theoretical study of the current flow in the ground is to consider first the case of a homogeneous isotropic subsurface and a single point current source on the ground surface.
In this case, the current flows radially away from the source. •The equipotential surfaces develop into a hemispherical shape, with the current flow perpendicular to the equipotential surface.•At some distance r from the current source, the hemispherical shell , phas surface area 2πr2, so the current density J is J = I/2πr2 .

Since ρ = 1/ σ and using J = I/2πr2
Fundamental Resistivity Theory
Since ρ = 1/ σ and using J = I/2πr2
then equation can be written as
2
12 r
VrI
ρπ ∂∂
−=
22/ rIrV πρ
ρ
=∂∂
−
The potential V at distance r from the current source is given by integrating the above equation, the result of which is
∞
∫ ==r
rIdrrIV πρπρ 2/)2/( 2
This equation provides the fundamental relationship for electrical prospecting performed at the surface of a uniform isotropic earth.
I lit i l l t d b it lf t i j t t i t h lf t
Fundamental Resistivity Theory
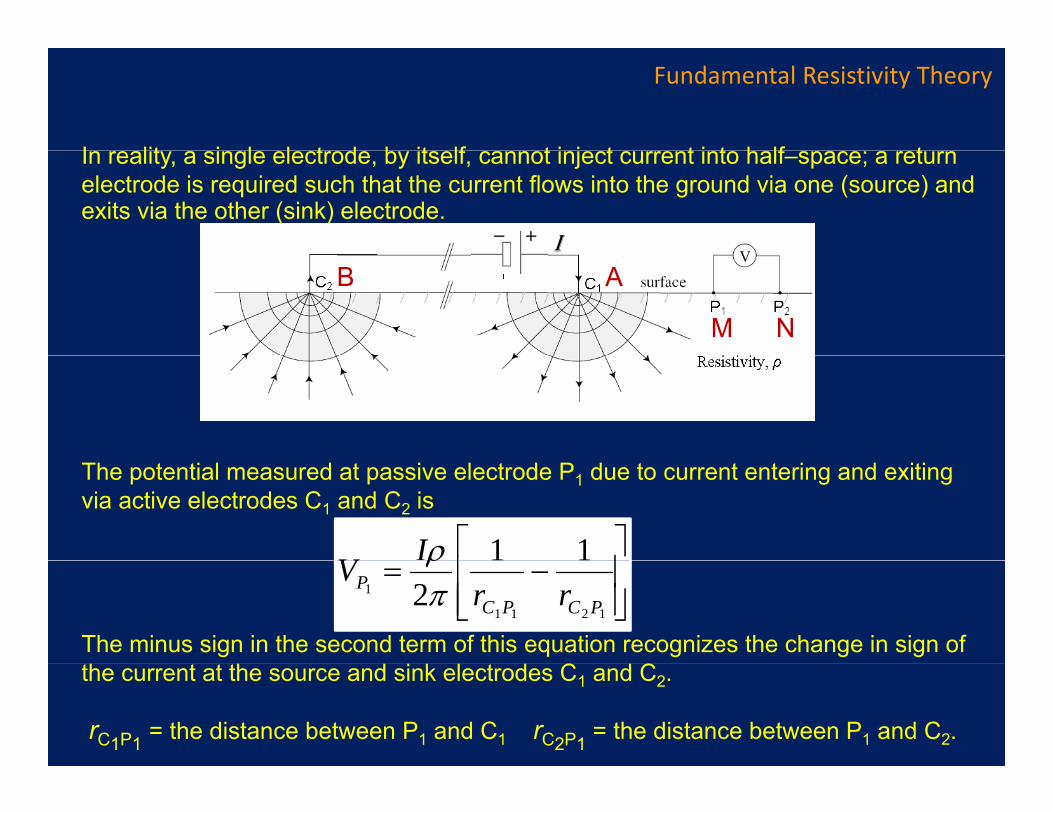
In reality, a single electrode, by itself, cannot inject current into half–space; a return electrode is required such that the current flows into the ground via one (source) and exits via the other (sink) electrode.
IAB
M N
The potential measured at passive electrode P1 due to current entering and exiting via active electrodes C1 and C2 is
⎥⎤
⎢⎡ 11IV ρ
The minus sign in the second term of this equation recognizes the change in sign of ⎥⎥⎦⎢
⎢⎣
−=1211
1 2 PCPCP rr
Vπρ
the current at the source and sink electrodes C1 and C2.
rC1P1 = the distance between P1 and C1 rC2P1 = the distance between P1 and C2.
I
Fundamental Resistivity Theory
I
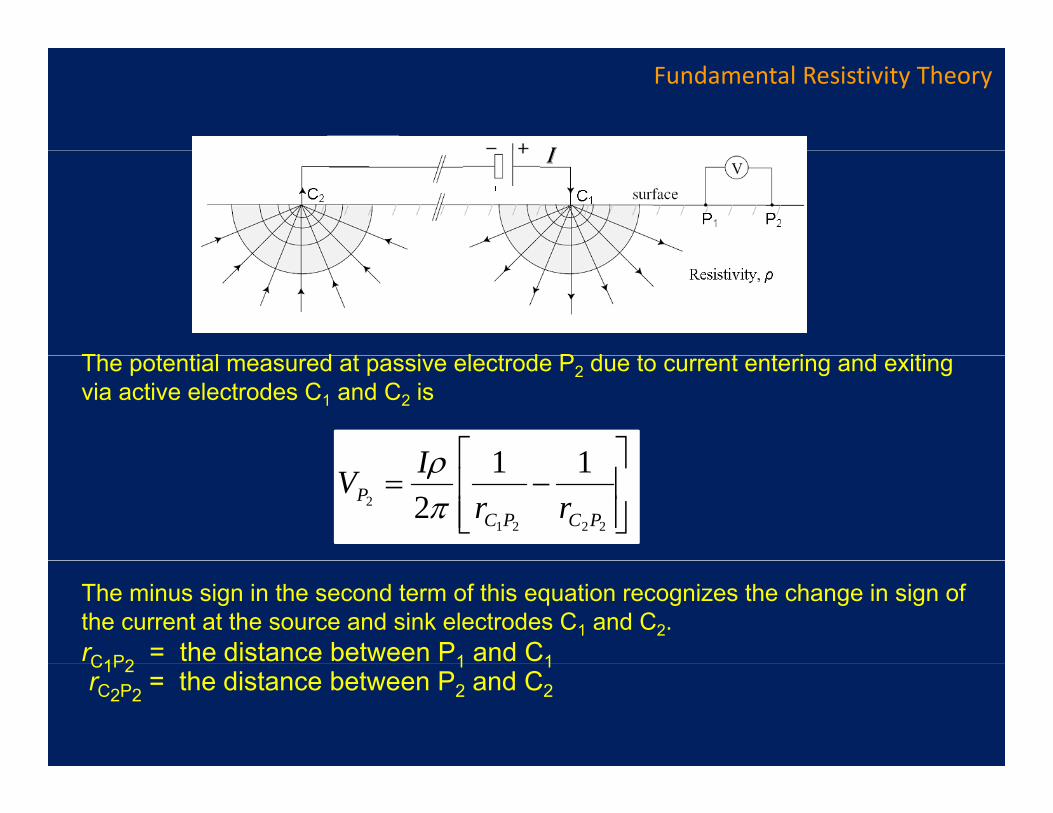
Th t ti l d t i l t d P d t t t i d itiThe potential measured at passive electrode P2 due to current entering and exiting via active electrodes C1 and C2 is
⎤⎡ 11Iρ⎥⎥⎦
⎤
⎢⎢⎣
⎡−=
2221
2
112 PCPC
P rrIVπρ
The minus sign in the second term of this equation recognizes the change in sign of the current at the source and sink electrodes C1 and C2.rC1P2 = the distance between P1 and C1C1P2 1 1rC2P2 = the distance between P2 and C2
I ti t ti l diff b t t i t th th b l t
Fundamental Resistivity Theory
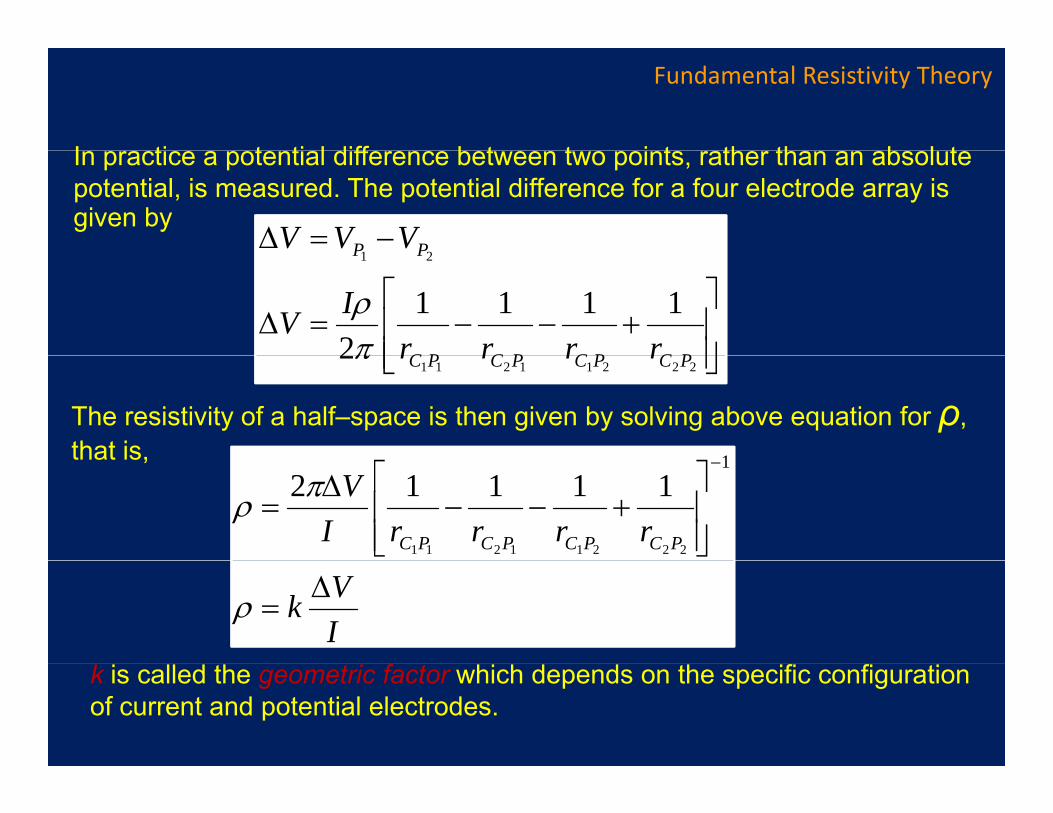
In practice a potential difference between two points, rather than an absolute potential, is measured. The potential difference for a four electrode array is given by
−=Δ21 PP VVV
⎥⎥⎦
⎤
⎢⎢⎣
⎡+−−=Δ
21
11112 PCPCPCPC
PP
rrrrIVπρ
⎥⎦⎢⎣ 222112112 PCPCPCPC rrrrπ
The resistivity of a half–space is then given by solving above equation for ρ, that is, 1that is,
rrrrIV
PCPCPCPC ⎥⎥⎦
⎤
⎢⎢⎣
⎡+−−
Δ=
−πρ
1
22211211
11112
IVk Δ=ρ
k is called the geometric factor which depends on the specific configuration of current and potential electrodes.
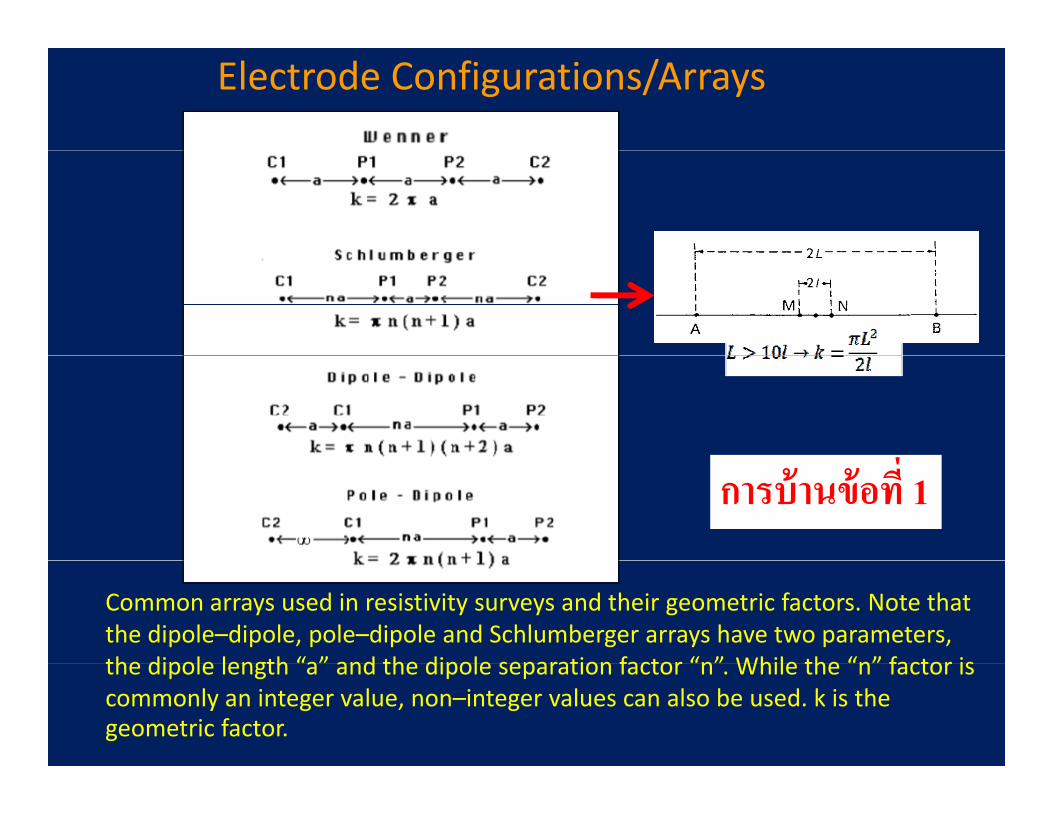
Electrode Configurations/Arrays
การบานขอท 1
Common arrays used in resistivity surveys and their geometric factors. Note that the dipole–dipole, pole–dipole and Schlumberger arrays have two parameters, the dipole length “a” and the dipole separation factor “n” While the “n” factor isthe dipole length a and the dipole separation factor n . While the n factor is commonly an integer value, non–integer values can also be used. k is the geometric factor.

• gives the true resistivity values that would be calculated IVk Δ=ρ
Fundamental Resistivity Theory
from potential measurement over a homogeneous half–space with the 4–electrodes configuration.
•The resistivity so obtained is constant and independent of both electrode configuration and surface location.
•For inhomogeneous earth the resistivity ρ, computed from the equation will vary according to the geometric arrangement of theequation will vary according to the geometric arrangement of the electrodes or on the horizontal location of the array.
•The resistivity obtained for an inhomogeneous subsurface is•The resistivity obtained, for an inhomogeneous subsurface is, therefore, properly viewed as an apparent resistivity, written as
Vk ΔI
ka =ρ

Th i i i i i i i f h
Fundamental Resistivity Theory
•The apparent resistivity ≠ average resistivities of the inhomogeneous subsurface formation.
•The apparent resistivity = the resistivity that the potential readings would assign to the ground if it were homogeneous.
•The relationship between the apparent resistivity and the true resistivity is a complex relationship.
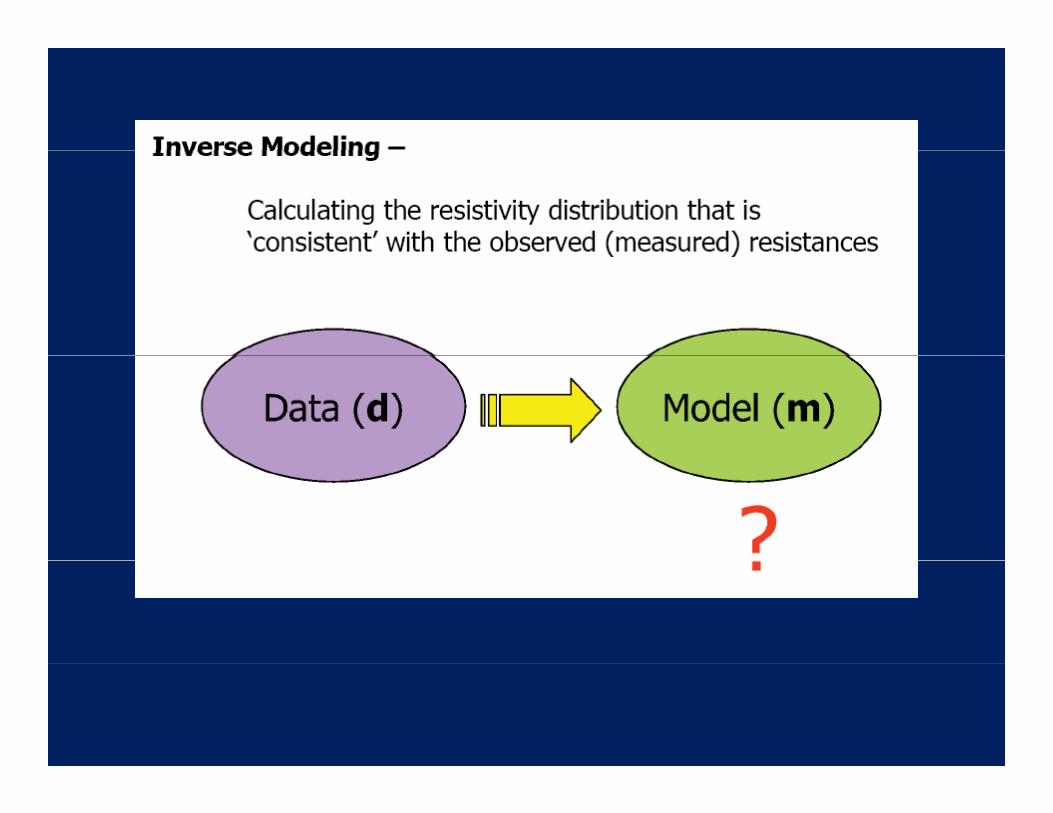
•To determine the true subsurface resistivity from the measured apparent resistivity values is the “inversion” problem or “inverse modeling”.
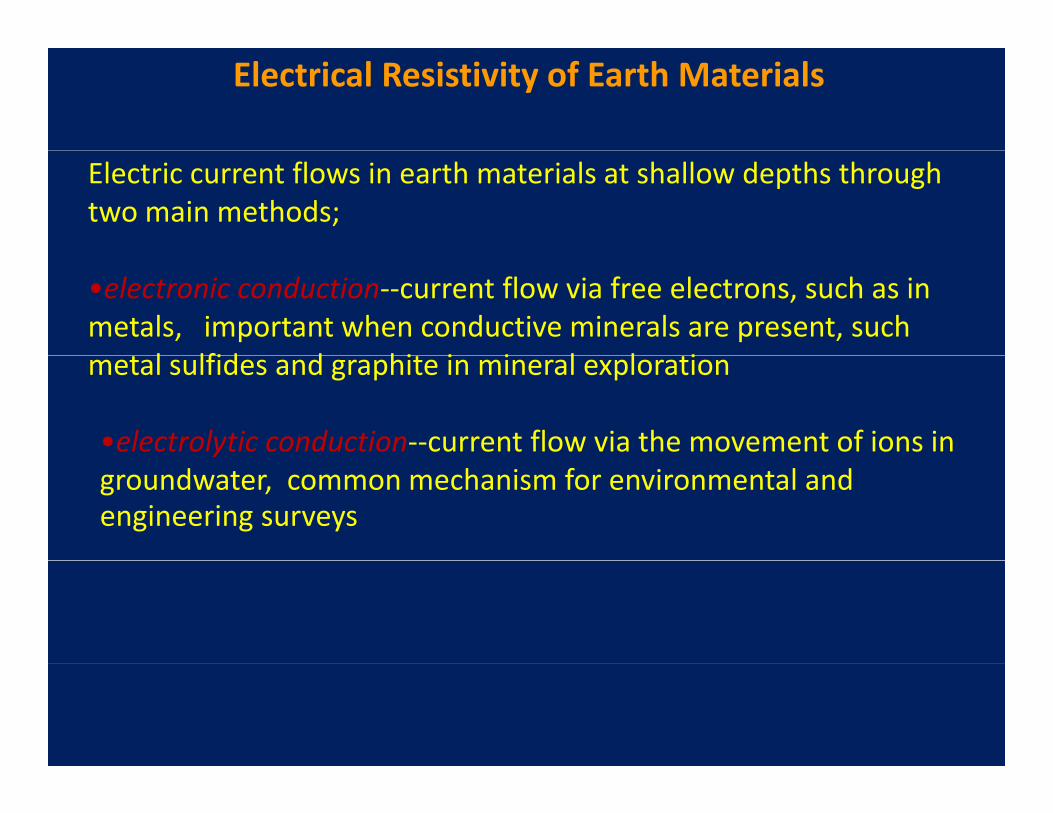
Electrical Resistivity of Earth Materials
Electric current flows in earth materials at shallow depths through two main methods;
•electronic conduction‐‐current flow via free electrons, such as in metals, important when conductive minerals are present, such
l lfid d hi i i l l imetal sulfides and graphite in mineral exploration
•electrolytic conduction‐‐current flow via the movement of ions in groundwater, common mechanism for environmental and engineering surveys
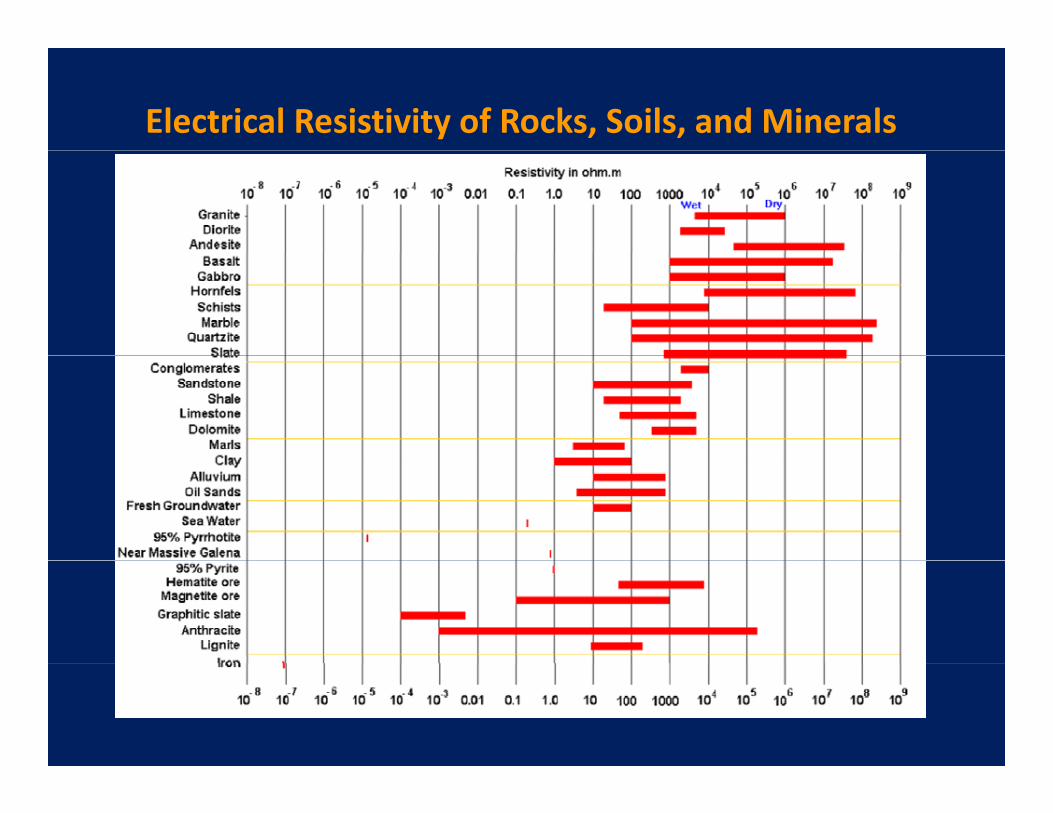
Electrical Resistivity of Rocks, Soils, and Minerals
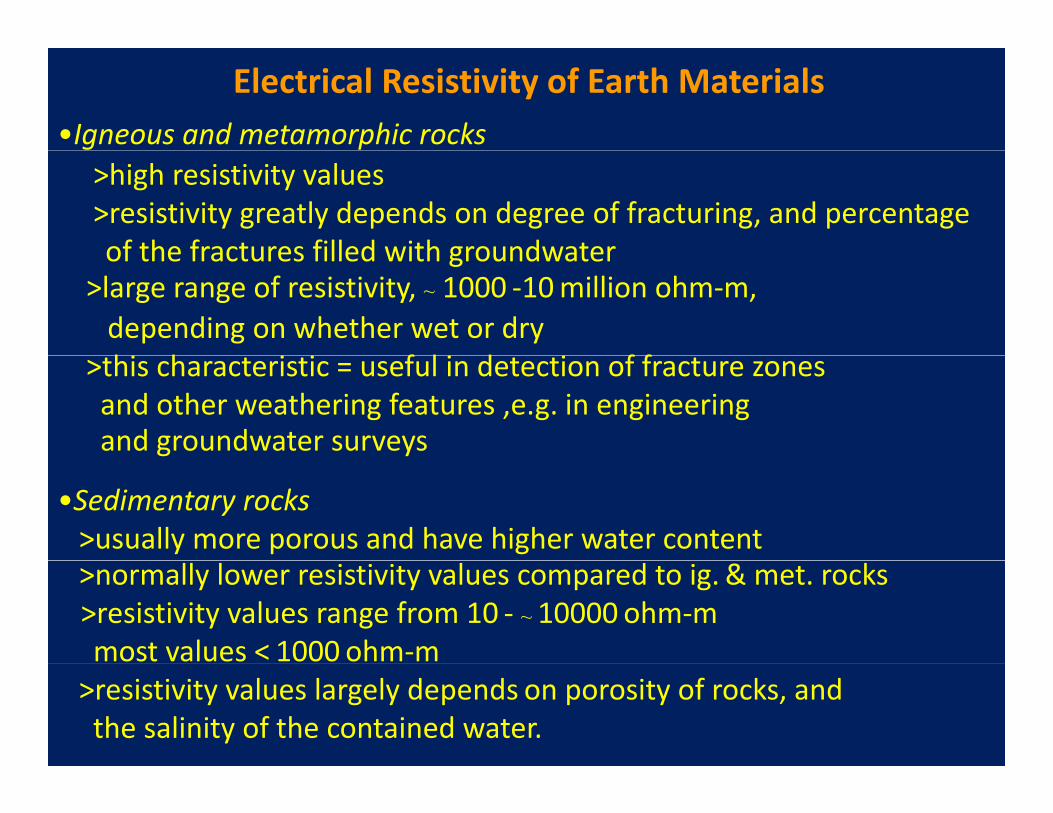
Electrical Resistivity of Earth Materials•Igneous and metamorphic rocks
>high resistivity values >resistivity greatly depends on degree of fracturing, and percentage of the fractures filled with groundwaterof the fractures filled with groundwater
>large range of resistivity, ~ 1000 ‐10 million ohm‐m, depending on whether wet or dryhi h i i f l i d i f f>this characteristic = useful in detection of fracture zones and other weathering features ,e.g. in engineeringand groundwater surveys
•Sedimentary rocks>usually more porous and have higher water content>normally lower resistivity values compared to ig. & met. rocks
>resistivity values range from 10 ‐ ~ 10000 ohm‐mmost values < 1000 ohm‐m
>resistivity values largely depends on porosity of rocks, and the salinity of the contained water.
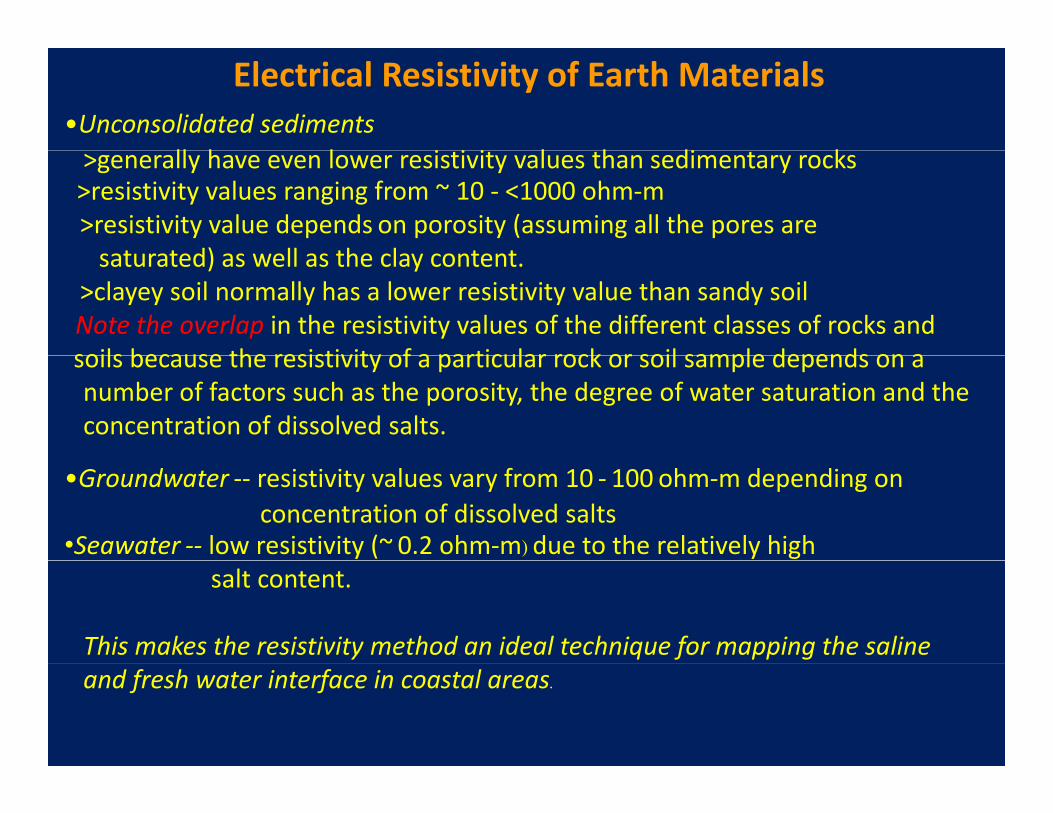
Electrical Resistivity of Earth Materials•Unconsolidated sediments
ll h l i i i l h di k>generally have even lower resistivity values than sedimentary rocks>resistivity values ranging from ~ 10 ‐ <1000 ohm‐m
>resistivity value depends on porosity (assuming all the pores are t t d) ll th l t t saturated) as well as the clay content.
>clayey soil normally has a lower resistivity value than sandy soil Note the overlap in the resistivity values of the different classes of rocks and soils because the resistivity of a particular rock or soil sample depends on a soils because the resistivity of a particular rock or soil sample depends on a number of factors such as the porosity, the degree of water saturation and the concentration of dissolved salts.
•Groundwater ‐‐ resistivity values vary from 10 ‐ 100 ohm‐m depending on concentration of dissolved salts
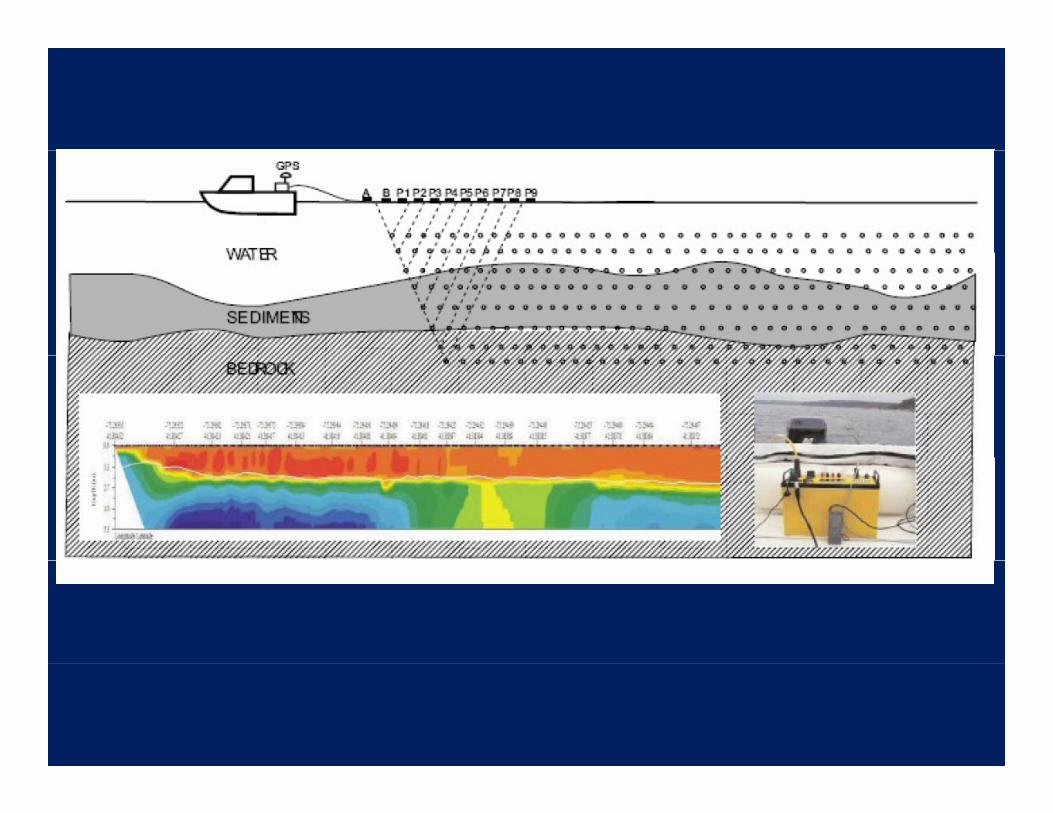
•Seawater ‐‐ low resistivity (~ 0.2 ohm‐m) due to the relatively high salt content.
This makes the resistivity method an ideal technique for mapping the saline and fresh water interface in coastal areas.
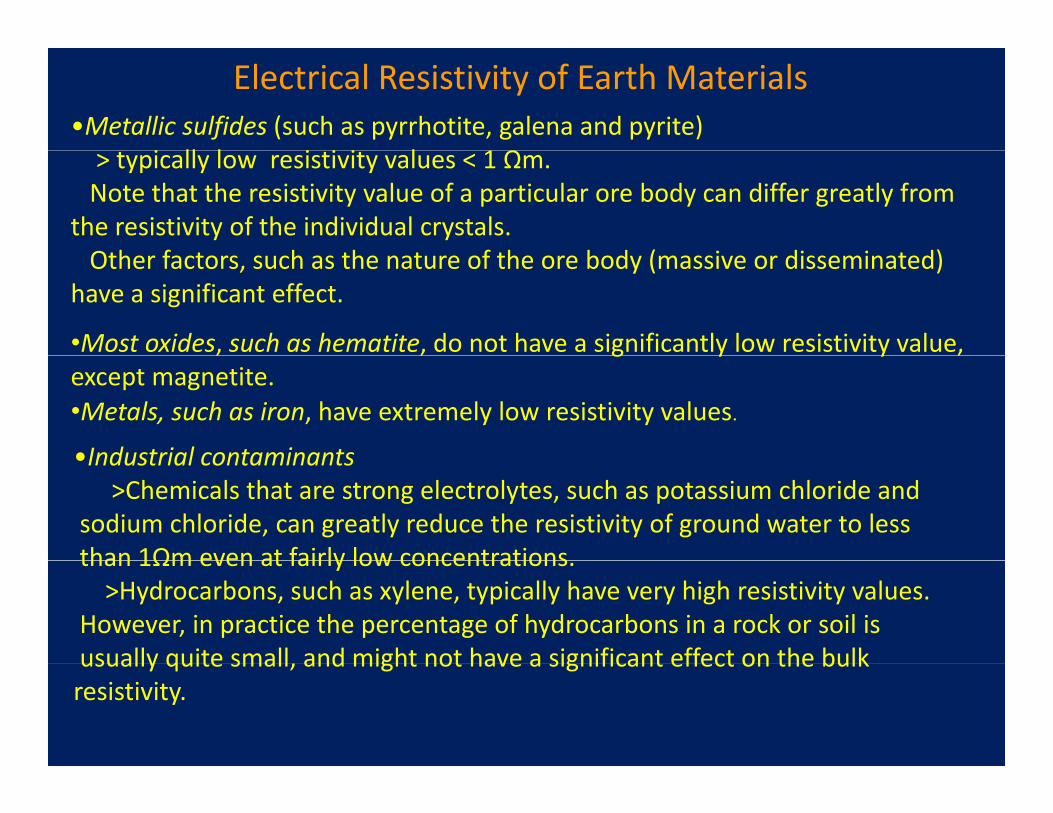
•Metallic sulfides (such as pyrrhotite, galena and pyrite) i ll l i i i l Ω
Electrical Resistivity of Earth Materials
> typically low resistivity values < 1 Ωm. Note that the resistivity value of a particular ore body can differ greatly from
the resistivity of the individual crystals. Oth f t h th t f th b d ( i di i t d)Other factors, such as the nature of the ore body (massive or disseminated)
have a significant effect.
•Most oxides, such as hematite, do not have a significantly low resistivity value, , , g y y ,except magnetite.•Metals, such as iron, have extremely low resistivity values. •Industrial contaminants•Industrial contaminants
>Chemicals that are strong electrolytes, such as potassium chloride and sodium chloride, can greatly reduce the resistivity of ground water to less than 1Ωm even at fairly low concentrationsthan 1Ωm even at fairly low concentrations. >Hydrocarbons, such as xylene, typically have very high resistivity values. However, in practice the percentage of hydrocarbons in a rock or soil is usually quite small and might not have a significant effect on the bulkusually quite small, and might not have a significant effect on the bulk resistivity.
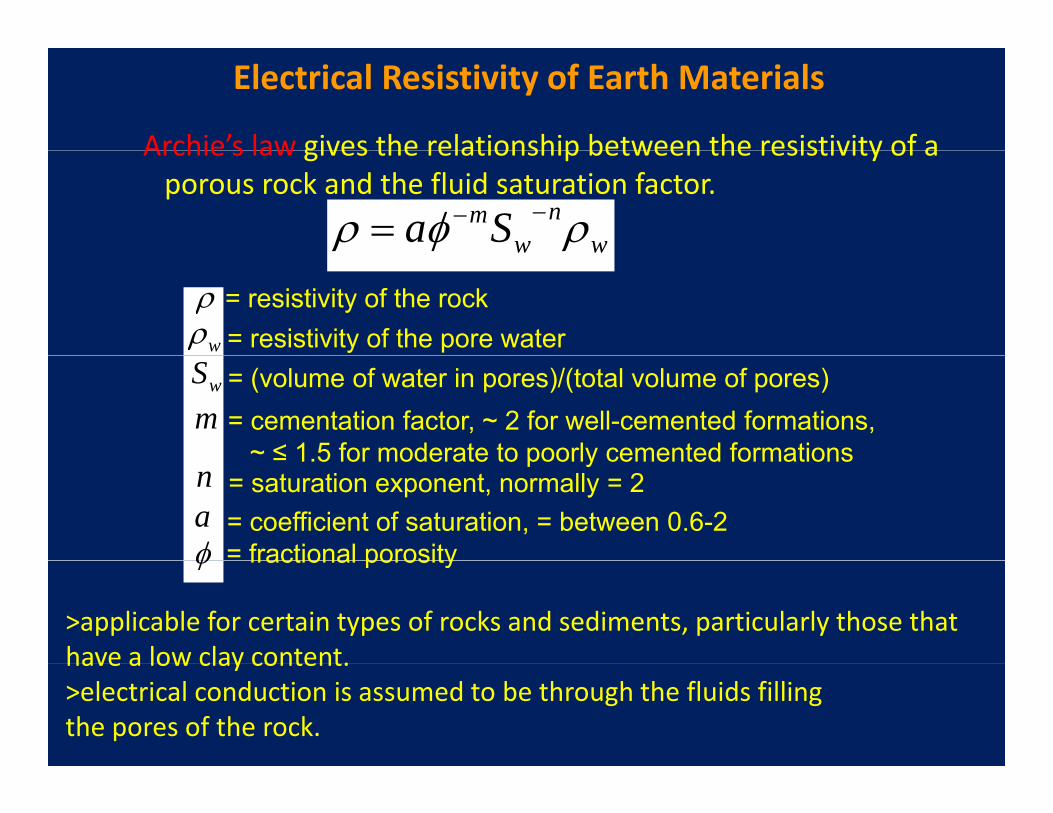
Archie’s law gives the relationship between the resistivity of a
Electrical Resistivity of Earth Materials
Archie s law gives the relationship between the resistivity of a porous rock and the fluid saturation factor.
wn
wmSa ρφρ −−=
ρ = resistivity of the rockwρ = resistivity of the pore waterwS = (volume of water in pores)/(total volume of pores)
m = cementation factor, ~ 2 for well-cemented formations, ~ ≤ 1 5 for moderate to poorly cemented formations ≤ 1.5 for moderate to poorly cemented formations
n = saturation exponent, normally = 2a = coefficient of saturation, = between 0.6-2φ = fractional porosityφ fractional porosity
>applicable for certain types of rocks and sediments, particularly those that have a low clay content.have a low clay content. >electrical conduction is assumed to be through the fluids filling the pores of the rock.
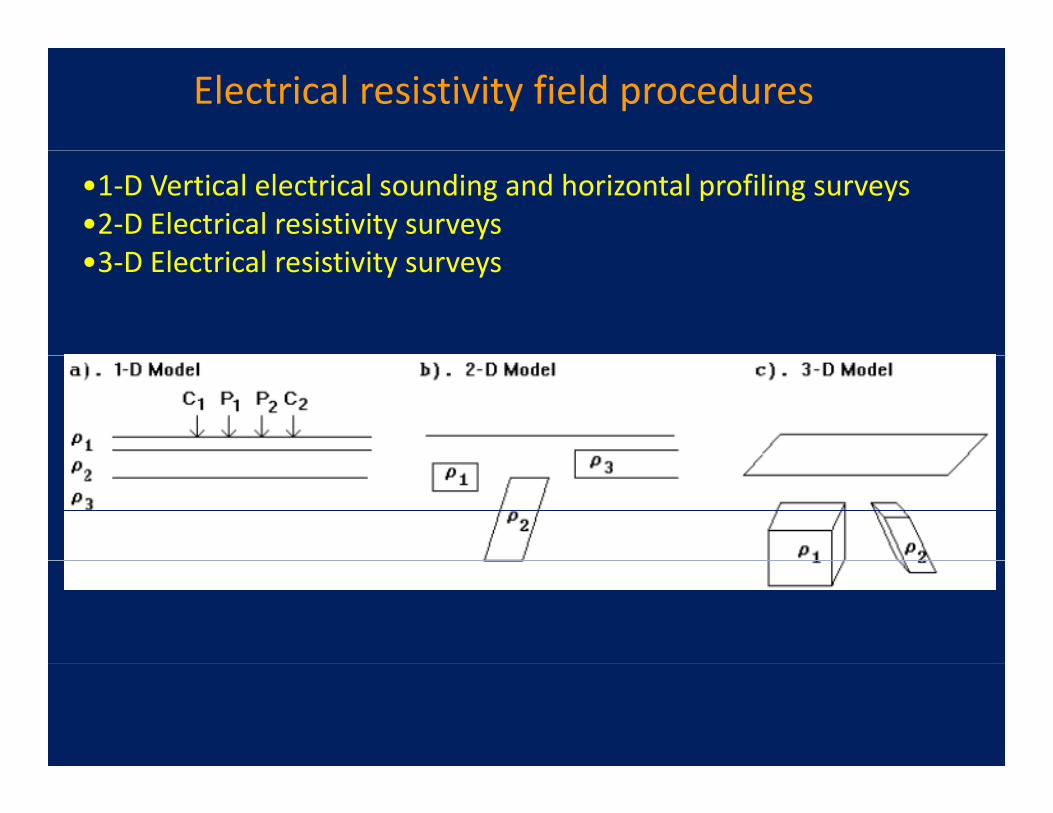
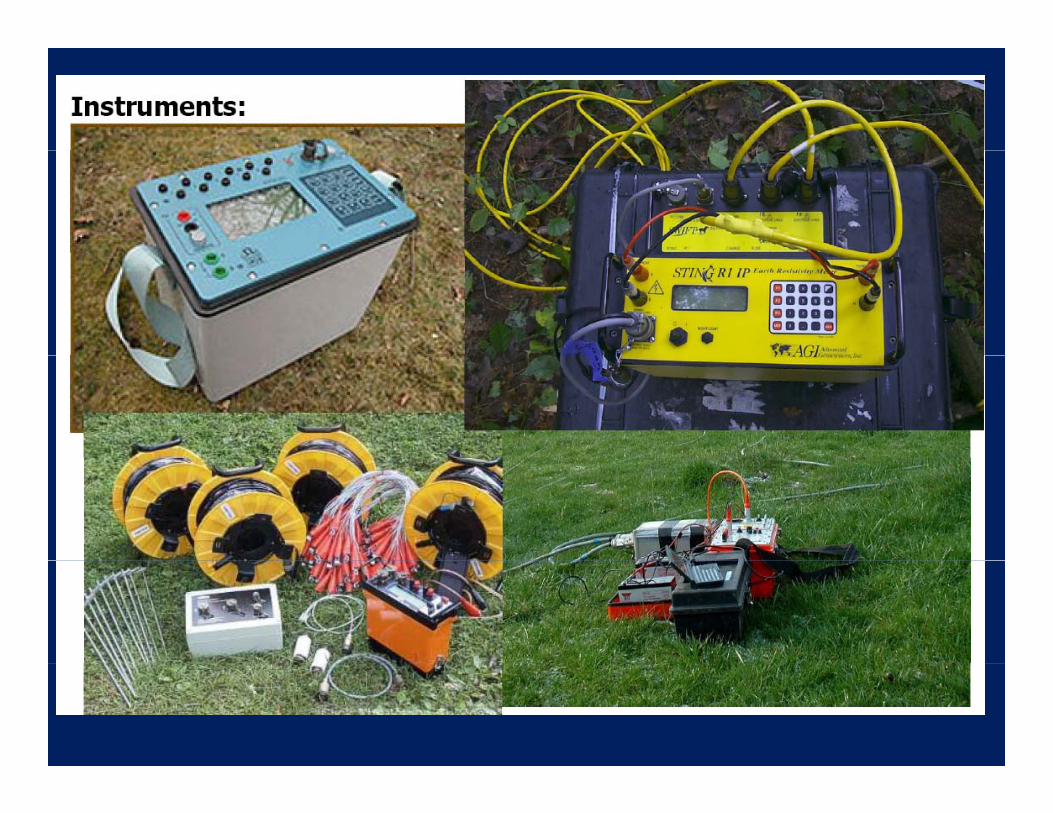
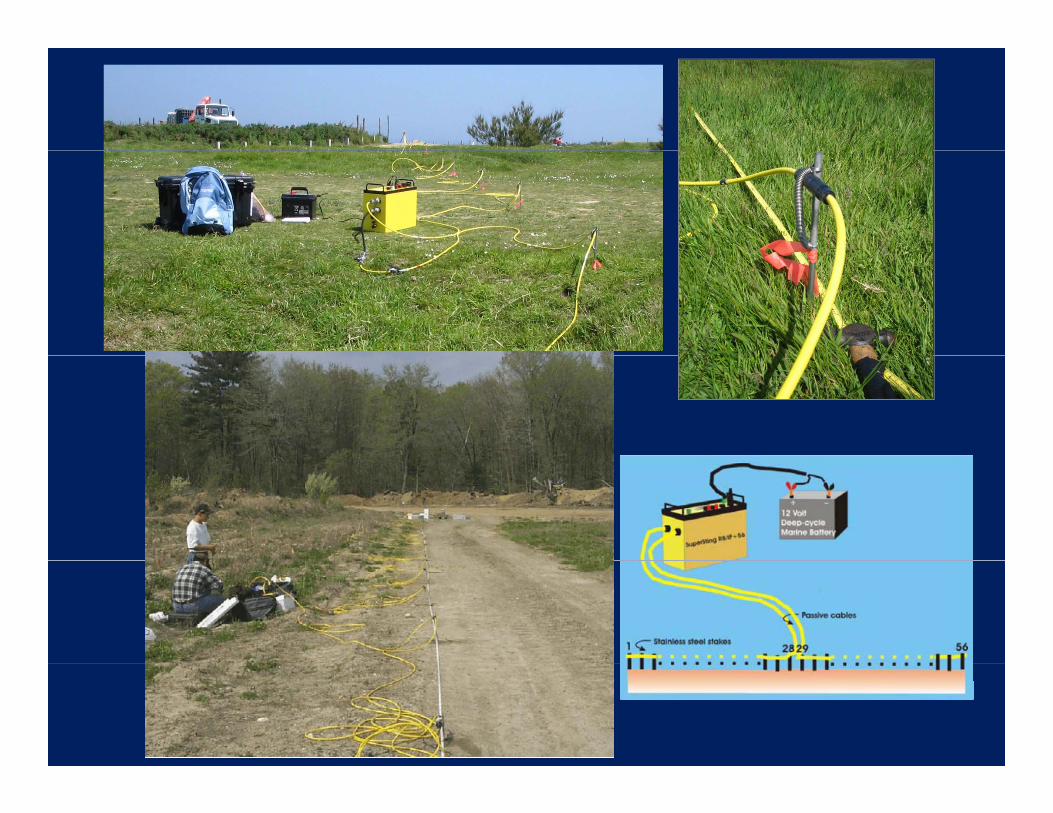
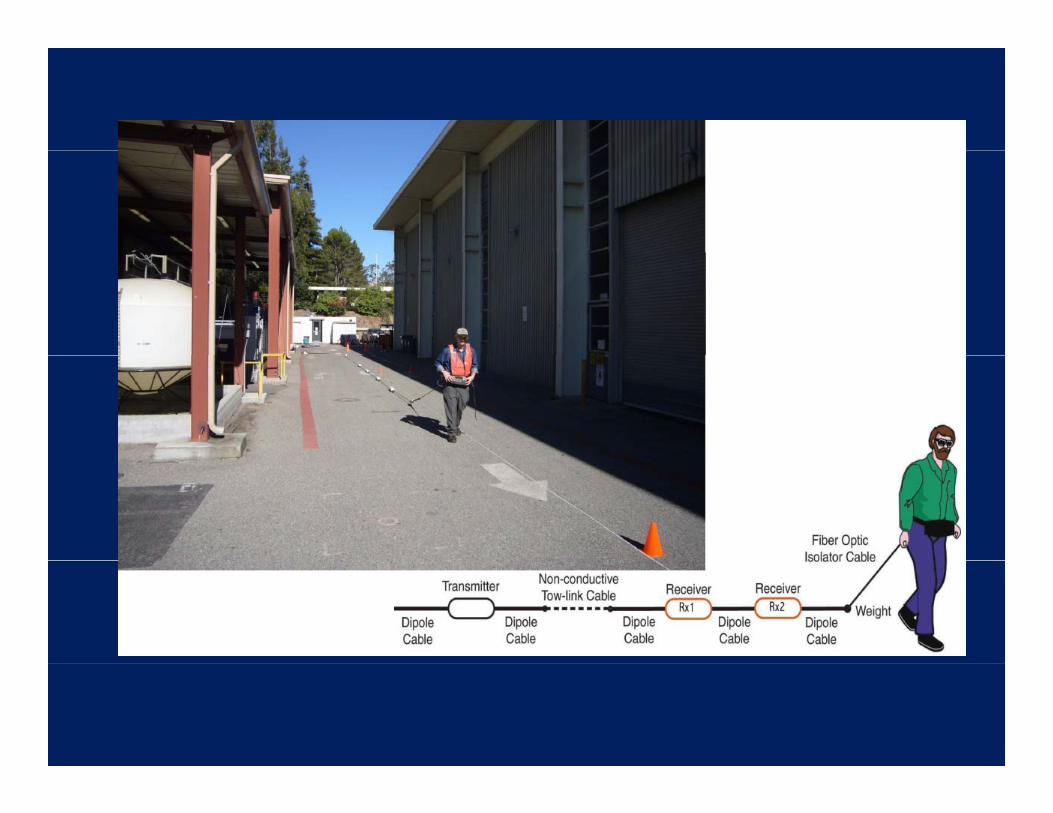
Electrical resistivity field procedures
•1‐D Vertical electrical sounding and horizontal profiling surveys•2‐D Electrical resistivity surveys3 D El i l i i i•3‐D Electrical resistivity surveys
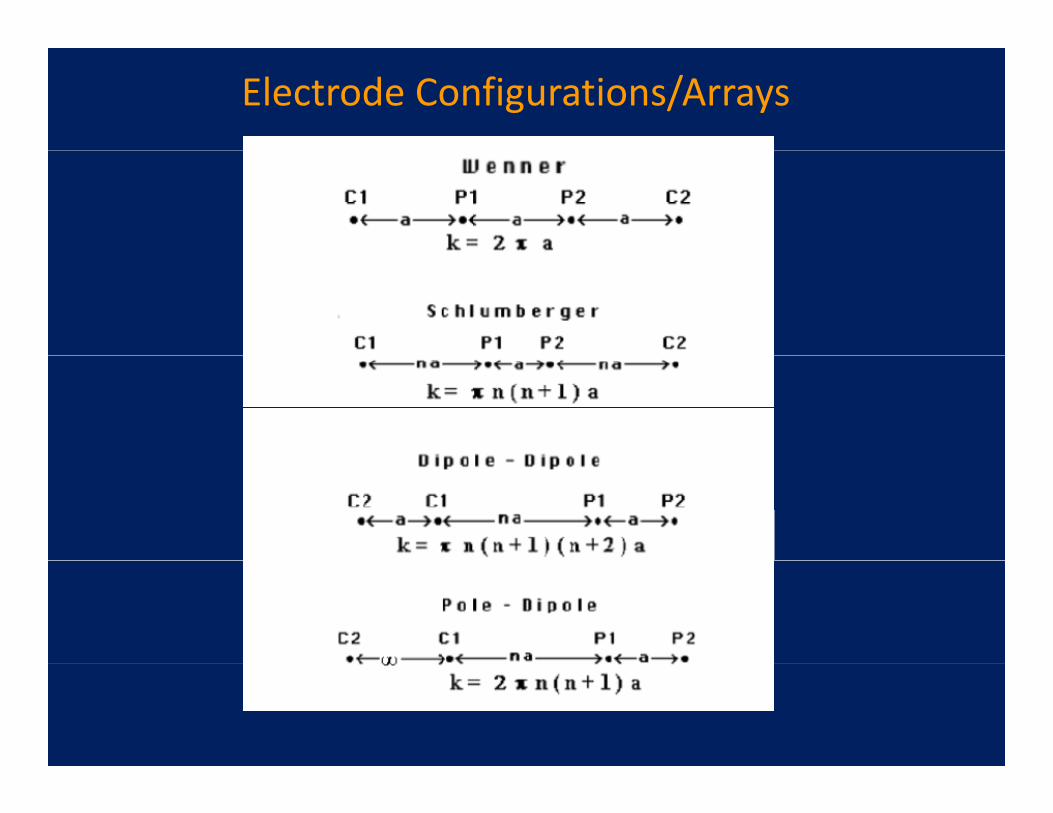
Electrode Configurations/Arrays
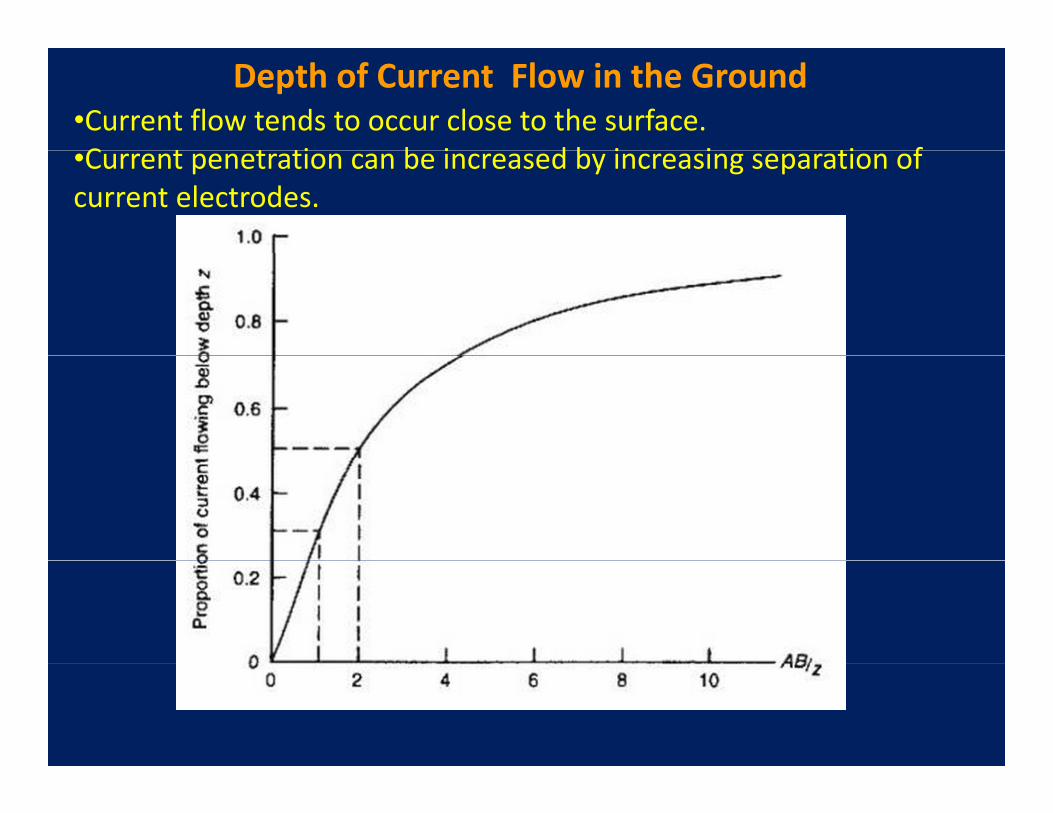
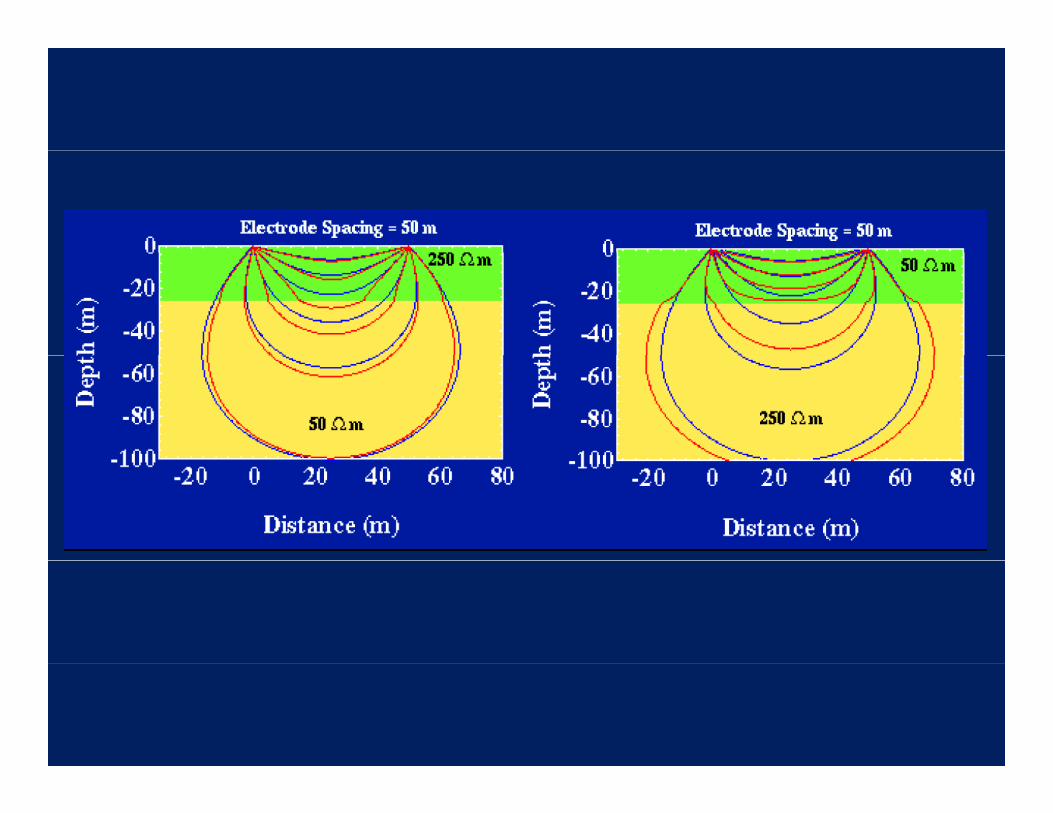
Depth of Current Flow in the Ground •Current flow tends to occur close to the surface. C t t ti b i d b i i ti f•Current penetration can be increased by increasing separation of current electrodes.

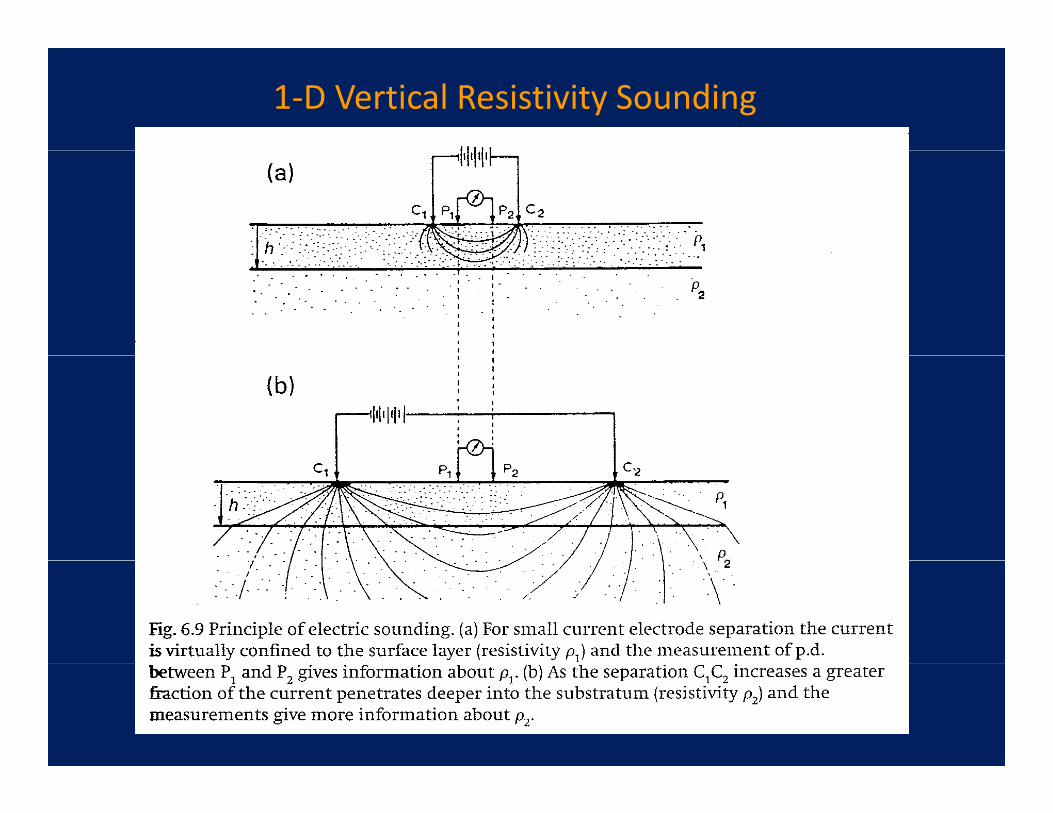
1‐D Vertical Resistivity Sounding
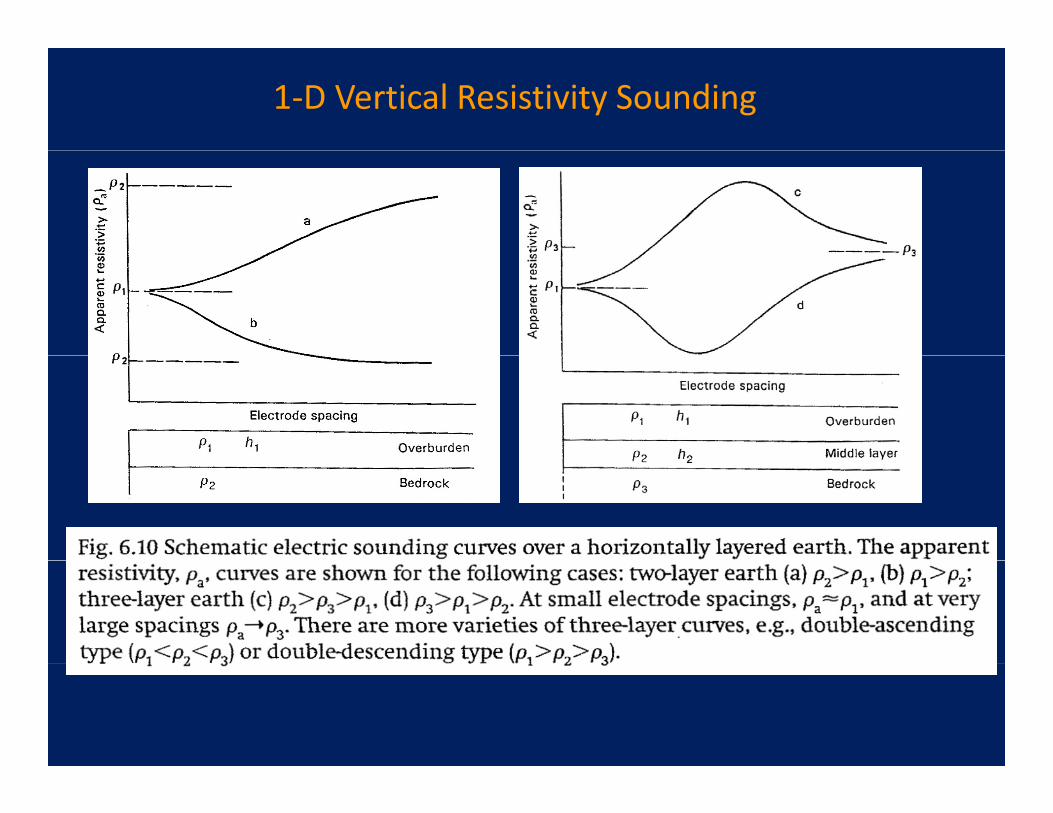
1‐D Vertical Resistivity Sounding
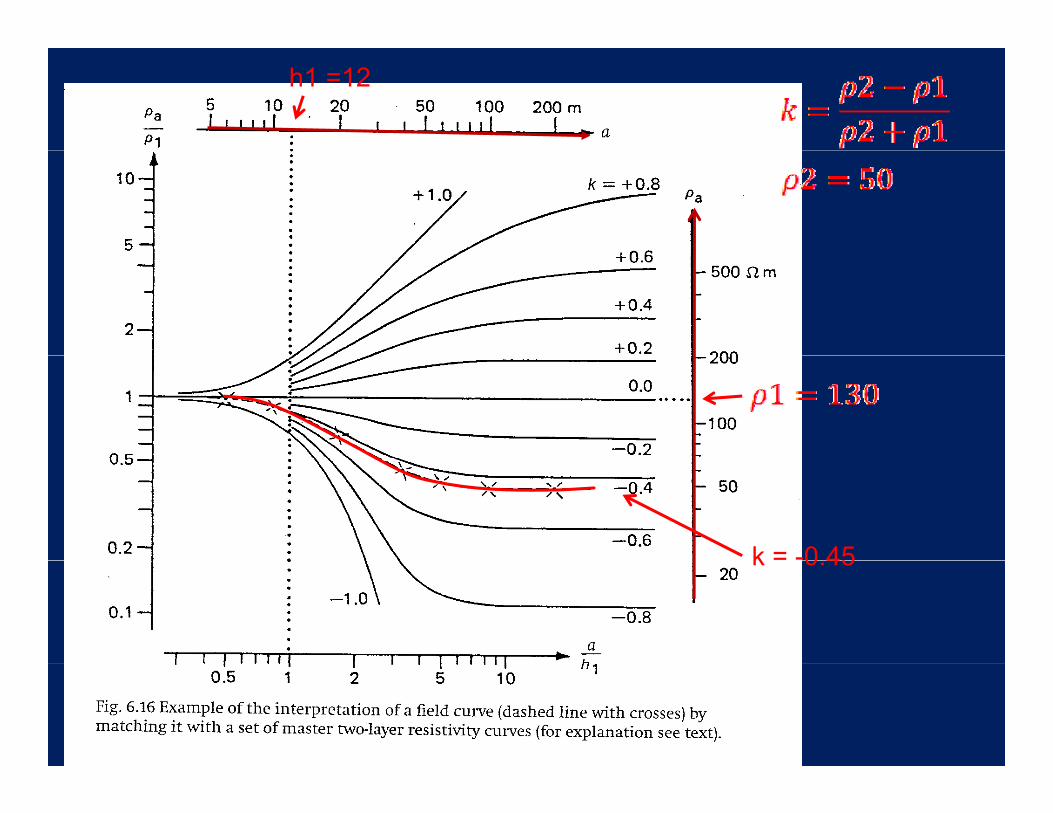
h1 =12
k = -0 45k 0.45
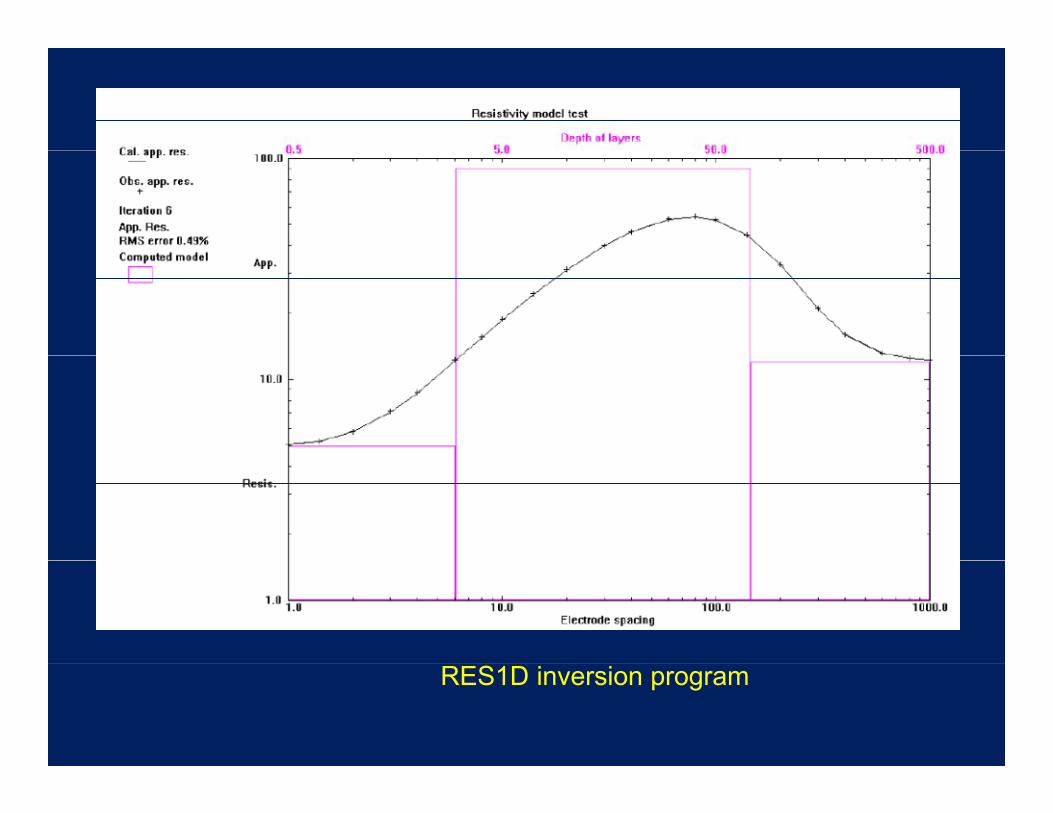
RES1D inversion program
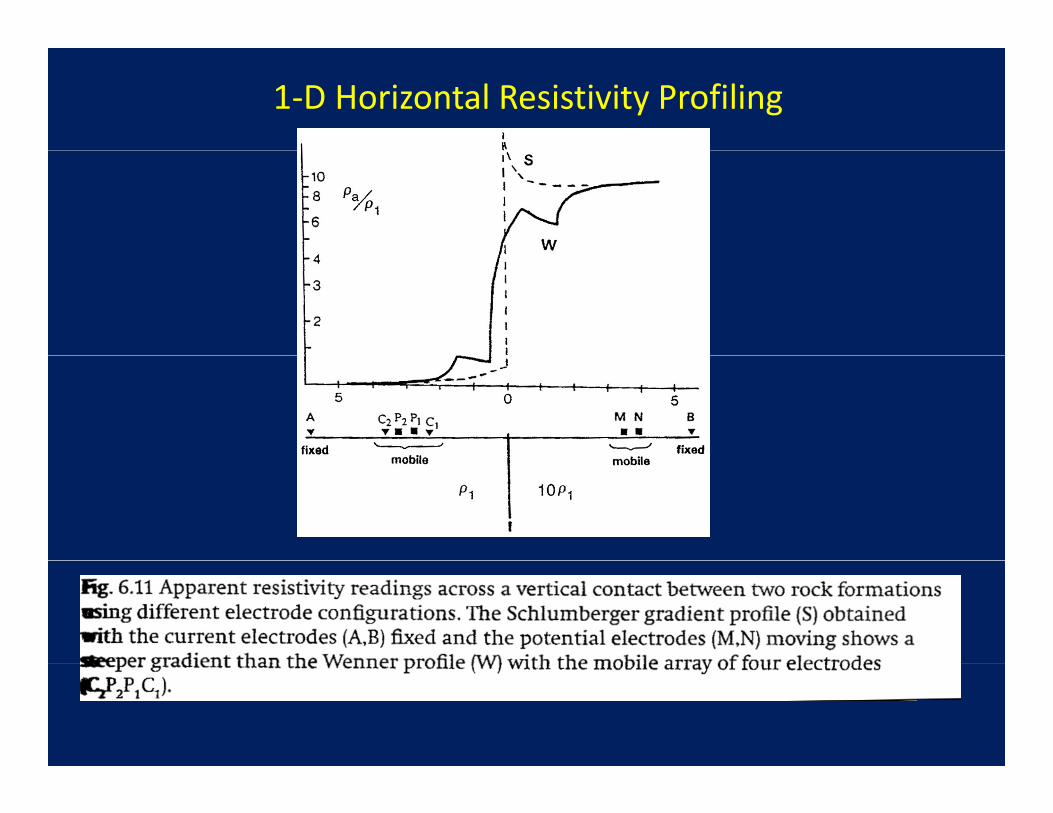
1‐D Horizontal Resistivity Profiling

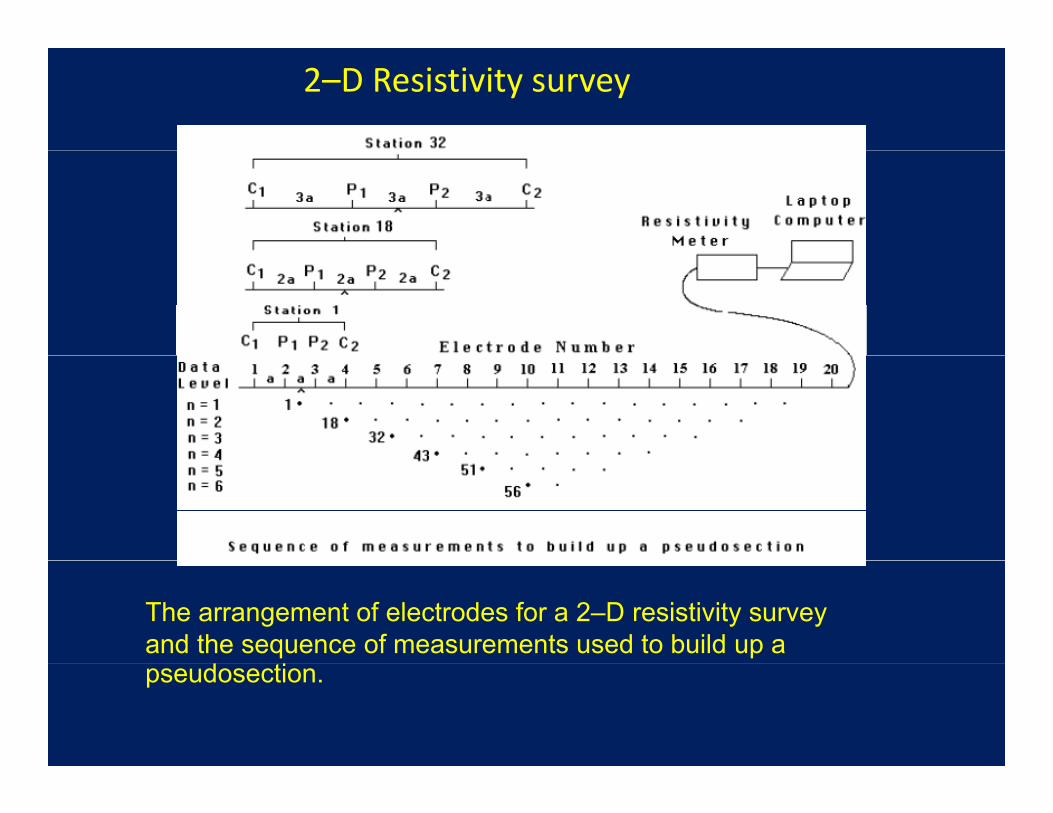
2–D Resistivity survey
The arrangement of electrodes for a 2–D resistivity survey and the sequence of measurements used to build up a pseudosection.

2–D Resistivity survey
The use of the roll-along method to extend the area covered by a 2-D survey.g y y

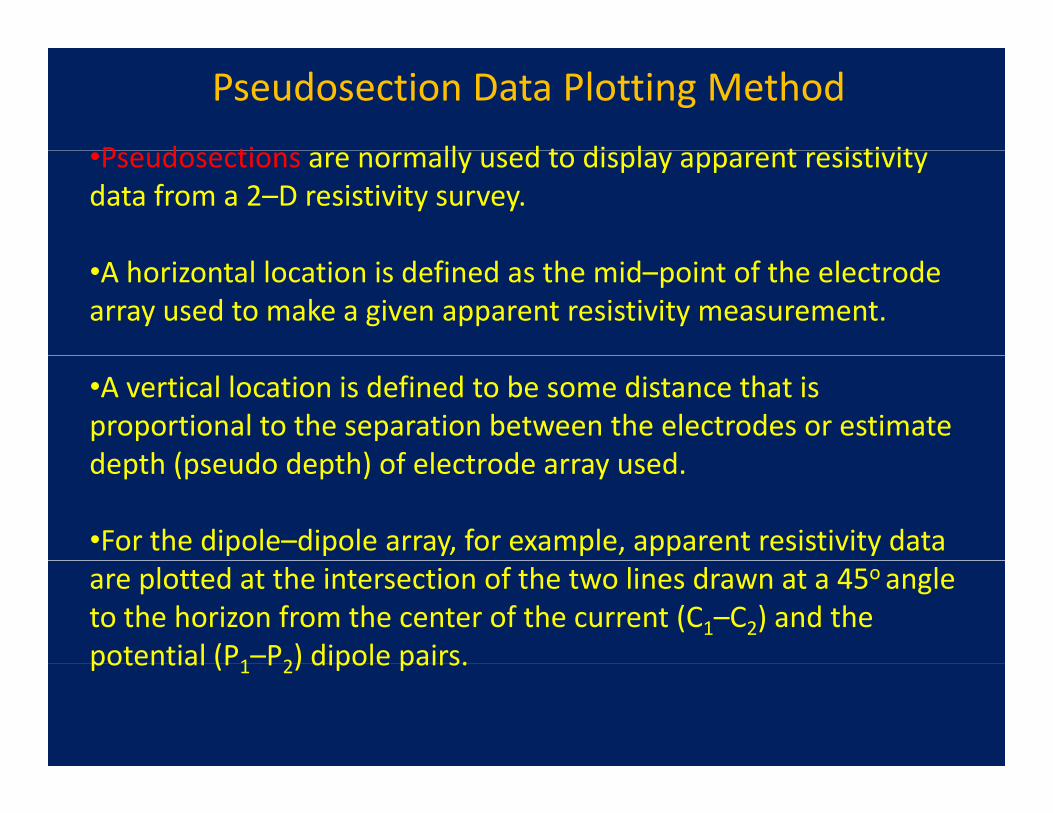
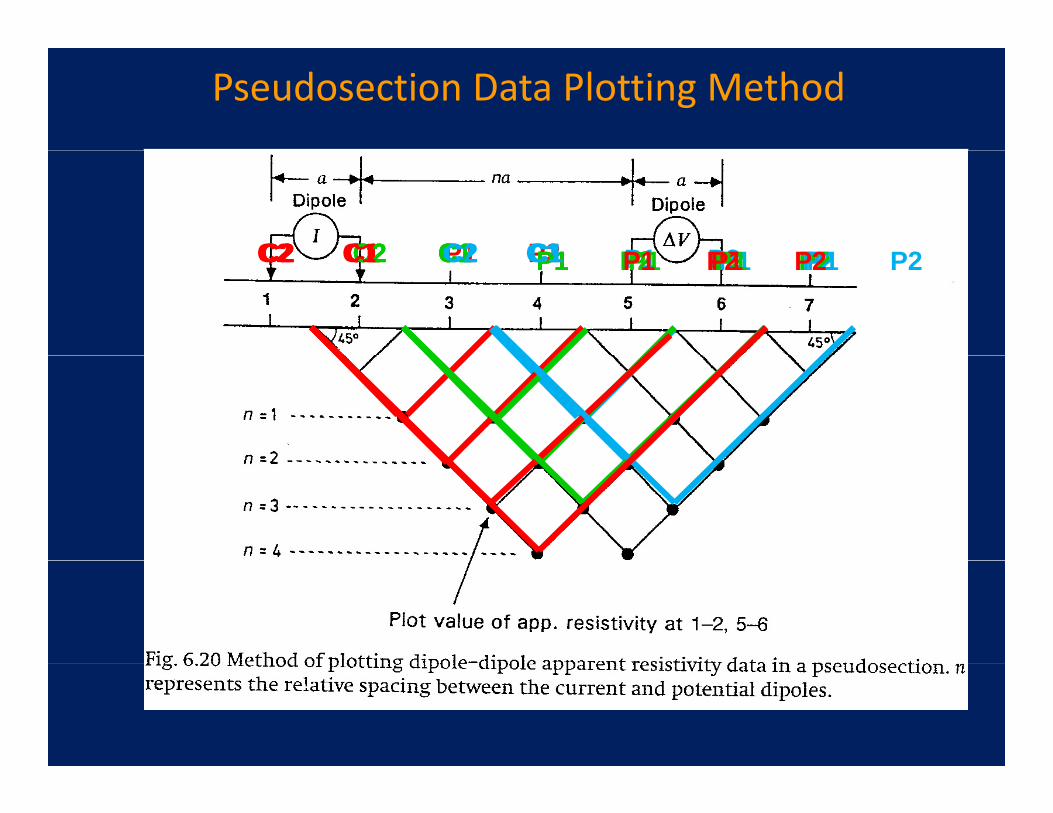
Pseudosection Data Plotting Method
P d ti ll d t di l t i ti it•Pseudosections are normally used to display apparent resistivity data from a 2–D resistivity survey.
•A horizontal location is defined as the mid–point of the electrode array used to make a given apparent resistivity measurement.
•A vertical location is defined to be some distance that is proportional to the separation between the electrodes or estimate d th ( d d th) f l t d ddepth (pseudo depth) of electrode array used.
•For the dipole–dipole array, for example, apparent resistivity data are plotted at the intersection of the two lines drawn at a 45o angle to the horizon from the center of the current (C1–C2) and the potential (P1–P2) dipole pairs.potential (P1 P2) dipole pairs.
Pseudosection Data Plotting Method
C2 C1 P1 P2C2 C1 P1 P2C2 C1 P1 P2C2 C1 P1 P2C2 C1 P1 P2C2 C1 P1 P2C2 C1 P1 P2C2 C1 P1 P2C2 C1 P1 P2C2 C1 P1 P2C2 C1 P1 P2C2 C1 P1 P2C2 C1 P1 P2C2 C1 P1 P2C2 C1 P1 P2C2 C1 P1 P2C2 C1 P1 P2C2 C1 P1 P2C2 C1 P1 P2C2 C1 P1 P2
Pseudosection Data Plotting Method
•Pseudosections give very approximate pictures of the subsurface resistivity distribution beneath the survey lines; however they provide only a distorted picture of the subsurface because theprovide only a distorted picture of the subsurface because the shape of the contours depends on the type of array.
•These data have to be modeled or inverted to convert the•These data have to be modeled or inverted to convert the pseudosections into a 2–D resistivity section that is ready for geological interpretation.
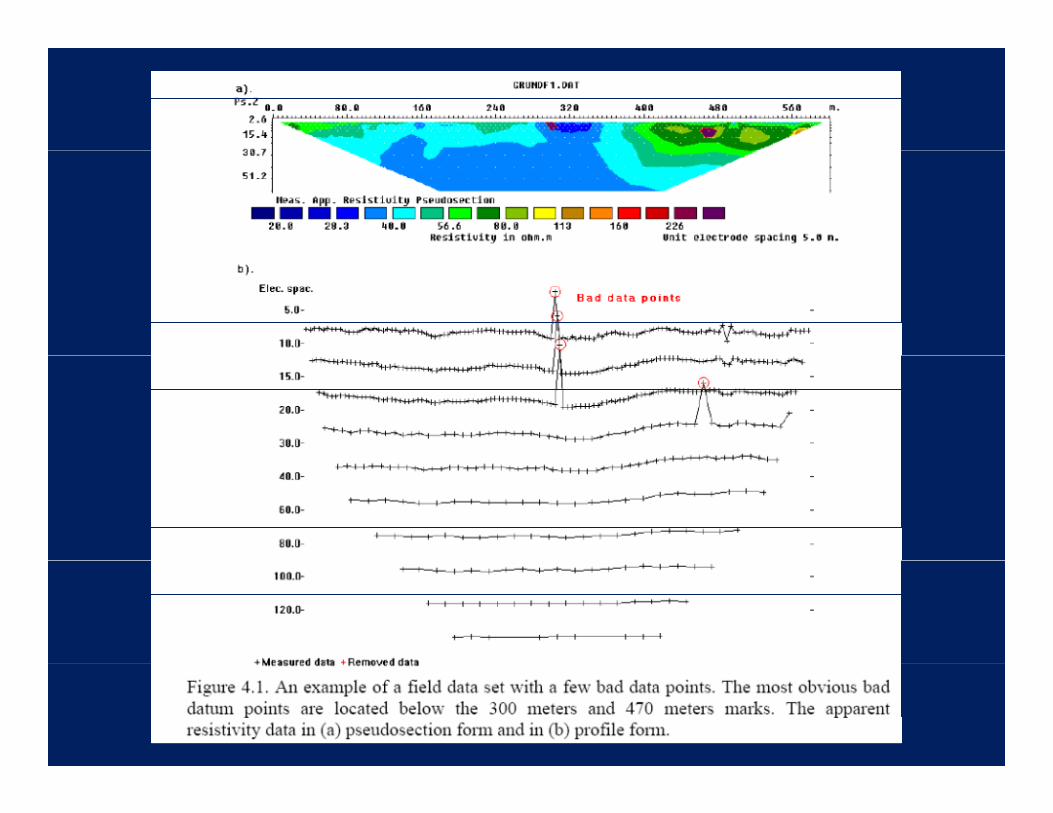
• The main use today of the pseudosection is for data quality analysis. Poor–quality apparent resistivity measurements, whichanalysis. Poor quality apparent resistivity measurements, which normally stand out as extreme values on the pseudosections, are readily identified and removed.
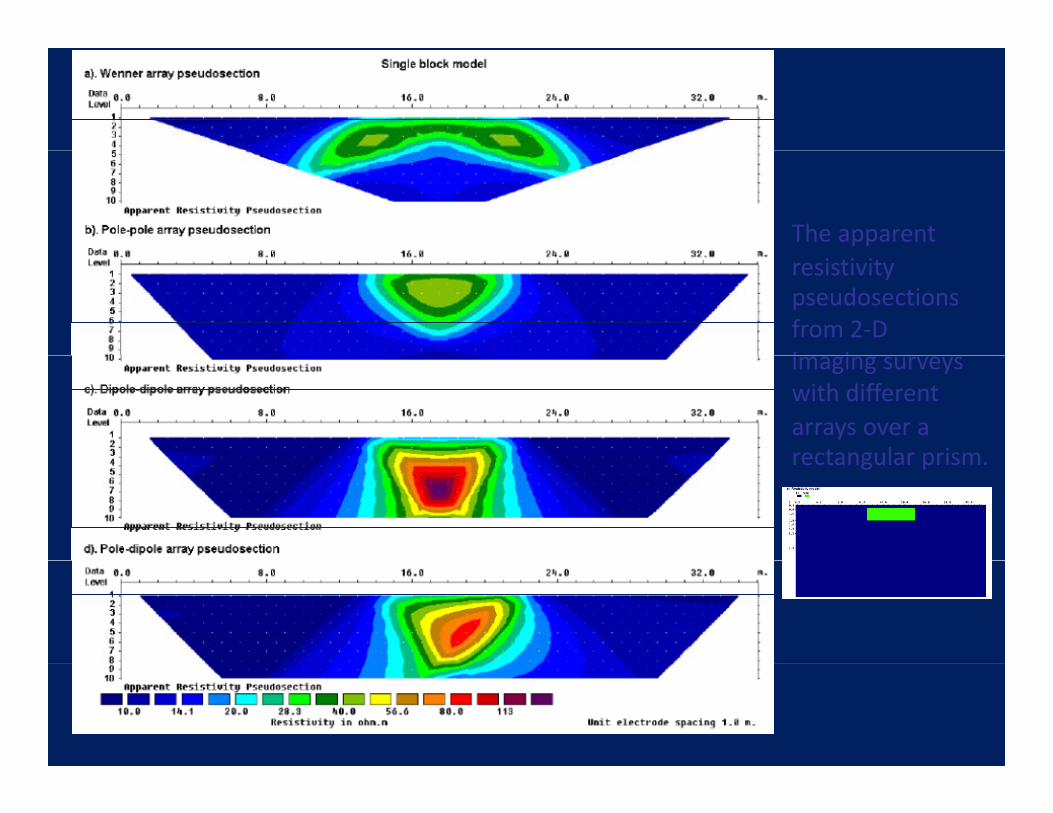
The apparent resistivity pseudosections from 2‐D i iimaging surveys with differentarrays over a rectangular prismrectangular prism.
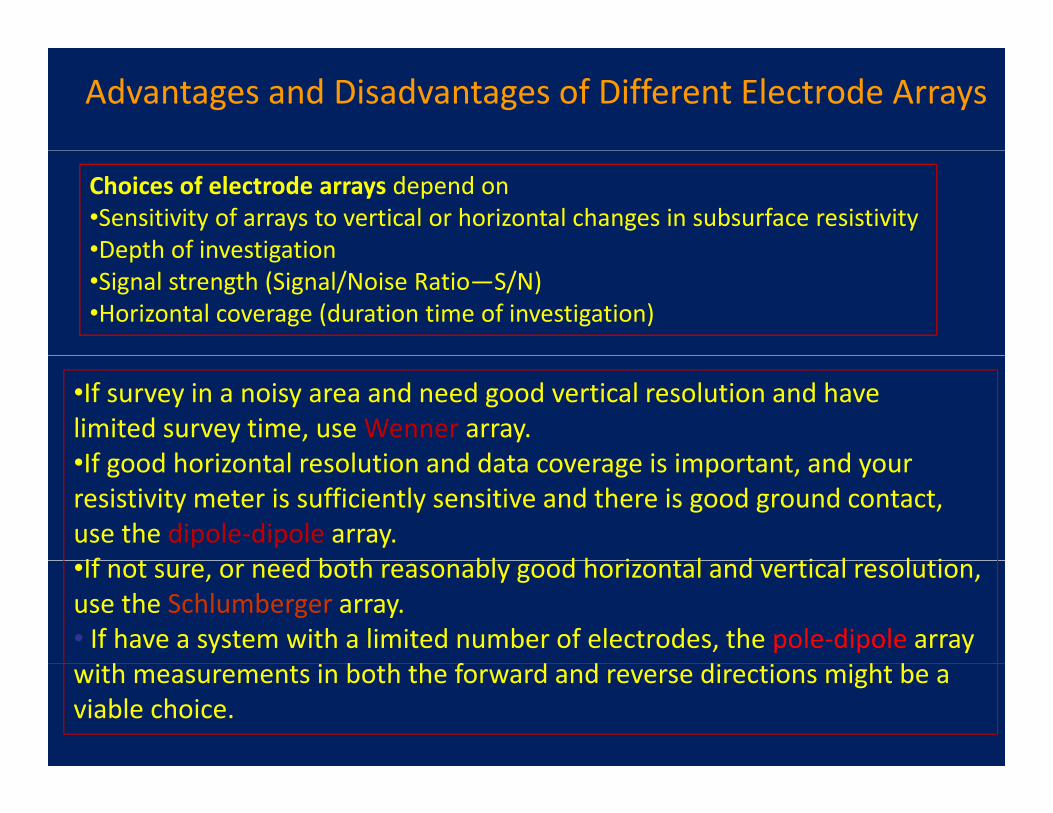
Advantages and Disadvantages of Different Electrode Arrays
Choices of electrode arrays depend on•Sensitivity of arrays to vertical or horizontal changes in subsurface resistivity•Depth of investigationDepth of investigation•Signal strength (Signal/Noise Ratio—S/N)•Horizontal coverage (duration time of investigation)
•If survey in a noisy area and need good vertical resolution and havelimited survey time, use Wenner array.If d h i t l l ti d d t i i t t d•If good horizontal resolution and data coverage is important, and your resistivity meter is sufficiently sensitive and there is good ground contact, use the dipole‐dipole array.If t d b th bl d h i t l d ti l l ti•If not sure, or need both reasonably good horizontal and vertical resolution, use the Schlumberger array.• If have a system with a limited number of electrodes, the pole‐dipole array
h b h h f h bwith measurements in both the forward and reverse directions might be a viable choice.
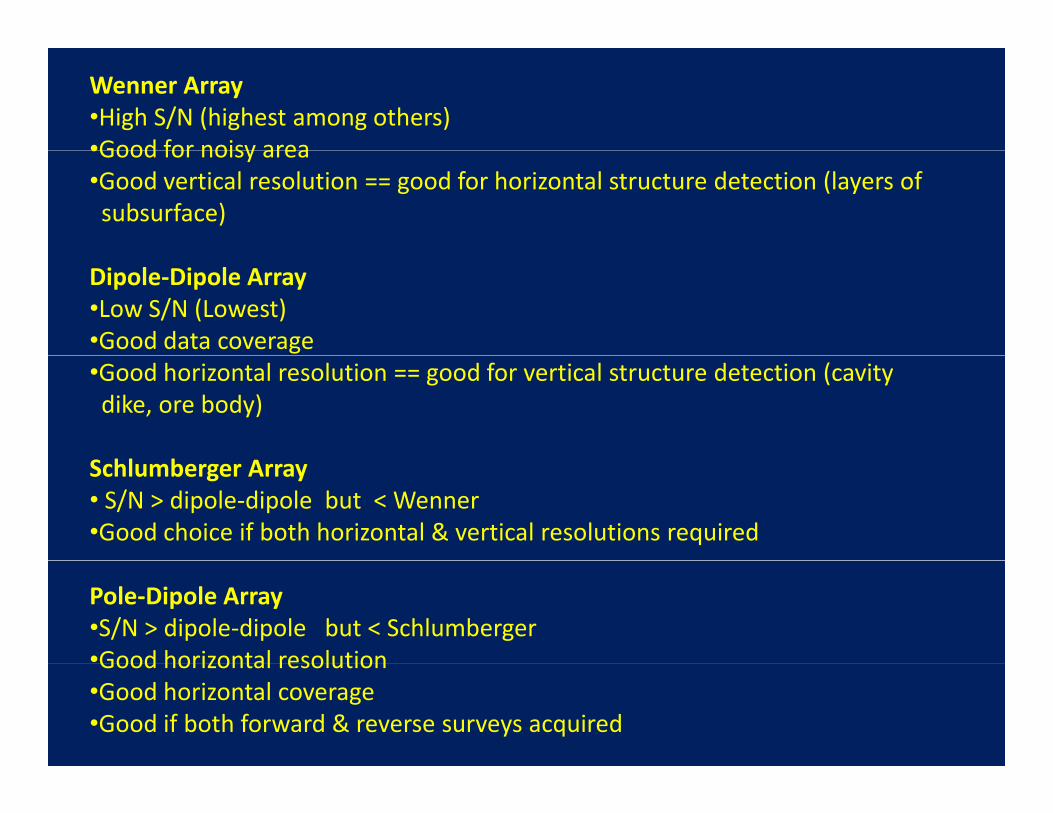
Wenner Array•High S/N (highest among others)•Good for noisy area•Good for noisy area•Good vertical resolution == good for horizontal structure detection (layers ofsubsurface)
Dipole‐Dipole Array•Low S/N (Lowest)•Good data coverage•Good horizontal resolution == good for vertical structure detection (cavitydike, ore body)
Schlumberger Array• S/N > dipole‐dipole but < Wenner•Good choice if both horizontal & vertical resolutions required
Pole‐Dipole Array•S/N > dipole‐dipole but < Schlumberger•Good horizontal resolutionGood horizontal resolution•Good horizontal coverage•Good if both forward & reverse surveys acquired
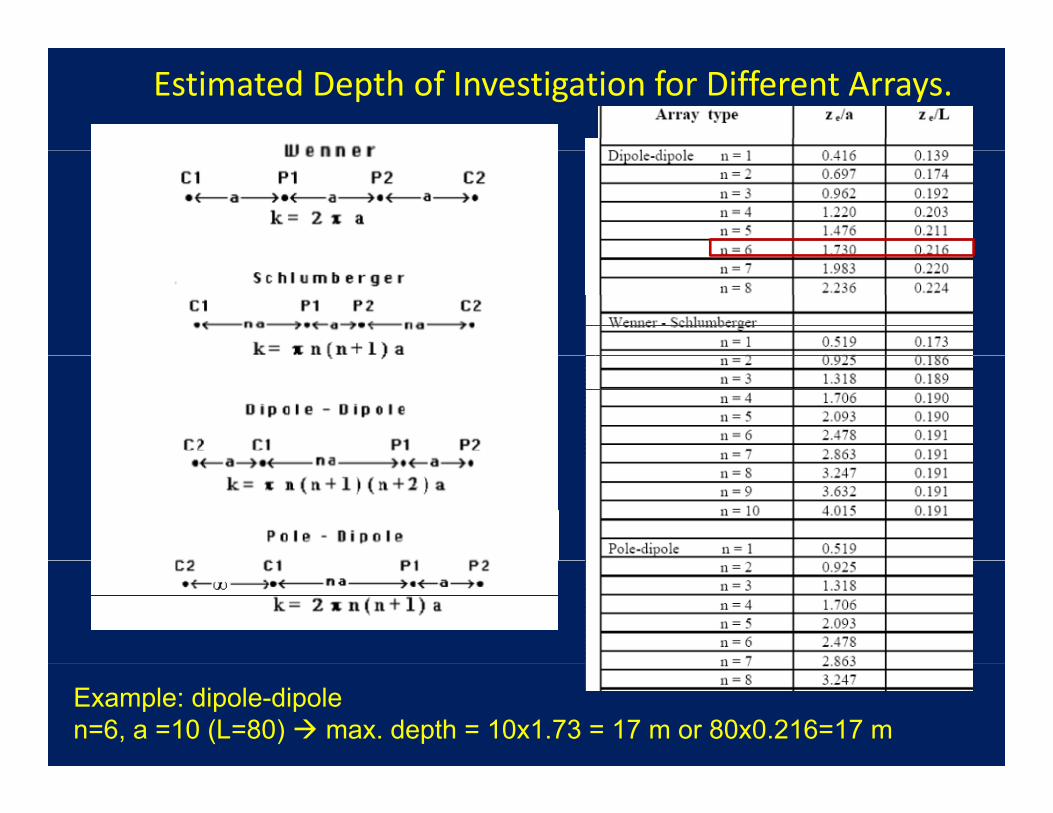
Estimated Depth of Investigation for Different Arrays.
Example: dipole-dipolen=6, a =10 (L=80) max. depth = 10x1.73 = 17 m or 80x0.216=17 m


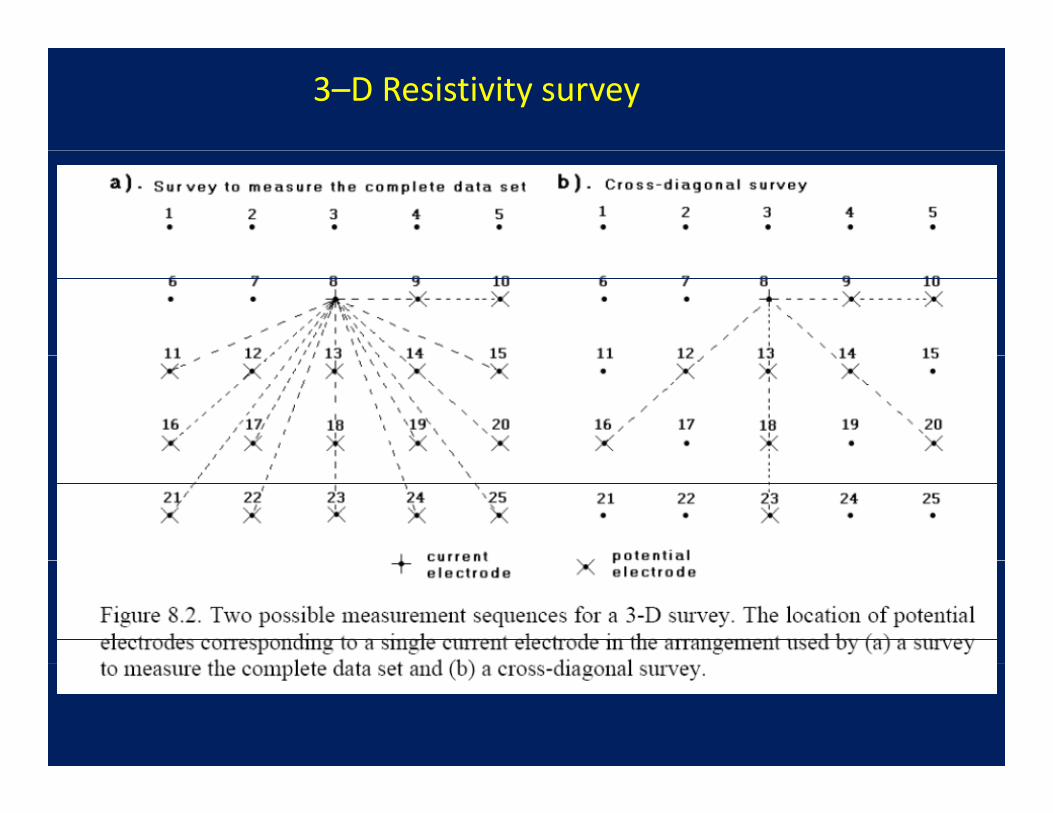
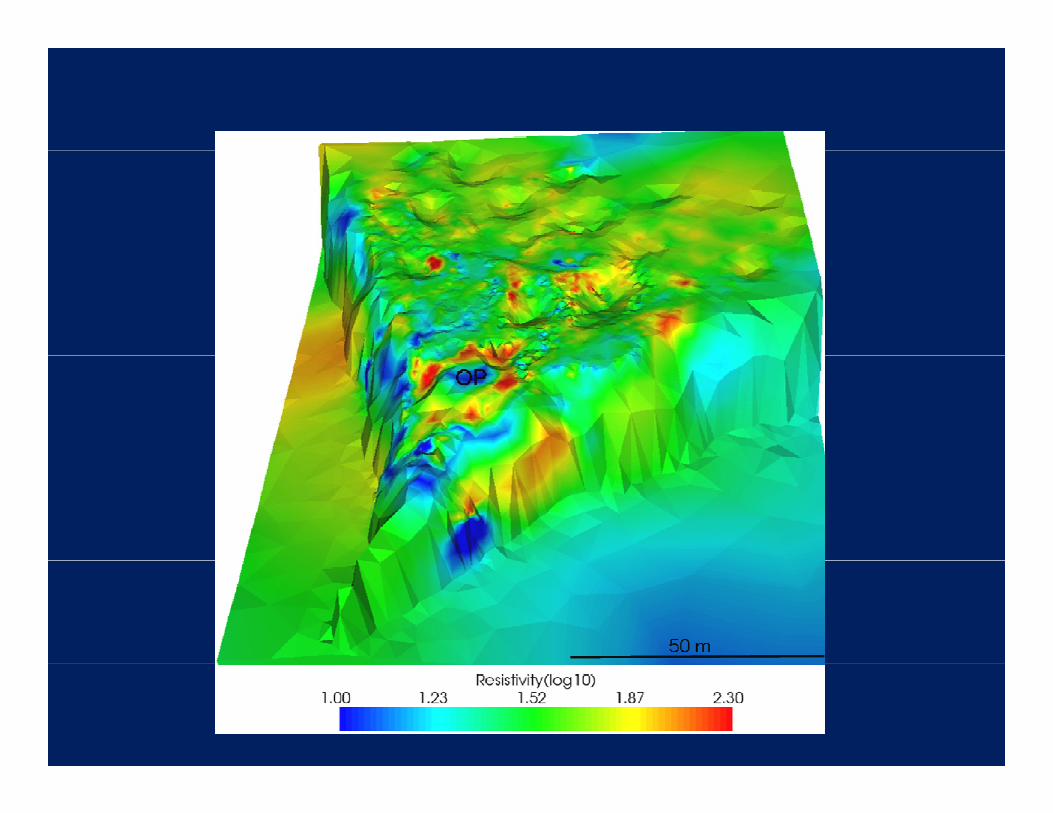
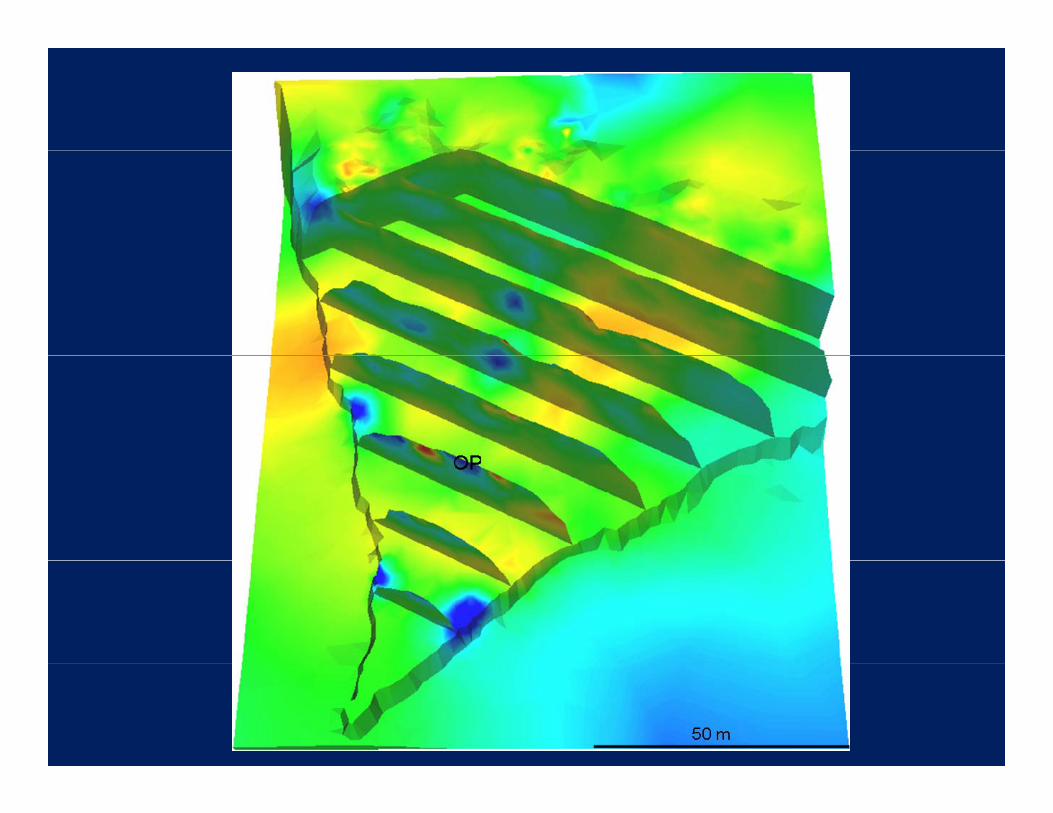
3–D Resistivity survey
Array Types for 3‐D•Dipole‐dipole•Pole‐dipolePole dipole•Pole‐pole
The arrangement of the electrodes for a conventional 3–D survey
3–D Resistivity survey

3–D Resistivity survey
Using roll‐along method to survey10x10 grid with a resistivity meter10x10 grid with a resistivity meter system with 50 electrodes.a) 10x5 grid in x‐directionb) 10x5 grid in y‐direction) g y
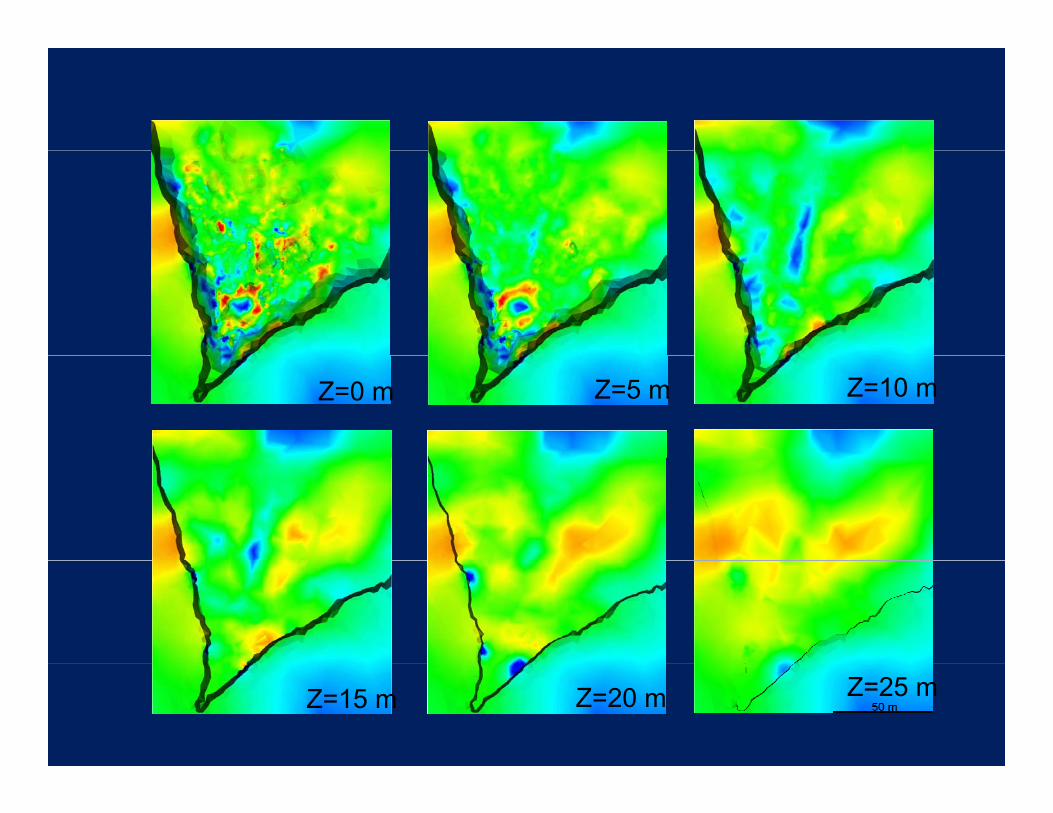
Z=0 m Z=5 m Z=10 m
Z=15 m Z=20 m Z=25 m