2020 youniversity deal challenge
TRANSCRIPT

Maison Jacquelyn
Strategy Discussion Document
Jenny Herrell| Jonathan Hu | Kennedy Jarvis
February 27th, 2020
2020 YOUniversity Deal Challenge

I. Executive Summary
II. Deliverable 1: Industry Overview
III. Deliverable 2: Acquisition & Deep Discounts Recommendation
IV. Deliverable 3: Valuation & Scenario Recommendation
V. Appendix
Table of Contents
[ 2 ]

Executive Summary
• Luxury footwear company exiting financial distress with the intent of maximizing debtholder value
Situation Overview
• Analysis of different scenarios between strategic and financial acquirers utilizing discounted cash flow, trading comps, and precedent transaction analysis
MJ Valuation
• Evaluation of deep discounts as a strategy to attract market shareDeep Discounts
• We recommend that MJ sell to a strategic buyer and avoid using deep discounts
Recommendation
[ 3 ]

Industry Overview
Deliverable I

• MJ has direct sales channels in all major European markets, with Western Europe being the top geographic area by size for revenue generation in the luxury segment
• MJ’s customer base of celebrities and executives is attributed to its high-quality offerings and geographic location
• MJ faces stiff competition in Paris, France, where many of the top players in the luxury segment are based
Market
Revenue Breakdown
History
• Maison Jacquelyn (“MJ” or “the Company”) is a luxury brand based in Paris, France that sells women’s luxury shoes
• The company was founded in 1960 by a French tailor and currently operates primarily through 99 brick and mortar stores
• MJ was purchased for $550M by a private equity firm in 2013, implying an EV/ FY2013 EBITDA multiple of 9.7x
Industry OverviewCompany Overview
[ 5 ]
60.5%
5.9%
30.1%
3.6%
Domestic Stores International Stores Department Stores Online
Positioning by 2018 Total Revenue ($ MM)
$15,690
$6,850
$3,608
$3,210
$1,546
$1,080
$635
$195
$0 $2,500 $5,000 $7,500 $10,000 $12,500 $15,000

Luxury Goods
Luxury Leather Goods
Luxury Watches &
Jewelry
Luxury Fashion
Apparel Footwear
Leather AthleticTextile &
Other
Luxury Eyewear
Prestige Cosmetics & Fragrances
• Maison Jacquelyn falls within the Luxury Fashion segment of the Luxury Goods industry as a Luxury Footwear firm
• 2019 expected revenue in the Luxury Footwear segment amounts to $32.3B. The market is expected to grow annually by 3.5% (CAGR 2019-2023) 1
• Globally, the United States holds the largest single country market share ($7.1B in 2019) 1
• In 2018, average online luxury footwear expenditure per transaction increased 4% to $794 (versus $782 for accessories and $716 for apparel), and purchase frequency edged up to 1.6 times per year 2
Industry OverviewLuxury Goods
Industry Structure
1 Statista 2 Footwear News [ 6 ]
Luxury Footwear Global Revenue Market ($ MM)
$0
$5,000
$10,000
$15,000
$20,000
$25,000
$30,000
$35,000
$40,000
2012 2013 2014 2015 2016 2017 2018 2019 2020 2021 2022 2023

• Participation in sports is projected to increase at an annualized rate of 1.8% to 2024 3
• Athletic footwear saw the largest revenue gains in 2018, achieving a 9.5% YOY increase vs. textile / other (4.6%) and leather (-2.9%) 4
• Growing up in sportswear brands, millennial consumers value the flexibility that casual attire offers and, now coming into their own wealth, seek an upscale version of casual wear
• As a result of shifting demographics, luxury brands are adapting to the preferences of younger consumers in terms of engagement strategies, using social media advertisements and purchased endorsements from influencers
• Firms are also transforming their stores to create millennial friendly, meaningful shopping experiences (Gucci recently unveiled a new concept store in NYC) 1
Social Media & Story Telling Athleisure & Streetwear
Industry OverviewKey Growth Drivers
[ 7 ]
As Millennials and Chinese / Asia Pacific groups represent a greater proportion of luxury consumers, retailers must continue to adapt differentiated strategies to compete for their consumption.
• By revenue alone, China is the top consumer of fashion (but currently third in luxury footwear), and Asia Pacific is projected to make up 38% of fashion market demand in 2020 1
• Chinese consumers led the positive growth trend around the world in 2018. Their share of global luxury spending continues to rise (now 33% of the total, up from 32% in 2017), driven by rising demand 2
• Millennials and Gen Z accounted for 47% of luxury consumers in 2018 and for 33% of luxury purchases; however, they contributed virtually all of the market’s growth 2
• These groups will represent approximately 55% of the 2025 market and will contribute 130% of market growth between now and then, offsetting the decline in sales among older generations 2
1 ShopifyPlus 2 Bain & Company 3 IBS 4 Brandon Gaille
Millennial & Generation ZAsian Markets

-2.0%
0.0%
2.0%
4.0%
6.0%
8.0%
10.0%
France US Japan Italy China
2014 2015 2016 2017
Industry OverviewMacroeconomic Indicators: Growth Opportunities in China
[ 8 ]
The luxury footwear market is presently dominated by the US with major growth recently seen in China, which increasingly outpaces historically dominant European markets as their disposable income grows. Additionally, China has 4x the
population of the US and 11x, 24x, and 22x the populations of Japan, Italy, and France, respectively.
Chinese Population (MM) 2
Top 5 Luxury Footwear Markets by Country ($ MM) 3
$0
$1,000
$2,000
$3,000
$4,000
$5,000
$6,000
$7,000
UnitedStates
Japan China Italy France
Disposable Income % Growth 1
550
600
650
700
750
China - Male China - Female
1 OECD 2 United Nations 3 Statista

Industry OverviewSWOT Analysis Overview
[ 9 ]
• MJ’s direct sales channels in all major European markets solidifies market share in Western Europe, which is one of the top geographic areas for revenue generation in the luxury segment
• A customer base comprised of celebrities and high net-worth executives creates significant brand value through influencers that improve social media strategy to target younger generations
• Being from Western Europe (specifically Paris) allows unique brand identification associated with geography and creates the impression of exoticism in the minds of consumers, particularly US, Asia, and South America
Strengths
• Capital intensive nature of the brick and mortar business model requires increased financing sources and, as a result, has increased leverage and resulted in the company’s present state of financial distress
• Lack of digital presence restricts geographic market reach, advertising capabilities through social media and influencers, and customer optionality
• Minimal exposure to China and Asia Pacific markets hinders sales growth in areas where disposable income and demand for luxury goods is rising most
Weaknesses
• The continued growth of consumer engagement with luxury brands through social media will provide MJ with increased exposure and geographic reach
• Opportunity to participate in brand collaborations, celebrity sponsorships, and a lower-cost product line could allow MJ to appeal to younger generations
• The rise of e-commerce and increased web traffic to luxury brand sites presents the Company with room to improve its online segment
Opportunities
• Stiff competition and fads in the luxury segment impact customer retention and expansion of market capitalization
• Operating margins are highly susceptible to trade war tariffs as additional fees threaten to increase manufacturing costs and disrupt distribution channels
• Significant capital invested in outdated business model induces reluctance to exit underperforming markets and stores
• Due to its financial distress, MJ’s competitors will have better access to cheap capital – even if they escape distress, they will continue to struggle to obtain cheap debt and investors for years in the future
Threats

[ 10 ]
Industry Overview SWOT Analysis: Weaknesses
[ 10 ]
• MJ’s SG&A margin currently sits at 44.2%, which is higher than industry average of ~36% in 2017
• In this industry, SG&A cost discipline differentiates top and bottom performers
• A focus on cost cutting and operational efficiency are key to growing the bottom line and generating strong free cash flow
• Margin expansion is the key to a healthier capital structure
• MJ has yet to capitalize on its expansion into international markets
• International sales for top luxury fashion brands such as Gucci and Hermes comprise 72% and 68% of sales, respectively, compared to MJ, who only generates 5.9% of its revenues abroad 1
• China delivered more than half the global growth in luxury spending between 2012-2018, and is expected to deliver 65% of the world’s additional spending heading into 2025 1
19%32% 35% 40%
81%68% 65% 60%
2012 2018 2020 2025
Chinese Consumers Other Worldwide Consumers
Global Luxury Goods Consumption 1
0%
5%
10%
15%
20%
25%
30%
35%
40%
45%
50%
2013 2014 2015 2016 2017 2018
SG&A Margin EBITDA Margin
MJ Margins
Lack of International Presence in AsiaOperational Inefficiencies
1 McKinsey

[ 11 ]
Industry OverviewSWOT Analysis: Opportunities in E-Commerce
[ 11 ]
• MJ’s consumer base of high-profile individuals provides the Company additional growth opportunities to leverage social media and promote limited edition products via these customers’ accounts
• 93% of consumer engagement with luxury brands occurs through social media 1
• By utilizing the virtual marketplace, celebrity collaboration could generate media buzz and increase demand for MJ’s products, furthering the Company’s perceived scarcity and increasing revenue without brand dilution
• MJ generates the least amount of revenue from its online segment, which stands at only 3.6% of total sales
• Contribution of online luxury sales to global high-end markets are set to triple by 2025, accounting for 20% of all luxury purchases made 2
• Web traffic to luxury brand sites increased by 16% YOY in 2018 signifying consumer trends that favor online sales 2
• Online sales present a clear opportunity for growth for MJ that the Company is failing to capitalize on
Global Online Fashion Sales ($ BN) 3
$534$600
$680 $662
$825$873
2018 2019 2020 2021 2022 2023
Sales of Personal Luxury Goods 3
8% 12% 19%
92% 88% 81%
2016 2020E 2025E
Online Offline
1 Digimind 2 McKinsey 3 Statista
E-Commerce Opportunities

Industry OverviewPorter’s Five Forces Overview
[ 12 ]
• Increased discretionary income and fashion conscientiousness of the general public means that luxury products are no longer reserved for the highest echelons of society, and increased mass consumption decreases the relative power of individual buyers
• Buyers lack concentration and purchase in small quantities—often only purchasing one item one time—which also decreases buyer power• However, with no switching costs, contracts, or interconnectivity benefits, the consumer has the ultimate choice
Power of Buyers
• The luxury goods industry is a largely saturated market dominated by renowned key players, each with distinct intrinsic valueand consumer sentiment• Brand reputation and customer loyalty are the primary drivers of consumer choice• Older generation is more tied to traditional and less open to new entrants, but as customer base shifts to younger generations, the customer base becomes
less stable
Competition in the Industry
• Suppliers of raw materials (leather, textiles, rubber, polyurethane, etc.) are generally numerous and equally balanced which drives down input prices• Most big-name brands refuse to compromise artisanal production processes even in the name of achieving economies of scale• Uncertain tariffs could play a role long-term, as the labor-heavy manufacturing process is centrally located while inputs must be sourced internationally
Power of Suppliers
• MJ’s target market is made up of a loyal and dedicated customer base (celebrities, executives, etc.) whose substantial income generally mitigates the impact of an economic downtown on their consumer spending habits
• However, their peripheral customer base of lower upper-class consumers have a more elastic demand; these consumers, known as HENRYs (High-Earners-Not-Rich-Yet), are likely to turn to a cheaper alternative in the event of an economic downturn; substitution risk is higher with these consumers
• A significant portion of the value associated with a designer product is intrinsic in the name and is not easily substituted for another, but consumers of one luxury brand often make purchases of other brands
Threat of Substitution
• The glamor, history, and intrigue that surround brand names are extremely difficult for new entrants to recreate• While input costs and equipment requirements are low, which would suggest easy entry, the hallmarks of luxury brands such as heritage craftsmanship,
brand name, and existing customer loyalty create high barriers to entry• In recent years, new entrants such as Golden Goose have been able to carve a niche space in the luxury sneaker market, but it is unlikely that these fad
brands will significantly infringe on the market share of traditional, well-known products and brands
Threat of New Entry

[ 13 ]
Industry OverviewHENRYs
Moving forward, luxury brands need to capitalize on the deep and developing class of High-Earners-Not-Rich-Yet, better known as HENRYs.
• HENRYs are classified as having an average age of 43 years, earning an annual income of more than $100,000, and controlling less than $1 million in investable assets 1
• This new demographic is digital savvy, makes many online purchases, and has a high ceiling for discretionary expenditures
• HENRYs engage in “aspirational spending”; that is, spending just within their means (as opposed to saving or investing) in order to be perceived as a member of an elite class
• Because this class of citizens is young, image-driven, and highly influenced by modern technology, most well-known luxury brands such as Gucci and Louis Vuitton have exponentially increased their social media presence
• Early establishment of a relationship with this group will secure sales in the short-run and build customer loyalty in perpetuity
1 Equifax 2 Deloitte
$60,000$67,000
$86,000
Baby Boomers Gen X Millenials
Brand Instagram Facebook Twitter
Louis Vuitton 35.3M 23.4M 7.4M
Gucci 37.7M 18.6M 5.7M
Dior 28.4M 16.8M 8M
Burberry 16M 17.4M 8.3M
Prada 21.6M 6.7M 1.1M
Calvin Klein 19.5M 13M 3.6M
Versace 20.3M 5.5M 4.7M
Average Annual Spending per HENRY Household 2 Social Media Following by Platform

• Brand collaborations are no longer a tool used only by start-ups to gain endorsement of an established brand
• There has been a significant increase in recent years of luxury brands with established customer bases of their own working with different brands for various reasons
• A luxury brand may collaborate in order to reach new markets, gain intangible expertise, offer new products to existing customers, or revitalize a dying brand
• It is important to cater to millennials because they are now the most numerous living generation and their spending power is expected to reach $1.4 trillion by 2020 1
€ 0
€ 5,000
€ 10,000
€ 15,000
€ 20,000
Watchesand Jewelry
Wines andSpirits
Perfumesand
Cosmetics
SelectiveRetailing
Fashion andLeatherGoods
2016 2017 2018
Louis Vuitton Sales Post Collab (€ MM)
[ 14 ]
Industry OverviewBrand Collaborations
Brand Collaborations U.S. Population by Generation (MM) 2
0
20
40
60
80
2016 2019 2028 2036 2050
Millennial Gen X Boomer Silent
1 WWD 2 U.S. Census Bureau
Case Study – Louis Vuitton x Supreme
• In June of 2017, Louis Vuitton and Supreme launched one of the most successful collaborations to date
• Louis Vuitton, one of the most respected luxury brands by Boomers and Gen X’ers, was able to gain entry into the style-conscious millennial market by associating themselves with Supreme, a 90s-era skate wear brand
• Since the launch of the collaboration, Louis Vuitton’s Fashion and Leather Goods segment has grown at rates of 21% and 18% in 2017 and 2018, respectively – far surpassing the growth in their other segments
Brand collaborations are a powerful tool used by luxury brands to increase engagement with new audiences, specifically the rising millennial generation.

Appendix Payless ShoeSource Bankruptcy Case Study
[ 15 ]
The rise of e-commerce along with stiff industry competition has led to a trend of retail bankruptcies and store closures.
• Payless ShoeSource's second bankruptcy in two years signifies the industry’s shift away from brick-and-mortar retail as well as the detrimental impacts of private equity dividend recapitalizations
• Stiff competition from larger competitors, antiquated inventory management during holiday seasons, and inability to capitalize on online sales led to lack of profitable stores from Payless and an inability to pay off debt from dividend recaps
• This phenomenon isn’t unique to Payless, popular brands such as J.C. Penny, Sears, and Gymboree all underwent bankruptcies and store closures
• Traditional retailers are struggling to attract and retain customers as online retailers like Amazon are beginning to take over market share
High Profile Retail Store Closures
Retail Store Closures by Brand 1
53
70
102
230
250
251
390
520
805
2,500
0 500 1,000 1,500 2,000 2,500 3,000
Victoria's Secret
Sears
Performance Bicycle
GAP
Chico's
Shopko
Family Dollar
Charlotte Russe
Gymboree
Payless Shoe Source
Retail Bankruptcies
1 Business Insider

Bankruptcy Overview Major Retail Bankruptcy Filings 2
Private Equity Dividend Recapitalizations
• On February 19, 2019, Payless ShoeSource filed
for Chapter 11 bankruptcy with plans to close all 2,500 U.S. and Canadian stores.
• This is the second bankruptcy for the company since 2017, where Payless arranged a deal to cut debts accumulated through a private equity deal and close struggling stores
• Payless had about $470MM in outstanding debt at the time of filing
Dividend Related Leveraged Loan Volume for PE Owned Retail Borrowers ($ BN) 1
Appendix Payless ShoeSource Bankruptcy Case Study
• Financial sponsors Golden Gate Capital and Blum Capital paid themselves $350MM in dividends after an LBO in 2012, forcing Payless to take out leveraged loans
• Low interest rate environment during the time period led to lower cost of borrowing
• Dividend recaps added over $700MM in debt to Payless’s balance sheet
• Reorganization plans in 2019 cite that debtors will reorganize around the company's existing Amazon sales channel and Latin American joint ventures [ 16 ]
$12.5 $12.6
$20.0
$15.3 $15.4
$5.2
$2.7 $2.8
2010 2011 2012 2013 2014 2015 2016 2017
10
1718
23
14
19
2014 2015 2016 2017 2018 2019
1 WSJ 2 FT

Acquisition Analysis
Deliverable II

Deliverable II: Acquisition AnalysisFactors to Consider when Acquiring
[ 18 ]
When considering a strategic acquisition of an online retailer in the case of Scenario II, it is first crucial that MJ determines the acquisition’s ROIC is greater than the cost of capital. If this holds true, they should examine the
following attributes:
• Lack of physical inventory to eliminate MJ’s burden to manage other brands working capital
• Price setting optionality for seller and a history of consistent pricing with minimal discounts and sales
Marketplace Business Model
• Ability to offer high quality delivery services such as same-day shipping, special packaging, and online live tracking, offering easy to navigate product return policies
Quality Delivery Services
• Strategy focused on minimizing operating costs for margin improvement
• Proper management of working capital to improve short term liquidity and maximize free cash flow and ROE
Operating Efficiency
• Product offerings will impact the MJ brand’s sales: how many other brands will be offered, will these brands cannibalize or compliment MJ’s sales, and does MJ have the capacity to manage such a marketplace
Product Listings
• Seamless integration of store atmosphere, social media, and digital marketplace to engage consumers
• Aggregated data collecting system to improve upon strategy and enhance customer experience
Digital Presence

Revenue ~€130M
Headquarters Florence, Italy
• Multi-brand fashion boutique with a digital and brick-and-mortar presence founded in 1970
• Acquired by Farfetch in May of 2015 to expand online retail and reach a more global market
• Famous for discovering designers from Alexander McQueen and John Galliano to Christopher Kane and Simone Rocha
• Brick and mortar is contrary to strategic initiative of MJ to reduce physical presence
Revenue ~$180M - $200M
Headquarters New York, United States
Revenue ~£100M - £120M
Headquarters London, England
[ 19 ]
Deliverable II: Acquisition AnalysisPotential Targets
Revenue ~£20M – £50M
Headquarters Edinburgh, Scotland
• E-commerce retailer for independent fashion boutiques
• Founded by the online retail entrepreneur, Mike Welch, in 2016 after selling his previous endeavor, Blackcircles, for ~£50M
• “On track for sales growth of 150% in 2019, while non-EU sales are increasing and now make up a third of its revenues” – Mike Welch (The Herald)
• Marketplace business model aligns with the needs of MJ
• Carries over 500 of the world’s leading designers in men’s women’s, and children’s fashion as well as home goods
• Offers customer service in 9 languages and shipping is available worldwide
• Founder is originally from Paris and the brand has maintained close ties with renowned brands Balenciaga, Balmain, Saint Laurent, and Givenchy, etc. since 1968
• Broad range of good offerings dilutes the emphasis on shoes, MJ’s main focus
• Philosophy is “high-tech meets high-touch,” meaning an experienced team of industry specialists are a click away
• Offers professionally curated in-season “boutiques” that feature clothing, shoes, and accessories for both men and women
• Preserves the shopping experience that elite clientele are accustomed to
• Headquarters in NYC could make integration into MJ’s Paris-based business difficult
Source: Revenue figures are internal estimates

Deliverable II: Acquisition AnalysisTarget Acquisition Recommendation
• British boutique e-commerce platform with over 250 boutiques and 70,000 luxury apparel products
• Developed global sales network that covers 94 countries, 80 languages, and 10 currencies
• Marketplace business model that connects boutiques with online customers, receiving commission on each sale
• Experienced e-commerce entrepreneur, Mike Welch, acquired the IP asset of Atterley Road in February 2016 to create the company
Overview
Source: atterley.com, drapersonline.com, heraldscotland.com
Strategic Rationale
• Atterley’s estimated ~£20M – £50M in sales make it an ideal add-on acquisition target with regards to size
• Mike Welch, Atterley’s founder, has successfully developed other e-commerce businesses and would partner well with the MJ management team
• He founded an online tire retail business, blackcircles.com, in 2003 and sold it to Michelin in 2015 for £50M
• The company would allow MJ to quickly scale into the global digital marketplace
• For Atterley, a partnership with MJ and a Financial Buyer would be very attractive because the company is at an inflection point of its business lifecycle where it needs capital to scale and penetrate the online luxury goods market
• Mike Welch states his current acquisition cost per customer is less than £10, which is very attractive when the average product price is ~€700, a similar price point to MJ
• Additional synergies could be found in the combined entity through existing supply chain networks and distribution centers
Marketplace Business Model
Atterley
Boutique
Boutique
CustomerOrder
Product
Product
[ 20 ]

[ 21 ]
Deliverable II: Deep DiscountsDeep Discounts: Overview
• Discounted offerings drive sales in the short-term to counteract periods of weak consumer demand
• Worthwhile discounts have the potential to attract new customers and expose different product offerings to current customer base
• Deep discounting expedites sales of outdated inventory that may remain from previous seasons
• Price promotions provide a competitive advantage in a challenging retail space
Pros
Deep Discounts
21.6%
18.9%
12.0% 11.6%12.5%
13.6%
2013 2014 2015 2016 2017 2018
• Luxury brands across the industry have been implementing price promotions through retail distributors in order to better manage their distribution and inventory count
• Struggling department stores in the luxury segment have relied on deep discounts to entice shoppers
• On the flip side, many luxury brands have been reducing wholesale sales and cutting down on participation in promotional markdowns to avoid damage to their brands’ exclusive reputation
• In the case of MJ, excessive discounts would further depress their already struggling margins
MJ EBITDA Margin
• Frequent discounting from a luxury brand signifies a loss in the ability to demand and defend higher prices
• An expanded customer base to individuals with less disposable income has the potential to strip away the luxury status of a brand due to increased accessibility of product offerings
• Continued discounting has a negative impact on margins
Cons

Situational Overview North American Handbag Market Share
Adjustment Results
• Coach’s rapid expansion in the early 2000s created a handbag boom before losing market share in 2010
• The company aggressively discounted items to compensate, resulting in lower gross margins and operating profits—hitting a 10-year low in 2014
• As a result of excessive discounting, customers were unwilling to pay full price for Coach items in expectation of sales
• Brand perception became an issue as Coach began to lose its title as a high-end fashion brand
Strategic Turnaround
Deliverable II: Deep DiscountsDeep Discounts: Case Study - Coach
[ 22 ]
• Closed 20% of existing North American retail outlets that offered steep price discounts
• Undertook initiatives to transform into a higher end luxury retailer including bringing in top brand designers and avoiding discount outlets and margin crushing promotions
• Completed acquisition of Kate Spade with the focus on delivering high quality exclusive products and forming new partnerships to strengthen brand
15%
25%
14%
5%
10%
25%
7%
11% 12%
2007 2010 2015
Coach Michael Kors Louis Vuitton
• Reduction of deep discounts resulted in lifting the company’s gross profit margin on its merchandise by 2.1%
• Coach’s North American same store sales rose by 2% after announcing their plan to pull away from excessive department store discounts
• In Q1 of 2017, 55% of Coach’s handbags sold for $400 or more, up from 30% in 2015
Source: Fortune

Deliverable II: Deep DiscountsDeep Discounts: Final Recommendation
Final Recommendation No Deep Discounts
Rationale
[ 23 ]
Erosion of Brand Value
• MJ’s product line of high-quality heels commands a premium price that is intrinsically tied to the value of its brand
Diluted Customer Base
• Expanding product accessibility diminishes the sense of exclusivity and high social status associated with the MJ brand
Price Setting Power
• Resisting the urge to offer deep discounts gives MJ the control a luxury brand needs to accurately set purchase price based off the true value of a product
Margin Decline
• MJ’s low EBITDA margins would continue to suffer if products are sold at a lower price point

Scenario Analysis & Recommendation
Deliverable III

Scenario Analysis & RecommendationScenario Recommendation
[ 25 ]
General Assumptions
• Scenario II add on acquisition is conditional to merger and both merger and acquisition will become effective on December 31 st, 2018
• Unless otherwise stated by prompt, synergies, cost-savings, and store closings become effective December 31st, 2018, are fully reflected in fiscal year 2019, and are not compounding
• Valuation occurs on December 31st, 2018 and conversion rate from Euros to USD for all financials is as of valuation date
Scenario I Highlights
• Strategic buyer interested primarily in the brand, seeking to realize synergies while employing a similar pricing and distribution strategy
• Emphasis on bottom line growth rather than top line growth, focusing on increasing the efficiency of the business model
• Revenue by segment distribution remains approximately the same with a 1.1% increase in Online as a % of sales by 2022
• Discounted cash flow analysis yields a higher valuation, maximizing value to debt holders with 100% recovery of capital
Scenario II Highlights
• Financial buyer interested in operating MJ on a stand-alone basis, targeting new sales channels
• Emphasis on top line growth with limited margin expansion; gross margins remain flat, but management realizes improvement in SG&A through increase of scale
• Seeks to expand online sales through the acquisition of an online retailer (33% increase in Online as a % of sales) and other segment sales through the creation of a lower price line of shoes
• Discounted cash flow analysis yields 80 - 90% recovery of debt holder capital
Recommendation
• We recommend Valuation Scenario I to management and debtholders with an estimated enterprise value of $400 to $450 MM
• We believe a strategic buyer maximizes value by realizing cost-saving synergies and improving both SG&A and gross margins, increasing EBIT margin to 29.2% by 2022 (vs. Scenario II’s EBIT margin of 16.5%), while Scenario II focuses on increasing revenue at the cost of diluting the brand value and depressing margins below their full potential

Scenario Analysis & RecommendationTrading Comparables
[ 26 ]
6.8x
9.6x 9.9x
11.1x 11.5x
14.3x
16.3x
18.4x
Hugo Boss Louis Vuitton Kering Prada SalvatoreFerragamo
Tod's BrunelloCucinelli
Hermes
Median: 11.3x
Mean: 12.2x
2019 EV/EBITDA
Maison Jacquelyn Trading Comparables Analysis ($ Millions)
Market Total Enterprise Net Debt / Gross % %
Company Cap Value FY18 EBITDA Margin Equity Debt 2018 2019 2020 2018P 2019 2020
Louis Vuitton 149,089 158,374 0.5x 66.6% 92.3% 7.7% 11.2x 9.6x 8.8x 20.1x 17.7x 15.9x
Salvatore Ferragamo 3,421 3,259 -0.8x 64.0% 98.7% 1.3% 12.8x 11.5x 10.6x 33.3x 33.1x 29.0x
Brunello Cucinelli 2,346 2,376 0.2x -- 96.2% 3.8% 21.6x 16.3x 15.0x 44.4x 38.6x 36.9x
Hugo Boss 4,273 4,270 0.0x 65.2% 95.5% 4.5% 7.4x 6.8x 6.5x 14.5x 16.3x 14.7x
Tod's 1,569 1,654 0.6x -- 83.7% 16.3% 11.9x 14.3x 12.7x 28.3x 333.2x --
Hermes 58,765 56,115 -0.9x 70.0% 97.8% 2.2% 19.2x 18.4x 16.8x 36.1x 33.6x 30.2x
Kering 59,679 62,392 0.5x 74.6% 92.1% 7.9% 12.2x 9.9x 9.1x 18.8x 17.4x 14.6x
Prada 8,168 8,545 0.6x 72.0% 88.7% 11.3% 13.5x 11.1x 10.1x 33.7x 27.8x 29.7x
Median $6,220 $6,407 0.4x 68.3% 93.9% 6.1% 12.5x 11.3x 10.4x 30.8x 30.5x 29.0x
Mean $35,914 $37,123 0.1x 68.7% 93.1% 6.9% 13.7x 12.2x 11.2x 28.6x 64.7x 24.4x
Enterprise Value / EBITDA Price / Earnings
See Slide 52 for further analysis

Date Announced Acquirer Target EV / LTM EBITDA Transaction Value
($ millions)Target LTM EBITDA
($ millions)
May 2017 9.4x 2,400 255
January 2015 11.2x 574 51
March 2016 13.6x 1,800 132
April 2017 15.6x 7,268 466
July 2017 16.4x 1,350 82
September 2018 46.0x 2,120 46
Incl. Versace
Excl. Versace
Mean 18.7x 13.2x
Median 14.6x 13.6x
9.4x 11.2x
13.6x 15.6x
16.4x
46.0x
Scenario Analysis & RecommendationPrecedent Transactions
[ 27 ]

[ 28 ]
Scenario Analysis & RecommendationStrategic Buyer Recommendations
• French luxury conglomerate headquartered in Paris
• Controls around 60 subsidiaries that manage some of the world’s most prestigious brands
• Offers intrinsic value via reputation as the upper echelon of the luxury goods market with extensive industry expertise
• A global luxury group headquartered in Paris, France dedicated to the development of 15 renowned brands
• Holds risk-taking and sincerity at the core of their business model which would allow MJ to explore new lucrative markets while staying true to their luxurious brand image
Financial Highlights
USD in millions Kering LVMHLTM Revenue $15,690 $53,766
Enterprise Value $62,392 $158,374
Net Debt $2,534 $7,374
EBITDA Margin 30.91% 25.96%
Net Debt / FY18 EBITDA 0.5x 0.5x
• Both companies exhibit significantly higher EBITDA margins than MJ signaling room for efficiency improvements upon acquisition
• Both companies presently hold minimal debt with the ability to take on leverage to make an opportunistic acquisition

Scenario Analysis & RecommendationScenario I Analysis
[ 29 ]
Revenue Assumptions
Cost Assumptions
• Domestic Stores: Assumed base growth rates remain in line with management’s projections. Reduced revenue by loss of $3.25MM from store closings along with the compounding revenue growth that would have occurred on same store sales
• International Stores: Growth rates in line with management
• Department Stores: Assumed MJ achieved annual revenue synergies of $10MM by 2022 with 50% being achieved in 2019 by quickly introducing initiatives to drive sales and the rest gradually being realized through 2022. Base growth rates in line with management
• Online: Growth rates in line with management
• Cost of Goods Sold: Gross margins expected to increase to comp set average of 68%
• Sales and Marketing: Management’s expectations for SG&A margin declines are used as a base, then the SG&A margin reductions from store closings ($4MM annually) and synergies ($5MM annually) are then subtracted to yield predicted SG&A margin
• One Time Store Closings Expenses: Created single line item on income statement to account for cost of closing stores, assuming store closings occur at the beginning of 2019
• Depreciation: Remain in line with management’s projections
Maison Jacquelyn Income Statement ($ Thousands)
Fiscal Year 2017A 2018A 2019P 2020P 2021P 2022P
Fiscal Year End Date 12/31/17 12/31/18 12/31/19 12/31/20 12/31/21 12/31/22
Revenue Channels
Domestic Stores 116,330$ 118,051$ 118,246$ 123,073$ 128,126$ 134,660$
International Stores 13,140 11,530 11,761$ 11,996$ 12,356$ 12,851$
Department Stores 57,435 58,699 65,166$ 68,670$ 72,828$ 76,063$
Online 6,367 6,997 7,836$ 8,777$ 9,830$ 11,010$
Total Revenue 193,272$ 195,278$ 203,009$ 212,516$ 223,140$ 234,583$
% Growth -1.3% 1.0% 4.0% 4.7% 5.0% 5.1%
Cost of Goods Sold 82,004 82,263 75,113 74,381 73,636 75,067
Gross Margin 111,267$ 113,015$ 127,896$ 138,136$ 149,503$ 159,517$
Sales & Marketing 87,081 86,405 79,857 81,018 82,676 85,153
One Time Store Closings Expenses -- -- 1,500 -- -- --
EBITDA 24,187$ 26,610$ 46,539$ 57,118$ 66,827$ 74,364$
Adjustment -- -- -- -- -- --
Adjusted EBITDA 24,187$ 26,610$ 46,539$ 57,118$ 66,827$ 74,364$
Depreciation 4,954 4,998 5,165 5,373 5,613 5,856
EBIT 19,232$ 21,611$ 41,373$ 51,745$ 61,214$ 68,508$
% Margin 10.0% 11.1% 20.4% 24.3% 27.4% 29.2%

Maison Jacquelyn Discounted Cash Flow Model
Free Cash Flow Buildup
Fiscal Year 2019P 2020P 2021P 2022P
Fiscal Year End Date 12/31/19 12/31/20 12/31/21 12/31/22
EBITDA 46,539 57,118 66,827 74,364
EBIT 41,373 51,745 61,214 68,508
Tax Rate 31.0% 28.0% 26.5% 25.0%
EBIAT (NOPAT) 28,548$ 37,256$ 44,992$ 51,381$
+Depreciation & Amortization 5,165 5,373 5,613 5,856
+Net Changes in Working Capital (644)$ (1,331)$ (1,487)$ (1,602)$
Unlevered CFO 33,069$ 41,298$ 49,118$ 55,635$
- Capital Expenditures 4,872 5,100 5,132 5,395
Unlevered FCF 28,197$ 36,198$ 43,986$ 50,239$
% growth
Discount factor 100% 200% 300% 400%
Present value of Unlevered FCF 26,504 30,061 32,273 32,568
Scenario Analysis & RecommendationScenario I Analysis
[ 30 ]
DCF Assumptions
• Tax Rate: In 2019, the standard French CIT rate for all companies will be 28% on taxable income up to €500,000, and 31% on taxable income exceeding that amount –see Appendix slide 51
• Net Changes in Working Capital:Assumed MJ’s NWC to stay a consistent percentage of revenue based off FY2018, which was 14% –see Appendix Slide 49
• Capital Expenditures: Capex is expected to continue to stay at current levels as a % of revenue through 2022
• After-Tax Benefit from Sale of Distribution Center: Assumed the facility has been depreciated down to zero such that its book value is zero; if book value is zero, and the Company sells it for $12.5MM; they then must pay taxes on it at the 2019 corporate tax rate. Thus, the after-tax value of the center was added to the EV post valuation
See Slide 26, 31, 47, 49, 50, and 51 for details on calculation
Fair Value
Perpetuity EBITDA
Enterprise value - before Sale of Distribution Center 427,493 438,588
After Tax Benefit from Sale of Distrubution Center 8,625 8,625
Enterprise value - post Sale of Distribution Center 436,118 447,213
Less: Net debt (381,914) (381,914)
Equity value 54,203 65,298

$402
$266
$319
$470
$346
$399
Scenario Analysis & RecommendationScenario I Valuation Summary
[ 31 ]
Valuation Methodology Commentary
Precedent Transactions 1
Trading Comparables 2
Discounted Cash Flow Analysis 3
2018 EBITDA: 26,610Multiple: 12.0x – 15.0x
2018 EBITDA: 26,610Multiple: 10.0x – 13.0x
WACC: 13.2%Exit EBITDA Multiple: 6.0x – 8.0x
• Analysis consisted of 5 transactions with dates ranging from 2015 to 2018
• Median EBITDA multiple of 13.6x and mean EBITDA multiple of 13.2x 4
• The selected valuation range of $400 – 450 MM implies an EV / FY2018 EBITDA multiple of 15.0x – 17.0x, slightly above this range
Final Valuation $400 - $450 MM
• Analysis consisted of 8 publicly traded peers
• Median EBITDA multiple of 11.3x and mean EBITDA multiple of 12.2x
• Assumed an Exit EBITDA Multiple between 6.0x and 8.0x – a discount to trading comps due to small size, private company status, limited geographic reach, and a less stable track record of earnings
1 Slide 27 2 Slide 26 3 Slide 30 4 Excludes Versace transaction

Scenario Analysis & RecommendationScenario II Analysis
[ 32 ]
Revenue Assumptions
• Domestic Stores: Assumed base growth rates remain in line with management’s projections. Reduced revenue by loss of $3.25MM from store closings along with the compounding revenue growth that would have occurred on same store sales
• International Stores: Growth rates in line with management
• Department Stores: Growth rates in line with management
• Online: Grew revenue to reach approximately $120MM by 2022, reflecting the rapid online growth MJ would experience from an online retailer acquisition
Cost Assumptions
• Cost of Goods Sold: Straight-lined gross margin in line with 2018
• Sales and Marketing: Economies of Scale Impacted SG&A margin is used as a base (reflected improvements in SG&A margin beyond management’s projections with step down of 100bps annually, reaching 400bps decrease by 2022), then the SG&A margin reductions from store closings ($4MM annually) is subtracted out to yield Scenario II Impacted SG&A Margin
• One Time Store Closings Expenses: Created single line item on income statement to account for cost of closing stores, assuming store closings occur at the beginning of 2019
• Depreciation: Remain in line with management’s projections
Maison Jacquelyn Income Statement ($ Thousands)
Fiscal Year 2017A 2018A 2019P 2020P 2021P 2022P
Fiscal Year End Date 12/31/17 12/31/18 12/31/19 12/31/20 12/31/21 12/31/22
Revenue Channels
Domestic Stores 116,330$ 118,051$ 118,246$ 123,073$ 128,126$ 134,660$
International Stores 13,140 11,530 11,761$ 11,996$ 12,356$ 12,851$
Department Stores 57,435 58,699 60,166$ 61,670$ 63,828$ 66,063$
Online 6,367 6,997 13,994$ 29,388$ 64,653$ 119,932$
Total Revenue 193,272$ 195,278$ 204,167$ 226,127$ 268,963$ 333,505$
% Growth -1.3% 1.0% 4.6% 10.8% 18.9% 24.0%
Cost of Goods Sold 82,004 82,263 85,750 94,973 112,965 140,072
Gross Margin 111,267$ 113,015$ 118,417$ 131,154$ 155,999$ 193,433$
Sales & Marketing 87,081 86,405 84,200 91,426 106,813 130,069
One Time Store Closings Expenses -- -- 1,500 -- -- --
EBITDA 24,187$ 26,610$ 32,717$ 39,728$ 49,186$ 63,364$
Adjustment -- -- -- -- -- --
Adjusted EBITDA 24,187$ 26,610$ 32,717$ 39,728$ 49,186$ 63,364$
Depreciation 4,954 4,998 5,195 5,717 6,766 8,325
EBIT 19,232$ 21,611$ 27,522$ 34,011$ 42,420$ 55,039$
% Margin 10.0% 11.1% 13.5% 15.0% 15.8% 16.5%

Maison Jacquelyn Discounted Cash Flow Model
Free Cash Flow Buildup
Fiscal Year 2019P 2020P 2021P 2022P
Fiscal Year End Date 12/31/19 12/31/20 12/31/21 12/31/22
EBITDA 32,717 39,728 49,186 63,364
EBIT 27,522 34,011 42,420 55,039
Tax Rate 31.0% 28.0% 26.5% 25.0%
EBIAT (NOPAT) 18,990$ 24,488$ 31,178$ 41,279$
+Depreciation & Amortization 5,195 5,717 6,766 8,325
+Net Changes in Working Capital (806) (813) (2,879) (4,410)
Unlevered CFO 23,379$ 29,392$ 35,066$ 45,194$
- Capital Expenditures 4,900 5,427 6,186 7,671
Unlevered FCF 18,479$ 23,965$ 28,879$ 37,524$
% growth
Discount factor 100% 200% 300% 400%
Present value of Unlevered FCF 17,369 19,902 21,189 24,325
Scenario Analysis & RecommendationScenario II Analysis
[ 33 ]
DCF Assumptions
• Tax Rate: In 2019, the standard French CIT rate for all companies will be 28% on taxable income up to €500,000, and 31% on taxable income exceeding that amount –see Appendix slide 51
• Net Changes in Working Capital:An increase in MJ’s revenue (particularly Domestic, Department, and International Sales) would grow current assets. However, because the majority of growth stems from the Online segment, which would likely be a marketplace business model where the company maintains no extra inventory for other brands’ shoes, we assumed a gradual stepdown in NWC as a % of revenue to account for the fact that majority of growth comes from online (stepping down from 14% margin in 2019 to 11% in 2022) – see Appendix slide 49
• Capital Expenditures: Capex is expected to continue to stay at current levels as a % of revenue through 2022
See Slide 29, 31, 47, 49, 50, and 51 for details on calculation
Fair Value
Perpetuity EBITDA
Enterprise value 311,401 353,050
Less: Net debt (381,914) (381,914)
Equity value (70,514) (28,865)

$314
$266
$319
$372
$346
$399
Scenario Analysis & RecommendationScenario II Valuation Summary
[ 34 ]
Valuation Methodology Commentary
Precedent Transactions 1
Trading Comparables 2
Discounted Cash Flow Analysis 3
2018 EBITDA: 26,610Multiple: 12.0x – 15.0x
2018 EBITDA: 26,610Multiple: 10.0x – 13.0x
WACC: 13.2%Exit EBITDA Multiple: 6.0x – 8.0x
• Analysis consisted of 5 transactions with dates ranging from 2015 to 2018
• Median EBITDA multiple of 13.6x and mean EBITDA multiple of 13.2x 4
• The selected valuation range of $315 – 380 MM implies an EV / FY2018 EBITDA multiple of 11.8x – 14.3x, which is within this multiples range
• Analysis consisted of 8 publicly traded peers
• Median EBITDA multiple of 11.3x and mean EBITDA multiple of 12.2x
• Assumed an Exit EBITDA Multiple between 6.0x and 8.0x– a discount to trading comps because of its small size, private company status, limited geographic reach, and a less stable track record of earnings
• Heavier weight placed on DCF valuation given due to higher scrutiny and conservative pricing of a financial buyerFinal Valuation
$315 - $380 MM1 Slide 27 2 Slide 26 3 Slide 33 4 Excludes Versace transaction
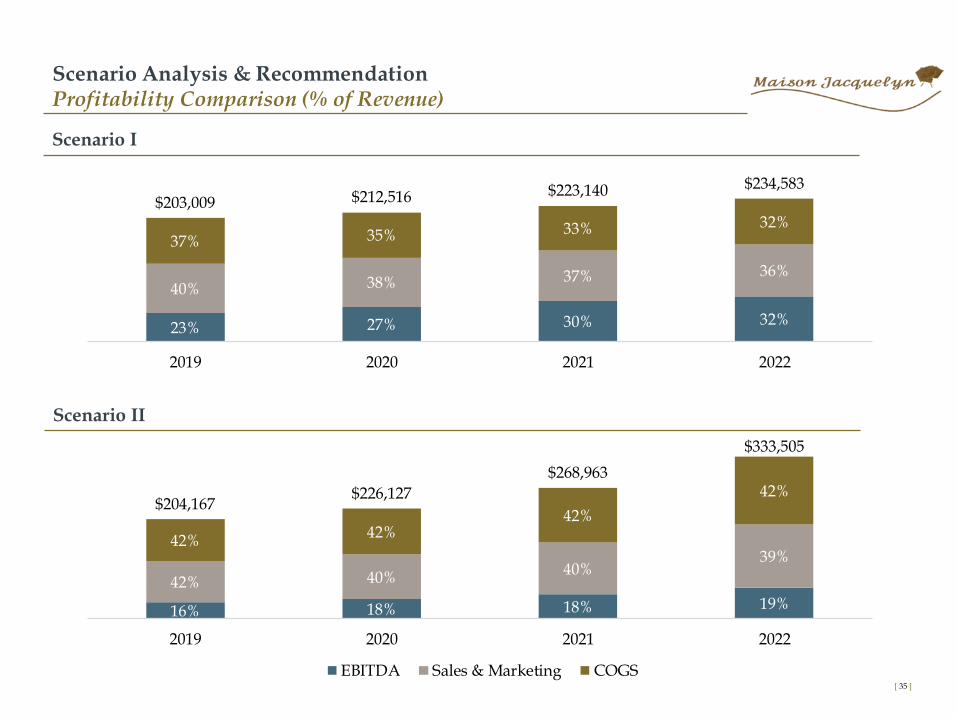
Scenario Analysis & RecommendationProfitability Comparison (% of Revenue)
[ 35 ]
Scenario I
23% 27% 30% 32%
40% 38% 37% 36%
37% 35% 33% 32%$203,009 $212,516 $223,140 $234,583
2019 2020 2021 2022
Scenario II
16% 18% 18% 19%
42% 40%40%
39%42%
42%42%
42%$204,167
$226,127
$268,963
$333,505
2019 2020 2021 2022
EBITDA Sales & Marketing COGS

• Beta: Average Bloomberg Adjusted Two-Year Beta between equity and Bloomberg European 500 – all equities pulled from European Composite and financials converted as of December 31st, 2018 Euro to USD conversion rate
• Capital Weights: Assumed 95% equity financing due to the distressed, over-leveraged nature of the business. Additionally, comparable companies held minimal to no debt as of 12/31/2018 and small cap companies held even less debt, which we felt further justified this assumption. Note that French interest rates dropped to zero in 2018 and many of the companies took on leverage after FY2018
• Cost of Debt: Estimated using firm’s assumed bond rating 1
• Risk Free Rate: Normalized to 3.00% per Duff and Phelps
• Equity Risk Premium: As of November 2019 per Damodaran research
• Size Premium: Per 10th decile Duff and Phelps size premium 2
Scenario Analysis & RecommendationWACC & Capital Structure Assumptions
1 See Appendix Slide 48 2 See Appendix Slide 51 [ 36 ]
WACC Assumptions
WACC Analysis for Maison Jacquelyn
Debt / Debt / Adj. 2 Year Unlevered Beta Effective
Tickers Company Equity Total Cap. Beta 2-Year Tax Rate
LVMUYEUR EU Louis Vuitton 8.4% 7.7% 1.342 1.264 26.3%
SFER EU Salvatore Ferragamo 1.3% 1.3% 0.803 0.796 32.2%
BC1 EU Brunello Cucinelli 3.9% 3.8% 0.933 0.905 21.7%
BOSS EU Hugo Boss 4.7% 4.5% 0.836 0.809 29.8%
TOD EU Tod's 19.5% 16.3% 0.809 0.711 29.3%
RMS EU Hermes 2.3% 2.2% 0.857 0.844 32.5%
KER1 EU Kering 8.6% 7.9% 1.321 1.241 24.7%
1913EUR EU Prada 12.7% 11.3% 1.159 1.066 31.2%
Mean 7.7% 6.9% 1.01 0.95 28.5%
Median 6.6% 6.1% 0.90 0.87 29.6%
*in Millions, Analysis Date as of 12/31/2018
WACC Calculations
Capital Weights
% Debt 5.0%
% Equity 95.0%
Cost of Debt
Pre-Tax Cost of Debt 6.00%
Assumed Tax Rate 31.0%
After-Tax Cost of Debt 4.14%
Cost of Equity
Risk Free Rate 3.00%
Unlevered Beta 0.95
Debt / Equity 5.3%
Relevered Beta 0.989
Equity Risk Premium 5.44%
Size Premium 5.28%
Cost of Equity 13.66%
WACC 13.2%

Scenario Analysis & RecommendationFinancial Buyer vs. Strategic Buyer
[ 37 ]
Strategic Buyer (Scenario I) Financial Buyer (Scenario II)
• A financial buyer seeks robust free cash flow, leading market position, growth opportunities, and efficiency opportunities in a potential acquisition target
• However, in acquisition Scenario II, MJ fails to realize significant improvements in operating margins in comparison to a strategic buyer
• Additionally, MJ lacks a dominant position in the luxury shoe market when compared to their public comparables
• Finally, the brick and mortar business model is capital intensive and does not leave room for the additional leverage that an LBO requires; as a result, the 2013 LBO of MJ was unsuccessful, and the debt holders are attempting to exit
• A strategic buyer’s goal is to identify companies whose products or services can synergistically integrate with their existing business model to create incremental, long-term shareholder value through vertical or horizontal integration
• In the case of Scenario I, a strategic buyer could sell off MJ’s distribution center and realize significant savings in SG&A through back office reductions
• Additionally, a strategic buyer’s existing relationships with distributors (department stores and online retailers) as well as potential international presence would allow revenue growth and increases in scale, driving top and bottom line growth
Revenue vs. Cost Synergies
• A revenue synergy is when, as a result of an acquisition, the combined company is able to generate more sales than the two companies would be able to separately
• On each additional dollar of revenue synergies, the Company has to pay additional expenses and taxes
• A cost synergy refers to the opportunity, as a result of an acquisition, for the combined company to reduce costs more than the two companies would be able to do individually
• Cost synergies have a direct impact on free cash flow, making them more valuable than revenue synergies
2022 Scenario I & II Profitability ($ Thousands)
$68,508 $55,039
$234,583
$333,505
Scenario I Scenario II
EBIT Total Revenue
29.2%Margin
16.5%Margin

Scenario Analysis & RecommendationNext Steps Analysis
• A typical LBO capital structure is highly levered
• Because of this high debt/equity ratio, the bonds issued in the buyout are not investment grade and have comparatively higher interest rates
• Proper Scenario II analysis would require establishing an LBO capital structure by looking at previous financials acquisitions in the retail space and determining interest rates
Establish Capital Structure & Cost of Debt
• Financial buyers have higher hurdle rates, so the cost of capital in Scenario I and II would likely be different
• The hurdle rate of Scenario II depends on the private equity buyer and their assessed risk of MJ
• A financial buyer could likely purchase MJ at a low EBITDA multiple due to its previous distress
Determine Hurdle Rates • With the determined capital structure, cost of debt, and required rate of return, an LBO valuation and waterfall analysis could be performed
• The LBO valuation of MJ would likely be lower than the one we calculated through DCF analysis, primarily due to the differences in cost of debt and capital structure
Perform LBO Valuation for Financial Buyer
LBO Valuation
[ 38 ]

✓ Precedent transaction multiples are time sensitive and reflect market sentiment of the time period of the transaction
✓ Trading comps provide a useful way to assess market assumptions of fundamental characteristics baked into valuations
x M&A deals can be unique in specific processes with many factors influencing valuation
x Trading comps are heavily influenced by market dynamics and other non-fundamental factors
Scenario Analysis & RecommendationAppropriateness of Extrinsic vs. Intrinsic Valuation
[ 39 ]
• M&A activity within the luxury goods industry is active and provides up to date insight on market valuation
• Limited amounts of comparable transactions and publicly traded companies that fall within the size range of MJ means focusing on timeframe and similarities in product offerings when selecting precedent transactions
• Public markets have an established understanding of luxury goods companies and their valuation nuances, and trading comps establish the market’s price point for MJ in comparison to peers
• Given comprehensive guidance from management, intrinsic valuation might lead to a more appropriate valuation methodology but is heavily dependent on the accuracy of management’s guidance
• MJ’s business post bankruptcy is very moldable to management’s decision making, therefore intrinsic valuation in combination with management guidance reflects more accurate insight
• Due to the cyclical nature of the luxury fashion industry, the DCF’s ability to perform a sensitivity analysis is advantageous
Pros & Cons
Pros & Cons
✓ A DCF provides a thorough approach to valuation by accounting for profitability, growth, capital structure, and discount rate
✓ Reliance on free cash flow as opposed to accounting figures provides a better measure of intrinsic value
x Valuation range is highly sensitive to forecasts and assumptions set by management which can be hard to predict
x The terminal value represents a large portion of total value at times
Extrinsic (Precedent and Trading Comp Analysis)
Intrinsic (DCF Analysis)

Scenario Analysis & RecommendationConclusion
[ 40 ]
• MJ should be valued at $400MM to $450MM based on a discounted cash flow, trading comps, and precedent transaction methodology
MJ Valuation
• Sale to a strategic buyer yields a higher valuation due to greater operational efficiency than can be achieved by a financial buyer
• Furthermore, a strategic buyer would maintain lower leverage, therefore, achieving the purpose of the restructuring
Sale to a Strategic Buyer
• MJ should not develop a lower price point line due to brand dilution and margin compression
Pricing Strategy

Appendix

• Since footwear manufacturing, especially high-end products, is very labor intensive, the shoe industry relies heavily on international trade and outsourcing
• Many high-end fashion brands have invested heavily and chosen to establish their specialized manufacturing processes in China
• There are limited economical outsourcing opportunities for high-end shoe manufacturing outside of China
• The US-China trade war poses a definite risk to the high-end shoe industry and its supply chain
Industry OverviewSWOT Analysis: Trade War
U.S. Shoe Imports by Country 1
1 Data from USITC 2 Data from Morgan Stanley Research estimates [ 42 ]
China54%
Vietnam24%
Other10%
Indonesia7%
Italy5%
(0.09%)(0.21%)
(0.32%)
(0.81%)
Status Quo Escalation SignificantEscalation
FullEscalation
Estimated Trade War Impact on Global GDP 2
Effects of trade war on MJ’s manufacturing processes has the potential to significantly impact gross margins in the event of political tension escalation.
International Supply Chain
Domestic Supply Chain
Initial Tariff Impact
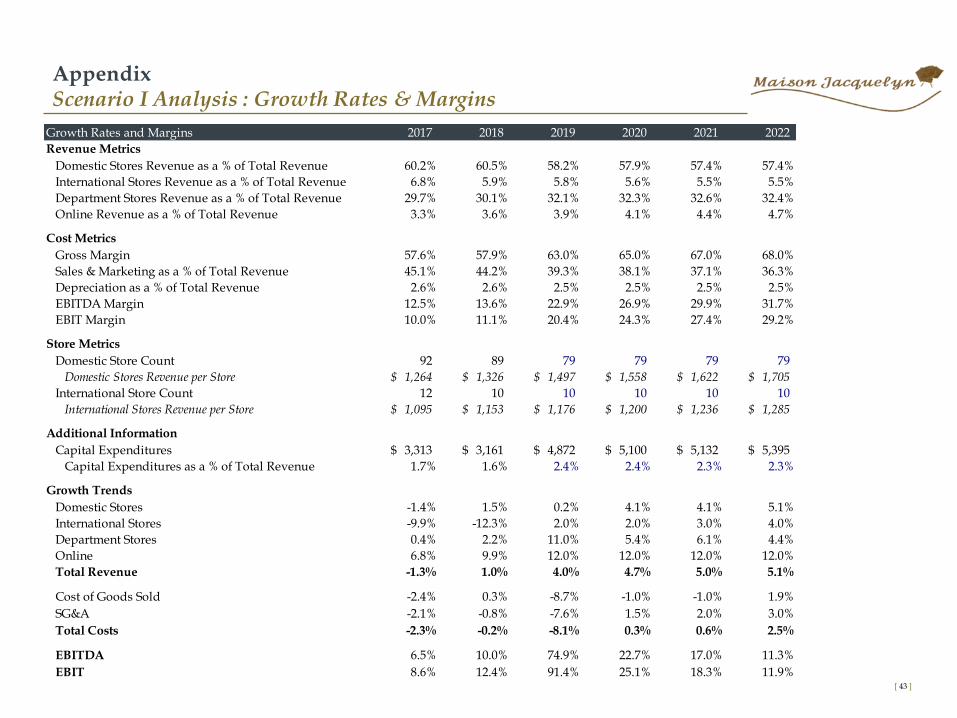
AppendixScenario I Analysis : Growth Rates & Margins
[ 43 ]
Growth Rates and Margins 2017 2018 2019 2020 2021 2022
Revenue Metrics
Domestic Stores Revenue as a % of Total Revenue 60.2% 60.5% 58.2% 57.9% 57.4% 57.4%
International Stores Revenue as a % of Total Revenue 6.8% 5.9% 5.8% 5.6% 5.5% 5.5%
Department Stores Revenue as a % of Total Revenue 29.7% 30.1% 32.1% 32.3% 32.6% 32.4%
Online Revenue as a % of Total Revenue 3.3% 3.6% 3.9% 4.1% 4.4% 4.7%
Cost Metrics
Gross Margin 57.6% 57.9% 63.0% 65.0% 67.0% 68.0%
Sales & Marketing as a % of Total Revenue 45.1% 44.2% 39.3% 38.1% 37.1% 36.3%
Depreciation as a % of Total Revenue 2.6% 2.6% 2.5% 2.5% 2.5% 2.5%
EBITDA Margin 12.5% 13.6% 22.9% 26.9% 29.9% 31.7%
EBIT Margin 10.0% 11.1% 20.4% 24.3% 27.4% 29.2%
Store Metrics
Domestic Store Count 92 89 79 79 79 79
Domestic Stores Revenue per Store 1,264$ 1,326$ 1,497$ 1,558$ 1,622$ 1,705$
International Store Count 12 10 10 10 10 10
International Stores Revenue per Store 1,095$ 1,153$ 1,176$ 1,200$ 1,236$ 1,285$
Additional Information
Capital Expenditures 3,313$ 3,161$ 4,872$ 5,100$ 5,132$ 5,395$
Capital Expenditures as a % of Total Revenue 1.7% 1.6% 2.4% 2.4% 2.3% 2.3%
Growth Trends
Domestic Stores -1.4% 1.5% 0.2% 4.1% 4.1% 5.1%
International Stores -9.9% -12.3% 2.0% 2.0% 3.0% 4.0%
Department Stores 0.4% 2.2% 11.0% 5.4% 6.1% 4.4%
Online 6.8% 9.9% 12.0% 12.0% 12.0% 12.0%
Total Revenue -1.3% 1.0% 4.0% 4.7% 5.0% 5.1%
Cost of Goods Sold -2.4% 0.3% -8.7% -1.0% -1.0% 1.9%
SG&A -2.1% -0.8% -7.6% 1.5% 2.0% 3.0%
Total Costs -2.3% -0.2% -8.1% 0.3% 0.6% 2.5%
EBITDA 6.5% 10.0% 74.9% 22.7% 17.0% 11.3%
EBIT 8.6% 12.4% 91.4% 25.1% 18.3% 11.9%

AppendixScenario I Analysis : Revenue & Cost Builds
[ 44 ]
Scenario Assumptions
Fiscal Year 2017A 2018A 2019P 2020P 2021P 2022P
Fiscal Year End Date 12/31/17 12/31/18 12/31/19 12/31/20 12/31/21 12/31/22
Domestic Revenue
Domestic Stores Management Planned Revenue 116,330 118,051 121,593 126,457 131,515 138,091
Store Closing Impact (3,250) (3,250) (3,250) (3,250)
Cumulative Loss of Growth of Compounding from Store Closures (98) (231) (371) (552)
Annual Loss of Compounding Growth from Store Closures (98) (134) (139) (181)
Domestic Store Revenue Growth Rates - In Line with Management 3.0% 4.0% 4.0% 5.0%
Assumed Post Store Closing Domestic Revenue 118,246 123,073 128,126 134,660
Implied Scenario I Domestic Growth Rate 0.2% 4.1% 4.1% 5.1%
International Revenue
International Revenue - In Line with Management Projections 13,140 11,530 11,761 11,996 12,356 12,851
Implied Scenario I International Growth Rate 2.0% 2.0% 3.0% 4.0%
Department Revenue
Department Stores Management Projected Revenue 57,435 58,699 60,166 61,670 63,828 66,063
Total Department Synergies Realized 5,000 7,000 9,000 10,000
Department Revenue Synergies Annualized Annually 5,000 2,000 2,000 1,000
Department Stores Revenue Growth Rates - In Line with Management 2.5% 2.5% 3.5% 3.5%
Synergy Impacted Department Stores Revenue 65,166 68,670 72,828 76,063
Implied Scenario I Department Growth Rate 11.0% 5.4% 6.1% 4.4%
Online Revenue
Online Management Planned Revenue 6,367 6,997 7,836 8,777 9,830 11,010
Implied Scenario I Online Revenue Growth Rate 12.0% 12.0% 12.0% 12.0%
Cost of Goods Sold
Scenario I Gross Margin - In Line with Industry by 2022 57.6% 57.9% 63.0% 65.0% 67.0% 68.0%
Sales & Marketing
Scenario I Projected Revenue 193,272 195,278 203,009 212,516 223,140 234,583
Management Predicted SG&A Margins 45.1% 44.2% 43.8% 42.4% 41.1% 40.1%
Annual Store Closing Savings -- -- 4,000 4,000 4,000 4,000
Store Savings as a % of Revenue -- -- 2.0% 1.9% 1.8% 1.7%
Backoffice Synergies -- -- 5,000 5,000 5,000 5,000
Backoffice Synergies as a % of Revenue 2.5% 2.4% 2.2% 2.1%
Scenario II Impacted SG&A Margin 39.3% 38.1% 37.1% 36.3%
Depreciation
Depreciation as a % of Revenue - In Line with Management Plan 2.5% 2.5% 2.5% 2.5%

AppendixScenario II Analysis : Growth Rates & Margins
[ 45 ]
Growth Rates and Margins 2017 2018 2019 2020 2021 2022
Revenue Metrics
Domestic Stores Revenue as a % of Total Revenue 60.2% 60.5% 57.9% 54.4% 47.6% 40.4%
International Stores Revenue as a % of Total Revenue 6.8% 5.9% 5.8% 5.3% 4.6% 3.9%
Department Stores Revenue as a % of Total Revenue 29.7% 30.1% 29.5% 27.3% 23.7% 19.8%
Online Revenue as a % of Total Revenue 3.3% 3.6% 6.9% 13.0% 24.0% 36.0%
Cost Metrics
Gross Margin 57.6% 57.9% 58.0% 58.0% 58.0% 58.0%
Sales & Marketing as a % of Total Revenue 45.1% 44.2% 41.2% 40.4% 39.7% 39.0%
Depreciation as a % of Total Revenue 2.6% 2.6% 2.5% 2.5% 2.5% 2.5%
EBITDA Margin 12.5% 13.6% 16.0% 17.6% 18.3% 19.0%
EBIT Margin 10.0% 11.1% 13.5% 15.0% 15.8% 16.5%
Store Metrics
Domestic Store Count 92 89 79 79 79 79
Domestic Stores Revenue per Store 1,264$ 1,326$ 1,497$ 1,558$ 1,622$ 1,705$
International Store Count 12 10 10 10 10 10
International Stores Revenue per Store 1,095$ 1,153$ 1,176$ 1,200$ 1,236$ 1,285$
Additional Information
Capital Expenditures 3,313$ 3,161$ 4,900$ 5,427$ 6,186$ 7,671$
Capital Expenditures as a % of Total Revenue 1.7% 1.6% 2.4% 2.4% 2.3% 2.3%
Growth Trends
Domestic Stores -1.4% 1.5% 0.2% 4.1% 4.1% 5.1%
International Stores -9.9% -12.3% 2.0% 2.0% 3.0% 4.0%
Department Stores 0.4% 2.2% 2.5% 2.5% 3.5% 3.5%
Online 6.8% 9.9% 100.0% 110.0% 120.0% 85.5%
Total Revenue -1.3% 1.0% 4.6% 10.8% 18.9% 24.0%
Cost of Goods Sold -2.4% 0.3% 4.2% 10.8% 18.9% 24.0%
SG&A -2.1% -0.8% -2.6% 8.6% 16.8% 21.8%
Total Costs -2.3% -0.2% 0.8% 9.7% 17.9% 22.9%
EBITDA 6.5% 10.0% 23.0% 21.4% 23.8% 28.8%
EBIT 8.6% 12.4% 27.3% 23.6% 24.7% 29.7%

AppendixScenario II Analysis : Revenue & Cost Builds
[ 46 ]
Scenario Assumptions
Fiscal Year 2017A 2018A 2019P 2020P 2021P 2022P
Fiscal Year End Date 12/31/17 12/31/18 12/31/19 12/31/20 12/31/21 12/31/22
Domestic Revenue
Domestic Stores Management Planned Revenue 116,330 118,051 121,593 126,457 131,515 138,091
Store Closing Impact (3,250) (3,250) (3,250) (3,250)
Cumulative Loss of Growth of Compounding from Store Closures (98) (231) (371) (552)
Annual Loss of Compounding Growth from Store Closures (98) (134) (139) (181)
Domestic Store Revenue Growth Rates - In Line with Management 3.0% 4.0% 4.0% 5.0%
Assumed Post Store Closing Domestic Revenue 118,246 123,073 128,126 134,660
Implied Scenario II Domestic Revenue Growth Rate 0.2% 4.1% 4.1% 5.1%
International Revenue
International Revenue - In Line with Management Projections 13,140 11,530 11,761 11,996 12,356 12,851
Implied Scenario II International Growth Rate 2.0% 2.0% 3.0% 4.0%
Department Revenue
Department Revenue - In Line with Management Projections 57,435 58,699 60,166 61,670 63,828 66,063
Implied Scenario II Department Growth Rate 2.5% 2.5% 3.5% 3.5%
Online Revenue
Online Management Planned Revenue 6,367 6,997 7,836 8,777 9,830 11,010
Scenario II Impacted Revenue 13,994 29,388 64,653 119,932
Implied Growth Rate 100.0% 110.0% 120.0% 85.5%
Cost of Goods Sold
Scenario II Gross Margin - In Line with 2018 57.6% 57.9% 58.0% 58.0% 58.0% 58.0%
Sales & Marketing
Scenario II Projected Revenue 193,272 195,278 204,167 226,127 268,963 333,505
Economies of Scale Impacted SG&A Margin 45.1% 44.2% 43.2% 42.2% 41.2% 40.2%
Annual Store Closing Savings -- -- 4,000 4,000 4,000 4,000
Store Savings as a % of Revenue -- -- 2.0% 1.8% 1.5% 1.2%
Scenario II Impacted SG&A Margin 41.2% 40.4% 39.7% 39.0%
Depreciation
Depreciation as a % of Revenue - In Line with Management Plan 2.5% 2.5% 2.5% 2.5%

AppendixSensitivity Analysis
[ 47 ]
Scenario I Analysis Scenario II Analysis
Note: Highlighted numbers are those that do not provide full return to debt holders
Enterprise Value
Long term growth rate (g):
$436,118 1.3% 1.8% 2.3% 2.8% 3.3%
15.2% 349,178 358,671 368,900 379,955 391,940
14.2% 376,116 387,415 399,664 412,990 427,539
WACC: 13.2% 407,623 421,244 436,118 452,423 470,378
12.2% 444,960 461,631 479,989 500,303 522,903
11.2% 489,898 510,672 533,784 559,652 588,801
Enterprise Value
Exit EBITDA Multiple
$447,213 6.0x 6.5x 7.0x 7.5x 8.0x
13.8% 394,883 417,065 439,247 461,429 483,611
13.7% 396,041 418,301 440,561 462,821 485,081
WACC: 13.2% 401,901 424,557 447,213 469,869 492,525
12.7% 407,885 430,946 454,007 477,067 500,128
12.2% 413,997 437,472 460,946 484,421 507,895
Enterprise Value
Exit EBITDA Multiple
EBITDA % of plan $447,213 6.0x 6.5x 7.0x 7.5x
70% 52,055 320,340 336,199 352,058 367,917
85% 63,209 361,120 380,378 399,635 418,893
100% 74,364 401,901 424,557 447,213 469,869
115% 85,518 442,682 468,736 494,790 520,844
130% 96,673 483,462 512,915 542,367 571,820
Enterprise Value
Long term growth rate (g):
$311,401 1.3% 1.8% 2.3% 2.8% 3.3%
15.2% 246,678 253,768 261,408 269,665 278,617
14.2% 266,693 275,132 284,281 294,234 305,101
WACC: 13.2% 290,118 300,292 311,401 323,579 336,990
12.2% 317,894 330,346 344,057 359,230 376,110
11.2% 351,345 366,861 384,123 403,444 425,216
Enterprise Value
Exit EBITDA Multiple
$353,050 6.0x 6.5x 7.0x 7.5x 8.0x
13.8% 308,665 327,566 346,467 365,367 384,268
13.7% 309,618 328,585 347,552 366,520 385,487
WACC: 13.2% 314,440 333,745 353,050 372,354 391,659
12.7% 319,366 339,016 358,665 378,315 397,964
12.2% 324,398 344,400 364,402 384,405 404,407
Enterprise Value
Exit EBITDA Multiple
EBITDA % of plan $353,050 6.0x 6.5x 7.0x 7.5x
70% 44,355 244,944 258,457 271,970 285,484
85% 53,859 279,692 296,101 312,510 328,919
100% 63,364 314,440 333,745 353,050 372,354
115% 72,869 349,189 371,389 393,589 415,790

• Several assumptions must be made since historical interest expense information is not given
• We estimate that Maison Jacquelyn would be able to raise debt at a cost similar to Ba1/BB+ rated companies
• BB+ is one of the lower credit ratings given to a prospective borrower by a ratings agency, is generally not of investment grade, and suggests a company or government faces significant uncertainties and may be exposed to adverse economic conditions 3
• The Company’s distressed history would indicate a higher cost of debt; however, because their capital structure, based on their peers, is primarily equity, cost of debt has little impact on their WACC
AppendixCost of Debt Analysis
[ 48 ]
Interest Coverage Ratio
Credit Rating Spread 2
0.00 – 0.49 D2/D 19.38%
0.50 – 0.79 C2/C 14.54%
0.80 -1.24 Ca2/CC 11.08%
1.25 – 1.49 Caa/CCC 9.00%
1.50 – 1.99 B3/B- 6.60%
2.00 – 2.49 B2/B 5.40%
2.50 – 2.99 B1/B+ 4.50%
3.00 – 3.49 Ba2/BB 3.60%
3.50 – 3.99 Ba1/BB+ 3.00%
4.00 – 4.49 Baa2/BBB 2.00%
4.50 – 5.99 A3/A- 1.56%
6.00 – 7.49 A2/A 1.38%
7.50 – 9.49 A1/A+ 1.25%
9.50 – 12.49 Aa2/AA 1.00%
≥12.5 Aaa/AAA 0.75%
1 NYU Stern Business School 2 Spread over normalized risk-free rate of 3% 3 Capital.com
Default Risk Spread 1 Synthetic Rating Estimation
WACC Sensitivity Analysis
After-Tax Cost of Debt
13.2% 3.1% 3.6% 4.1% 4.6% 5.1%
15.7% 15.0% 15.1% 15.1% 15.1% 15.1%
14.7% 14.1% 14.1% 14.1% 14.2% 14.2%
13.7% 13.1% 13.2% 13.2% 13.2% 13.2%
12.7% 12.2% 12.2% 12.2% 12.3% 12.3%
11.7% 11.2% 11.3% 11.3% 11.3% 11.3%
Cost of Equity

AppendixNWC Assumptions
[ 49 ]
Scenario II NWC Assumptions
NWC Assumptions
Fiscal Year 2018A 2019P 2020P 2021P 2022P
Fiscal Year End Date 12/31/18 12/31/19 12/31/20 12/31/21 12/31/22
NWC 27,777 28,583 29,397 32,276 36,686
NWC as a % of Revenue 14.2% 14.0% 13.0% 12.0% 11.0%
YOY Change 806 813 2,879 4,410
Scenario I NWC Assumptions
NWC Assumptions
Fiscal Year 2018A 2019P 2020P 2021P 2022P
Fiscal Year End Date 12/31/18 12/31/19 12/31/20 12/31/21 12/31/22
NWC 27,777 28,421 29,752 31,240 32,842
NWC as a % of Revenue 14.2% 14.0% 14.0% 14.0% 14.0%
YOY Change 644 1,331 1,487 1,602
General Assumptions
• NWC for 2018 was calculated by subtracting current liabilities (excluding Current Portion of Debt) from current assets (excluding Cash & Cash Equivalents)
• Current assets includes Accounts Receivable, Inventories, and Other Current Assets
• Current liabilities includes Accounts Payable, Accrued Expenses, and Other Current Liabilities
• 2018 NWC as a % of Sales was 14.2% and was used as a base assumption for MJ’s working capital needs
• NWC for Scenario I was assumed to remain in line with 2018 as the segment breakdown of sales remains consistent
• We assumed NWC would remain ~14% of total revenue
• We assumed a gradual stepdown in NWC as a % of revenue to account for the fact that majority of growth comes from online (stepping down from 14% margin in 2019 to 11% in 2022) , which will require less current assets / inventory

Perpetuity Approach
FCF in Last Forecast Period 37,524
FCFt+1 38,387
Long term growth rate (g) 2.3%
Terminal value 375,195
Present value of terminal value 228,615
Present value of stage 1 cash flows 82,785
Enterprise value 311,401
Implied TV exit EBITDA multiple 5.921x
Perpetuity Approach
FCF in Last Forecast Period 50,239
FCFt+1 51,395
Long term growth rate (g) 2.3%
Terminal value 502,338
Present value of terminal value 306,087
Present value of stage 1 cash flows 121,406
Enterprise value 427,493
Implied TV exit EBITDA multiple 6.755x
AppendixImplied Multiples & Growth Rates
[ 50 ]
Scenario I Assumptions
Scenario II Assumptions
• Growth Rate: Management assumes the company will grow in perpetuity at the rate of inflation. Pulled IMF’s projection for inflation in Western Europe to estimate what MJ’s long-term growth would be
• Implied TV exit EBITDA multiple: The DCF with a growth rate of 2.3% gave an implied exit EBITDA multiple of 6.8x, which is justified given MJ’s private status, small cap nature, limited geographic reach, and inconsistent profit history
• This enterprise value yields an implied EV/ LTM EBITDA of 16.0x, EV/ FY+1 EBITDA of 9.2x, and EV/ FY+2 EBITDA of 7.5x, which is in line with precedent transactions
• Growth Rate: Management assumes the company will grow in perpetuity at the rate of inflation. Pulled IMF’s projection for inflation in Western Europe to estimate what MJ’s long-term growth would be
• Implied TV exit EBITDA multiple: The DCF with a growth rate of 2.3% gave an implied exit EBITDA multiple of 5.9x, which is justified given MJ’s private status, small cap nature, limited geographic reach, inconsistent profit history, and lower profitability vs. Scenario I
• This enterprise value yields an implied EV/LTM EBITDA of 11.7x, EV/ FY+1 EBITDA of 11.3x, and EV/ FY+2 EBITDA of 7.8x

AppendixTax Rate & Size Premium Assumptions
[ 51 ]
Duff & Phelps Size Premiums
Market Value Size
Decile of Equity Premium
1 $1,073,391 -0.30%
2 $29,023 0.52%
3 $13,456 0.81%
4 $7,254 0.85%
5 $4,504 1.28%
6 $2,992 1.50%
7 $1,960 1.58%
8 $1,292 1.80%
9 $728 2.46%
10 $322 5.22%
French Corporate Tax Rate – KPMG
FY Profit
Opened From Range
€0 - €500,000 28.0%
January 1st, 2019 Revenue < €250 million 31.0%
Revenue > €250 million 31.3%
All Revenue < €250 million 28.0%
January 1st, 2020 €0 - €500,000 28.0%
Over €500,000 31.0%
Revenue < €250 million 26.5%
Revenue > €250 million 27.5%
Junary 1st, 2022 All 25.0%
Revenue > €250 million
AllJanuary 1st, 2021
Corporate Income
Tax Rate
Over €500,000WACC Tax Rate
Selected Size Premium

AppendixTrading Comparables
[ 52 ]Financial Information as of 12/31/2018
Company HQ EV ($m)Revenue ($m)
% EBITDA MarginSelect Brands Commentary
Paris, France $158,374 $53,766
26%
Louis Vuitton, Fendi, Bulgari,
Loro Piana, Marc Jacobs
Multinational luxury goods conglomerate with some of the largest brands in the luxury shoe market
Paris, France $62,392 $15,690
31%
Gucci, Bottega Veneta, Saint
Laurent, Balenciaga
Owns several of the most prolific brands in the luxury shoe market
Paris, France $56,115 $6,850 43%
Hermes, John LobbEstablished global brand and major player in the luxury goods industry
Milan, Italy $8,545 $3,608 17%
Prada, Miu Miu, Church’s, Car Shoe
Wide product offering within the luxury goods market, but with a heightened focus on shoes
Metzingen, Germany
$4,270 $3,210 17%
BOSS, HUGOConcentrated geographic market with Europe representing 62% of sales
Florence, Italy $3,259 $1,546 16%
Salvatore Ferragamo
Extensive brand integration with celebrities and influencers
Corciano, Italy $2,376 $63517%
Brunello CucinelliBrand image of deeply rooted moral values and craftsmanship
Marche, Italy $1,654 $1,080 13%
Tod's, Hogan, Fay, Roger Vivier
Shoe sales represent majority of the business