2020 interim results presentation - globenewswire
TRANSCRIPT
2020 Interim Results
Presentation
2020 0perational and financial highlights
Page 2
2020 operational highlights
• Net production of 95,100 barrels of oil equivalent per day (boepd) across portfolio in 2020 (93,000 boepd in Q4),
notwithstanding reduced spending to preserve cash following the market turmoil triggered by the Covid-19 pandemic
• Gross operated production from Tawke license in the Kurdistan region of Iraq averaged 110,300 barrels of oil per day (bopd) (110,200 bopd in Q4) of which 77,700 bopd net to DNO’s interest (77,700 bopd in Q4)
• Non-operated North Sea assets contributed 17,400 boepd net in 2020 (15,300 boepd in Q4)
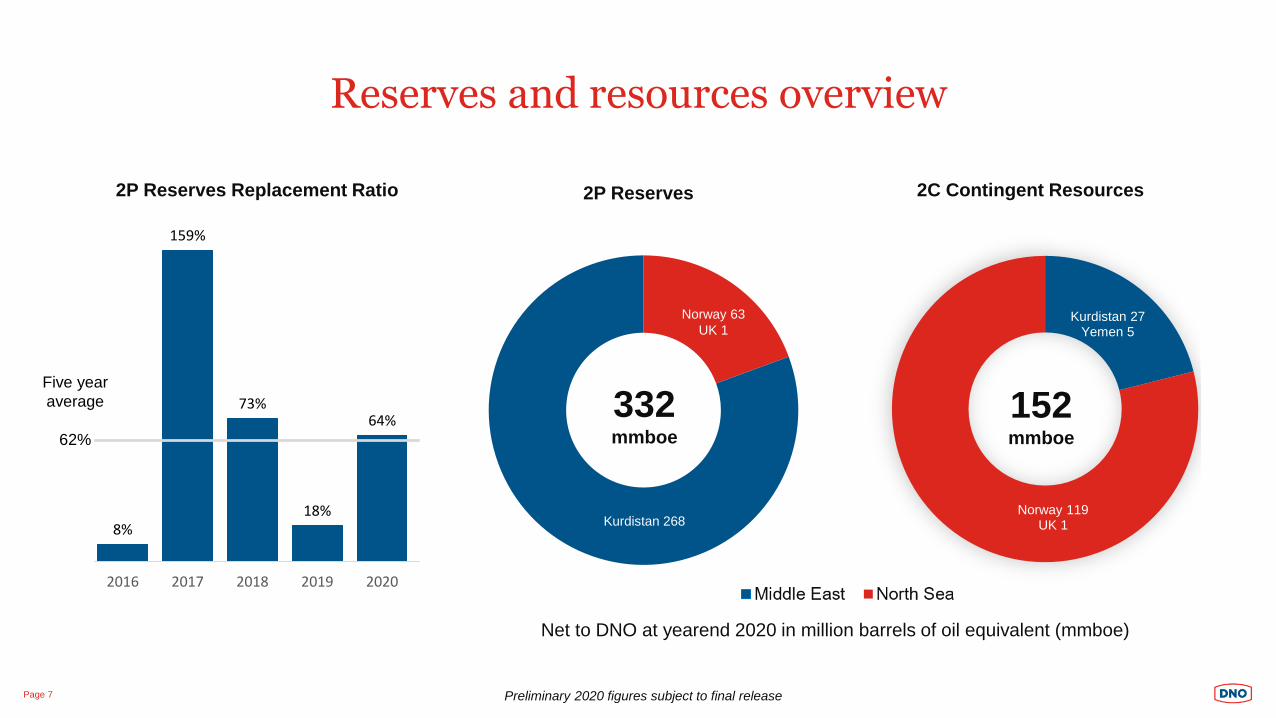
• Replaced 64 percent of the 35 million barrels of oil equivalent (mmboe) produced in 2020 and exited the year with net
2P reserves (proven plus probable) totaling 332 mmboe and 2C contingent resources (discovered but not yet
committed to development) totaling 152 mmboe
• Participated in spudding of 17 wells across portfolio in 2020 of which five in Kurdistan and balance in the North Sea
• Six of which were exploration wells resulting in three exciting discoveries, two in Norway (Bergknapp and Røver
Nord) and one in Kurdistan (Zartik)
Page 3
2020 financial highlights
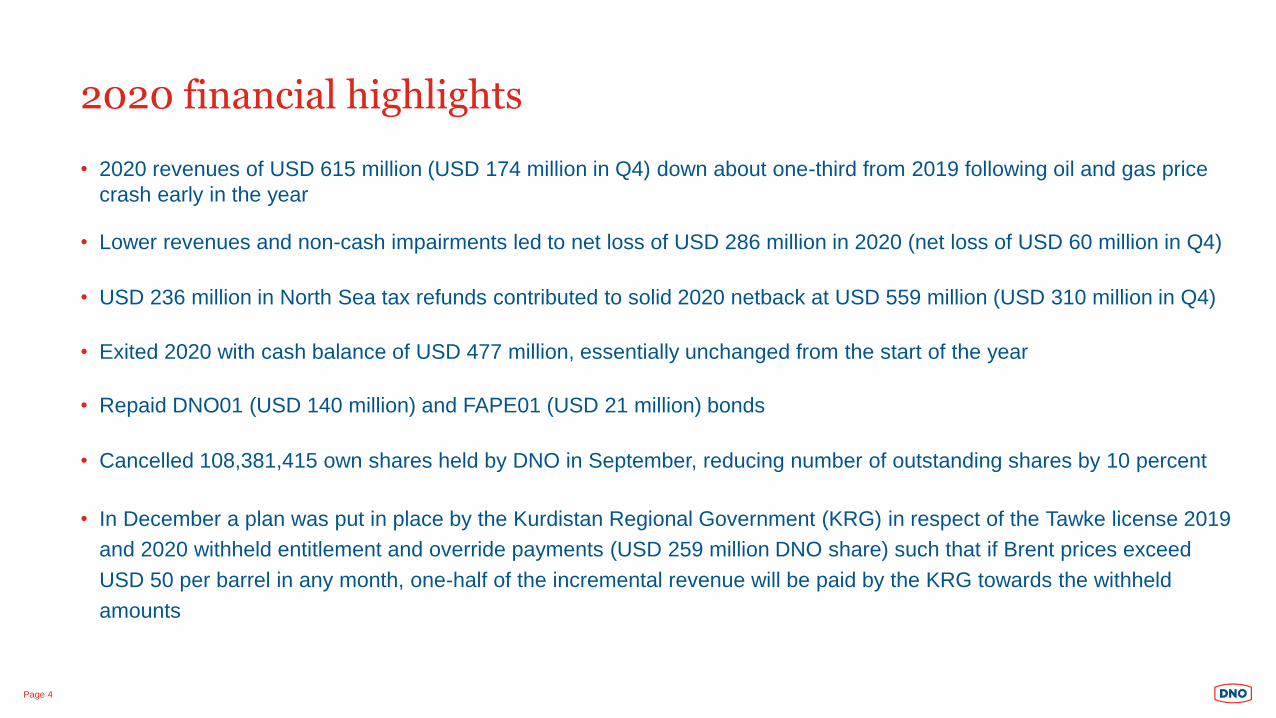
• 2020 revenues of USD 615 million (USD 174 million in Q4) down about one-third from 2019 following oil and gas price
crash early in the year
• Lower revenues and non-cash impairments led to net loss of USD 286 million in 2020 (net loss of USD 60 million in Q4)
• USD 236 million in North Sea tax refunds contributed to solid 2020 netback at USD 559 million (USD 310 million in Q4)
• Exited 2020 with cash balance of USD 477 million, essentially unchanged from the start of the year
• Repaid DNO01 (USD 140 million) and FAPE01 (USD 21 million) bonds
• Cancelled 108,381,415 own shares held by DNO in September, reducing number of outstanding shares by 10 percent
Page 4
• In December a plan was put in place by the Kurdistan Regional Government (KRG) in respect of the Tawke license 2019
and 2020 withheld entitlement and override payments (USD 259 million DNO share) such that if Brent prices exceed
USD 50 per barrel in any month, one-half of the incremental revenue will be paid by the KRG towards the withheld
amounts
2021 outlook
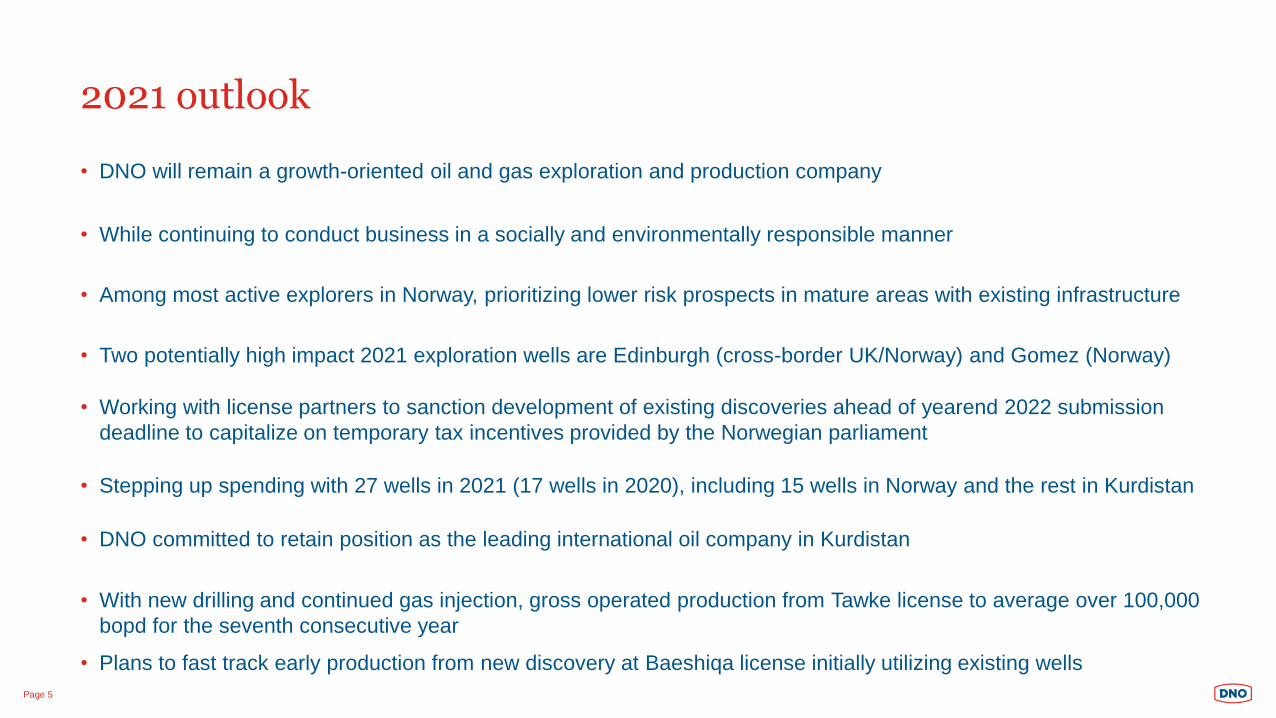
• DNO will remain a growth-oriented oil and gas exploration and production company
• While continuing to conduct business in a socially and environmentally responsible manner
• Among most active explorers in Norway, prioritizing lower risk prospects in mature areas with existing infrastructure
• Two potentially high impact 2021 exploration wells are Edinburgh (cross-border UK/Norway) and Gomez (Norway)
Page 5
• Working with license partners to sanction development of existing discoveries ahead of yearend 2022 submission
deadline to capitalize on temporary tax incentives provided by the Norwegian parliament
• Stepping up spending with 27 wells in 2021 (17 wells in 2020), including 15 wells in Norway and the rest in Kurdistan
• DNO committed to retain position as the leading international oil company in Kurdistan
• With new drilling and continued gas injection, gross operated production from Tawke license to average over 100,000
bopd for the seventh consecutive year
• Plans to fast track early production from new discovery at Baeshiqa license initially utilizing existing wells
Page 6
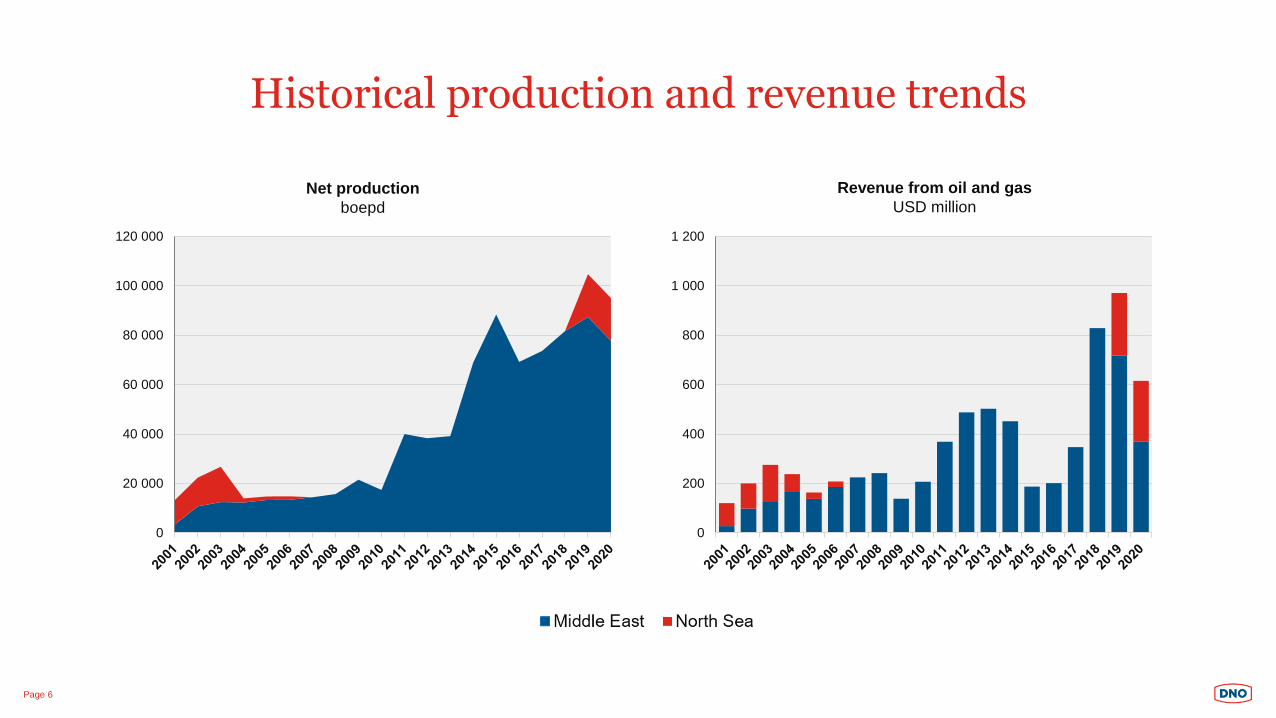
Net production
boepd
Historical production and revenue trends
0
20 000
40 000
60 000
80 000
100 000
120 000
0
200
400
600
800
1 000
1 200
Revenue from oil and gas
USD million
Page 7
2P Reserves Replacement Ratio
Reserves and resources overview
2C Contingent Resources 2P Reserves
332mmboe
152mmboe
8%
159%
73%
18%
64%
2016 2017 2018 2019 2020
Norway 63
UK 1
Kurdistan 268
Kurdistan 27
Yemen 5
Norway 119
UK 1
Net to DNO at yearend 2020 in million barrels of oil equivalent (mmboe)
Kurdistan 27 Yemen 5
Norway 119 UK 1
Five year
average
62%
Preliminary 2020 figures subject to final release
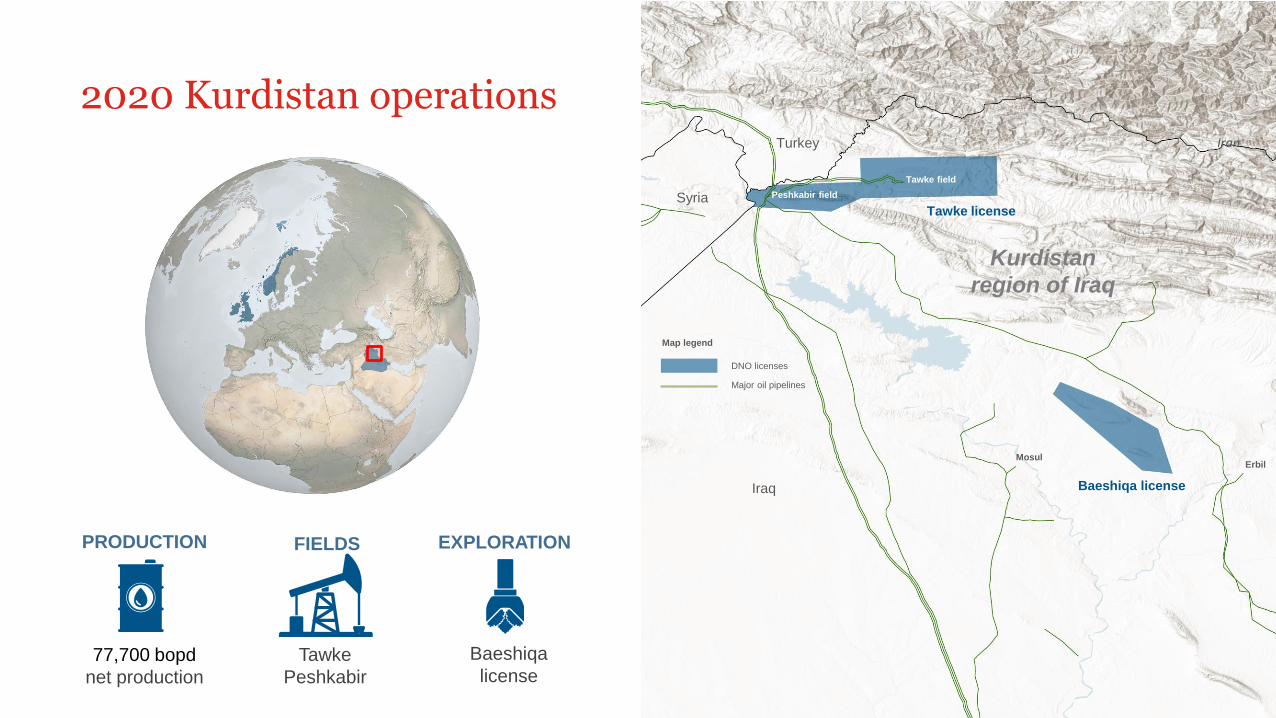
2020 Kurdistan operations
MosulErbil
Tawke license
Baeshiqa license
Turkey
Iraq
Iran
Kurdistan
region of Iraq
Syria Peshkabir field
Tawke field
Major oil pipelines
DNO licenses
Map legend
PRODUCTION FIELDS
Baeshiqa
license77,700 bopd
net production
Tawke
Peshkabir
EXPLORATION

Promising discovery in Baeshiqa license
Page 9
• Zartik-1 exploration well testing completed, confirming hydrocarbons to
surface from from several Jurassic zones, with one zone flowing naturally
at rates averaging over 2,000 bopd of medium gravity oil
• Recent lab tests of Baeshiqa-2 well (drilled in 2019) confirm light gravity
oil and sour gas to surface from all Triassic zones
• Two Baeshiqa-2 zones flowed naturally at rates averaging over 3,000 bopd
of light gravity oil each, with a third over 1,000 bopd of light gravity oil
• Working with partners to achieve fast-track development and early
production from existing wells, subject to government approvals
• DNO has already demonstrated proof of concept of producing through
temporary test facilities, having delivered 15,000 barrels of 40o API oil and
22o API oil for export from the Baeshiqa-2 and Zartik-1 wells, respectively
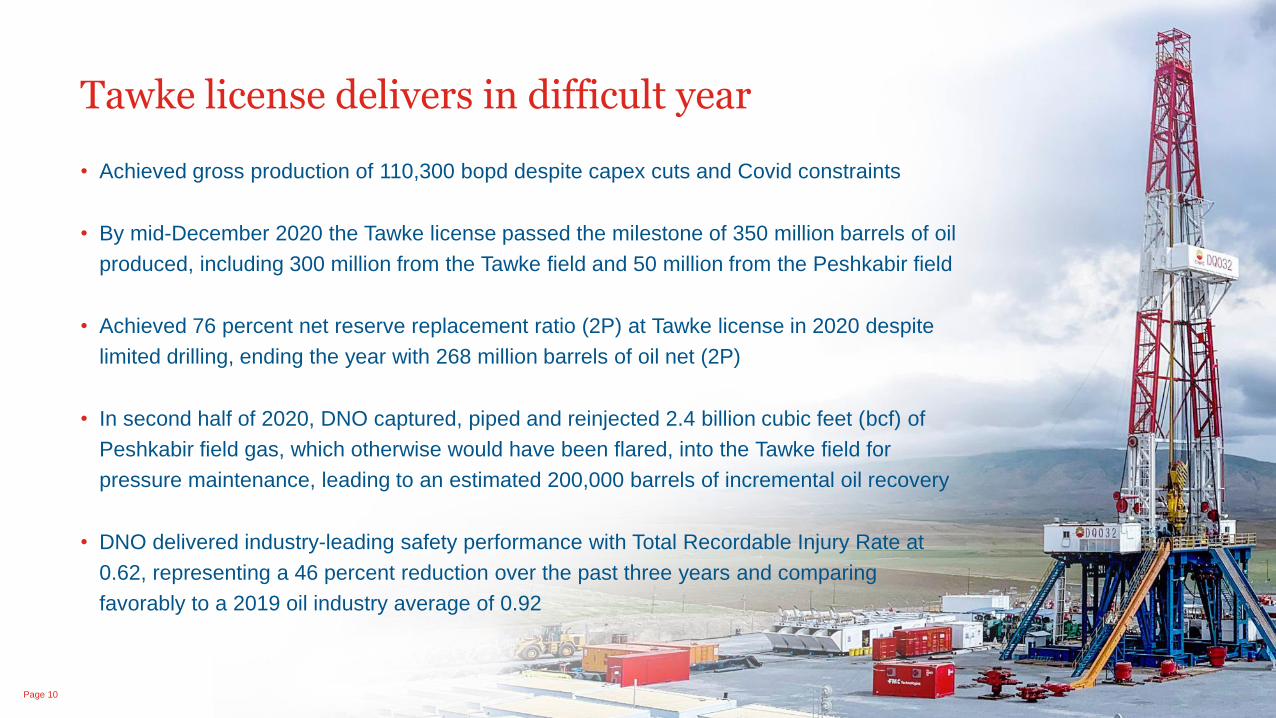
• Achieved gross production of 110,300 bopd despite capex cuts and Covid constraints
• By mid-December 2020 the Tawke license passed the milestone of 350 million barrels of oil
produced, including 300 million from the Tawke field and 50 million from the Peshkabir field
• Achieved 76 percent net reserve replacement ratio (2P) at Tawke license in 2020 despite
limited drilling, ending the year with 268 million barrels of oil net (2P)
• In second half of 2020, DNO captured, piped and reinjected 2.4 billion cubic feet (bcf) of
Peshkabir field gas, which otherwise would have been flared, into the Tawke field for
pressure maintenance, leading to an estimated 200,000 barrels of incremental oil recovery
• DNO delivered industry-leading safety performance with Total Recordable Injury Rate at
0.62, representing a 46 percent reduction over the past three years and comparing
favorably to a 2019 oil industry average of 0.92
Tawke license delivers in difficult year
Page 10
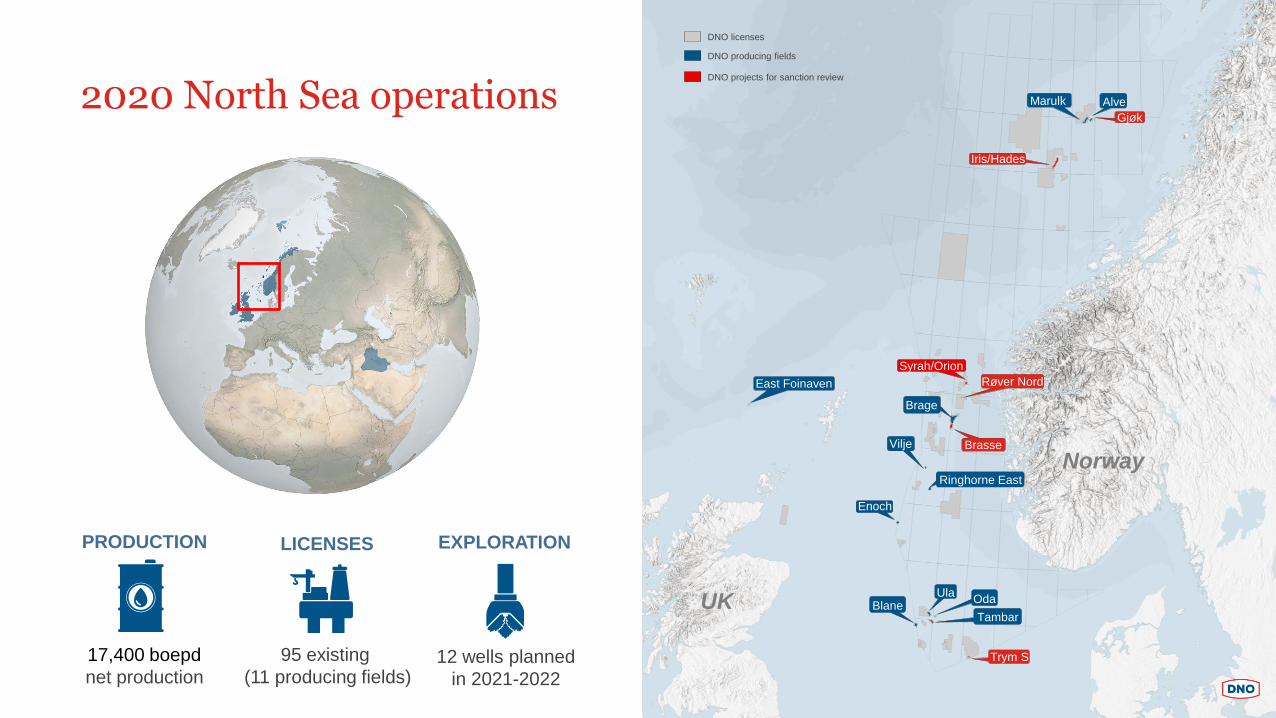
2020 North Sea operations
PRODUCTION LICENSES
12 wells planned
in 2021-2022
17,400 boepd
net production
95 existing
(11 producing fields)
EXPLORATION
DNO licenses
DNO producing fields
DNO projects for sanction review
AlveMarulk
Brage
Ringhorne East
Vilje
Enoch
East Foinaven
BlaneUla
Oda
Tambar
Røver Nord
Iris/Hades
Syrah/Orion
Brasse
Trym S
Gjøk
Norway
UK
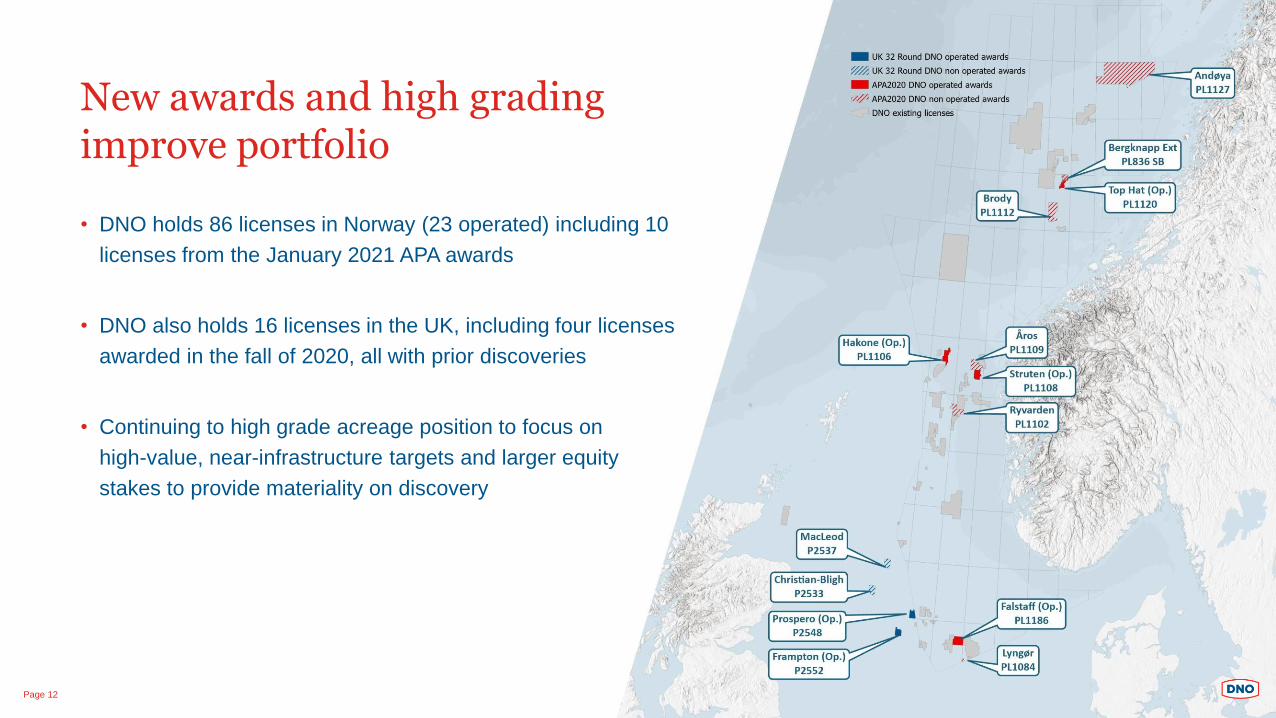
New awards and high grading improve portfolio
Page 12
• DNO holds 86 licenses in Norway (23 operated) including 10
licenses from the January 2021 APA awards
• DNO also holds 16 licenses in the UK, including four licenses
awarded in the fall of 2020, all with prior discoveries
• Continuing to high grade acreage position to focus on
high-value, near-infrastructure targets and larger equity
stakes to provide materiality on discovery
2
46
5
3
1
NORWEGIAN SEA
NORTHERN
NORTH SEA
SOUTHERN
NORTH SEA
78
10
9
11
12
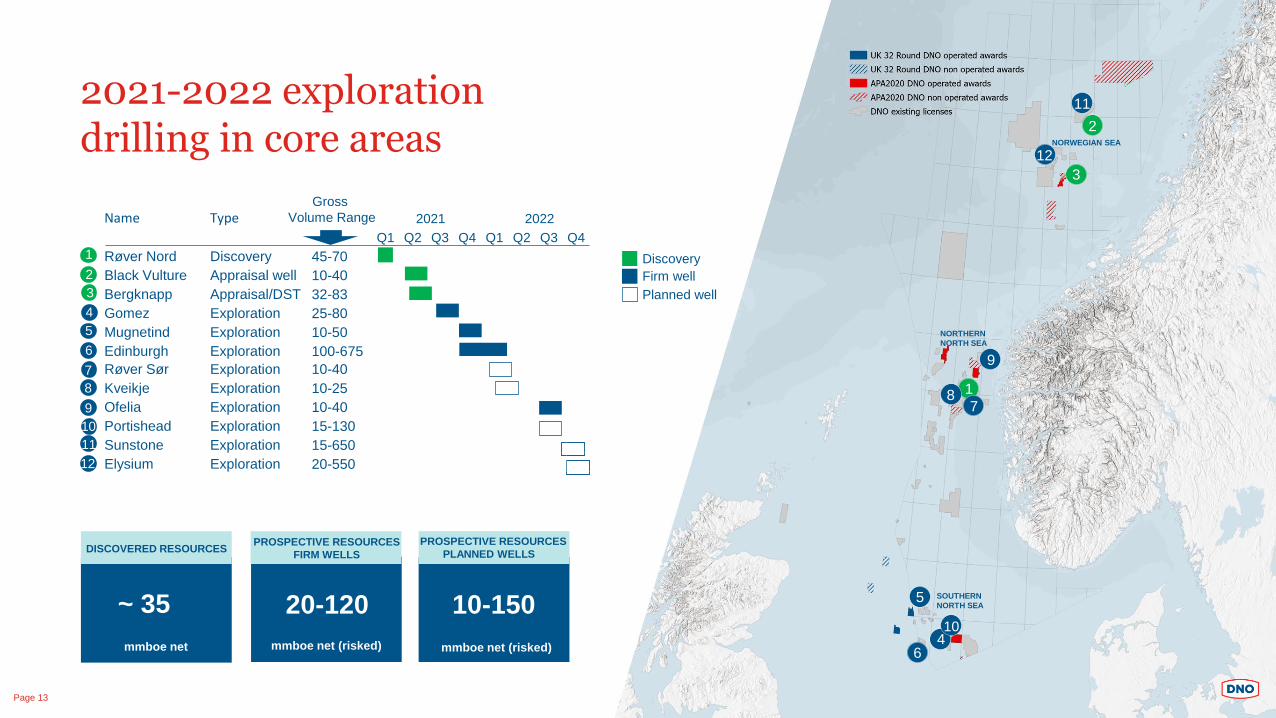
2021-2022 explorationdrilling in core areas
Page 13
10-150~ 35
DISCOVERED RESOURCES
20-120
PROSPECTIVE RESOURCES
FIRM WELLS
Name Type 2021 2022
Q1 Q2 Q3 Q4 Q1 Q2 Q3 Q4
Røver Nord Discovery 45-70
Black Vulture Appraisal well 10-40
Bergknapp Appraisal/DST 32-83
Gomez Exploration 25-80
Mugnetind Exploration 10-50
Edinburgh Exploration 100-675
Røver Sør Exploration 10-40
Kveikje Exploration 10-25
Ofelia Exploration 10-40
Portishead Exploration 15-130
Sunstone Exploration 15-650
Elysium Exploration 20-550
1
2
3
4
5
6
7
8
9
10
11
12
Discovery
Firm well
Planned well
mmboe net mmboe net (risked) mmboe net (risked)
PROSPECTIVE RESOURCES
PLANNED WELLS
Gross
Volume Range
Page 14
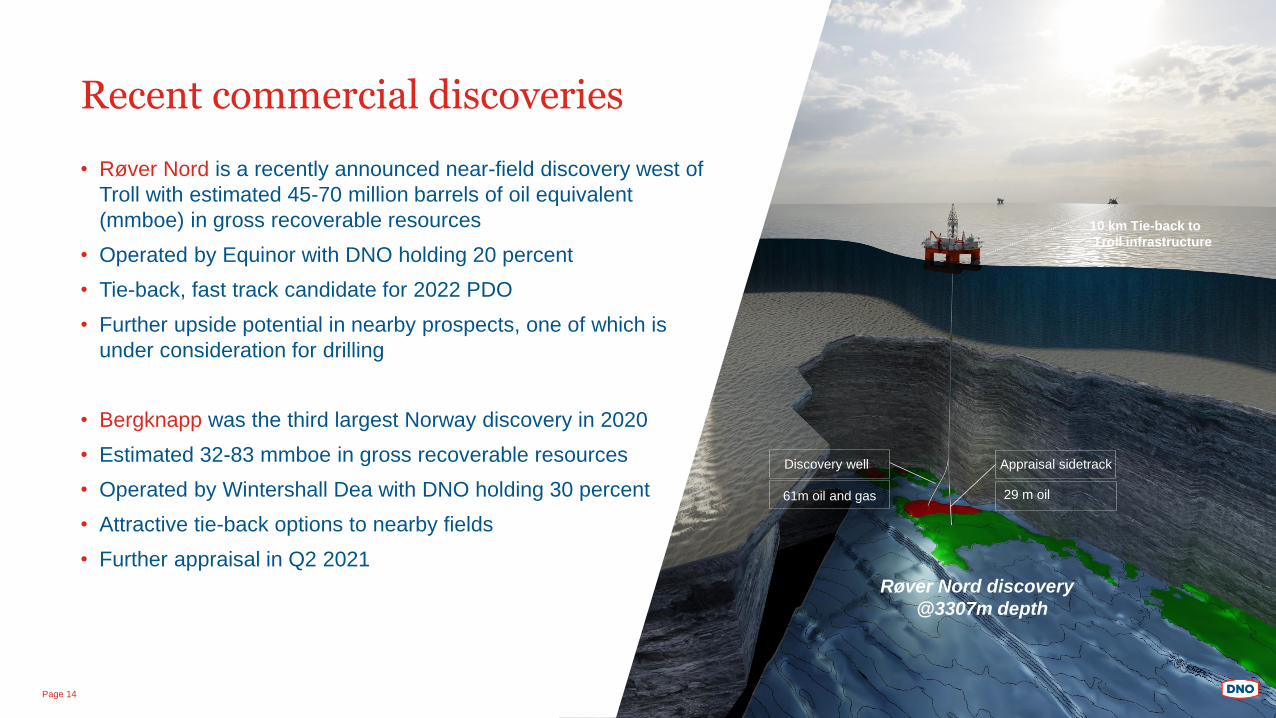
Recent commercial discoveries
• Røver Nord is a recently announced near-field discovery west of
Troll with estimated 45-70 million barrels of oil equivalent
(mmboe) in gross recoverable resources
• Operated by Equinor with DNO holding 20 percent
• Tie-back, fast track candidate for 2022 PDO
• Further upside potential in nearby prospects, one of which is
under consideration for drilling
• Bergknapp was the third largest Norway discovery in 2020
• Estimated 32-83 mmboe in gross recoverable resources
• Operated by Wintershall Dea with DNO holding 30 percent
• Attractive tie-back options to nearby fields
• Further appraisal in Q2 2021
Mmboe gross
(Pre-drill 7-77)
Discovery well Appraisal sidetrack
10 km Tie-back to
Troll infrastructure
Røver Nord discovery
@3307m depth
10km
61m oil and gas 29 m oil
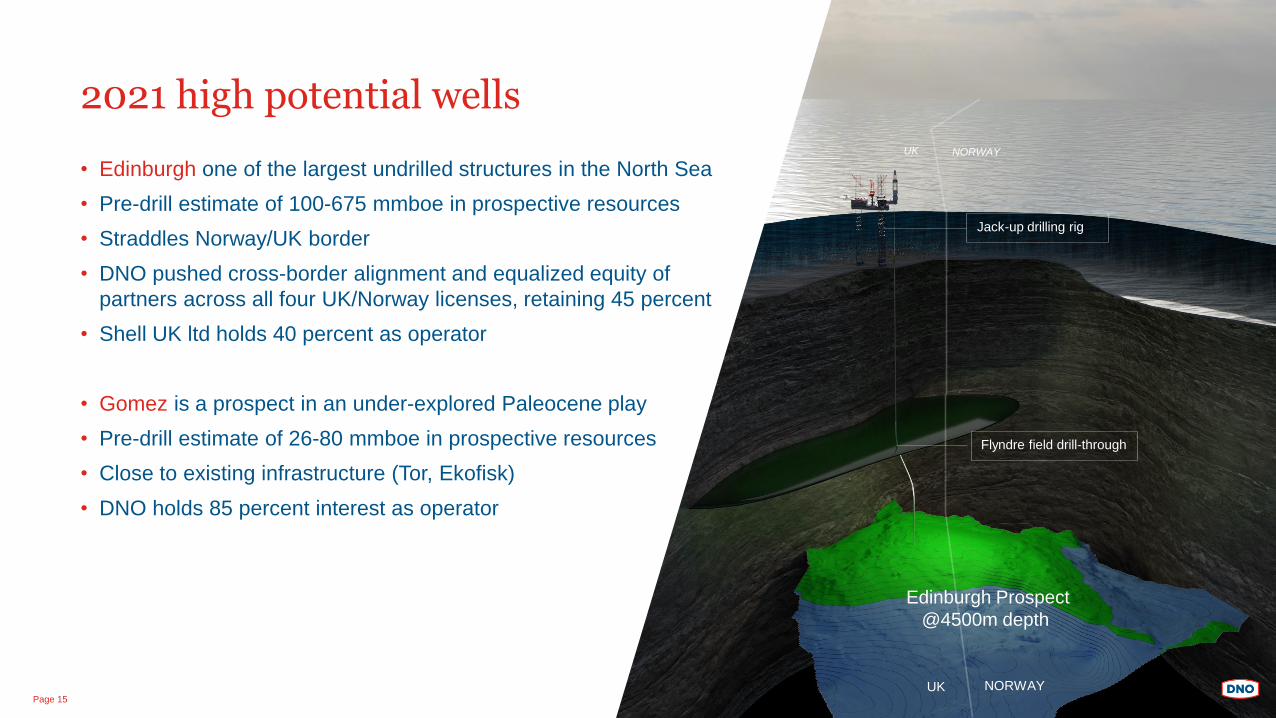
2021 high potential wells
• Edinburgh one of the largest undrilled structures in the North Sea
• Pre-drill estimate of 100-675 mmboe in prospective resources
• Straddles Norway/UK border
• DNO pushed cross-border alignment and equalized equity of
partners across all four UK/Norway licenses, retaining 45 percent
• Shell UK ltd holds 40 percent as operator
• Gomez is a prospect in an under-explored Paleocene play
• Pre-drill estimate of 26-80 mmboe in prospective resources
• Close to existing infrastructure (Tor, Ekofisk)
• DNO holds 85 percent interest as operator
Page 15
Jack-up drilling rig
Flyndre field drill-through
Edinburgh Prospect
@4500m depth
NORWAYUK
NORWAYUK
Page 16
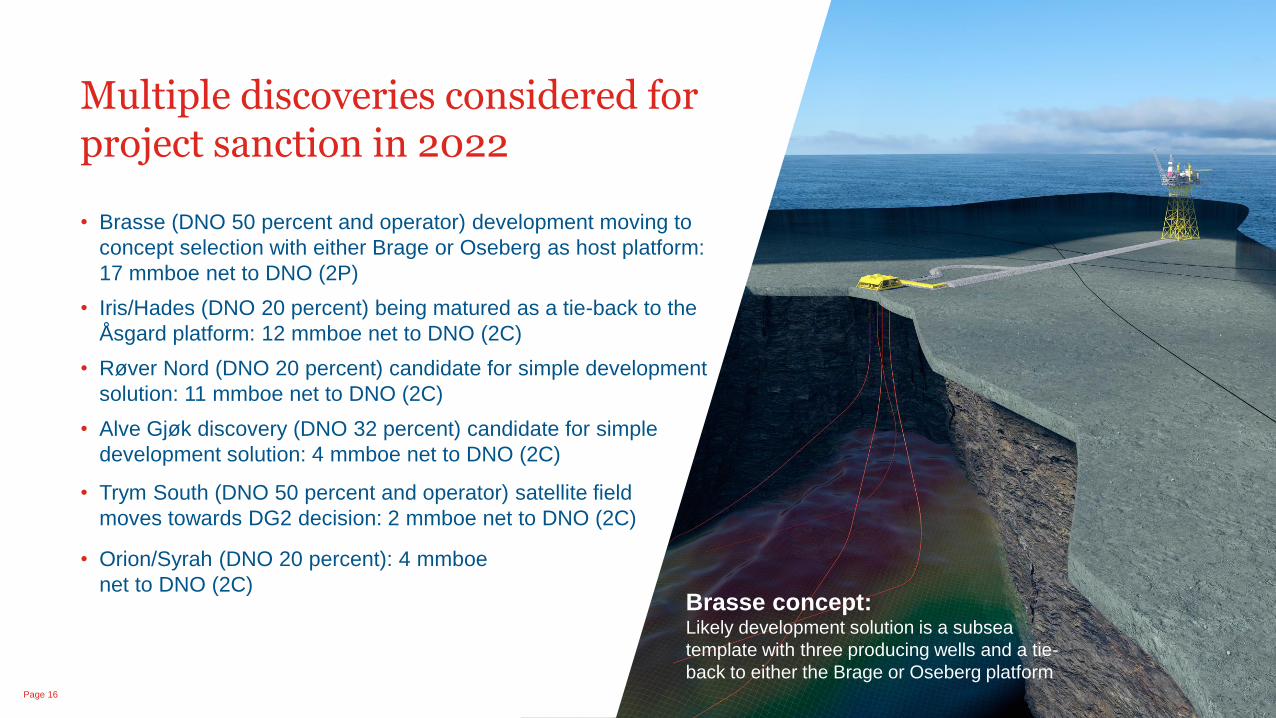
Brasse concept:Likely development solution is a subsea
template with three producing wells and a tie-
back to either the Brage or Oseberg platform
• Brasse (DNO 50 percent and operator) development moving to
concept selection with either Brage or Oseberg as host platform:
17 mmboe net to DNO (2P)
• Iris/Hades (DNO 20 percent) being matured as a tie-back to the
Åsgard platform: 12 mmboe net to DNO (2C)
• Røver Nord (DNO 20 percent) candidate for simple development
solution: 11 mmboe net to DNO (2C)
• Alve Gjøk discovery (DNO 32 percent) candidate for simple
development solution: 4 mmboe net to DNO (2C)
• Trym South (DNO 50 percent and operator) satellite field
moves towards DG2 decision: 2 mmboe net to DNO (2C)
• Orion/Syrah (DNO 20 percent): 4 mmboe
net to DNO (2C)
Multiple discoveries considered for project sanction in 2022
2020 financial review
Page 17
Page 18
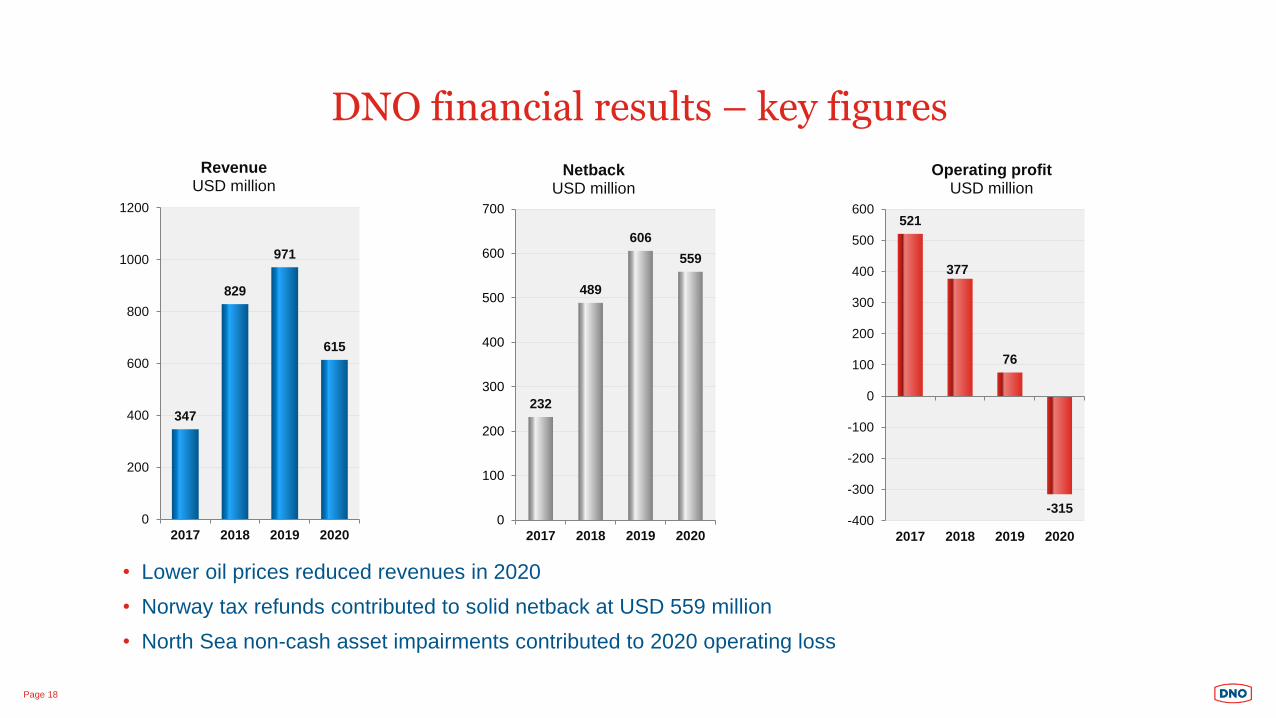
347
829
971
615
0
200
400
600
800
1000
1200
2017 2018 2019 2020
Revenue USD million
DNO financial results – key figures
232
489
606
559
0
100
200
300
400
500
600
700
2017 2018 2019 2020
NetbackUSD million
521
377
76
-315-400
-300
-200
-100
0
100
200
300
400
500
600
2017 2018 2019 2020
Operating profitUSD million
• Lower oil prices reduced revenues in 2020
• Norway tax refunds contributed to solid netback at USD 559 million
• North Sea non-cash asset impairments contributed to 2020 operating loss
Financial summary
Page 19
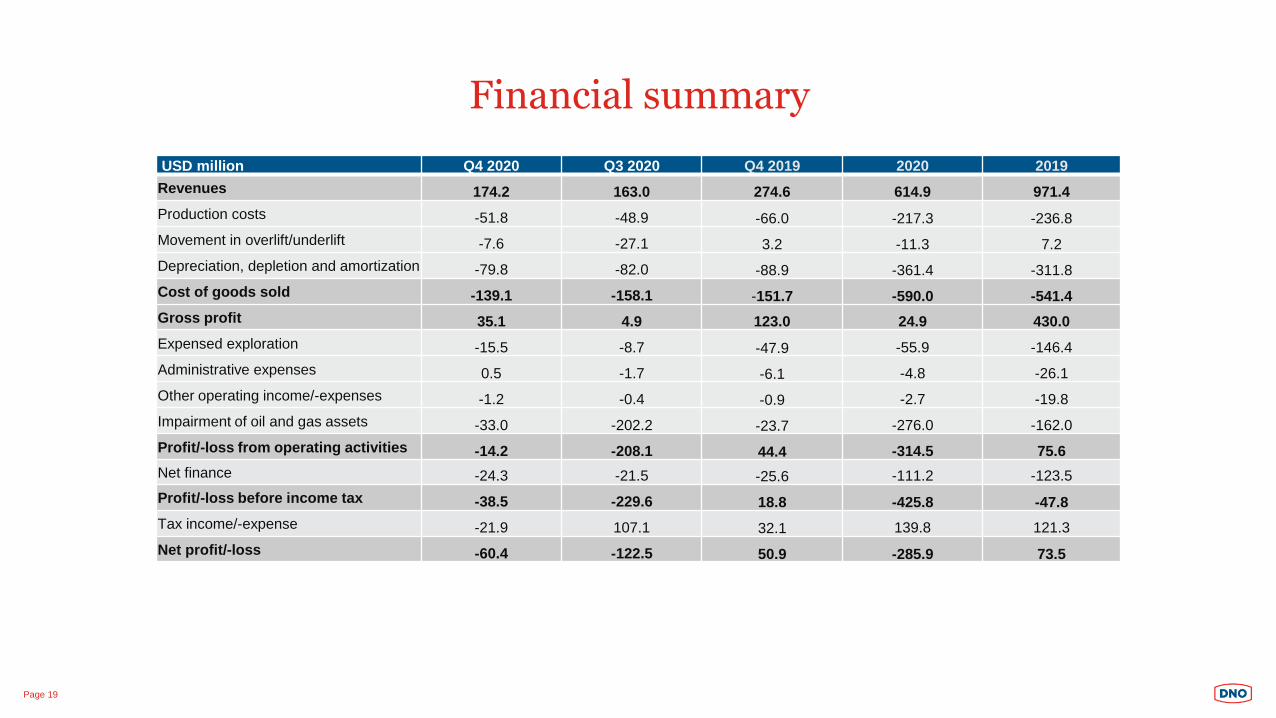
USD million Q4 2020 Q3 2020 Q4 2019 2020 2019
Revenues 174.2 163.0 274.6 614.9 971.4
Production costs -51.8 -48.9 -66.0 -217.3 -236.8
Movement in overlift/underlift -7.6 -27.1 3.2 -11.3 7.2
Depreciation, depletion and amortization -79.8 -82.0 -88.9 -361.4 -311.8
Cost of goods sold -139.1 -158.1 -151.7 -590.0 -541.4
Gross profit 35.1 4.9 123.0 24.9 430.0
Expensed exploration -15.5 -8.7 -47.9 -55.9 -146.4
Administrative expenses 0.5 -1.7 -6.1 -4.8 -26.1
Other operating income/-expenses -1.2 -0.4 -0.9 -2.7 -19.8
Impairment of oil and gas assets -33.0 -202.2 -23.7 -276.0 -162.0
Profit/-loss from operating activities -14.2 -208.1 44.4 -314.5 75.6
Net finance -24.3 -21.5 -25.6 -111.2 -123.5
Profit/-loss before income tax -38.5 -229.6 18.8 -425.8 -47.8
Tax income/-expense -21.9 107.1 32.1 139.8 121.3
Net profit/-loss -60.4 -122.5 50.9 -285.9 73.5
Page 20
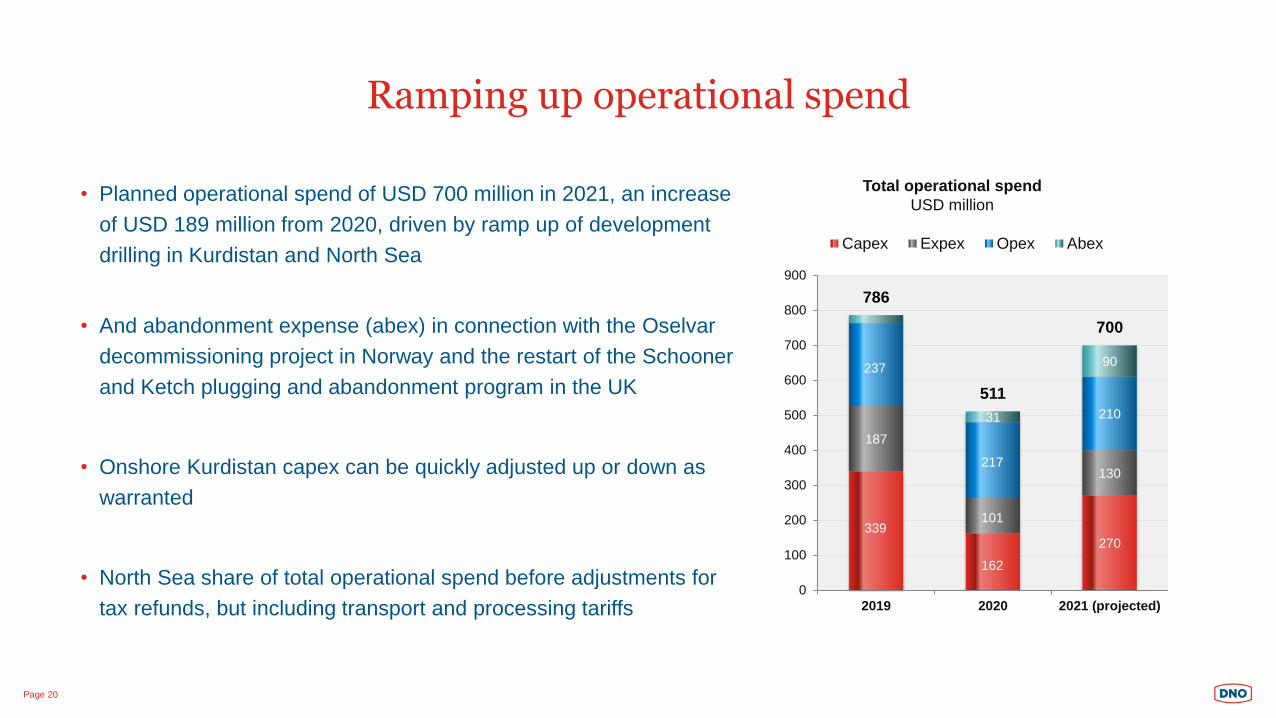
Ramping up operational spend
339
162
270
187
101
130
237
217
21031
90
786
511
700
0
100
200
300
400
500
600
700
800
900
2019 2020 2021 (projected)
Capex Expex Opex Abex
• Planned operational spend of USD 700 million in 2021, an increase
of USD 189 million from 2020, driven by ramp up of development
drilling in Kurdistan and North Sea
• And abandonment expense (abex) in connection with the Oselvar
decommissioning project in Norway and the restart of the Schooner
and Ketch plugging and abandonment program in the UK
• Onshore Kurdistan capex can be quickly adjusted up or down as
warranted
• North Sea share of total operational spend before adjustments for
tax refunds, but including transport and processing tariffs
Total operational spend
USD million
Page 21
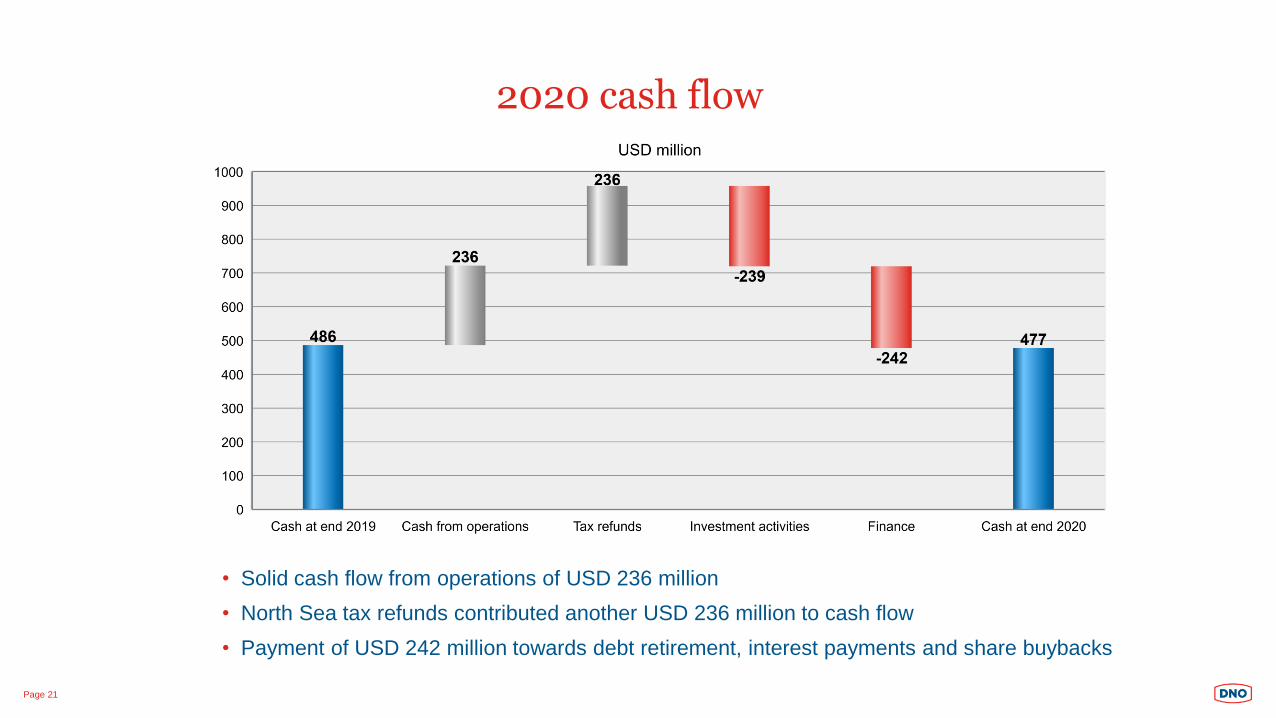
2020 cash flow
• Solid cash flow from operations of USD 236 million
• North Sea tax refunds contributed another USD 236 million to cash flow
• Payment of USD 242 million towards debt retirement, interest payments and share buybacks
Page 22
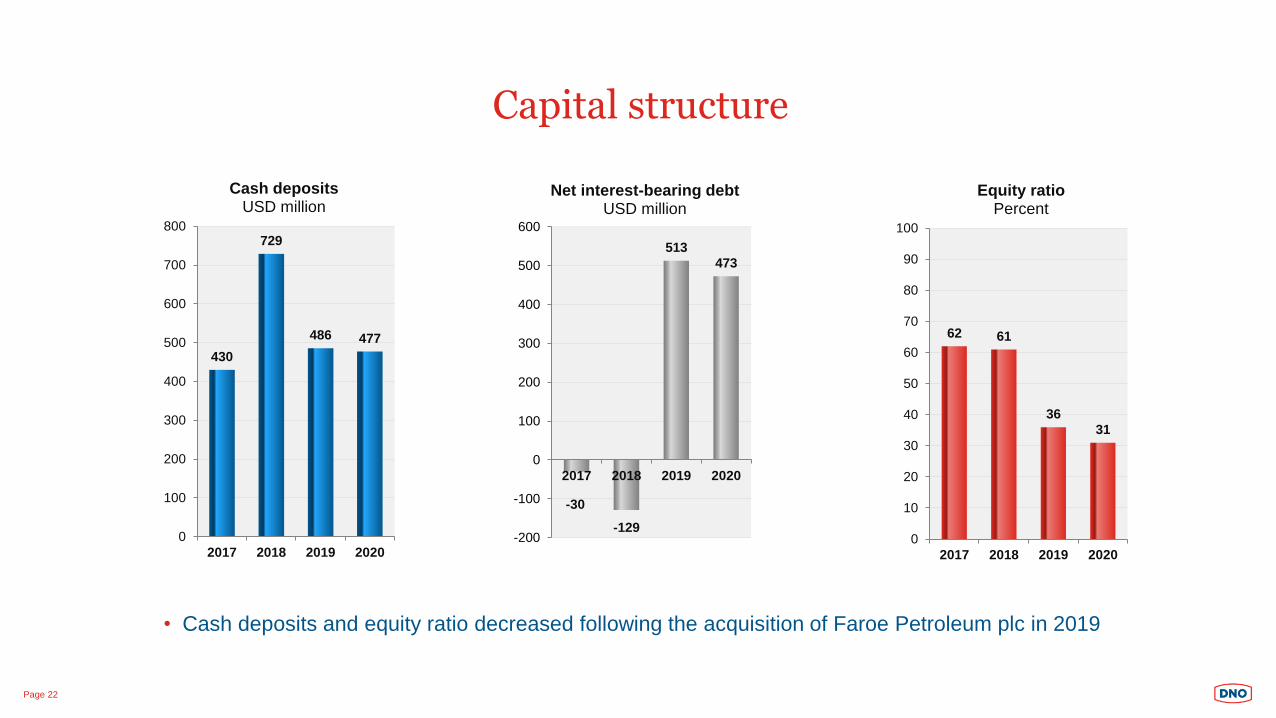
Capital structure
430
729
486 477
0
100
200
300
400
500
600
700
800
2017 2018 2019 2020
Cash deposits USD million
-30
-129
513473
-200
-100
0
100
200
300
400
500
600
2017 2018 2019 2020
Net interest-bearing debt USD million
62 61
36
31
0
10
20
30
40
50
60
70
80
90
100
2017 2018 2019 2020
Equity ratio Percent
• Cash deposits and equity ratio decreased following the acquisition of Faroe Petroleum plc in 2019

Important notice
This presentation (the “Presentation”) has been prepared and delivered by DNO ASA (“DNO” or the “Company”). Copyright of all published material including photographs, drawings and images in this document
remains vested in DNO and third party contributors as appropriate. Accordingly, neither the whole nor any part of this document shall be reproduced in any form nor used in any manner without express prior
permission and applicable acknowledgements. No trademark, copyright or other notice shall be altered or removed from any reproduction.
The Presentation contains certain forward-looking statements relating to the business, financial performance and results of the Company and/or industry and markets in which it operates. Forward-looking
statements concern future circumstances and results and other statements that are not historical facts, sometimes identified by the words “believes”, “expects”, “predicts”, “intends”, “projects”, “plans”, “estimates”,
“aims”, “foresees”, “anticipates”, “targets”, and similar expressions. Any forward-looking statements and other information contained in this Presentation, including assumptions, opinions and views of the Company
or cited from third party sources are solely opinions and forecasts based on the current expectations, estimates and projections of the Company or assumptions based on information currently available to the
Company, which are subject to risks, uncertainties and other factors that may cause actual events to differ materially from any anticipated development.
Although the Company believes that its expectations and the Presentation are based upon reasonable assumptions, neither the Company, nor any of its subsidiary undertakings or any such person’s officers or
employees provides any assurance that the assumptions underlying such forward-looking information and statements are free from errors nor does any of them accept any responsibility for the future accuracy of
the opinions expressed in this Presentation or the actual occurrence of the forecasted developments. The Company assumes no obligation, except as required by law, to update any forward-looking statements or
to conform these forward-looking statements to our actual results.
Any investment involves risks, and several factors could cause the actual results, performance or achievements of the Company as described herein to be materially different from any future results, performance
or achievements that may be expressed or implied by statements and information in this Presentation, including, among others, risks or uncertainties associated with the Company’s business, segments,
development, growth management, financing, market acceptance and relations with customers. More generally an investment will involve risks related to general economic and business conditions, changes in
domestic and foreign laws and regulations, taxes, changes in competition and pricing environments, fluctuations in currency exchange rates and interest rates and other factors. Should one or more of such risks or
uncertainties materialize, or should underlying assumptions prove incorrect, actual results may vary materially from those described in this Presentation.
DNO is making no representation or warranty, expressed or implied, as to the accuracy, reliability or completeness of the Presentation, and neither DNO nor any of its directors, officers or employees will have any
liability to you or any other persons resulting from your use.
The Presentation speaks and reflects prevailing conditions and views as of the date of this release. It may be subject to corrections and change at any time without notice except as required by law. The delivery of
this Presentation - or any further discussions of the Company with any recipient - shall not, under any circumstances, create any implication that the Company assumes any obligation to update or correct the
information herein, nor any implication that there has been no change in the affairs of the Company since such date.
Page 23