third quarter 2020 results - globenewswire
TRANSCRIPT

Chart IndustriesTHIRD QUARTER 2020 RESULTS

Forward-Looking StatementsCERTAIN STATEMENTS MADE IN THIS PRESENTATION ARE FORW ARD -LOOKING STATEMENTS W ITHIN THE MEANING OF THE PRIVATE SECURITIES LITIGATION REFORM ACT OF 1995. FORW ARD-LOOKING STATEMENTS INCLUDE STATEMENTS CONCERNING THE COMPANY’S BUSINESS PLANS, INCLUDING STATEMENTS REGARDING COMPLETED DIVESTITURES, ACQUISITI ONS, COST SYNERGIES AND EFFICIENCY SAVINGS, OBJECTIVES, FUTURE ORDERS, REVENUES, MARGINS, EARNINGS OR PERFORMANCE, LIQUI DITY AND CASH FLOW , CAPITAL EXPENDITURES, BUSINESS TRENDS, GOVERNMENTAL INITIATIVES, INCLUDING EXECUTIVE ORDERS AND OTHER INFORMATION THAT IS NOT HISTORICAL IN NATURE. FORW ARD-LOOKING STATEMENTS MAY BE IDENTIFIED BY TERMINO LOGY SUCH AS "MAY," "W ILL," "SHOULD," "COULD," "EXPECTS," "ANTICIPATES," "BELIEVES," "PROJECTS," "FORECASTS," “OUTLOOK,” “ GUIDANCE,” "CONTINUE," “TARGET,” OR THE NEGATIVE OF SUCH TERMS O R COMPARABLE TERMINOLOGY.
FORW ARD-LOOKING STATEMENTS CONTAINED IN THIS PRESENTATION OR IN OTHER STATEMENTS MADE BY THE COMPANY ARE MADE BASED ON MANAGEMENT'S EXPECTATIONS AND BELIEFS CONCERNING FUTURE EVENTS I MPACTING THE COMPANY AND ARE SUBJECT TO UNCERTAINTIES AND FACTORS RELATING TO THE COMPANY'S OPERATIONS AND BUSINESS EN VIRONMENT, ALL OF W HICH ARE DIFFICULT TO PREDICT AND MANY OF W HICH ARE BEYOND THE COMPANY'S CONTROL, THAT COULD CAUSE THE COMPANY'S ACTUAL RESULTS TO DIFFER MATERIALLY FROM THOSE MATTERS EXPRESSED OR IMPLIED BY FORW ARD -LOOKING STATEMENTS. FACTORS THAT COULD CAUSE THE COMPANY’S ACTUAL RESULTS TO DIFFER MATERIALLY FROM THOSE DESCRIBED IN THE FORW ARD -LOOKING STATEMENTS INCLUDE: THE COMPANY’S ABILITY TO SUCCESSFULLY INTEGRATE RECENT ACQUISITIONS AND ACHIEVE THE ANTIC IPATED REVENUE, EARNINGS, ACCRETION AND OTHER BENEFITS FROM THESE ACQUISITIONS; RISKS RELATING TO THE RECENT OUTBREAK A ND CONTINUED UNCERTAINTY ASSOCIATED W ITH THE CORONAVIRUS (COVID-19) AND THE OTHER FACTORS DISCUSSED IN ITEM 1A (RISK FACT ORS) IN THE COMPANY’S MOST RECENT ANNUAL REPORT ON FORM 10 -K AND QUARTERLY REPORTS ON FORM 10-Q FILED W ITH THE SEC, W HICH SHOULD BE REVIEW ED CAREFULLY. THE COMPANY UNDERTAKES NO OBLIGATION TO UPDATE OR REVISE ANY FORW ARD -LOOKING STATEMENT.
THIS PRESENTATION CONTAINS NON-GAAP FINANCIAL INFORMATION, INCLUDING ADJUSTED EPS, AND Q3 2020 FREE CASH FLOW . FORADDITIONAL INFORMATION REGARDING THE COMPANY'S USE OFNON-GAAP FINANCIAL INFORMATION, AS W ELL AS RECONCILIATIONS OF NON-GAAP FINANCIAL MEASURES TO THE MOST DIRECTLY COMPARABLE FINANCIAL MEASURES CALCULATED AND PRESENTED IN ACCORDANCE W ITHACCOUNTING PRINCIPLES GENERALLY ACCEPTED IN THE UNITED STATES ("GAAP"), PLEASE SEE THE PAGES AT THE END OF THIS NEWSRELEASE. WITH RESPECT TO THE COMPANY’S 2020 AND 2021 FULL YEAR EARNINGS OUTLOOKS, THE COMPANY IS NOT ABLE TO PROVIDE ARECONCILIATION OF THE ADJUSTED EARNINGS PER DILUTED SHARE BECAUSE CERTAIN ITEMS MAY HAVE NOT YET OCCURRED OR ARE OUT OFTHE COMPANY’S CONTROL AND/OR CANNOT BE REASONABLY PREDICTED. FURTHERMORE, NON-GAAP FINANCIAL MEASURES SHOW N IN THEPRESENTATION SLIDE LABELED “EXTERNAL SEGMENTATION” W ERE NOT RECONCILED TO THE COMPARABLE GAAP FINANCIAL MEASURESBECAUSE THE GAAP MEASURES W OULD REQUIRE SIGNIFICANT EFFORT TO PREPARE AND THEREFORE ARE NOT AVAILABLE AS OF THE TIME OFTHIS NEW S RELEASE.
CHART INDUSTRIES, INC. IS A LEADING INDEPENDENT GLOBAL MANUFACTURER OF HIGHLY ENGINEERED EQUIPMENT SERVICING MULTIPLEAPPLICATIONS IN THE ENERGY AND INDUSTRIAL GAS MARKETS. OUR UNIQUE PRODUCT PORTFOLIO IS USED IN EVERY PHASE OF THE LIQUIDGAS SUPPLY CHAIN, INCLUDING UPFRONT ENGINEERING, SERVICE AND REPAIR. BEING AT THE FOREFRONT OF THE CLEAN ENERGYTRANSITION, CHART IS A LEADING PROVIDER OF TECHNOLOGY, EQUIPMENT AND SERVICES RELATED TO LIQUEFIED NATURAL GAS, HYDROGEN,BIOGAS AND CO2 CAPTURE AMONGST OTHER APPLICATIONS. W E ARE COMMITTED TO EXCELLENCE IN ENVIRONMENTAL, SOCIAL ANDCORPORATE GOVERNANCE (ESG) ISSUES BOTH FOR OUR COMPANY AS W ELL AS OUR CUSTOMERS. W ITH OVER 25 GLOBAL LOCATIONS FROMTHE UNITED STATES TO ASIA, AUSTRALIA, INDIA, EUROPE AND SOUTH AMERICA, W E MAINTAIN ACCOUNTABILITY AND TRANSPARENCY TO OURTEAM MEMBERS, SUPPLIERS, CUSTOMERS AND COMMUNITIES. TO LEARN MORE, VISIT WWW.CHARTINDUSTRIES.COM.© 2020 Chart Industries, Inc. Confidential and Proprietary 2

Our Focused Strategy Supports Clean Energy Targets
3
*Blue areas (A through J) are
applications for which Chart has
existing products and solutions
© 2020 Chart Industries, Inc. Confidential and Proprietary

Chart’s Transformation
4
Business
Operations
Higher customer concentration / lower geographic diversity
Heavy reliance on single large LNG projects
Significant backlog with PetroChina that went away in 2016 ($150M)
Few long-term contracts in place
Limited actions taken for cost rationalization
Limited to no aftermarket, service and repair
Lower customer concentration / higher end-market and geographic diversity
Multiple long-term agreements, MOUs in place
Centralized business services and agile, quick cost rationalization
Aftermarket parts, service and repair revenue continues to increase
Big LNG is a “nice to have” whereas before it was a “necessity”
High growth (10%+) identified specialty products for specialty markets
Business
Changes
2018-
Present
Before 2018
THEN
2018 – Present
TODAY
© 2020 Chart Industries, Inc. Confidential and Proprietary
2018:
Acquires VRV
2018:
Acquires Skaff
Cryogenics
and Cryo-
Lease, LLC
2018:
Completes
major capacity
expansion in
La Crosse, WI
2018:
Divests
oxygen
concentrator
business
Note: Figures as-reported during stated period
2019:
Acquisition of
Air-X-
Changers
Capacity
Competitive
advantage
Competitive
advantageRepair &
service
location
Leasing line
India & Italy
Manufacturing
Revenue
synergies
Exited non-
core, non-
cryogenic
business
Expanded
product
offering with
clean energy
capabilities
2020:
Acquires
cryogenic and
hydrogen
trailer
business
2020:
Divests
cryobiological
product lines
2020:
Completes
supply
agreement for
H2
2020:
Invests in and
completes
commercial MOU
for hydrogen
USA USA EU / India USA USA / India Global USA USA Global
Exit non-core
business with
high liabilities
Catalyst for
trailer
acquisition
Competitive
advantage
Expanded
product
offering
Competitive
advantage
Revenue
synergies
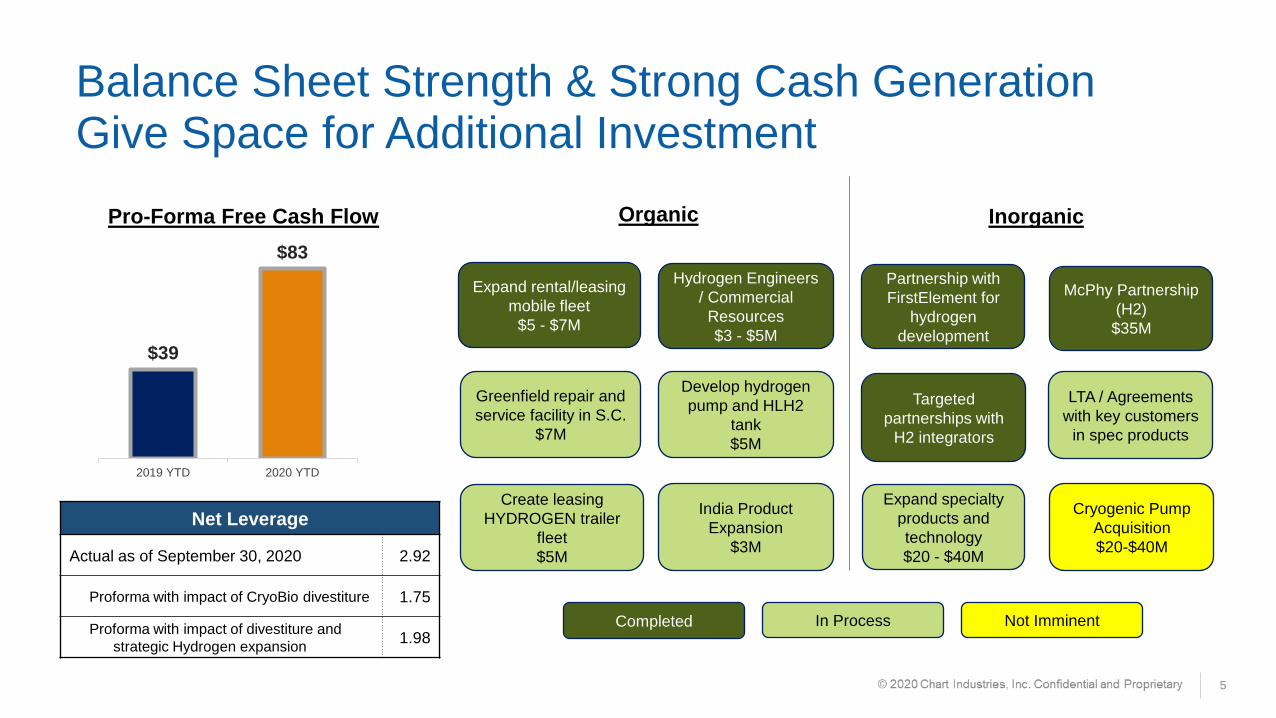
Balance Sheet Strength & Strong Cash Generation Give Space for Additional Investment
5
Organic Inorganic
Expand rental/leasing
mobile fleet
$5 - $7M
Create leasing
HYDROGEN trailer
fleet
$5M
Hydrogen Engineers
/ Commercial
Resources
$3 - $5M
Develop hydrogen
pump and HLH2
tank
$5M
Greenfield repair and
service facility in S.C.
$7M
India Product
Expansion
$3M
Net Leverage
Actual as of September 30, 2020 2.92
Proforma with impact of CryoBio divestiture 1.75
Proforma with impact of divestiture and
strategic Hydrogen expansion1.98
Pro-Forma Free Cash Flow
Cryogenic Pump
Acquisition
$20-$40M
McPhy Partnership
(H2)
$35M
Partnership with
FirstElement for
hydrogen
development
LTA / Agreements
with key customers
in spec products
Expand specialty
products and
technology
$20 - $40M
Targeted
partnerships with
H2 integrators
Completed In Process Not Imminent
$39
$83
2019 YTD 2020 YTD

Immediate Impacts: Hydrogen
6
Recent Order Wins
• Gaseous hydrogen t ra i le rs
in Germany for $2 mi l l ion
(Oc tober)
• Verbal $6 .4 mi l l ion t ra i le r
order (October)
• LOI for $2 .4 mi l l ion t ra i le r
order (Oc tober)
• PlugPow er Supply
Agreement and $7 .8 mi l l ion
o f orders (September)
• Brazed a luminum hea t
exchanger order for H2
$500k (September)
• LH2 tanks order for Mex ico
$700k (September)
• MOU for As ia hydrogen
pro jec t w i th ma jor
indus t r ia l gas cus tomer
H2@SCALE Texas:
• Frontier Energy
• GTI
• The University of Texas (Austin)
• OneH2
• SoCalGas
• Toyota Motor North America
• Shell
• MHI
• Air Liquide
• PowerCell Sweden AB
• Chart Industries, Inc.
Expanded H2 Trailer Capabilities
• Capability to manufacture 28
foot, 48 foot and 53 foot
trailers
• 300,000 square foot facility
with Port of Mobile Access

Customer Stickiness (LTAs, LOIs, MOUs)
7
MOUs / LOCs LTAs / Agreements Complete LOIs
ExxonMobil India LNG and IOCL HLNG Customer 1 (2019) IG Major (A) Bulk & Lifecycle
IOCL HLNG Customer 2 (2019) MIT tanks
Risco Energy IG Major (A) Vaporizers Eagle Jax ssLNG
Energy Capital Vietnam (ECV) IG Major (A) PRS Shell German stations
AG&P Matheson Molson LOI for distribution line
Major IG Asia Hydrogen Development Praxair PRS Renergen for LNG equipment South Africa
Gasum repair & service
Liquind Agreement for Fueling Stations
Baywa Agreement for Fueling Stations
Master Agreement with Flint Hills Resources for air
coolers
IG Major B (Bulk)
IG Major (B) Lifecycle
SOL Master Agreement
Plug Power Supply Agreement
Liquind repair & service
Stratolaunch Master Agreement
Increment Power Engineering & Supply Agreement for
Energy Storage
*Red italicized text denotes signing or extension was completed in Q3 2020© 2020 Chart Industries, Inc. Confidential and Proprietary
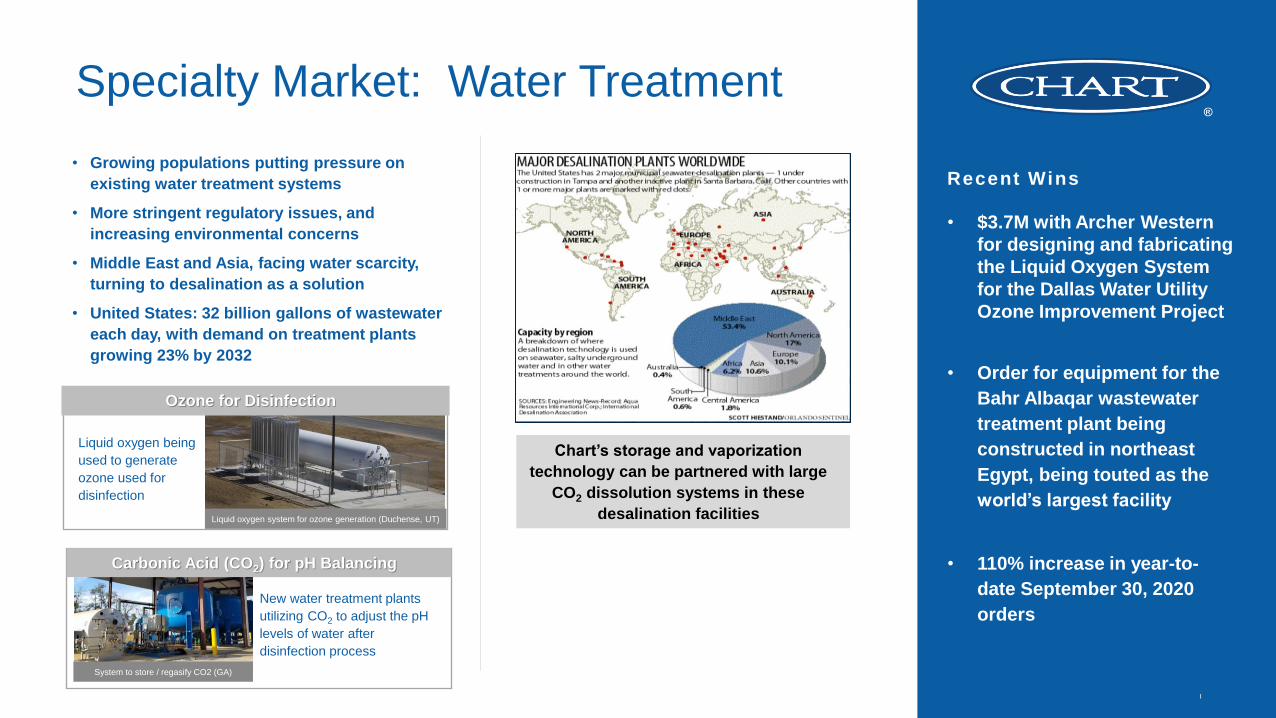
Specialty Market: Water Treatment
8
• $3.7M with Archer Western
for designing and fabricating
the Liquid Oxygen System
for the Dallas Water Utility
Ozone Improvement Project
• Order for equipment for the
Bahr Albaqar wastewater
treatment plant being
constructed in northeast
Egypt, being touted as the
world’s largest facility
• 110% increase in year-to-
date September 30, 2020
orders
Recent Wins
Liquid oxygen being
used to generate
ozone used for
disinfection
• Growing populations putting pressure on
existing water treatment systems
• More stringent regulatory issues, and
increasing environmental concerns
• Middle East and Asia, facing water scarcity,
turning to desalination as a solution
• United States: 32 billion gallons of wastewater
each day, with demand on treatment plants
growing 23% by 2032
Liquid oxygen system for ozone generation (Duchense, UT)
System to store / regasify CO2 (GA)
New water treatment plants
utilizing CO2 to adjust the pH
levels of water after
disinfection process
Chart’s storage and vaporization
technology can be partnered with large
CO2 dissolution systems in these
desalination facilities
Ozone for Disinfection
Carbonic Acid (CO2) for pH Balancing

First-Of-A-Kind Projects in Q3 2020
9© 2020 Chart Industries, Inc. Confidential and Proprietary
Liquid Air Energy Storage
We executed an exclusive three-year
design and supply agreement with
Increment Power for liquefaction,
storage, truck loading and pipe for
ISTOR™’s proprietary liquid air
energy storage system.
Liquid Oxygen for Rocket Vehicles
We completed a Master Service
Agreement with Stratolaunch for
engineering solutions of a liquid oxygen
tank for use on a carrier plane as part of
their hypersonic aerospace vehicle
program.
N2 dosing for cleaning disinfectant
Received an order for a major
consumer products company that is
utilizing N2 dosers and phase
separators in their disinfectant PET
bottles to avoid paneling.

© 2020 Chart Industries, Inc. Confidential and Proprietary 10
Q3 2020 BacklogE&C Cryo E&C FinFans D&S West D&S EastTotal Chart
Includes $46M of
VG Calcasieu
Pass
Included $134M
of VG Calcasieu
Pass
Includes $46M of
VG Calcasieu
Pass
Included $134M
of VG Calcasieu
Pass
$611 $639+5%
Chart ex Calcasieu:
Chart Total:
$154 $183+19%
$288
$229
Q3 FY19 Q3 FY20
-20%$136
$62
Q3 FY19 Q3 FY20
-54%
$117
$180
Q3 FY19 Q3 FY20
+54%
$204
$229
Q3 FY19 Q3 FY20
+12%$745
$685
Q3 FY19 Q3 FY20
-8%
$686 $685
Q2 FY20 Q3 FY20
0%
Includes $46M of
VG Calcasieu
Pass
Included $72M of
VG Calcasieu
Pass
$614 $639+4%
Chart ex Calcasieu:
Chart Total:
$185+1%
Includes $46M of
VG Calcasieu
Pass
Included $72M of
VG Calcasieu
Pass
$257$229
Q2 FY20 Q3 FY20
-11%$68
$62
Q2 FY20 Q3 FY20
-9%
$146
$180
Q2 FY20 Q3 FY20
+23%
$218
$229
Q2 FY20 Q3 FY20
+5%
$183

© 2020 Chart Industries, Inc. Confidential and Proprietary 11
Q3 and Year-to-Date 2020 EPS
$ millions, except per share amountsContinuing Operations Q3 2020 Q3 2019 Change v. PY YTD 2020 YTD 2019 Change v. PY
Net income from continuing operations $15.8 $13.8 $2.0 $32.4 $15.3 $17.1
Reported Diluted EPS $0.43 $0.38 $0.05 $0.88 $0.43 $0.45
1 Restructuring and transaction-related costs 0.17 0.25 (0.08) 0.54 0.84 (0.30)
2 Gain on sale of a facility in China - - - (0.07) - (0.07)
3 Other one-time items (1) 0.04 0.06 (0.02) 0.20 0.14 0.06
4 Tax effects (2) (0.02) (0.06) 0.04 (0.12) (0.14) 0.02
5 Dilution impact of convertible notes 0.01 0.01 - - 0.03 (0.03)
Adjusted Diluted EPS (3) $0.63 $0.64 ($0.01) $1.43 $1.30 $0.13
(1) Other one-time items were related to: Stabilis investment mark-to-market and Liberty LNG investment adjustment of $0.15 in Q1, ($0.02) in Q2 and ($0.01) in Q3 2020;
COVID-19 related costs of $0.03 and $0.02 in Q1 and Q3 2020 respectively; Commercial and legal settlements of $0.06 in Q3 2019 and $0.02 and $0.03 in Q1 and Q3 2020
respectively; and Tax Reform / transition tax related adjustments $0.02 in Q1 2019.
(2) Tax effect reflects adjustment at normalized periodic rates.
(3) Adjusted EPS (a non-GAAP measure) is as reported on a historical basis.

Full Year 2020 Guidance (Continuing Operations)
12© 2020 Chart Industries, Inc. Confidential and Proprietary
Revenue
Approximately $1.2B
Includes $100M of Calcasieu
Pass
Diluted Adjusted EPS
Approximately $2.25
Assumes 19% ETR
Capital Expenditures
$30M to $35M
Prior Guidance Current Guidance
Adjusted Free Cash Flow
$120 to $140M
Revenue
Approximately $1.18B
Includes $100M of Calcasieu
Pass
Diluted Adjusted EPS
Approximately $2.25
Assumes 19% ETR
Capital Expenditures
$30M to $35M
Adjusted Free Cash Flow
$120 to $140M
Unchanged
Unchanged
Shifted to 2021
Unchanged

2021 Outlook
13© 2020 Chart Industries, Inc. Confidential and Proprietary
Revenue
$1.25 - $1.325B
Includes $23M of
Calcasieu
Diluted Adjusted EPS
$2.90 to $3.25
Assumes 18% ETR
Capital Expenditures
$30M to $35M
Prior
Free Cash Flow
$175 to $200M
Assumes no additional Big LNG Revenue ($M) Adjusted EPS
2020 Guidance, continuing ops (1) $1,180 $2.25
Calcasieu Gap (75) (0.65) - (0.75)
ssLNG terminals/other petchem 45 – 75 0.27 – 0.45
Base business growth at 3% - 4% 25 – 35 0.17 – 0.24
Air cooled heat exchanger recovery 10 – 25 0.03 – 0.10
Specialty products, LRS at 10% 35 – 45 0.25 – 0.35
Incremental restructuring savings offset
by engineering investment
0.45
Interest expense savings 0.15
Alabama cryo & hydrogen trailers 15 – 20 0.07 - 0.12
Q3 2020 revenue shifts to 2021 20 - 25 0.10 - 0.15
2021 Outlook, continuing ops (2) $1,250 - $1,325 $3.00 - $3.40
(1) Excludes full year cryobiological products
(2) Does not include any additional Big LNG; embeds effective tax rate benefit into each row of
adjusted EPS
Revenue
$1.250 - $1.325 Billion
Includes $23M of
Calcasieu
Diluted Adjusted EPS
$3.00 to $3.40
Assumes 18% ETR
Capital Expenditures
$30M to $35M
Free Cash Flow
$175 to $200M
Current
Unchanged
Unchanged
Unchanged
Increase

Appendix
14
© 2020 Chart Industries, Inc. Confidential and Proprietary 15
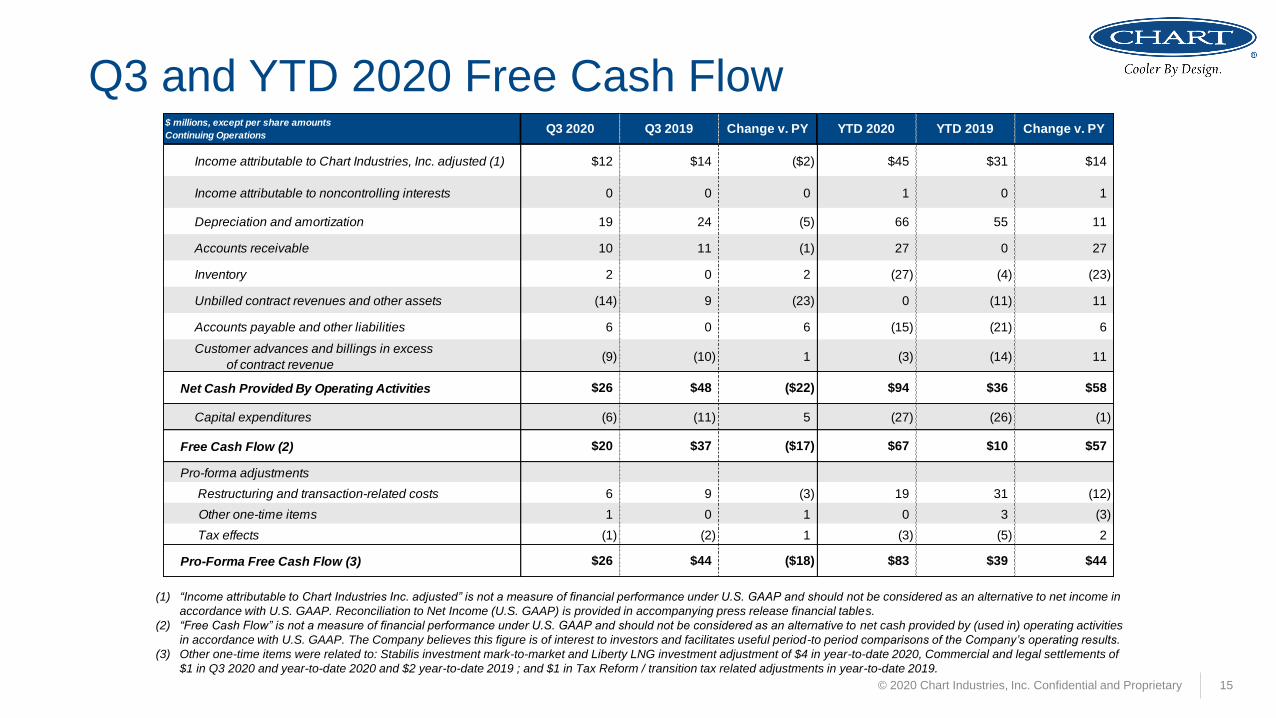
Q3 and YTD 2020 Free Cash Flow
(1) “Income attributable to Chart Industries Inc. adjusted” is not a measure of financial performance under U.S. GAAP and should not be considered as an alternative to net income in
accordance with U.S. GAAP. Reconciliation to Net Income (U.S. GAAP) is provided in accompanying press release financial tables.
(2) “Free Cash Flow” is not a measure of financial performance under U.S. GAAP and should not be considered as an alternative to net cash provided by (used in) operating activities
in accordance with U.S. GAAP. The Company believes this figure is of interest to investors and facilitates useful period-to period comparisons of the Company’s operating results.
(3) Other one-time items were related to: Stabilis investment mark-to-market and Liberty LNG investment adjustment of $4 in year-to-date 2020, Commercial and legal settlements of
$1 in Q3 2020 and year-to-date 2020 and $2 year-to-date 2019 ; and $1 in Tax Reform / transition tax related adjustments in year-to-date 2019.
Income attributable to Chart Industries, Inc. adjusted (1) $12 $14 ($2) $45 $31 $14
Income attributable to noncontrolling interests 0 0 0 1 0 1
Depreciation and amortization 19 24 (5) 66 55 11
Accounts receivable 10 11 (1) 27 0 27
Inventory 2 0 2 (27) (4) (23)
Unbilled contract revenues and other assets (14) 9 (23) 0 (11) 11
Accounts payable and other liabilities 6 0 6 (15) (21) 6
Customer advances and billings in excess
of contract revenue(9) (10) 1 (3) (14) 11
Net Cash Provided By Operating Activities $26 $48 ($22) $94 $36 $58
Capital expenditures (6) (11) 5 (27) (26) (1)
Free Cash Flow (2) $20 $37 ($17) $67 $10 $57
Pro-forma adjustments
Restructuring and transaction-related costs 6 9 (3) 19 31 (12)
Other one-time items 1 0 1 0 3 (3)
Tax effects (1) (2) 1 (3) (5) 2
Pro-Forma Free Cash Flow (3) $26 $44 ($18) $83 $39 $44
Q3 2019 Change v. PY YTD 2020 YTD 2019 Change v. PY$ millions, except per share amounts
Continuing OperationsQ3 2020

© 2020 Chart Industries, Inc. Confidential and Proprietary 16
Divested Cryobiological YTD StatisticsIn Discontinued Operations