2019 - prominence advisors
TRANSCRIPT

2019
Copyright © 2019 Prominence Advisors, Inc. All rights reserved.

Copyright © 2019 Prominence Advisors, Inc. All rights reserved.
$400MM+
18+Best Places to Work Awards
In the hundreds of successfulimplementations with organizations acrossthe country, Prominence has documentedover $400MM of ROI to date. It’s one thing for someone to say that their solutions save time and money, but another thing to be able to back it up with a proven track record of success and hard ROI numbers.
Prominence’s culture speaks for itself. Our clear and simple core values, KLAS-leading rankings, and the breadth of our staff’s experience all come together to produce an unparalleled experience for our customers. There’s a reason that 100% of our customers have come back to us for additional engagements, and why we’ve scored a perfect 10.0 in KLAS for not nickel-and-diming, and we’d love the opportunity to show you why.
TWOHIMSS Davies & Truven AwardsHIMSS Davies and Truven awards areconsidered the pinnacle of technology inhealthcare IT. Prominence has won not one, but two, of each of these awards while working with their customers. Our people and our technologies have a very real and very positive impact on healthcare across the nation, every day.
Documented ROI
Best Hospitals in the Nation
7/10
The best hospitals, healthcare organizations, and academic centers rely on Prominence to provide cutting-edge solutions, advice, and expertise. Our teams have experience in every aspect of the provider, payer, academic, and administrative spaces, and we’re able toprovide our services across the spectrum of healthcare, instead of just a single domain area.
Proven ROI

Copyright © 2019 Prominence Advisors, Inc. All rights reserved.
Payer PerformanceProfessional & Hospital Revenue Cycle ManagementMedical EconomicsGeneral Ledger AnalyzerBundled PaymentsDenialsReferrals
Surgical ServicesSepsis IndicatorsEmergency MedicineNursing ScorecardPhysician ScorecardImaging & Radiology
Executive
Access & Revenue
Performance & Efficiency
Clinical
Research
Quality
In Development
Executive SpotlightPopulation HealthReadmissionsPatient DemographicsPatient ExperienceLabor & Productivity
Click on any Accelerator to jump to that page.
Metric ManagementReporting Toolbox
Compliance & Risk ManagementDe-identified Cohort Creation
Quality & Core Measures
ACO ScorecardDischarge Summary
Finance KPICase Management
Schedule UtilizationWorkqueue Management
Governance DashboardClinical Documentation Improvement
OPPE/FPPESupply Chain Mgmt
Command CenterPatient Centered Medical Home
Medical Cost SavingsMedical Pharmacy Utilization
PreSalesAutomated Database ValidationCustom Database Visualization
Academic
Resident & Fellow ManagementCurriculum Data
ProminenceAccelerators

Copyright © 2019 Prominence Advisors, Inc. All rights reserved.
Recent Developments
Save your organization’s resources on upfront purchases, server space, down time, and distribution woes by hosting your solutions in our HIPAA compliant cloud. Our team will not only develop your best practice analytic solutions, but also host them, oversee maintenance and upgrades, assist with user access & security and complete ongoing application optimization.
HIPAA-Compliant Hosting Patient De-identification
Looking to give researchers access to large data sets before IRB approval or to provide the ability to review system data without sacrificing PHI? We can de-identify all of our applications within HIPAA guidelines and provide select members of your organization the ability to re-identify cohorts.
Database Validation
Prominence has experience validating the integrity and accuracy of data in Enterprise Data Warehouses for some of the largest academic organizations in the country. We can help your team confirm that data is being extracted to the EDW properly, that it is in sync between tables, and that individual elements are usable for a reporting.
Subscription Engagement
Give your entire organization access to Prominence’s 36+ governed, self-service analytics Accelerators with an Enterprise Subscription, or solve a targeted need with subscription to just a few. Prominence’s Accelerator subscriptions come with everything you need to manage your organization’s growing demand for data. Everything from setup, configuration, and ongoing support and optimization are included in the low, monthly fee. With over $400 MM in documented ROI, 2 HIMSS Davies awards, and 2 Truven awards attributed to our Accelerators, there’s a use case and ROI for solving each of your data challenges.
This tool provides automatic daily extractions of data to ensure your analytics tools are using the most up-to-date data that is available. It automatically detects where incremental dataextraction is available and in what format tocomplete this extraction, saving time and increasing system performance. Using the Extract Console creates a clear picture of what data is being extracted across all of your data sources, allowing for easy data extraction management.
Extraction Console

Copyright © 2019 Prominence Advisors, Inc. All rights reserved. 5
EXECUTIVE
Executive SpotlightThe Executive Spotlight delivers unparalleled views of your organization’s health, driving important decisions with up-to-date reporting.
This application gives high level, trending overviews of volumes, clinical performance, and rev cycle management with additional drill down capabilities. For example, see how high-occupancy rates and Case Mix Index relate or view the relationship between Emergency Department volumes and admissions.
Give your executives the metrics they need to make the biggest improvements for your patients and providers.
Comprehensive breakdown of professional charges, facility charges and reimbursements with the ability to display by payer.
Track the health of your organization with utilization and clinical performance metrics
Overviews of critical points of access including ED throughput and Admission volumes

Copyright © 2019 Prominence Advisors, Inc. All rights reserved. 6
EXECUTIVE
PopulationHealthProminence’s Population Health accelerator brings together all of the key data needed to track, monitor and connect with your patient population.
By integrating EHR and payer data, you’ll have a comprehensive view of the patient’s care, regardless of where they were seen.
Key statistics, such as Not Seen in the Last Year/365 Days, PMPM, Risk Factors, location-based findings, Care Gaps and more; broken down by key dimensions like membership, class, practice, and business unit.
You’ll be empowered with a worklist of actions you can take to improve the outcomes of your population and allocate your resources to best meet their needs.
Investigate successful locations to understand best practices to expand across your organization
Combined data from your EHR and payers for a comprehensive picture of your population
Ensure your patients are getting the care they need, when they need, how they need it

Copyright © 2019 Prominence Advisors, Inc. All rights reserved. 7
EXECUTIVE
ReadmissionsTracking the number of patients who experience unplanned readmissions to a hospital after a previous hospital stay is a category of data used to judge the quality of hospital care. Depending on the reporting source, readmissions are defined as any admission to the same hospital occurring within a certain number of days after discharge from the initial visit. The Centers for Medicare & Medicaid Services (CMS) defines hospital readmission as patient admission to a hospital within 30 days after being discharged from an earlier hospital stay. Rates at the 80th percentile or lower are considered optimal by CMS.
Our Readmissions application allows you to easily analyze common causes for readmission using the industry standard CMS definitions. You can use this application to initiate quality improvement efforts to focus on the care of your hospital patients whilein the hospital as well as improvement efforts focused on effective and safe discharge plans. Good discharge plans can help reduce the rate of unplanned readmissions by giving patients the care instructions they need after a hospital stay and by helping patients recognize symptoms that may require immediate medical attention.
Drill down by common cohorts, payer, unit, provider, and more
Investigate top readmitting units and providers to determine strategies for decreasing readmissions
Review the number and rate ofreadmissions

Copyright © 2019 Prominence Advisors, Inc. All rights reserved. 8
EXECUTIVE
PatientDemographicsUnderstanding details of the patients that make up the populations under your care is critical to successful population health management.Prominence’s patient demographics application puts all of that information at your finger tips so you can easily understand key demographic characteristics of your patients.
You can also layer in socioeconomic data, such as crime rates, commute times, obesity rates, and more, to further your understanding of your patient populations.
View the demographic make-up of thepatients attributed to your ACO.
Identify key population characteristics against locations, financial data, and geographies
Combine claims data from multiplepayers and integrate with data frommultiple EHRs.

Copyright © 2019 Prominence Advisors, Inc. All rights reserved. 9
EXECUTIVE
PatientExperiencePatient experience metrics impact both your organization’s reputation in the community, as well as your organization’s value-based purchasing score and Medicare payments. Prominence’s Patient Experience application empowers you to get the most out of your HCAHPS, CGCAHPS and Press Ganey survey data.
Improve patient care and service by monitoring key metrics that evaluate patient experience. Analyze organizational, departmental and provider-level performance on key patient experience survey measures and drill down to the performance of individual departments and providers for comparison on how they perform against their peers and national benchmarks.
With the ability to incorporate a daily feed of survey and rank data, you’ll have the latest information available to evaluate the patient experience, track your progress to improve care and service, and identify areas of excellence and opportunities for improvement across the organization.
Understand patient experience over time by viewing responses by Survey Date or Encounter Date
Benchmark against organizational or regulatory goals, and compare individual departments and providers
Analyze daily views of Press Ganey Domain Top-Box and ranking scores
Copyright © 2019 Prominence Advisors, Inc. All rights reserved. 10
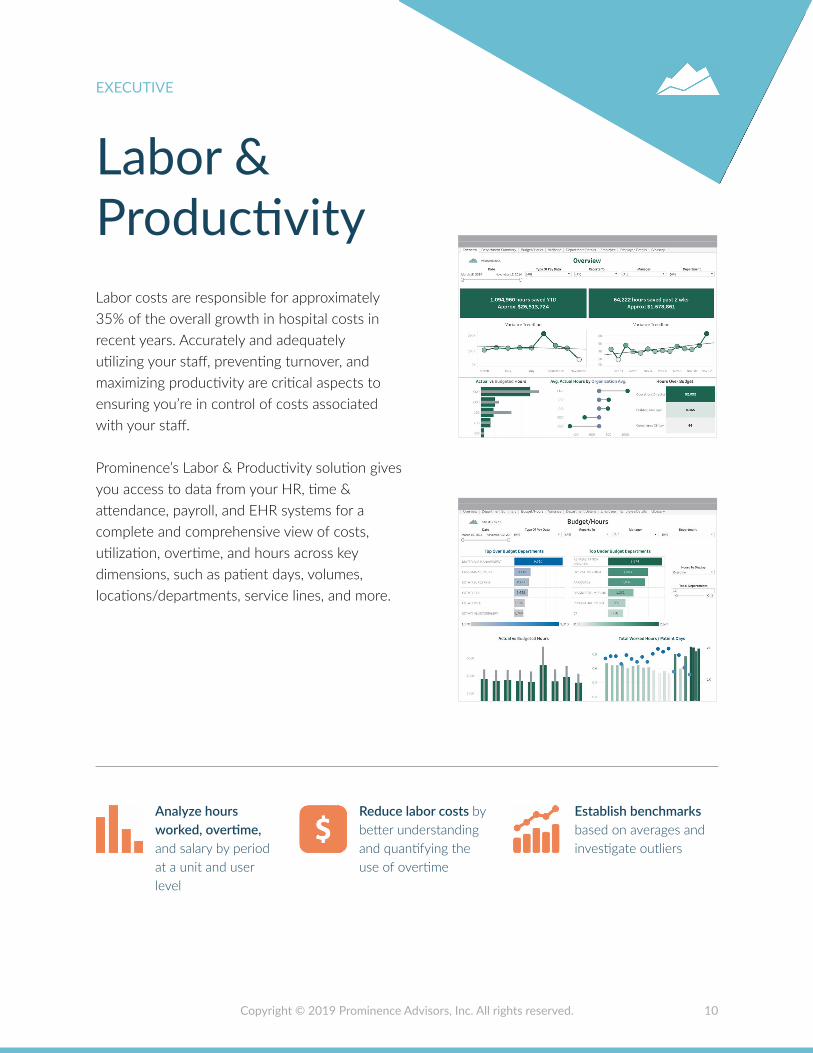
EXECUTIVE
Labor &ProductivityLabor costs are responsible for approximately 35% of the overall growth in hospital costs in recent years. Accurately and adequately utilizing your staff, preventing turnover, and maximizing productivity are critical aspects to ensuring you’re in control of costs associated with your staff.
Prominence’s Labor & Productivity solution gives you access to data from your HR, time & attendance, payroll, and EHR systems for a complete and comprehensive view of costs, utilization, overtime, and hours across key dimensions, such as patient days, volumes, locations/departments, service lines, and more.
Reduce labor costs by better understanding and quantifying the use of overtime
Establish benchmarks based on averages and investigate outliers
Analyze hours worked, overtime, and salary by period at a unit and user level

Copyright © 2019 Prominence Advisors, Inc. All rights reserved.
ACCESS & REVENUE
11
Payer PerformancePayer Performance is an executive-level dashboard for monitoring the health of your payer relationships and enables you to track your ability to provide proactive, preventative care to your patients.
By seamlessly combining data from your payers’ claim files, EHR, and other data sources, it allows you to review trends and performance against targets on key metrics for per-member-per-month, utilization, and quality.
Take action on insights provided to close outstanding care gaps and improve patient outcomes.
Understand performance against per-member-per-month targets within your shared-savings agreements.
Single source of truth for payer performance metrics

Copyright © 2019 Prominence Advisors, Inc. All rights reserved.
ACCESS & REVENUE
12
Professional & Hospital Revenue Cycle ManagementRevenue Cycle Performance, tailored to Professional, Hospital or combined settings, is an advanced analytical tool that allows revenue cycle leaders and financial analysts to quickly identify trends and bottlenecks within their revenue cycle, enabling them to understand and address the root causes of performance issues.
By providing timely access to key performance metrics as soon as new data becomes available, trending over time, and alerts to your inbox, decision makers can shift from taking a retrospective analysis of performance to a proactive approach towards managing AR before potential issues have a chance to affect your cash flow.
In an ever increasingly complex reimbursement landscape, having the right information at your fingertips will give you the foundation needed to drive change and succeed in today’s healthcare environment and set you up for success in the future.
Drill down capabilities to financial class, payor, location, department, provider, and procedure code level for root cause analysis.
Built in comparisons highlight variances from performance targets.
Single source of truth for revenue cycle metrics.
Metrics include charge and collection trends, claims, accounts receivable, and denials management.

Copyright © 2019 Prominence Advisors, Inc. All rights reserved.
ACCESS & REVENUE
13
MedicalEconomicsThe Medical Economics Application is a strategic hub where reimbursement, per-member-per-month, and other key metrics can be synthesized and analyzed. It allows executives to detect trend variations and recognize real opportunities by identifying metrics that are contributing to the success or poor performance of cost and utilization KPIs. It also provides an initial diagnosis of performance causation; allowing you to put together a strategic plan before diving into details.
Search and filter by any dimension, allowing unmatched interactivity and individual data discovery. Discover relationships in performance that you couldn’t find anywhere else.
Review cost and utilization KPI indicators over time for the largest cost categories including Inpatient, Outpatient, Pharmacy and Physician.
Trend your data, by payer and over time to ensure your payments are equal to costs.
Analyze key metrics quickly includingPMPM, Medical Los Ratio, Cost perAdmission and IBNR.

Copyright © 2019 Prominence Advisors, Inc. All rights reserved.
ACCESS & REVENUE
14
General Ledger AnalyzerGeneral Ledger Analyzer is an advanced analytical tool that provides a comprehensive view into your general ledger data, including actual trends against budgets, contribution margins, expense reports, and more. By allowing you to quickly summarize and investigate variances within your general ledger, decision-makers and analysts will have the information to take action as needed to improve financial performance.
Build expense reports on the fly to distribute across the organization.
Understand variances in cost center performance.
Reduce the time needed to compile Income Statements, Balance Sheets, and financial reports.

Copyright © 2019 Prominence Advisors, Inc. All rights reserved.
ACCESS & REVENUE
15
BundledPaymentsThe CMS Bundled Payments for Care Improvement initiative strives to reduce fragmentation across the continuum of care and improve overall quality by aligning incentives between all providers involved in an episode of care.
Prominence’s Bundled Payments Application helps organizations manage their performance by combining information from claims, EMRs, Care Management Documentation System, and Patient Satisfaction Surveys.
Our application will provide all the information needed to evaluate cost and quality variation associated with the care delivery for patients, and help you prioritize areas of focus for better coordination of care, which will result in better care, smarter spending, and a healthier patient population.
Analyze episodes cost and practice patterns across all providers to develop strategies to improve quality while reducing costs
By aggregating and acting on data, participants in previous BPCI programs “generated average savings of $2,300 per episode, a 21% reduction in readmission rates and a 30% reduction in post-acute costs” https://www.becker-shospitalreview.com/hospital-manage-ment-administration/why-you-should-apply-for-bpci-advanced-now.html

Copyright © 2019 Prominence Advisors, Inc. All rights reserved.
ACCESS & REVENUE
16
DenialsIn the US, the average claim denial rate across the healthcare industry is between 5 and 10 percent. For large health systems, this can equate to millions of dollars per year of claims denied upon initial submission. In turn, your organization must investadditional time and money to research and resubmit claims in an attempt to collect, making an already-costly situation that much more expensive. Establishing an effective claims denial management process is critical not only to following up on claims already denied, but also to understanding the causes for denials and eliminating the gaps that previously resulted in preventable denials.
With Prominence’s Denials application, you can monitor your organization’s denials volumes over time, and quickly identify variances which merit further review. You can also view a snapshot of the types of denials that you’re most frequently receiving and analyze your denials by payor. The application allows you to identify preventable denials so that you can focus on correcting upstream errors and reducing future denials.
Compare amount paid versus amount denied, and visualize across payors, reason codes, or denial types
Analyze preventable denial types by denial amount and rate, so you can address the sources of errors before they result in denials
Monitor denials trends over time, and view the reason codes and service lines with the highest denial rates

Copyright © 2019 Prominence Advisors, Inc. All rights reserved.
ACCESS & REVENUE
17
ReferralsGain an understanding of your organization’s In System and Out of System referrals in a single application. Prominence’s Referrals application illustrates where your organization is experiencing leakage, missing out on potential revenue, and successfully converting your referrals to new patients. This application drills down to the specialty and provider level to better understand the referral habits of your individual providers, in order to reduce leakage and increase revenue.
Identify Sources of Lost Revenue by provider or by referred specialty to isolate the greatest ROI for new initiatives to reduce leakage.
Understand New Patient Behavior from the referral to scheduling to capitalize on new opportunities coming to your organization.
Compare Leakage Rates by provider or by referred specialty to better target areas that need improvement.

Copyright © 2019 Prominence Advisors, Inc. All rights reserved.
CLINICAL
18
Surgical ServicesThe operating room is often the lifeblood of the hospital, generating 70% or more of the revenue for health systems. The ability to accurately deliver information to managers and leaders in a timely manner within this environment is critical as competition increases and margins decrease.
Prominence’s Surgical Services application combines data from your source systems (EHR, materials management, anesthesia, etc.) to give you a governed and complete picture of your operations and outcomes. This includes automatically serving up recommendations for improving utilization, lowering costs, and improving outcomes.
By providing high-level KPIs, trending over time, and notifications/alerts to your inbox, the Prominence Surgical Services application ensures you’re acting efficiently on your data. Additionally, the application provides row-level detail behind all of those numbers to ensure you understand exactly why and how you should be acting.
Organizations make same day decisions based on comprehensive, governed information
One FTE in time savings is realized, on average, and millions of dollars are saved by controlling costs and improving utilization
Prominence customers see a drastic reduction in basic data requests, with some organizations seeing zero ad hoc requests

Copyright © 2019 Prominence Advisors, Inc. All rights reserved.
CLINICAL
19
Sepsis IndicatorsSepsis is a leading cause of death and readmissions for inpatient hospitals. The CDC reports that although the overall inpatient hospital death rate decreased from 2000 to 2010, the rate of mortality increased by 17% for patients with a primary diagnosis of Sepsis. Rapid identification and treatment is critical to patient outcomes; a patient’s risk of mortality increases up to 8% for every hour treatment is delayed.
Prominence’s Sepsis Indicators Application allows you to track compliance with Sepsis Care Protocols, as well as key outcome measures such as Mortality, Readmissions and Length of Stay.
Analyze time to Care Protocols along with patient outcomes to identify successful best practices and opportunities for improvement.
Validate early recognition of Sepsis patients by using clinical criteria to flag indictors of SIRS, Sepsis, Severe Sepsis and Septic Shock.
Track the time to Care Protocols individually, such as the Time to Antibiotic Order and Administration, and as bundles with 3-hour and 6-hour Bundle Compliance.

Copyright © 2019 Prominence Advisors, Inc. All rights reserved.
CLINICAL
20
EmergencyMedicineThe ED is one of the busiest places in any healthcare organization. With more than 130,000,000 ED visits in the US annually, understanding throughput, admissions, LWOT/LWOBS, test/order utilization, discharges, and dispositions are critical to managing your ED.
Prominence’s Emergency Medicine solution captures these critical measures and key contextual information, as well, to provide you a one-stop-shop for managing your EDs across the organization, individual locations, and down to individual providers.
Analyze ACEP performance indicators for your facility alongside your organization’s prioritized performancemeasures
Review quality indicators for trauma, cardiac, stroke and order and results statistics to identify areas for focused improvement
Accurately assess and improve the performance of your ED with access to key statistics and metrics such as LOS, throughput and response times

Copyright © 2019 Prominence Advisors, Inc. All rights reserved.
CLINICAL
21
NursingScorecardA 1996 study found that “nursing is a critical factor in determining the quality of care in hospitals and the nature of patient outcomes,” and the same is still true today. Navigating the measurement and trending of these important factors can be a challenge. Prominence’s Nurse Scorecard allows you a view into your organization’s performance of both process and outcome measures impacted by your nursing staff.
With the ability to view performance at a high-level across your organization, or drill down to the department, nurse or individual encounter, you can track adherence over time as well as identify high performers and opportunities for improvement.
Compare performance for each measure between departments and nurses
Investigate variances at the patient encounter level to understand and initial workflow initiatives
View scorecards by measurement area, such as Restraint compliance, for a department or individual nurse

Copyright © 2019 Prominence Advisors, Inc. All rights reserved.
CLINICAL
22
PhysicianScorecardGet a snapshot of physician performance metrics for your organization in a single application. Prominence’s Physician Scorecard application combines performance metrics from Core Measures to Patient Experience to give you a holistic view of your physician groups and individual providers. The application also allows you to drill down as far as the encounter level, so you are equipped to investigate and take action on positive or negative trends.
The application also supports regulatory reporting, such as OPPE and FPPE.
Investigate variances at the patient encounter level to understand andinitial workflow initiatives
Provide physicians with an individual scorecard which tracks their performance over time and benchmarks against organizational goals
Compare performance by specialty or by individual physician to identify high performing practices and opportunities for improvement

Copyright © 2019 Prominence Advisors, Inc. All rights reserved.
CLINICAL
23
Imaging &RadiologyProminence’s Imaging and Radiology solution aggregates all of your key performance indicators into a single, cohesive application. Understand the performance of your organization on a department, specialty, or provider level to find areas to improve and high-performers across metrics such as RVU productivity, WLUs (workload units), volumes and turn-around times for each step in the exam process.
In addition to monitoring performance indicators, end users can create custom, on-demand reports and even search through text entered by providers. This ensures that your data consumers are never at a loss to find what they need; at the time they need it.
Compare providers, specialties anddepartments to focus improvement efforts.
Create Custom Reports and analyze free-text to find additional insights inyour data.
View performance across your KPIs,such as RVUs, WVUs, turnaround timesand many more.

Copyright © 2019 Prominence Advisors, Inc. All rights reserved.
PERFORMANCE & EFFICIENCY
24
MetricManagementYou have many different definitions and don’t have a way to standardize, approve, publish and maintain them across the organization. You want to accelerate the process of defining common terminology by leaning on others with experience.
Prominence’s Metric Management application was designed with these challenges (and more!) in mind.
We source the application with a carefully crafted metric workbook, containing critical definition and metadata detail for each metric contained within a given application.
We support functional workflows for a variety of roles integral to the success of metric sharing and maintenance, including approvers, SMEs, and PMs.
We shed light on potential issues, such as name duplicates, unassigned metrics, or metrics with missing information, and suggest next steps to resolve them.
We make it easy to understand not just the current use but also how best to leverage that metric for future projects.
Share metrics across analytic applications, analytical tools, visualizations and repositories in an easy and concise manner.
Enable collaboration, communication and management of your glossary and its metadata.
Increase transparency of metric ownership and issue resolution.
Accelerate Standardization. Install a glossary in 30 days.

Copyright © 2019 Prominence Advisors, Inc. All rights reserved.
PERFORMANCE & EFFICIENCY
25
ReportingToolboxFeeling overwhelmed by your transition to an enterprise approach to business intelligence and analytics? You’re not alone. In our work with healthcare organizations that are improving consistency and performance of their data and information delivery, we find them facing many challenges. One of the best ways to get a handle on how to proceed is to take stock of what you already have in play. Our Toolbox solution makes it easy to build a more transparent understanding of your BI toolset, enable alignment of the right tool to satisfy a data request, and improve the assessment of your BI gaps.
We gather information from your organization at all levels to accurately discover which analytical, operational, and transactional tools are in use, both localized in departments and organization-wide. By using a decision-tree format for each type of tool, the Toolbox organizes and clarifies the tools at hand and enables your end users to recognize the best solution for their requirement. This understanding also facilitates planning for future tool needs by highlighting the features missing in your current offering.
Investigate the interactive decision treeto differentiate data consumptionoptions.
Identify gaps in your data and businessintelligence strategy throughout yourorganization.
Analyze an all-encompassing view ofthe current tool utilization at your organization and plan for future procurements.

Copyright © 2019 Prominence Advisors, Inc. All rights reserved.
RESEARCH
26
Compliance & Risk ManagementManaging activities on awards, grants and proposals is challenging, working within a complex environment governed by a multitude of policies and regulations.
Prominence’s Compliance & Risk Management Application provides insight into major indicators of financial compliance risk, using metrics that address highly regulated areas, such as sponsored research compliance and costing policies, as well as financial stewardship requirements, such as philanthropic fund management and deficit monitoring.
Our dashboard encourages proactive, comprehensive monitoring of risk and compliance, facilitates decision-making and prompts remediation actions, via an effective and efficient tool that eliminates much of the manual effort needed today.
Highlight areas of risk proactively, before they become a problem, and take steps to ensure awards remain in compliance.
Transition from self-assessment to using data driven analytics with easy to gauge charts and metrics.
Understand organizational level health in key activity areas with the ability to drill down into individual departments and PIs.

Copyright © 2019 Prominence Advisors, Inc. All rights reserved.
RESEARCH
27
De-identified Cohort CreationResearch teams require access to data to identify specific patients for studies, complete grant applications and understand patient populations for future organizational growth and coordinating care. However, organizations are overwhelmed with the volume of report requests delaying these critical research needs.
Prominence’s de-identified cohort application empowers researchers to perform their own cohort analysis across large volumes of historical patient data, regardless of the technical background of the researcher, and without exposing sensitive patient information.
Researchers are able to use a single application to complete cohort selection through intuitive data exploration, visualization and analysis all prior to IRB approval. The expanded access, and the fact that there is almost no learning curve, has saved countless weeks of chart abstraction and cohort development. In one case, over 10 weeks were saved developing a single cohort for research.
The accelerator contains 243 fields, 81 fields de-identified
Investigate, analyze and select patients or encounters based on hundreds of dimensions
De-identified to HIPAA Safe Harborstandards and is accompanied by a re-identificationtool

Copyright © 2019 Prominence Advisors, Inc. All rights reserved.
ACADEMIC
28
Resident & Fellow ManagementOver the past decade, the responsibility of institutions to monitor their resident and fellow performance has grown drastically. Everything from patient satisfaction to clinical experience needs to be tracked and made available for review. Prominence’s Resident and Fellow Scorecard combines health record, patient satisfaction, resident and program data together in a seamless view for instant analysis.
Our Resident and Fellow Scorecard aggregates all of the measures you need to track the performance of your residents and fellows throughout your organization. Providing high quality, data-driven feedback to trainees on their performance, including benchmarking against their peers, all with row-level data to back up the high-level statistics.
Enable residents and fellows to view their own performance, and prevent them from seeing information they shouldn’t.
Quickly leverage and share data required for ACGME reporting with accurate and informed metrics.
Monitor your residents and fellowsthroughout your organization againstKPIs.

Copyright © 2019 Prominence Advisors, Inc. All rights reserved.
ACADEMIC
29
Curriculum DataThe Curriculum Data application provides a comprehensive window into medical education curriculum, allowing for full spectrum views across coursework, targeting specific subject areas and timeframes. You can quickly discover and pinpoint gaps in your curriculum and identify targeted areas for improvement.
The application allows for insight into your education program, answering questions like: “Where in the curriculum do we cover opioid addiction?”, “How much do students learn about domestic violence?”, “When are students exposed to the coursework and is the coursework clustered in certain areas of the curriculum?”
You can use the application to view summary level details of instructional hours and courses in the curriculum, as well as drill down into specific course details to view individual related offerings and course content.
Provides robust Boolean search logic and filtering to isolate target subjects
Empower faculty members with the ability to self-discover curriculum information
Answers questions that facilitate meeting regulatory requirements

Copyright © 2019 Prominence Advisors, Inc. All rights reserved.
QUALITY
30
Quality & Core MeasuresAmong every health system’s goals is to improve patient outcomes. Health systems report out on hundreds of these outcomes annually ranging from mortality, patient safety, readmissions, patient experience, effectiveness of care, timeliness of care to efficiency of imaging and tests. But outcomes improvement can’t happen without effective outcomes measurement.
Use the Prominence Quality & Core Measure Application to track key metrics across your organization on a regular basis to:
• Identify variations of care.• Reveal areas in which process improvement
or interventions could improve care.• Compare the effectiveness of various treatments and procedures across providers
and patients.• Provide evidence about interventions that
work best for certain types of patients under certain circumstances.
Regularly reviewing this information can transform the reporting process from just a tedious reporting process to something that saves your organization money or influences patient’s decision to come to your organization for service.
Bring transparency and accountability to improve outcomes by viewing measures by date, unit and user to further identify and correct workflow and process issues.
Set targets. Meeting and exceeding targets, benefits not only quality of care, but also your organizations’ marketing and contracting efforts.
Pair process and outcome measures to produce change at a provider or unit level. Process measures capture provider productivity and adherence to standards of recommended care.