2019 pharmaceutical market overview | portugal
TRANSCRIPT

2019 Pharmaceutical Market Overview | PortugalHMR Portugal | Consulting Services
March 2020

Copyright © 2020 Health Market Research. All rights reserved. PHARMACEUTICAL MARKET OVERVIEW | PORTUGAL 2019 2
DISCLAIMER
This publication contains general information and therefore, does not constitute professional advice or service provision by HMR - Health Market Research.
This publication has been written in general terms and consequently cannot be relied on to cover specific situations. The application will depend upon the circumstances, and we recommended that you obtain professional advice before acting or refraining from acting on any of the contents of this publication.
No entity in the HMR group shall be responsible for any damages or losses suffered by the results arising from the decision-making based only on this publication.
HMR would be pleased to advise on how to apply the principles set out in this publication to your specific circumstances.
No part of this publication may be reproduced or transmitted in any form without the prior written permission of the HMR.

Copyright © 2020 Health Market Research. All rights reserved. PHARMACEUTICAL MARKET OVERVIEW | PORTUGAL 2019 3
CONTENT
2 PORTUGAL KEY INDICATORS
1 PORTUGAL’S OUTPATIENT MARKET
1.1 PHARMA MARKET
1.2 CONSUMER HEALTHCARE MARKET
3 ABOUT HMR - HEALTH MARKET RESEARCH

Copyright © 2020 Health Market Research. All rights reserved. PHARMACEUTICAL MARKET OVERVIEW | PORTUGAL 2019 4
CONTENT
2 PORTUGAL’S KEY INDICATORS
1 PORTUGAL’S OUTPATIENT MARKET
1.1 PHARMA MARKET
1.2 CONSUMER HEALTHCARE MARKET
3 ABOUT HMR - HEALTH MARKET RESEARCH
Copyright © 2020 Health Market Research. All rights reserved. PHARMACEUTICAL MARKET OVERVIEW | PORTUGAL 2019 5
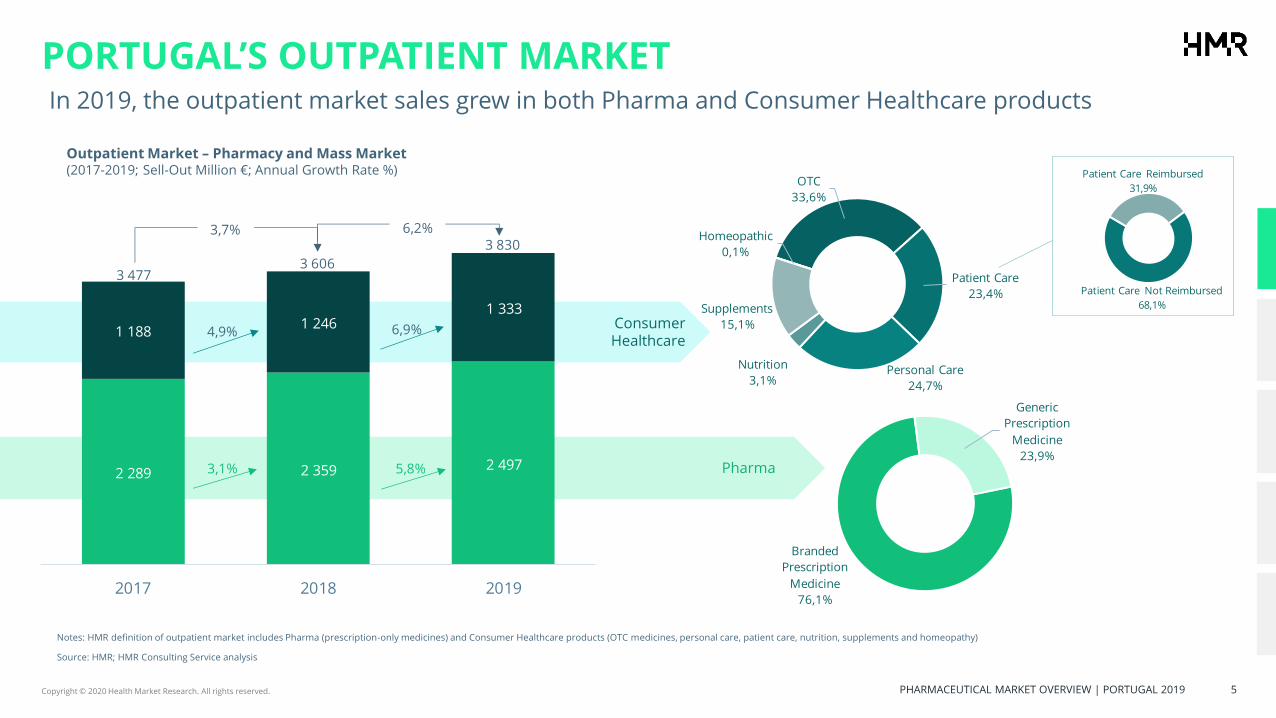
PORTUGAL’S OUTPATIENT MARKET In 2019, the outpatient market sales grew in both Pharma and Consumer Healthcare products
Source: HMR; HMR Consulting Service analysis
Notes: HMR definition of outpatient market includes Pharma (prescription-only medicines) and Consumer Healthcare products (OTC medicines, personal care, patient care, nutrition, supplements and homeopathy)
Pharma
Consumer Healthcare
OTC
33,6%
Patient Care
23,4%
Personal Care
24,7%
Nutrition
3,1%
Supplements
15,1%
Homeopathic
0,1%
Branded
Prescription
Medicine
76,1%
Generic
Prescription
Medicine
23,9%
Patient Care Not Reimbursed
68,1%
Patient Care Reimbursed
31,9%
OTC
Patient Care
Personal Care
Nutrition
Supplements
Homeopathic
6,9%4,9%
3 606 3 477
3 830 6,2%3,7%
2 289 2 359 2 497
1 1881 246
1 333
2017 2018 2019
5,8%3,1%
Outpatient Market – Pharmacy and Mass Market(2017-2019; Sell-Out Million €; Annual Growth Rate %)

Copyright © 2020 Health Market Research. All rights reserved. PHARMACEUTICAL MARKET OVERVIEW | PORTUGAL 2019 6
CONTENT
2 PORTUGAL’S KEY INDICATORS
1 PORTUGAL’S OUTPATIENT MARKET
1.1 PHARMA MARKET
1.2 CONSUMER HEALTHCARE MARKET
3 ABOUT HMR - HEALTH MARKET RESEARCH

Copyright © 2020 Health Market Research. All rights reserved. PHARMACEUTICAL MARKET OVERVIEW | PORTUGAL 2019 7
PHARMA MARKET | EVOLUTION
The Pharma market (prescription medicines) grew in terms of volume and value during the last year, driven by the growth in both groups, accompanied by the increased market share of generic medicines
Source: HMR; HMR Consulting Service analysis
• The growth observed between 2018 and 2019 is based on the increase in the value of generic (€29M) and branded medicines (€108M).
• Regarding new medicines, the biggest growth was in the B01 ATC class (14,3%) and A10 (12,4%), corresponding to €27,4M and €38,7M, respectively. Regarding generics, the must significant growth was in C10 class (€5,6M) and N10 (€5,3M).
• Since 2017, there has been a gradual increase in the generic market share of prescription medicines (with and without reimbursement), explained by the increasing pace at which these medicines enter the market as well as the government’s saving policies.
• Compared with 2018, there is an increase of the number of antidiabetics, analgesics and active agent in renin-angiotensin sold (A10, N02 and C09 ATC classes);
• The growth observed in medicine classes used to treat conditions like diabetes, pain and cardiovascular diseases is in line with the prevalence of these chronic diseases in Portugal.
Notes: Generic market share includes reimbursed and non-reimbursed medicines; A10 - Drugs used in diabetes; B01 - Antithrombotic agents; C09 - Active agents in the renin-angiotensin system; C10 -Lipid modifying agents; N02 – Analgesics; N06 - Psychoanalytic agents excluding anti-obesity preparations.
Pharma Market ¹(2017-2019; Sell-Out Million €; Annual Growth Rate %)
Pharma Market ¹(2017-2019; Sell-Out Million Units; Annual Growth Rate %)
Pharma Market ²(2017-2019; Generic Market Share % Counting Units)
2 2892 359
2 497
3,1%
5,8%
- 10, 0%
- 8, 0%
- 6, 0%
- 4, 0%
- 2, 0%
0,0%
2,0%
4,0%
6,0%
2017 2018 2019
2 150
2 200
2 250
2 300
2 350
2 400
2 450
2 500
2 550
Sell-Out Million € Annual Growth Rate
210
214
220
2,0%2,9%
- 10, 0%
- 8, 0%
- 6, 0%
- 4, 0%
- 2, 0%
0,0%
2,0%
2017 2018 2019
204
206
208
210
212
214
216
218
220
222
Sell-Out Million Units Annual Growth Rate
41,9%
42,6%
43,0%
2017 2018 2019
41,2%
41,4%
41,6%
41,8%
42,0%
42,2%
42,4%
42,6%
42,8%
43,0%
43,2%

Copyright © 2020 Health Market Research. All rights reserved. PHARMACEUTICAL MARKET OVERVIEW | PORTUGAL 2019 8
PHARMA MARKET | REGULATORY CHANGESThe main regulatory modifications applicable to the outpatient market are related to changes in reimbursement and shifting consumption patterns
Source: Infarmed; HMR Consulting Service analysis
Notes: DL – Decree Law; L – Law; P – Ordinance;
Report from EU commission |Competition Enforcement in the Pharmaceutical Sector
(2009-2017). It provides an overview of how the Commission and the national competition
authorities of the 28 Member States have enforced EU antitrust and merger rules in the
pharmaceutical sector.
JAN FEB MAR APR MAY JUN JUL AUG SEP OCT NOV DEC
DL 8/2019Regulates the use of
cannabis for medicinal purposes
Deliberation 1315/2019 | Deliberation of
INFARMED's, I. P., which approves the regulation
to manage the availability of the medicine,
guaranteeing citizens' access to the medicines
they need.
DL 110/2018 | Proceed to the 4th amendment to
P 224/2015, that establishes the legal regime to which the
rules for the prescription and dispensing of
medicines and health products obey and
defines the information obligations to be
provided to users.
P 296/2019 | Establishes the exceptional regime of
reimbursement specifically intended for children with
allergies to cow's milk proteins.
L 199/2019 | Aims to guarantee compliance with Regulation 536/2014 of the Parliament and of the European Council, which changes the paradigm of authorization requests, for conducting clinical trials of medicines for human use in the EU.
European regulation| EU adopts measures in support of generic pharmaceuticals producers. The
Council adopted a regulation which introduces an exception to the
protection granted to an original medicine by a supplementary protection certificate (SPC) for
export purposes and/or for stockpiling.
New procedure makes it possible for marketing authorization holders to submit
a request for initial evaluation proposal (PICO- Population, Intervention,
Comparator and Outcome) to finance drugs that constitute an innovation in the
phase before granting the marketing authorization.
Circular Form 020/CD/100.20.200 |The implementation of state-of-the-art equipment
and devices that comply with the highest levels of quality and security.
DL 4703/2018 | Exceptional 100% co-payment scheme on PSP, applicable to the price of medicines for victims of forest
fires.
Exceptional co-payment Regulation
Establishes the reimbursement system regarding medicines to
respiratory disorders, neurologic, and alimentary
sequelae cause from prematurity.
DL 112/2019 | Twelfth amendment of DL.
176/2006 that changes the legal regime for medicines
for human use.
Milestone |40Th Anniversary of the National Health Service.

Copyright © 2020 Health Market Research. All rights reserved. PHARMACEUTICAL MARKET OVERVIEW | PORTUGAL 2019 9
PHARMA MARKET | NEW BRANDED MEDICINESNew medicine launched in the market between 2018 and 2019 accounted for €21M in 2019 -11 molecules of 6 ATC classes were responsible for 83% of the value
Source: HMR; HMR Consulting Service analysis
• There is a high concentration in the market for new medicines in 6 ATC classes (11 new INN), corresponding to 83,0% of the total value generated in 2019.
• The present analysis considered the new medicines launched in 2019 and the medicines launched in 2018 with high growth in 2019 and the consequent impact on market dynamics;
• In the area of diabetes, the entry of five new molecules – inhibitors of the sodium and glucose symporter and human insulins – generated a €5,7M (sell-out value);
• The launch of one new combination of statins generated €4,5M (sell-out value).
Notes: ATC – Anatomic, Therapeutic and Chemical; A10P – Na/Glu symporter inhibitor (SGLT2) antidiabetics; A10C - Human insulins and analogues; C10C - Associations between lipid regulators; C09D - Angiotensin-II antagonists associations ; N04A – Anti-parkinsonic drugs; R03L - Anticholinergics and B2-agonists associations;
C10C
23,1%1 INN
A10P
19,6%4 INN
N04A
11,3%2 INN
C09D
10,9%2 INNA10C
10,4%1 INN
R03L
7,6%1 INN
Others
17,0%31 INN
New Branded Medicines(2019; Sell-Out Million €)
€21,0 M39 new medicinesin 30 ATC classes
New Branded Medicines(2018-2019; Sell-Out Thousand Units)
C10C
A10P
N04A
C09D
A10C
R03L
A10P C09D
C10C
N04A A10C R03L
NEW BRANDED MEDICINE LAUNCH
C10C
A10P
N04A
C09D
A10CR03L
Jan Feb Mar Apr May Jun Jul Aug Sep Oct Nov Dec Jan Feb Mar Apr May Jun Jul Aug Sep Oct Nov Dec
2018 2019
0
10
20
Copyright © 2020 Health Market Research. All rights reserved. PHARMACEUTICAL MARKET OVERVIEW | PORTUGAL 2019 10
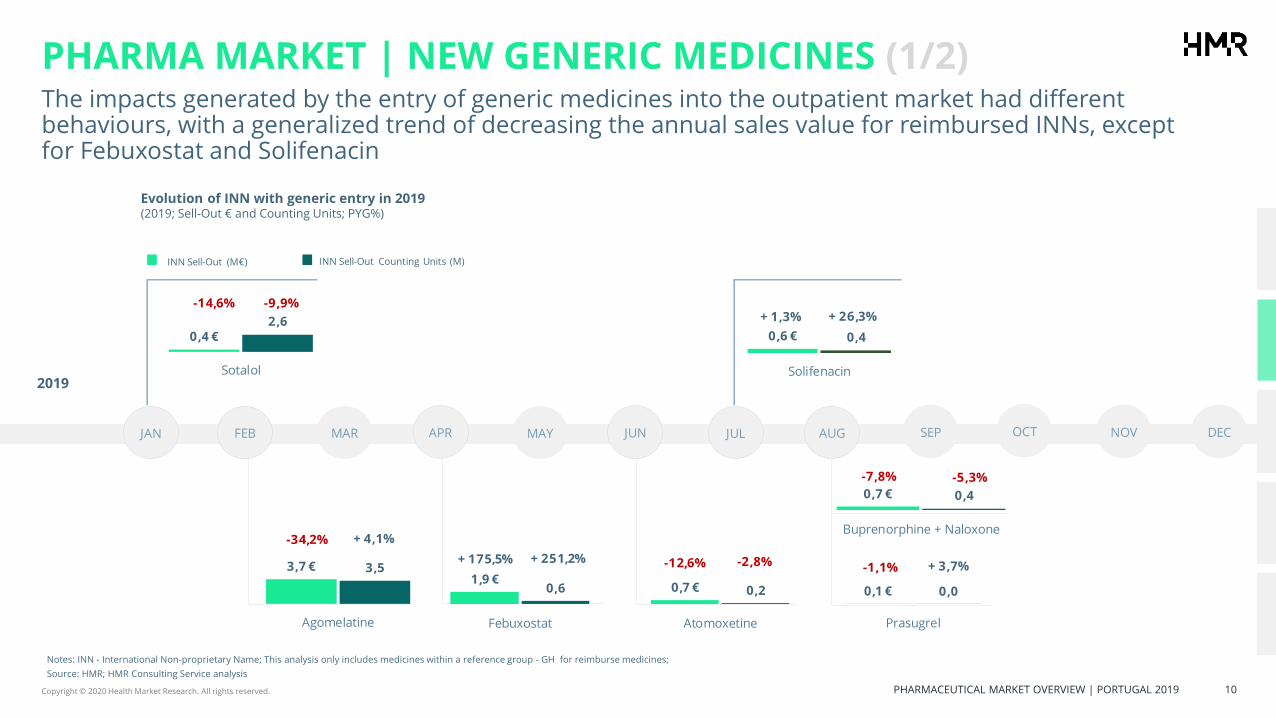
PHARMA MARKET | NEW GENERIC MEDICINES (1/2)The impacts generated by the entry of generic medicines into the outpatient market had different behaviours, with a generalized trend of decreasing the annual sales value for reimbursed INNs, except for Febuxostat and Solifenacin
27,6€
Source: HMR; HMR Consulting Service analysis
Notes: INN - International Non-proprietary Name; This analysis only includes medicines within a reference group - GH for reimburse medicines;
Prasugrel
Sotalol
0
0
0
0
0
0
0
0
0
0,6 € 0,4
Solifenacin
- 0,2 €
4,8 €
9,8 €
14,8 €
19,8 €
0,1 € 0,0
Prasugrel
- 0,2 €
4,8 €
9,8 €
14,8 €
19,8 €
0,7 € 0,4
Buprenorphine + Naloxone
- 0,2 €
4,8 €
9,8 €
14,8 €
19,8 €
0,7 € 0,2
Atomoxetine
- 0,2 €
4,8 €
9,8 €
14,8 €
19,8 €
1,9 €0,6
Febuxostat
- 0,2 €
4,8 €
9,8 €
14,8 €
19,8 €
3,7 € 3,5
Agomelatine
- 0,2 €
4,8 €
9,8 €
14,8 €
19,8 €
INN Sell-Out (M€) INN Sell-Out Counting Units (M)
-14,6% -9,9%+ 1,3% + 26,3%
-34,2% + 4,1%
+ 175,5% + 251,2% -12,6% -2,8% -1,1% + 3,7%
-7,8% -5,3%
0,4 €2,6
Sotalol
- 0,2 €
4,8 €
9,8 €
14,8 €
19,8 €
JAN FEB MAR APR MAY JUN JUL AUG SEP OCT NOV DEC
2019
Evolution of INN with generic entry in 2019(2019; Sell-Out € and Counting Units; PYG%)

Copyright © 2020 Health Market Research. All rights reserved. PHARMACEUTICAL MARKET OVERVIEW | PORTUGAL 2019 11
PHARMA MARKET | NEW GENERIC MEDICINES (2/2)Simvastatin + Ezetimibe and Atomoxetine generics had the highest penetration rate, reaching a market share of around 52% in sell-out counting units, due to the practiced price, which reduced by 40% the average sales price
Source: HMR; HMR Consulting Service analysis
• Atomoxetine, Simvastatin + Ezetimibe and Agomelatine - a high generic penetration was achieved. Generic medicines in INN Agomelatine faced supply issues.
• Febuxostat - The generic medicines entry occurred 15 months after the branded medicine’s launch and both present high growth rates.
• In the first four months following the Sotalol generic entry (1 generic medicine), the branded name medicine faced supply issues, which lead the generic medicine to 90% of market share;
• After the first four months, the generic medicine faced supply issues and holds presently 9% of market share.
• In 2018, Simvastatin + Ezetimibe reference group was suspended, leading to the generic market share regression.
• In 2019, the generic medicines market share surpassed 60%, levered and lowered the average value per package by 40%.
Notes: INN - International Non-proprietary Name; This analysis only includes medicines within a reference group - GH
Generic Market Share (Monthly evolution of generic market share in counting units)
Simvastatin + Ezetimibe(2019; Generic and Branded Market Share in counting units %; Average Price €)
Sotalol(2019; Generic and Branded Market Share in counting units %; Average Price €)
0,7M€
0,7M€
2,8M€
0,1M€
0,4M€
9,9M€
24,8M€
38% 37% 37%
28%31% 31%
34%
7%
39%
49%52% 52%
0 M 1 M 2 M 3 M 4 M 5 M 6 M
Atomoxetine
Agomelatine
Febuxostate
Simvastatin + Ezetimibe
69%55% 52% 48% 44% 44% 41% 40% 39%
31%45% 48% 52% 56% 56% 59% 60% 61%
46,2 € 45,7 € 44,0 €37,3 €
33,4 € 32,3 € 31,0 € 29,6 € 28,9 € 27,9 € 27,2 € 27,1 €
- 60,0 €
- 40,0 €
- 20,0 €
0,0 €
20,0 €
40,0 €
60,0 €
Jan Feb Mar Apr May Jun Jul Aug Sep Oct Nov Dec
0%
20%
40%
60%
80%
100%
120%
140%
160%
Branded MS% in Cunits Generic MS% in Cunits Average Price
74%98% 98% 94% 91% 91% 91% 91% 91%
81% 92% 90%
8,7 € 7,4 € 6,9 € 5,8 €9,2 € 9,3 € 9,2 € 9,2 € 9,2 € 9,2 € 9,2 € 9,2 €
- 60, 0 €
- 50, 0 €
- 40, 0 €
- 30, 0 €
- 20, 0 €
- 10, 0 €
0, 0 €
10, 0 €
20, 0 €
Jan Feb Mar Apr May Jun Jul Aug Sep Oct Nov Dec
0%
20%
40%
60%
80%
100%
120%
140%
160%
Branded MS% in Cunits Generic MS% in Cunits Average Price
Copyright © 2020 Health Market Research. All rights reserved. PHARMACEUTICAL MARKET OVERVIEW | PORTUGAL 2019 12
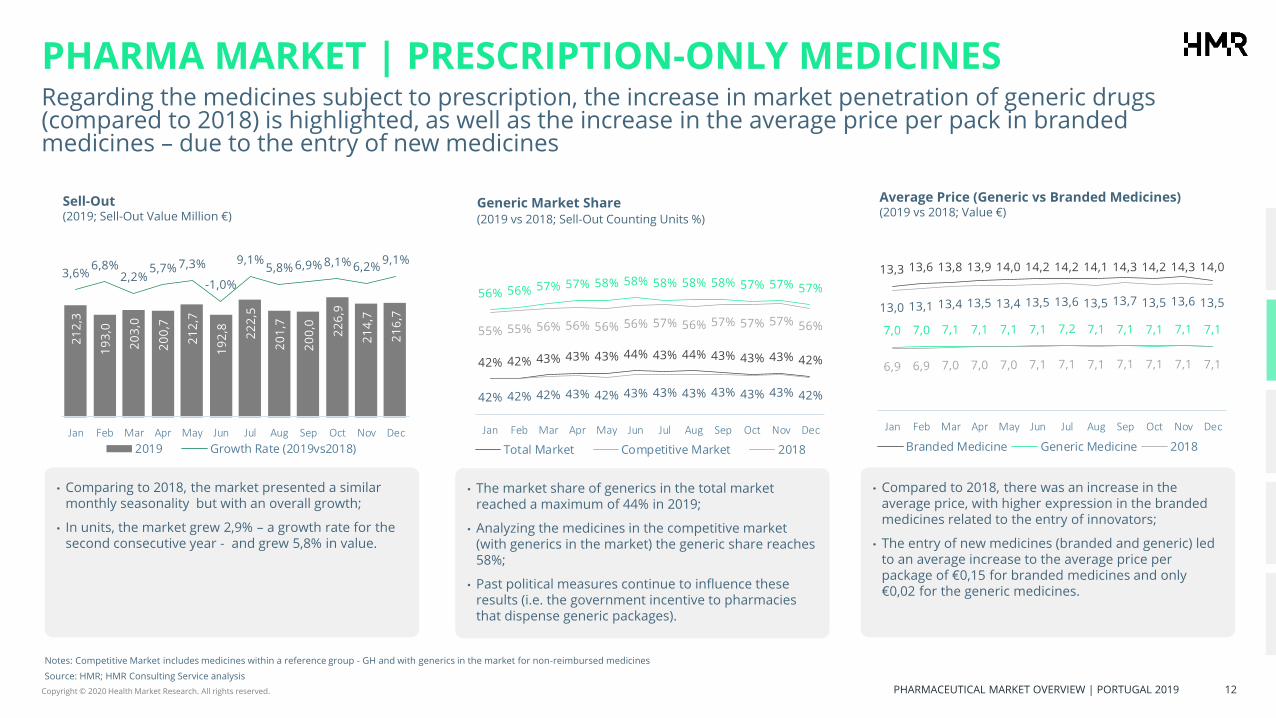
PHARMA MARKET | PRESCRIPTION-ONLY MEDICINESRegarding the medicines subject to prescription, the increase in market penetration of generic drugs (compared to 2018) is highlighted, as well as the increase in the average price per pack in branded medicines – due to the entry of new medicines
Source: HMR; HMR Consulting Service analysis
• Comparing to 2018, the market presented a similar monthly seasonality but with an overall growth;
• In units, the market grew 2,9% – a growth rate for the second consecutive year - and grew 5,8% in value.
• Compared to 2018, there was an increase in the average price, with higher expression in the branded medicines related to the entry of innovators;
• The entry of new medicines (branded and generic) led to an average increase to the average price per package of €0,15 for branded medicines and only €0,02 for the generic medicines.
• The market share of generics in the total market reached a maximum of 44% in 2019;
• Analyzing the medicines in the competitive market (with generics in the market) the generic share reaches 58%;
• Past political measures continue to influence these results (i.e. the government incentive to pharmacies that dispense generic packages).
Notes: Competitive Market includes medicines within a reference group - GH and with generics in the market for non-reimbursed medicines
Sell-Out (2019; Sell-Out Value Million €)
Generic Market Share(2019 vs 2018; Sell-Out Counting Units %)
Average Price (Generic vs Branded Medicines)(2019 vs 2018; Value €)
21
2,3
19
3,0
20
3,0
20
0,7
21
2,7
19
2,8 22
2,5
20
1,7
20
0,0
22
6,9
21
4,7
21
6,7
3,6%6,8%
2,2%5,7% 7,3%
-1,0%
9,1%5,8% 6,9% 8,1% 6,2%
9,1%
- 50, 0%
- 40, 0%
- 30, 0%
- 20, 0%
- 10, 0%
0,0%
10,0%
Jan Feb Mar Apr May Jun Jul Aug Sep Oct Nov Dec- 10, 0
90,0
190,0
2019 Growth Rate (2019vs2018)
42% 42% 43% 43% 43% 44% 43% 44% 43% 43% 43% 42%
42% 42% 42% 43% 42% 43% 43% 43% 43% 43% 43% 42%
56% 56% 57% 57% 58% 58% 58% 58% 58% 57% 57% 57%
55% 55% 56% 56% 56% 56% 57% 56% 57% 57% 57% 56%
Jan Feb Mar Apr May Jun Jul Aug Sep Oct Nov Dec
35,0%
40,0%
45,0%
50,0%
55,0%
60,0%
65,0%
Total Market Competitive Market 2018
13,3 13,6 13,8 13,9 14,0 14,2 14,2 14,1 14,3 14,2 14,3 14,0
13,0 13,1 13,4 13,5 13,4 13,5 13,6 13,5 13,7 13,5 13,6 13,5
7,0 7,0 7,1 7,1 7,1 7,1 7,2 7,1 7,1 7,1 7,1 7,1
6,9 6,9 7,0 7,0 7,0 7,1 7,1 7,1 7,1 7,1 7,1 7,1
Jan Feb Mar Apr May Jun Jul Aug Sep Oct Nov Dec
0,35
2,35
4,35
6,35
8,35
10,35
12,35
14,35
16,35
Branded Medicine Generic Medicine 2018
Copyright © 2020 Health Market Research. All rights reserved. PHARMACEUTICAL MARKET OVERVIEW | PORTUGAL 2019 13
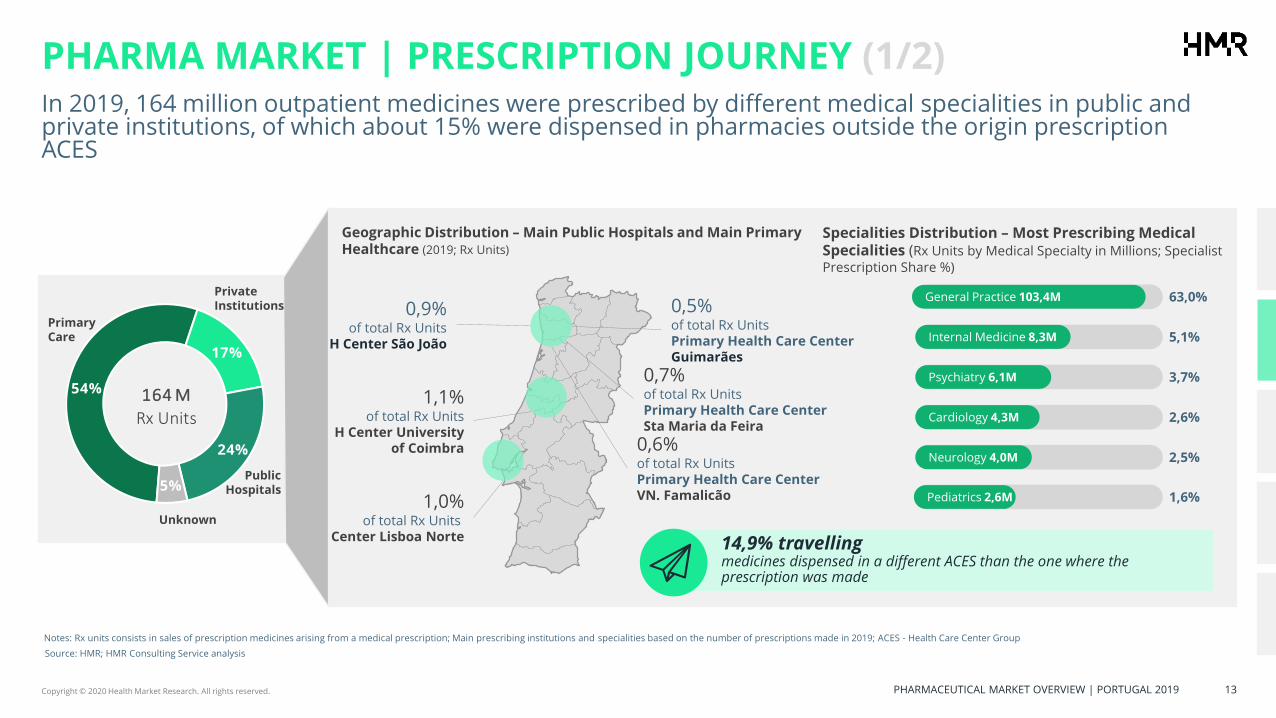
PHARMA MARKET | PRESCRIPTION JOURNEY (1/2)In 2019, 164 million outpatient medicines were prescribed by different medical specialities in public and private institutions, of which about 15% were dispensed in pharmacies outside the origin prescription ACES
1,1%of total Rx Units
H Center University of Coimbra
0,9%of total Rx Units
H Center São João
1,0%of total Rx Units
H Center Lisboa Norte
0,7%of total Rx Units Primary Health Care CenterSta Maria da Feira
0,5%of total Rx Units Primary Health Care Center Guimarães
0,6% of total Rx Units Primary Health Care CenterVN. Famalicão
Geographic Distribution – Main Public Hospitals and Main Primary Healthcare (2019; Rx Units)
Primary Care
Public Hospitals
Private Institutions
Specialities Distribution – Most Prescribing Medical Specialities (Rx Units by Medical Specialty in Millions; Specialist Prescription Share %)
14,9% travellingmedicines dispensed in a different ACES than the one where the prescription was made
General Practice 103,4M
Internal Medicine 8,3M
Psychiatry 6,1M
Cardiology 4,3M
Neurology 4,0M
Pediatrics 2,6M
63,0%
5,1%
3,7%
2,6%
2,5%
1,6%
Notes: Rx units consists in sales of prescription medicines arising from a medical prescription; Main prescribing institutions and specialities based on the number of prescriptions made in 2019; ACES - Health Care Center Group
Unknown
54%
17%
24%
5%
164 M
Rx Units
Source: HMR; HMR Consulting Service analysis

Copyright © 2020 Health Market Research. All rights reserved. PHARMACEUTICAL MARKET OVERVIEW | PORTUGAL 2019 14
PHARMA MARKET | PRESCRIPTION JOURNEY (2/2)
There was an increase in the volume of medical prescriptions as well as significant differences in the weight of generic medicines dispensed according to the origin of the prescription
• There was a growth of 4% corresponding to 6,4M Units in the number of prescription medicines packages between 2018 and 2019;
• The number of Rx Units increased 2,6M in private health institutions, including private practices, private hospitals and private institutions of social solidarity.
• The increase in the average subsidized price for prescription medicines is in line with the market dynamics; it could be noted an increase in the average price across all the prescription sources. The weight of new medicines prescription at hospital level in relation to the proportion of more affordable medicines for the control of chronic conditions and performance indicators related with medicine expenditure in primary care might account for divergence among the prescription sources.
• As for generic medicines, the highest percentage comes from primary care rounding 50% Generic Share;
• Analyzing only the market for which there is a generic medicine (reference group - GH), although there is a significant volume in the dispensing of generic medicines, there is a divergence between primary care facilities and private of 12,0 p.p.
Notes: Unknown Prescription Entity Type excluded
Source: HMR; HMR Consulting Service analysis
Prescription Origin(2018-2019; Rx Units Million)
Generic Market Share(2019; Total Market and Competitive Market; Rx Counting Units %)
Average Price (2018-2019; Value €)
57,3%
25,1%17,7%
56,7%
25,5%17,8%
4,2%7,0% 6,4%
- 20, 0%
- 15, 0%
- 10, 0%
- 5, 0%
0,0%
5,0%
10,0%
Primary Care Private Public Hospital
0,0%
30,0%
60,0%
90,0%
2018 2019 Growth Rate (2019vs2018)
49,4%
37,9% 40,8%
71,8%
59,8%67,7%
Primary Care Private Public Hospital
0,0%
30,0%
60,0%
90,0%
Total Market Competetitive Market
11,6 €
12,5 €
13,9 €
11,8 €
12,7 €
14,3 €
Primary Care Private Public Hospital
8,0 €
8,3 €
8,6 €
8,9 €
9,2 €
9,5 €
9,8 €
10,1 €
10,4 €
10,7 €
11,0 €
11,3 €
11,6 €
11,9 €
12,2 €
12,5 €
12,8 €
13,1 €
13,4 €
13,7 €
14,0 €
14,3 €
14,6 €
14,9 €
15,2 €
15,5 €
15,8 €
2018 2019

Copyright © 2020 Health Market Research. All rights reserved. PHARMACEUTICAL MARKET OVERVIEW | PORTUGAL 2019 15
CONTENT
2 PORTUGAL’S KEY INDICATORS
1 PORTUGAL’S OUTPATIENT MARKET
1.1 PHARMA MARKET
1.2 CONSUMER HEALTHCARE MARKET
3 ABOUT HMR - HEALTH MARKET RESEARCH

Copyright © 2020 Health Market Research. All rights reserved. PHARMACEUTICAL MARKET OVERVIEW | PORTUGAL 2019 16
CONSUMER HEALTHCARE MARKET (1/2)
The consumption behaviour of Consumer Healthcare products maintains a seasonality similar to the one observed in 2018, highlighting a greater growth in the consumption of these products in both channels, mainly in the Mass Market
Source: HMR; HMR Consulting Service analysis
• Compared to 2018, there was a market growth of 6,9%, corresponding to an increase of €86,3M;
• There is a slight decrease in the relative value of sales in Pharmacy, from 83,9% to 83,5%.
• The Mass Market network (chain stores Sonae, Jerónimo Martins, Auchan and ECI, excluding street parapharmacy) was characterized by an increase of 9,8%, corresponding to approximately €19,5M, compared to 2018;
• Personal care segment represents 43,6% of Mass Market network.
• In the Pharmacy channel, there was a 6,4% growth of the market, corresponding to an increase of €66,8M;
• OTC segment represents 35,7% of Pharmacy network.
Notes: In this analysis, Consumer Healthcare includes OTC medicines, patient care, personal care, supplements ,nutrition and homeopathic segments
Sell-Out - Total(2019; Sell-Out Value Million €; Growth Rate %)
Sell-Out - Pharmacy(2019; Sell-Out Value Million €; Growth Rate %)
Sell-Out - Mass Market(2019; Sell-Out Value Million €; Growth Rate %)
11
6,3
99
,8
10
7,0
10
2,8
11
4,9
10
4,7 12
1,8
11
5,0
10
4,6
11
5,8
10
8,3
12
1,5
9,2% 5,7% 7,2% 8,6% 8,4%0,4%
8,5% 4,0% 7,8% 7,5% 6,3% 9,5%
- 100, 0%
- 80, 0%
- 60, 0%
- 40, 0%
- 20, 0%
0,0%
20,0%
40,0%
jan feb mar apr may jun jul aug sep oct nov dec
,0
100,0
Sell Out € Grow Rate (2019vs2018)
9,6% 6,7% 6,5% 7,1% 8,6%-0,6%
7,6% 2,7% 7,0% 7,0% 5,6% 8,8%
98
,7
84
,8
89
,4
86
,2 96
,4
86
,5
10
1,4
94
,9
87
,4 97
,1
90
,4 99
,6
- 100,0%
- 80, 0%
- 60, 0%
- 40, 0%
- 20, 0%
0,0%
20,0%
40,0%
jan feb mar apr may jun jul aug sep oct nov dec
,0
100,0
Sell Out € Grow Rate (2019vs2018)
17
,7
14
,9 17
,6
16
,6 18
,4
18
,2 20
,4
20
,2
17
,3
18
,7
17
,9 21
,8
7%0%
11% 16%7% 6%
13% 11% 12% 10% 10% 13%
- 100,0%
- 80, 0%
- 60, 0%
- 40, 0%
- 20, 0%
0,0%
20,0%
40,0%
jan feb mar apr may jun jul aug sep oct nov dec
,0
Sell Out € Grow Rate (2019vs2018)

Copyright © 2020 Health Market Research. All rights reserved. PHARMACEUTICAL MARKET OVERVIEW | PORTUGAL 2019 17
Regions Pharmacy Market Share
Lisbon 1 83%
Lisbon 2 82%
Lisbon 3 79%
Oporto 1 83%
Oporto 2 79%
North Coast 1 87%
North Coast 2 83%
Central Coast 80%
Interior 89%
Alentejo and Algarve 82%
Pharmacy Market Share(2019; % of Sell-Out Value)
CONSUMER HEALTHCARE MARKET (2/2)The Pharmacy remained as the preferred network for the Consumer Healthcare market and although it maintains the higher average prices, seasonally there is an approximation of the networks regarding the average sales per point-of-sale
• At national level, the Pharmacy network accounts 83,5% of the Consumer Healthcare market (supplements, nutrition, patient care, personal care and OTC). It represents less 0,4 p.p. than observed in 2018 (SO Values). SO Units analysis shows exactly the opposite trend;
• The outlying areas of the cities of Lisbon and Oporto stand out for Mass Market growing market share.
• It is visible an alignment of the behaviour in the different networks, with a higher volume of average sales in the Pharmacy. In the summer and Christmas periods the Mass Market network leveraged by the increase in sales of personal care and OTC products, respectively;
• It should be noted the high disparity within the Mass Market network, by including physical stores (high volume of sales of personal care products) and medicine cabinet (OTC sales).
• When analyzing the six segments, the Pharmacy network presents a higher average price for the different typologies of products;
• Compared to 2018, the average price in the Pharmacy network increased by 3,5% (corresponding to €0,36) and by 1,0% (around €0,09) in the Mass Market channel.
Source: HMR; HMR Consulting Service analysis
Average Price(2019; Sell-Out Average Price €)
Average Sale per Point-of-Sale(2019; Sell-Out Average Value Thousand €)
10,0 10,4 10,7 10,8 11,1 11,1 11,2 10,8 10,9 10,8 10,8 10,5
8,3 8,4 8,9 8,8 9,4 9,3 9,3 9,0 9,0 8,9 8,6 8,6
jan feb mar apr may jun jul aug sep oct nov dec
0,0
2,0
4,0
6,0
8,0
10,0
12,0
Pharmacy Mass Market
33,929,2 30,7 29,6
33,229,8
34,932,6
30,133,4
31,134,3
26,122,0
26,0 24,226,6 26,3
29,3 28,924,6
26,6 25,3
30,5
jan feb mar apr may jun jul aug sep oct nov dec
0,0
10,0
20,0
30,0
40,0
Pharmacy Mass Market
Copyright © 2020 Health Market Research. All rights reserved. PHARMACEUTICAL MARKET OVERVIEW | PORTUGAL 2019 18
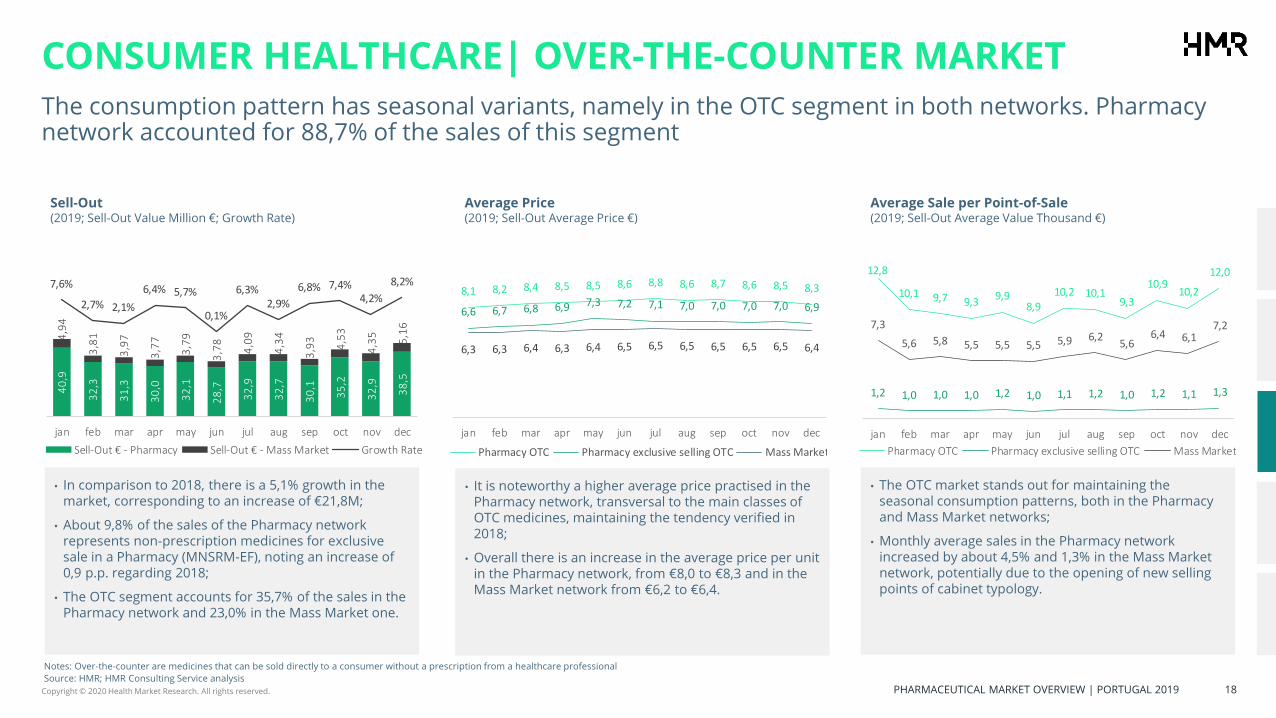
CONSUMER HEALTHCARE| OVER-THE-COUNTER MARKETThe consumption pattern has seasonal variants, namely in the OTC segment in both networks. Pharmacy network accounted for 88,7% of the sales of this segment
• In comparison to 2018, there is a 5,1% growth in the market, corresponding to an increase of €21,8M;
• About 9,8% of the sales of the Pharmacy network represents non-prescription medicines for exclusive sale in a Pharmacy (MNSRM-EF), noting an increase of 0,9 p.p. regarding 2018;
• The OTC segment accounts for 35,7% of the sales in the Pharmacy network and 23,0% in the Mass Market one.
• The OTC market stands out for maintaining the seasonal consumption patterns, both in the Pharmacy and Mass Market networks;
• Monthly average sales in the Pharmacy network increased by about 4,5% and 1,3% in the Mass Market network, potentially due to the opening of new selling points of cabinet typology.
• It is noteworthy a higher average price practised in the Pharmacy network, transversal to the main classes of OTC medicines, maintaining the tendency verified in 2018;
• Overall there is an increase in the average price per unit in the Pharmacy network, from €8,0 to €8,3 and in the Mass Market network from €6,2 to €6,4.
Notes: Over-the-counter are medicines that can be sold directly to a consumer without a prescription from a healthcare professional
Source: HMR; HMR Consulting Service analysis
Sell-Out(2019; Sell-Out Value Million €; Growth Rate)
Average Price(2019; Sell-Out Average Price €)
Average Sale per Point-of-Sale(2019; Sell-Out Average Value Thousand €)
40
,9
32
,3
31
,3
30
,0
32
,1
28
,7
32
,9
32
,7
30
,1
35
,2
32
,9
38
,5
4,9
4
3,8
1
3,9
7
3,7
7
3,7
9
3,7
8
4,0
9
4,3
4
3,9
3
4,5
3
4,3
5
5,1
6
7,6%
2,7% 2,1%
6,4% 5,7%
0,1%
6,3%2,9%
6,8% 7,4%4,2%
8,2%
jan feb mar apr may jun jul aug sep oct nov dec
0,0
10,0
20,0
30,0
40,0
50,0
60,0
70,0
80,0
90,0
100,0
Sell-Out € - Pharmacy Sell-Out € - Mass Market Growth Rate
8,1 8,2 8,4 8,5 8,5 8,6 8,8 8,6 8,7 8,6 8,5 8,3
6,6 6,7 6,8 6,9 7,3 7,2 7,1 7,0 7,0 7,0 7,0 6,9
6,3 6,3 6,4 6,3 6,4 6,5 6,5 6,5 6,5 6,5 6,5 6,4
jan feb mar apr may jun jul aug sep oct nov dec
0,0
2,0
4,0
6,0
8,0
10,0
12,0
Pharmacy OTC Pharmacy exclusive selling OTC Mass Market
12,8
10,1 9,7 9,39,9
8,910,2 10,1
9,3
10,910,2
12,0
1,2 1,0 1,0 1,0 1,2 1,0 1,1 1,2 1,0 1,2 1,1 1,3
7,3
5,6 5,8 5,5 5,5 5,5 5,9 6,25,6
6,4 6,17,2
jan feb mar apr may jun jul aug sep oct nov dec
0,4
2,4
4,4
6,4
8,4
10,4
12,4
14,4
Pharmacy OTC Pharmacy exclusive selling OTC Mass Market

Copyright © 2020 Health Market Research. All rights reserved. PHARMACEUTICAL MARKET OVERVIEW | PORTUGAL 2019 19
CONSUMER HEALTHCARE | PATIENT CARE MARKETAlthough a growth of €24,1M is highlighted in the patient care market, monthly fluctuations in consumption remain in comparison to 2018
• There was an increase of 8,4% of the market, corresponding to an increment of €24,1M, with a growth of 8,1% in the Pharmacy network and 10,7% in the Mass Market network;
• The weight of sales in the Pharmacy network accounted for about 88,6%;
• The patient care segment represents approximately 24,9% of the Pharmacy sales and 16,2% of the Mass Market network.
• The patient care market stands out for the maintenance of seasonal consumption patterns, both in the Pharmacy and Mass Market networks;
• Monthly average sales in the Pharmacy network increased by 8,0%. In the Mass Market network was also observed an increase of 2,0%.
• It is noteworthy a lower average price practised in the Mass Market network, to the main groups of patient care, maintaining the tendency verified in 2018.
Notes: Patient Care segment includes medical and personal devices; Reimbursed medical devices are included in the present analysis
Source: HMR; HMR Consulting Service analysis
Sell-Out(2019; Sell-Out Value Million €; Growth Rate)
Average Price(2019; Sell-Out Average Price €)
Average Sale per Point-of-Sale(2019; Sell-Out Average Value Thousand €)
23
,6
21
,0
22
,2
21
,4
23
,6
21
,4
25
,6
24
,4
22
,4
24
,0
22
,5
24
,7
3,0
2,5 2,8
2,7 2
,8
2,8 3
,2
3,4
3,0 3,1
2,9 3
,4
13,1%10,1%10,9%
8,8% 9,7%
2,9%
8,3%4,0%
8,2% 8,7%5,9%
10,5%
jan feb mar apr may jun jul aug sep oct nov dec
0,0
10,0
20,0
30,0
40,0
50,0
60,0
Sell-Out € - Pharmacy Sell-Out € - Mass Market
10,1 10,0 10,1 10,1 10,2 10,1 10,2 10,0 10,1 10,3 10,5 10,6
6,9 6,8 6,9 6,8 7,0 7,1 7,1 7,0 7,1 7,1 7,2 7,4
jan feb mar apr may jun jul aug sep oct nov dec
0,4
2,4
4,4
6,4
8,4
10,4
12,4
Pharmacy Mass Market
8,17,2
7,6 7,48,1
7,4
8,8 8,47,7
8,37,7
8,5
4,53,7
4,1 3,9 4,0 4,04,5 4,8
4,3 4,4 4,14,8
jan feb mar apr may jun jul aug sep oct nov dec
,0
1,0
2,0
3,0
4,0
5,0
6,0
7,0
8,0
9,0
10,0
Pharmacy Mass Market

Copyright © 2020 Health Market Research. All rights reserved. PHARMACEUTICAL MARKET OVERVIEW | PORTUGAL 2019 20
CONSUMER HEALTHCARE| PATIENT CARE MARKET REIMBURSED
MEDICAL DEVICES
The continuous growth in the market for reimbursable medical devices since 2018 is due to the launch with reimbursement of a new non-invasive interstitial glucose control device in January 2018, accounting for €12,2M in market sales value in 2018 and €21,7M in 2019
Source: HMR; HMR Consulting Service analysis
• There was a growth of 10,8% in sales of reimbursable medical devices, corresponding to an increase of €9,7M compared to 2018; From the annual market value of 2018 (€99,7M), 21,6% corresponds to the new glucose monitoring device in the interstitial liquid, launched in January 2018;
• The medical devices included in the Diabetes Protocol represent 74,8% of the market, followed by the group of Elimination Ostomy Aids, with 16,9%.
• The market has remained stable in the last year, with an annual growth of 6,8%.
• After a period of increase in 2018, the segment has grown 10,8%, corresponding to around €10 M between 2018 and 2019.
Reimbursed Medical Devices Sell-Out(2019; Sell-Out Value Million €; Growth Rate %)
Diabetes Protocol Sell-Out(2019; Sell-Out Value Million €; Growth Rate %)
Elimination Ostomy Aids Sell-Out(2019; Sell-Out Value Million €; Growth Rate %)
8,6
7,6 8,1
8,0 8
,6
7,8
9,2
8,2
7,9 8
,8
8,3 8,6
18%10% 11% 9%
15%6% 10% 11% 9% 11% 7%
13%
- 100, 0%
- 80, 0%
- 60, 0%
- 40, 0%
- 20, 0%
0,0%
20,0%
Jan Feb Mar Apr May Jun Jul Aug Sep Oct Nov Dec
,0
6,4
5,7 6,1
6,1 6,4
5,9 6
,9
6,1
5,9 6
,5
6,2 6,3
26%13% 11% 8% 13% 6% 8% 10% 8% 9% 7% 13%
- 100,0%
- 80, 0%
- 60, 0%
- 40, 0%
- 20, 0%
0,0%
20,0%
40,0%
Jan Feb Mar Apr May Jun Jul Aug Sep Oct Nov Dec
,0
1,4
1,2 1
,3
1,3
1,5
1,3
1,6
1,4
1,4 1
,5
1,4
1,4
-8% -4%7% 10%
20%1%
17% 9% 7% 13%3% 10%
- 150,0%
- 130,0%
- 110,0%
- 90, 0%
- 70, 0%
- 50, 0%
- 30, 0%
- 10, 0%
10,0%
Jan Feb Mar Apr May Jun Jul Aug Sep Oct Nov Dec
,0
,2
,4
,6
,8
1,0
1,2
1,4
1,6
1,8

Copyright © 2020 Health Market Research. All rights reserved. PHARMACEUTICAL MARKET OVERVIEW | PORTUGAL 2019 21
CONSUMER HEALTHCARE | PERSONAL CARE MARKETThe personal care segment stands out for the seasonal oscillation, being responsible for an increment in the summer and end-of-year months, with greater emphasis on the Mass Market groups
• There was a 7,5% increase in the market (€23,0M) with a growth of 6,5% in the Pharmacy network and an increase of 10,2% in the Mass Market network;
• The weight of sales in the Pharmacy network accounted for about 70,8%, with a decrease of 0,7%. compared to 2018;
• The personal care segment represents about 20,9% of the sales of the Pharmacy network and 43,6% of the Mass Market sales.
• The seasonal pattern of consumption of personal care products presents a more significant expansion in the Mass Market network: increase compared to the previous month in the sunscreen from May to August and anti-ageing group and wrinkle for women in March and December;
• Comparing with 2018, there is an increase in the average value by point-of-sale in Pharmacy (6,5%), as well as in Mass Market (1,4%).
• It is noteworthy a higher average price practiced in the Pharmacy network, in the main groups of personal care products, maintaining the tendency verified in 2018;
• There is an increase in the average price per product compared to 2018 for the Pharmacy network of 1,4% and a decrease of 0,3% in the Mass Market.
Notes: Personal Care segment includes beauty and personal hygiene
Source: HMR; HMR Consulting Service analysis
Sell-Out(2019; Sell-Out Value Million €; Growth Rate)
Average Price(2019; Sell-Out Average Price €)
Average Sale per Point-of-Sale(2019; Sell-Out Average Value Thousand €)
16
,8
15
,8
19
,0
18
,4
22
,9
20
,4
24
,8
21
,2
18
,0
18
,7
17
,6
19
,2
6,6
5,9 7
,7
7,1
8,5
8,5
9,9
9,2
7,2 7,6
7,5 10
,2
9,9%4,5%
9,5% 11,4%11,9%
-2,1%
9,7%3,4%
8,6% 6,0%9,7% 9,8%
- 50%
- 40%
- 30%
- 20%
- 10%
0%
10%
20%
30%
jan feb mar apr may jun jul aug sep oct nov dec
,0
10,0
20,0
30,0
40,0
50,0
60,0
Sell-Out € - Pharmacy Sell-Out € - Mass Market
13,414,1 14,3 14,5 15,1 14,9 14,9
14,1 14,2 14,6 14,4 14,3
10,4 10,010,9 10,8
11,6 11,5 11,2 11,0 10,9 10,79,9 9,9
jan feb mar apr may jun jul aug sep oct nov dec
,4
2,4
4,4
6,4
8,4
10,4
12,4
14,4
16,4
Pharmacy Mass Market
5,8 5,46,5 6,3
7,97,0
8,57,3
6,2 6,4 6,1 6,6
9,88,7
11,410,3
12,3 12,3
14,113,2
10,2 10,8 10,7
14,2
jan feb mar apr may jun jul aug sep oct nov dec
,4
2,4
4,4
6,4
8,4
10,4
12,4
14,4
16,4
Pharmacy Mass Market

Copyright © 2020 Health Market Research. All rights reserved. PHARMACEUTICAL MARKET OVERVIEW | PORTUGAL 2019 22
CONSUMER HEALTHCARE | SUPPLEMENT MARKETThe supplement segment, concentrated on 85,9% of the Pharmacy network, presented a sales growth in Pharmacy and the Mass Market, maintaining the sales peaks in May, July and October
• In comparison to 2018, the market increased 7,6% (€14,2M), with a growth of 7,4% in the Pharmacy network and 8,5% in the Mass Market channel;
• The weight of sales in the Pharmacy network accounted for 85,9%, with a decrease of 0,1 p.p. compared to 2018. The supplements segment represents about 15,5% of the Pharmacy network sales and 12,9% of the Mass Market network.
• The average sales value showed similar behaviour in both networks, with a peak referring to the increase in the sales in the area of hair care and multivitamins, in October.
• It is noteworthy a higher average price practiced in the Pharmacy network, to the main groups of supplements, maintaining the tendency verified in 2018;
• Although there is a higher average price in the Pharmacy network, the proximity of the values may be explained by the high proportion of sale of anti-hair loss or hair strengthening and anti-aging supplements in the Mass Market network, for example.
Notes: Supplement segment includes alimentary supplements
Source: HMR; HMR Consulting Service analysis
Sell-Out(2019; Sell-Out Value Million €; Growth Rate)
Average Price(2019; Sell-Out Average Price €)
Average Sale per Point-of-Sale(2019; Sell-Out Average Value Thousand €)
14
,5
13
,3
14
,2
13
,7
15
,0
13
,4
15
,2
13
,8
14
,3
16
,3
14
,6
14
,4
2,2
2,0 2,4
2,3 2,6
2,4 2
,5
2,4 2,4 2
,6
2,3
2,2
8% 8% 10% 8%6%
1%
11%
6%8% 8% 7%
11%
- 20%
- 15%
- 10%
- 5%
0%
5%
10%
15%
20%
jan feb mar apr may jun jul aug sep oct nov dec
,0
5,0
10,0
15,0
20,0
25,0
30,0
35,0
40,0
45,0
50,0
Sell-Out € - Pharmacy Sell-Out € - Mass Market
16,7 17,3 17,9 18,0 18,5 18,5 18,6 18,1 18,5 18,0 17,6 16,9
14,215,5
16,5 16,6 17,0 17,4 17,4 16,717,5
16,7 16,1 15,5
jan feb mar apr may jun jul aug sep oct nov dec
,4
2,4
4,4
6,4
8,4
10,4
12,4
14,4
16,4
18,4
20,4
Pharmacy Mass Market
5,04,6
4,9 4,75,1
4,6
5,24,7 4,9
5,65,0 4,9
3,33,0
3,5 3,43,8
3,5 3,6 3,4 3,33,7
3,2 3,1
jan feb mar apr may jun jul aug sep oct nov dec
,4
1,4
2,4
3,4
4,4
5,4
6,4
Pharmacy Mass Market
Copyright © 2020 Health Market Research. All rights reserved. PHARMACEUTICAL MARKET OVERVIEW | PORTUGAL 2019 23
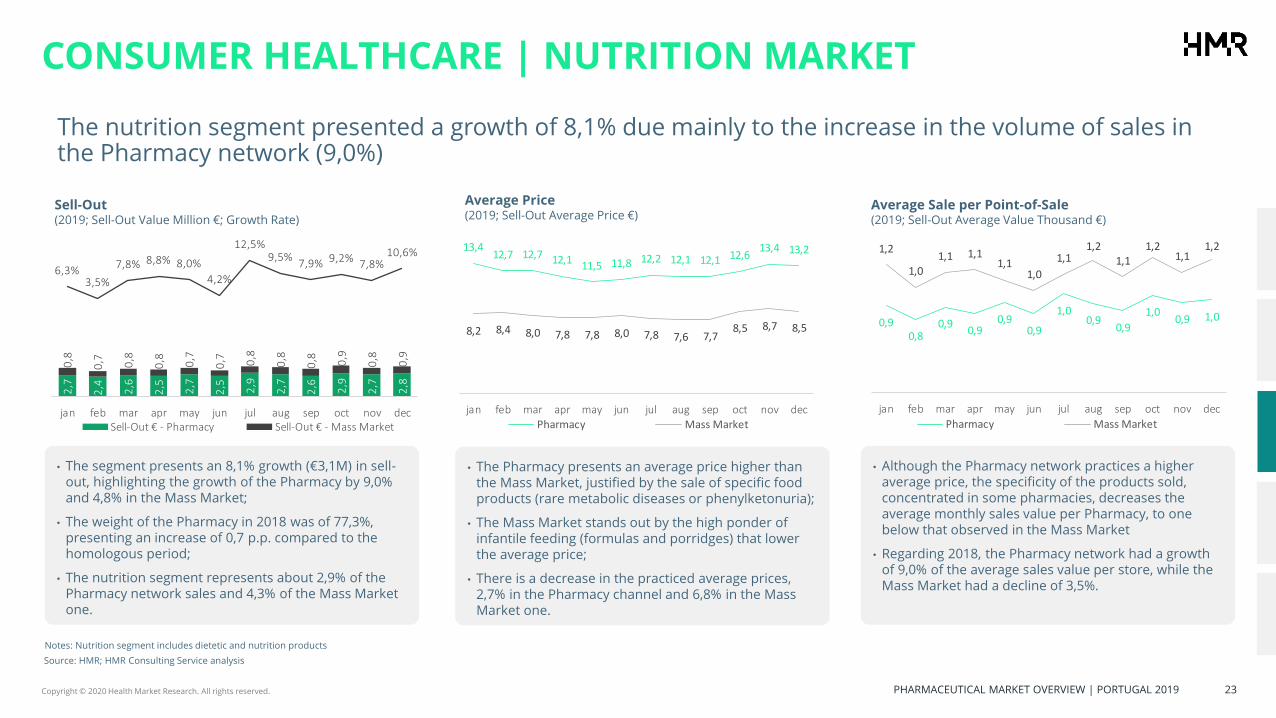
CONSUMER HEALTHCARE | NUTRITION MARKET
The nutrition segment presented a growth of 8,1% due mainly to the increase in the volume of sales in the Pharmacy network (9,0%)
Source: HMR; HMR Consulting Service analysis
• The segment presents an 8,1% growth (€3,1M) in sell-out, highlighting the growth of the Pharmacy by 9,0% and 4,8% in the Mass Market;
• The weight of the Pharmacy in 2018 was of 77,3%, presenting an increase of 0,7 p.p. compared to the homologous period;
• The nutrition segment represents about 2,9% of the Pharmacy network sales and 4,3% of the Mass Market one.
• Although the Pharmacy network practices a higher average price, the specificity of the products sold, concentrated in some pharmacies, decreases the average monthly sales value per Pharmacy, to one below that observed in the Mass Market
• Regarding 2018, the Pharmacy network had a growth of 9,0% of the average sales value per store, while the Mass Market had a decline of 3,5%.
• The Pharmacy presents an average price higher than the Mass Market, justified by the sale of specific food products (rare metabolic diseases or phenylketonuria);
• The Mass Market stands out by the high ponder of infantile feeding (formulas and porridges) that lower the average price;
• There is a decrease in the practiced average prices, 2,7% in the Pharmacy channel and 6,8% in the Mass Market one.
Notes: Nutrition segment includes dietetic and nutrition products
Sell-Out(2019; Sell-Out Value Million €; Growth Rate)
Average Price(2019; Sell-Out Average Price €)
Average Sale per Point-of-Sale(2019; Sell-Out Average Value Thousand €)
2,7
2,4 2,6
2,5 2,7
2,5 2,9
2,7
2,6 2,9
2,7
2,8
0,8
0,7 0,8
0,8 0,7
0,7 0,8
0,8
0,8 0,9
0,8
0,9
6,3%3,5%
7,8% 8,8% 8,0%
4,2%
12,5%9,5%
7,9% 9,2%7,8%
10,6%
- 20%
- 15%
- 10%
- 5%
0%
5%
10%
15%
20%
jan feb mar apr may jun jul aug sep oct nov dec
,0
2,0
4,0
6,0
8,0
10,0
12,0
14,0
16,0
18,0
20,0
Sell-Out € - Pharmacy Sell-Out € - Mass Market
13,412,7 12,7 12,1
11,5 11,8 12,2 12,1 12,1 12,613,4 13,2
8,2 8,4 8,0 7,8 7,8 8,0 7,8 7,6 7,78,5 8,7 8,5
jan feb mar apr may jun jul aug sep oct nov dec
,0
2,0
4,0
6,0
8,0
10,0
12,0
14,0
16,0
Pharmacy Mass Market
0,90,8
0,90,9
0,90,9
1,00,9
0,9
1,00,9 1,0
1,2
1,01,1 1,1
1,11,0
1,11,2
1,11,2
1,11,2
jan feb mar apr may jun jul aug sep oct nov dec
0,4
0,5
0,6
0,7
0,8
0,9
1,0
1,1
1,2
1,3
1,4
Pharmacy Mass Market

Copyright © 2020 Health Market Research. All rights reserved. PHARMACEUTICAL MARKET OVERVIEW | PORTUGAL 2019 24
CONSUMER HEALTHCARE | HOMEOPATHIC MARKET
The homeopathic segment, concentrated on 99,1% in the Pharmacy network, presented a sales growth only in Pharmacy network, with a sales peak in May
• There was a 4,4% increase in the market (€42,7m) with a growth of 5,7% in the Pharmacy network and a marked decrease of 55,0% in the Mass Market network;
• The weight of sales in the Pharmacy network accounted for about 70,8%, with a decrease of 0,7 p.p. compared to 2018;
• The homeopathic segment represents about 0,1% of the sales of the Pharmacy network and less in the Mass Market sales.
• Although the Mass Market network practices a higher average price, the huge concentration of the sales in this segment increases the average monthly sales value per Pharmacy;
• Regarding 2018, the Pharmacy network had a growth of 5,6% of the average sales value per store, while the Mass Market had a decline of 53,6%.
• It is noteworthy a higher average price practiced in the Mass Market network, with exception of May;
• The higher average price in the Mass Market network may be explained by the high price of the product “V-C 15 Forte Neo”, that has a high weight in this network sales. This product may also explain the drop of the average price observed in this network, as it registered a fall in it sales.
Source: HMR; HMR Consulting Service analysis
Sell-Out(2019; Sell-Out Value Million €; Growth Rate)
Average Price(2019; Sell-Out Average Price €)
Average Sale per Point-of-Sale(2019; Sell-Out Average Value Thousand €)
88,0
81,2
84,7
82,1
93,9
78,9
86,7
77,3
81,2
88,8
80,7
77,2
0,6
0,7
1,1
1,0 0,
6
0,6 0,
7
0,8 0,7 0,7
0,7
0,7
10,3% 11,7%7,4%
9,8% 9,2%4,6%
7,5%
-1,8%
11,3%
-2,0%
-7,2%-4,6%
jan feb mar apr may jun jul aug sep oct nov dec
,0
20,0
40,0
60,0
80,0
100,0
120,0
140,0
160,0
180,0
200,0
Sell-Out € - Pharmacy Sell-Out € - Mass Market
6,6 6,5 6,5 6,7 6,8 6,9 7,0 6,9 7,36,8 6,6 6,4
10,0
12,0 13,111,6
6,8
12,6
10,89,8
13,4
8,5
10,6 10,1
jan feb mar apr may jun jul aug sep oct nov dec
,4
2,4
4,4
6,4
8,4
10,4
12,4
14,4
Pharmacy Mass Market
30,227,9 29,1 28,2
32,327,1
29,826,6 27,9
30,627,8 26,5
0,9 1,0 1,6 1,4 0,9 0,9 1,0 1,1 1,0 1,0 1,1 1,0
jan feb mar apr may jun jul aug sep oct nov dec
- 10, 0
,0
10,0
20,0
30,0
40,0
50,0
Pharmacy Mass Market
Copyright © 2020 Health Market Research. All rights reserved. PHARMACEUTICAL MARKET OVERVIEW | PORTUGAL 2019 25
CONTENT
2 PORTUGAL’S KEY INDICATORS
1 PORTUGAL’S OUTPATIENT MARKET
1.1 PHARMA MARKET
1.2 CONSUMER HEALTHCARE MARKET
3 ABOUT HMR - HEALTH MARKET RESEARCH

Copyright © 2020 Health Market Research. All rights reserved. PHARMACEUTICAL MARKET OVERVIEW | PORTUGAL 2019 26
POLITICAL CONTEXT (1/2)
Regarding freedom indicators, Portugal has positive stable levels
Source: Freedom House - Freedom in the World 2019; Worldwide Press Freedom Index 2019; Transparency International - Corruption Perceptions Index; HMR Consulting Services analysis
Freedom Indicators (2019)
• Portugal is the 30th least corrupt nation out of 180 countries, according to the Corruption Perceptions Index;
• There is a moderate to low risk of corruption when dealing with Portuguese police (score 62/100);
• New allegations of politician corruption have caused internal discomfort.
• Political Freedom provides an evaluation of the state of freedom as experienced by individuals, and measures freedom according to two broad categories (political rights and civil liberties);
• Press freedom reflects the degree of freedom enjoyed by journalists, the media and digital citizens and the means used by states to respect and uphold this freedom.
Political Freedom
Free - Freedom Rating 1/7 Political Rights 1/7 | Civil Liberty 1/7
(1=Most Free, 7=Least Free)
World Press Freedom Index
Score 12.63 (-1,54 compared to 2018)World Ranking 12/180 (2 places up compared to
2018)
Corruption Perceptions Index(2013-2019)
6263
64
6263
64
62
3331
28 29 29 30 30
14
19
24
29
34
2013 2014 2015 2016 2017 2018 2019
58
63
68
Relative Position Score (base 100)
Context (1/2)
• Portugal is a stable parliamentary democracy with a multiparty political system and regular transfers of power between the largest parties;
• Regarding freedom indicators, ongoing concerns include corruption, certain legal constraints on journalism, and poor or abusive conditions for prisoners;
• In recent years, prosecutors have pursued corruption cases against top officials;
• The exposure of high-profile corruption cases (corruption scandals involving high-level politicians, local administrators and businesses abusing public funds) and the limited political engagement have contributed to poor public perception of political corruption.

Copyright © 2020 Health Market Research. All rights reserved. PHARMACEUTICAL MARKET OVERVIEW | PORTUGAL 2019 27
POLITICAL CONTEXT (2/2)
Portugal has maintained relative political stability, which leads to greater confidence for foreign investment and better results in credit ratings.
Context (2/2)
• António Costa, the Socialist Party (PS) leader, was appointed prime minister in October 2019. His minority government faces political pressures without any working coalition;
• Despite the current political stability and Portuguese improving economy, unions have been hard to appease;
• Portugal exited its EU/IMF bail-out in 2014 and is repaying its IMF loan ahead of schedule, although the weak financial sector continues to pose risks;
• Thanks in part to this economic recovery, Portugal’s credit rating was lifted from speculative grade.
Source: The Economist Intelligence Unit; Agency for Investment and Foreign Trade of Portugal (AICEP); The World Bank - Worldwide Governance Indicators 2018; Trading Economics; Diverse Portuguese Media; HMR Consulting Service analysis
Notes: Political Stability Index (-2,5 weak; 2,5 strong); FDI – Foreign Direct Investment
Risk Indicators(January 2020)
• In general, a credit rating is used by sovereign wealth funds, pension funds and other investors to gauge the credit worthiness of Portugal thus having a big impact on the country's borrowing costs;
• According to these results, Portugal has “capacity and commitment to honor obligations currently but somewhat susceptible to changes in economic climate”.
• Since 2013, there is a constant growth of the world bank political stability index and, in 2017, Portugal has it’s first appearance in the FDI Confidence Index (22nd
place);
• In December 2018, the government has received 47 strike notifications across a range of sectors, most concerningly, in the healthcare system.
S & P Moody’s Fitch
Rating BBB Baa3 BBB
Outlook Positive Positive Positive
Political Stability Index
(2013-2018)
0,75 0,810,92 0,97
1,12 1,14
2013 2014 2015 2016 2017 2018
0
0,2
0,4
0,6
0,8
1
1,2

Copyright © 2020 Health Market Research. All rights reserved. PHARMACEUTICAL MARKET OVERVIEW | PORTUGAL 2019 28
ECONOMIC INDICATORS (1/3)
Real GDP growth stood at 2,4% in 2018, and it’s estimated an expansion of 2,0% in the end of 2019 and a growth forecast of 1,7% on average in 2020. This recent prosperity has allowed the country to reduce its budget deficit
• The Portuguese economy grew 2,4% in 2018 according to the AICEP;
• According to Banco de Portugal, the economy is expected to continue to grow, but more slowly, over the 2019-22 year span.
• There was a positive development in the reduction of public debt to 124,8% of GDP at the end of 2017, 4,4 p.p. below the recorded in 2016;
• In October 2018, public debt stood at €251,1b, increasing €2,1b from the end of September;
• Portuguese public debt as a percentage of GDP is still among the highest in the European Union.
Source: National Institute of Statistics; AICEP - Portugal Main Economic Indicators December 2018; Banco de Portugal – Projections for the Portuguese Economy December 18th; European Commission; HMR Consulting Service analysis
Notes: p – projection; GDP - Gross Domestic Product
• Between 2014-2018 there was a constant growth of GDP per capita in Portugal;
Nominal GDP and GDP Growth Rate(2014-2019; Current Price in Billion €; %)
GDP per capita(2014-2019; Current Price in Thousand €; %)
Public Debt(2014-2019; % of GDP)
173,1 179,8 186,5 194,6 203,9
157,9
0,9%1,8% 1,9%
2,8% 2,4% 2,0% 2,0% 1,7% 1,6% 1,6%
- 10, 0%
- 8, 0%
- 6, 0%
- 4, 0%
- 2, 0%
0,0%
2,0%
4,0%
2014 2015 2016 2017 2018 3QRT2019
2019p 2020p 2021p 2022p
0
50
100
150
200
250
16,6
17,4
18,1
19,0
19,82,0%
4,3% 4,1%5,3%
4,2%
-6,0%
-4,0%
-2,0%
0,0%
2,0%
4,0%
6,0%
2014 2015 2016 2017 2018
15,0
16,0
17,0
18,0
19,0
20,0
21,0 132,9%131,2% 131,5%
126,0%
122,2%
119,3%
2014 2015 2016 2017 2018 2019p
110,0%
115,0%
120,0%
125,0%
130,0%
135,0%

Copyright © 2020 Health Market Research. All rights reserved. PHARMACEUTICAL MARKET OVERVIEW | PORTUGAL 2019 29
ECONOMIC INDICATORS (2/3)
The Portuguese economy grew in 2018 as a result of higher growth of exports, domestic demand (investment) and private consumption
• The weight of private consumption in GDP has remained unchanged and respective growth projections are consistent with the expected growth of economy;
• According to the projections of Banco de Portugal, these trends are expected to continue and are consistent with a sustainable growth profile of the Portuguese economy.
• In 2019 it’s expected a Export growth of 3,1%, the minimal of the last 5 years;
• The contribution made by domestic growth is also projected by Banco de Portugal to decrease over the projection horizon.
• In 2019 (3QRT), public consumption increased 0,5% due the growth of number of civil servants in the first half of the year and the punctual impact of expenses related to the wildfires;
• It is expected a gradual stabilization of public consumption.
Source: National Institute of Statistics; AICEP - Portugal Main Economic Indicators December 2018; Banco de Portugal – Projections for the Portuguese Economy December 18th; HMR Consulting Service analysis
Notes: p – projection; GDP - Gross Domestic Product
Private Consumption and respective Growth (2013-2020p; % of GDP; Change year on year in %)
Public Consumption and respective Growth(2013-2020p; % of GDP; Change year on year in %)
Exports and Domestic Demand(2013-2020p; Change year on year in %)
65,9% 65,5% 65,3% 64,8% 64,8%
2,3% 2,3% 2,4% 2,3%
3,1%
2,3% 2,3%2,1%
1,9%1,7%
- 0, 3%
0,2%
0,7%
1,2%
1,7%
2,2%
2,7%
3,2%
2014 2015 2016 2017 2018 3QRT2019
2019p 2020p 2021p 2022p
0,0%
10,0%
20,0%
30,0%
40,0%
50,0%
60,0%
70,0%
80,0%
90,0%
100,0%
4,3%
6,1%
4,4%
7,8%
3,8%
2,8% 2,6% 2,8% 3,0%
2,2%2,7%
1,6%
3,0% 3,3%2,6%
2,2% 2,0% 2,0%
2014 2015 2016 2017 2018 2019p 2020p 2021p 2022p
0,0%
1,0%
2,0%
3,0%
4,0%
5,0%
6,0%
7,0%
8,0%
9,0%
10,0%
Export Growth Domestic Demand Growth
18,6% 18,1% 17,9% 17,5% 17,0%
-0,5%
1,3%0,8%
0,2%0,7% 0,5% 0,5% 0,8% 0,8% 0,8%
- 7, 5%
- 6, 5%
- 5, 5%
- 4, 5%
- 3, 5%
- 2, 5%
- 1, 5%
- 0, 5%
0,5%
1,5%
2,5%
2014 2015 2016 2017 2018 3QRT2019
2019p 2020p 2021p 2022p
0,0%
10,0%
20,0%
30,0%
40,0%
50,0%
60,0%
70,0%
80,0%
90,0%
100,0%

Copyright © 2020 Health Market Research. All rights reserved. PHARMACEUTICAL MARKET OVERVIEW | PORTUGAL 2019 30
ECONOMIC INDICATORS (3/3)
Foreign Direct Investment is considered a priority by the Portuguese Government
Foreign Direct Investment Promotion
• The country has recently launched the development of renewable energies, specifically solar energy (Portugal has the second largest solar power station in the world) and wave power (obtained from wave movements). These sectors could provide new opportunities to foreign investors, so as the IT and tourism sectors. Portugal also created "free zones" to strengthen technology-driven investments. Citizenship by Investment (CBI) via Portugal's Golden Visa programme offers a fast track for non-EU investors to gain citizenship in six years; the programme requires investing EUR 350,000 in Portuguese companies or EUR 250,000 in companies being revitalised.
• The government also launched the “Startup Visa” programme, a hosting program for foreign investors who wish to develop new projects in the Iberic country. Portugal offers a diversified economy and benefits from its EU member status, but bureaucratic and judicial burdens can discourage FDI.
Source: National Institute of Statistics; AICEP - Portugal Main Economic Indicators December 2018; Banco de Portugal – Projections for the Portuguese Economy December 18th; UNCTAD World Investment Report 2019; HMR Consulting Service analysis
• According to the UNCTAD World Investment Report 2018, FDI flows decreased in 2018 compared to the previous year;
• The country ranks 34th (out of 190) in the World Bank's 2019 Doing Business ranking, a sign of trust in Portugal's business environment.
• Inflation is expected to grow, after the 2019 fall, over the projection horizon, reflecting some domestic inflationary pressures stemming from wage costs;
• According to Banco de Portugal, the external environment is the source of the main risk factors and uncertainty surrounding the current projection.
Notes: p – projection
Inflation and Consumer Price Index Growth Rate(2014-2021p; %)
Foreign Direct Investment (FDI)(2014-2018; Million USD; Number of projects)
-0,2%
0,5%0,6%
1,5%1,4%
0,3%
0,9%
1,2%
1,4%
2014 2015 2016 2017 2018 2019p 2020p 2021p 2022p
- 0, 4%
- 0, 2%
0,0%
0,2%
0,4%
0,6%
0,8%
1,0%
1,2%
1,4%
1,6%
2 999
6 9266 310
6 946
4 895
53 47 5995
- 500
- 400
- 300
- 200
- 100
0
100
200
2014 2015 2016 2017 2018
0
1 000
2 000
3 000
4 000
5 000
6 000
7 000
8 000
9 000
10 000

Copyright © 2020 Health Market Research. All rights reserved. PHARMACEUTICAL MARKET OVERVIEW | PORTUGAL 2019 31
SOCIAL AND DEMOGRAPHIC CONTEXT (1/3)
Portugal’s resident population continues its slow decline, with major concerns in the active population range, in part due to the disproportion in the migration balance, with a visible impact on the dependency ratios
• The Portuguese population has been declining since 2010, although the rate of decline has eased over the last five years;
• According to INE, the resident population in Portugal at the end of 2018 was estimated at 10.276.617, a decrease of 14.410 inhabitants from the previous year;
• There is evidence of a growing weight of older generations over the younger generations.
• There was an increase in total dependency ratio, between 2013 and 2018, from 52,6 to 55,1 (dependent population over the working class), due to the gradual increase on the Old-Age Dependency Ratio, influenced by the positive evolution of the Portuguese population’s ageing index.
Source: The World Bank; National Institute of Statistics; United Nations Development Programme; HMR Consulting Service analysis
Notes: INE - National Institute of Statistics
• Unlike most European nations, who are trying to reduce the influx of migrants, Portugal is bucking the trend by looking to immigration as a way to counter its declining population;
• In 2017, Portugal registered a positive migration balance for the first time in six years;
• In 2018 this inversion migration balance increased more.
Resident Population(2013-2018; 10⁶ )
Population Ageing and Dependency Ratios(2013-2018)
Migration Balance(2013-2018; 10³)
14,6% 14,4% 14,1% 14,0% 13,8% 13,7%
16,3% 16,1% 16,1% 16,0% 16,0% 15,9%
49,3% 49,2% 49,1% 48,9% 48,7% 48,5%
19,9% 20,3% 20,7% 21,1% 21,5% 21,8%
-0,57% -0,50% -0,32% -0,31% -0,18% -0,14%
- 10, 00%
- 9, 00%
- 8, 00%
- 7, 00%
- 6, 00%
- 5, 00%
- 4, 00%
- 3, 00%
- 2, 00%
- 1, 00%
0,00%
2013 2014 2015 2016 2017 2018
0 ,0%
2 0,0 %
4 0,0 %
6 0,0 %
8 0,0 %
1 00 ,0 %
1 20 ,0 %
1 40 ,0 %
<15 years old 15-29 years old 30-64 years old
>65 years old Population Growth
22,3 22,0 21,7 21,6 21,4 21,2
30,30 31,10 31,80 32,50 33,30 33,90
136,0 141,3 146,5 150,9 155,4 159,4
0 ,0
2 0,0
4 0,0
6 0,0
8 0,0
1 00 ,0
1 20 ,0
1 40 ,0
1 60 ,0
2013 2014 2015 2016 2017 2018
0,0
10,0
20,0
30,0
40,0
50,0
60,0
70,0
80,0
90,0
Young Dependency Ratio Old-Age Dependency Ratio Pop. Ageing
-53,8 -49,6-40,4 -38,3
-31,8 -31,6
17,6 19,529,9 29,9
36,643,2
2013 2014 2015 2016 2017 2018
Permanent Emigrants Permanent Immigrants Migration Balance

Copyright © 2020 Health Market Research. All rights reserved. PHARMACEUTICAL MARKET OVERVIEW | PORTUGAL 2019 32
SOCIAL AND DEMOGRAPHIC CONTEXT (2/3)
In the third quarter of 2018, the active population was of 5.286.900 people, with an employment rate of 55,4% and an unemployment rate of 6,8%, representing a fall of 1,8pp on the previous year’s rate, maintaining the decreasing trend
• In recent years, there has been a stabilization of the labour force in Portugal, with a slight increase in annual growth and labor force participation rate (58,8% to 59,4% between 2014 and 2018);
• OECD’s forecast for the Portuguese labour force in 2019 will be 5.253.813 people.
• In the last two years, the observable job creation has brought the unemployment rate down to 6,7% percent in November 2019. Employment has increased faster than unemployment reduction, suggesting that Portuguese market has incorporated new entrants and previously unemployed citizens simultaneously into the workforce;
• According CIA, the employment growth in Portugal has been broad-based, including both permanent and temporary jobs.
Source: National Institute of Statistics; AICEP - Portugal Main Economic Indicators December 2018; OECD Data; CIA – The World Factbook; HMR Consulting Service analysis
• The national minimum wage in Portugal is updated annually based on the cost of living, national productivity and the government’s prices and incomes policy (€600 in 2019);
• Portugal’s minimum wage is in line with countries such as Spain, Slovenia, Greece and Malta;
• 22 out of 28 EU member states have an official minimum wage, from €260 to €1.999.
Labour Force and Employment Rate(2015-2018; Thousands; %)
Unemployment Rate(2018-2019)
Minimum Monthly Wage(2014-2019; Value in euros before taxes)
50,7% 51,3% 52,0% 53,8% 55,0% 55,7%
5 226 5 195 5 178 5 219 5 233 5 253
-1,1% -0,6% -0,3% 0,8% 0,3% 0,4%
- 60, 0%
- 50, 0%
- 40, 0%
- 30, 0%
- 20, 0%
- 10, 0%
0,0%
2014 2015 2016 2017 2018 3QTR2019
0,0%
20,0%
40,0%
60,0%
80,0%
100,0%
120,0%
140,0%
Employment Rate Labour Force (>15years)
Labour Force Growth
6,9% 6,8% 6,7% 6,6% 6,3% 6,2% 6,1% 6,2% 6,5% 6,5% 6,8% 7,1%
8,1% 8,0% 7,7%7,2% 6,8% 6,5% 6,5% 6,8% 6,6% 6,8% 6,7% 6,9%
- 4, 0%
- 2, 0%
0,0%
2,0%
4,0%
6,0%
8,0%
10,0%
Jan Feb Mar Apr May Jun Jul Ago Sep Oct Nov Dec
- 4, 0%
- 2, 0%
0,0%
2,0%
4,0%
6,0%
8,0%
2019 2018
485 € 505 € 530 € 557 € 580 € 600 €
2014 2015 2016 2017 2018 2019

Copyright © 2020 Health Market Research. All rights reserved. PHARMACEUTICAL MARKET OVERVIEW | PORTUGAL 2019 33
SOCIAL AND DEMOGRAPHIC CONTEXT (3/3)Portugal has climbed two places in the United Nations’ human development ranking and remains among those countries whose level of development is classed as “very high”, based on indicators including health, education, employment, national wealth, safety and perception of well-being
• This statistic shows the share of urban population in the total population in Portugal from 2013 to 2018. In 2018, 65,2% of Portugal's total population lived in urban areas and cities, and 28,5% lived Lisbon;
• According to CIA estimative, the urban population represents 65,2% of the total population in Portugal in 2018 and the annual rate of change between 2015-2020 reached 0,47% .
• According to OCDE’s 2018 Report, in Portugal, 47% of adults aged 25-64 have completed upper secondary education, lower than the OECD average (74%);
• Conversely, according the same source, participation in early childhood education has increased considerably over the past decade, and enrolment rates among 2, 3 and 4-year-olds are all above the OECD average.
Source: The World Bank; National Institute of Statistics; CIA – The World Factbook; United Nations Development Programme; OCDE – Education at a Glace 2018 – Portugal Country Note; HMR Consulting Service analysis
• The Human Development Index (HDI) of Portugal, used by the United Nations to measure the progress of a country, was 0,850 points in 2018, leaving it in 40th
place in the table of 189 countries - very high human development category;
• Between 1990 and 2018, Portugal’s HDI value increased 19,1%, from 0,711 to 0,850.
Notes: Annual rate of change corresponds to the projected average rate of change of the size of the urban population; CIA – Central Intelligence Agency
Urbanization(2013-2018; %)
Education Attainment(2013-2018; %)
Human Development Index (HDI)(1990-2018)
27,3% 27,6% 27,8% 28,1% 28,3% 28,5%
62,4% 62,9% 63,5% 64,1% 64,7% 65,2%
0,40% 0,39% 0,50% 0,58% 0,64% 0,68%
- 11100, 00%
- 9100, 00%
- 7100, 00%
- 5100, 00%
- 3100, 00%
- 1100, 00%
2013 2014 2015 2016 2017 2018
0,0%
10,0%
20,0%
30,0%
40,0%
50,0%
60,0%
70,0%
80,0%
90,0%
Pop. in largest city Urban Population
30,0% 31,3% 31,9% 34,6% 33,5% 33,5%
42,5% 45,8% 47,9% 49,6% 50,6% 52,5%
63,5% 66,6% 68,5% 69,7% 71,0% 72,3%
18,9% 17,4%13,7% 14,0% 12,6% 11,8%
2013 2014 2015 2016 2017 2018
0 ,0%
1 0,0 %
2 0,0 %
3 0,0 %
4 0,0 %
5 0,0 %
6 0,0 %
7 0,0 %
8 0,0 %
Superior Education Secondary Education
Basic Education Early School Leaving
0,711
0,7600,785
0,8000,822
0,843 0,846 0,848 0,850
1990 1995 2000 2005 2010 2015 2016 2017 2018

Copyright © 2020 Health Market Research. All rights reserved. PHARMACEUTICAL MARKET OVERVIEW | PORTUGAL 2019 34
CONTENT
2 PORTUGAL’S KEY INDICATORS
1 PORTUGAL’S OUTPATIENT MARKET
1.1 PHARMA MARKET
1.2 CONSUMER HEALTHCARE MARKET
3 ABOUT HMR - HEALTH MARKET RESEARCH

Copyright © 2020 HMR. All rights reserved.
Today, HMR is a reference company for the knowledge it can provide
and for the specialized consultancy services is able to provide to all
healthcare players.
Specialized in developing Knowledge based on daily information
collected at a pharmacy level, HMR is reinforcing this information
by combining data from different sources, allowing our Clients to
take well informed decision.
About us.Created in 2009, HMR is a Portuguese multinational company specialized in the developing Knowledge for the Healthcare sector.
+200clients in Europe
2.500regular users
170 Teamexperts
countriesPortugalSpain
Ireland4 Germany
+19.500pharmacies

Copyright © 2020 HMR. All rights reserved.
HMR GEOGRAPHIC FOOTPRINT
2009
HMR PORTUGAL
Launch of the commercial operations
in Portugal. First HMR commercial unit
2014
HMR SPAIN
Launch of the commercial operations
in Spain.
2015
HMR IRELAND
Launch of the commercial operations in
Ireland in a partnership with IPU.
2018
HMR GERMANY
Creation of HMR in Germany.

OUR VISION
We believe that the power of
knowledge grows when is shared.
And can change lives.

The partner that generates knowledge in the healthcare market, providing solutions to measure and improve business.
OUR MISSION

Data Expertise
A pharmacy level transactional data is the most effective way to getrelevant market knowledge.
Technology
The most up-to-date technologyallow us to share knowledge andhelps to improve business decision-making.
Our international team of experts guarantees the excellence of the analysis, providing insightfulknowledge.

Copyright © 2020 HMR. All rights reserved.
the most suitable level of service to all our
customers, independently of the market segment
or product life cycle stage.
Our solutions.To share the full power of knowledge we provide different types of solutions and skills.

Copyright © 2020 Health Market Research. All rights reserved. PHARMACEUTICAL MARKET OVERVIEW | PORTUGAL 2019 41
ABOUT HMR METHODOLOGY
DATA TREATMENT
The data and information on this publication are collected from more than 2.400 pharmacies HMR Portugal panel, which represents90% in pharmaceutical value market. This is done in a daily basis with transactional data. This data is then projected to the universe,and the valorization is in street price.
GLOSSARY (1/2)
• Branded medicines – includes all non-generic medicines such as branded original products that have been developed by a pharmaceutical company and are still protected by patent, branded products that no longer are protected by a patent, or others;
• Consumer Healthcare Market - In this specific study includes the following segments: OTC medicines, patient care, personal care, supplements and nutrition that are made available in the pharmacy channel;
• Generic medicines - Medicinal product that has the same qualitative and quantitative composition in active substances and the same pharmaceutical form as a reference medicinal product, and which bioequivalence with it has been demonstrated;
• Homeopathy - Includes Homeopathic medicines with a valid Marketing Authorization in Portugal and Homeopathic Pharmaceutical Products under the transitional period.
• INN - International Nonproprietary Names (INN) identifies pharmaceutical substances or active pharmaceutical ingredients. Each INN is a unique name that is globally recognized and is public property. A nonproprietary name is also known as a generic name. The selection and publication of INNs fall under the responsibility of the EMP/RHT/TSN team (World Health Organization) of the INN Programme;
• New Medicines – New medicines approved with new INNs or new combinations of INNs;• Nutrition - Includes products as food for specific medicinal purposes and intended for a special diet, and food for weight
reduction. It also includes infant formulas (e.g. milk, meals);

Copyright © 2020 Health Market Research. All rights reserved. PHARMACEUTICAL MARKET OVERVIEW | PORTUGAL 2019 42
ABOUT HMR METHODOLOGY
GLOSSARY (2/2)
• OTC medicines - The OTC (over-the-counter) segment identifies medicines that are not subject to prescription to be dispensed in a Pharmacy. It covers the following dispensing classifications defined by INFARMED: MNSRM and MNSRM-EF. MNSRM - Medicines intended for the treatment of minor non-serious health problems, which dispensing does not require the presentation of a medicalprescription;
• Patient Care - It includes products intended for the care of the patient, in which are included the medical devices present in several markets. In this specific study reimbursed medical devices are not included;
• Personal Care - In this segment are classified products intended for personal care, including healthcare and wellness products (Dermocosmetics and Personal Hygiene);
• Pharma Market - Includes prescription medicines, available in the pharmacy channel;• Prescription Medicine – Medicines that based on information from the national regulatory entity - INFARMED, have one of the
following dispensing classifications: - Medicine Subject to Prescription (MSRM), Special MSRM, Special MSRM and Restricted (b) and (c), Restricted MSRM (b) and (c). It does not include the medicines used exclusively in the hospital setting, associated with the dispensing classification - MSRM special and restricted article a) or MSRM restricted article a);
• Reference Group (GH) - A group of medicinal products, reimbursed by the Portuguese National Health System, that contain the same active ingredient, in the same strength, pharmaceutical form and route of administration, including at least one genericmedicine;
• Supplement - Includes food supplements intended to complement or supplement the normal diet.
Any questions related to GDPR compliance or data protection please email [email protected] learn more about how we comply with GDPR and, as a result, care for the security and privacy of personal data we collected from our clients, visit http://www.hmr.co.com/Privacy-Policy.
Copyright © 2020 HMR. All rights reserved.

Copyright © 2019 hmR. All rights reserved.Copyright © 2020 HMR. All rights reserved.