2019 economic & market outlook€¦ · monetary policy is now viewed as ti ght with real rates...
TRANSCRIPT

2019 Economic & Market OutlookJanuary 17, 2019
Presented by
Benjamin A. Pace, III
Chief Investment Officer
Confidential & Proprietary

Key Themes for 2019
2
Confidential & Proprietary
Equities are likely to resume the bull market.
The economic expansion continues.
Recession risk remains low for this year.
Capital spending is an important factor for 2019 GDP growth.
Fed ends tightening cycle in a benign inflationary environment.
China pulls policy levers to stabilize growth.
Resolution of U.S./China trade dispute is a risk to the outlook.
Favor credit over duration in fixed income.

Review of 2018No where to escape low returns
3
Confidential & Proprietary
1%
2% 2%
-5%
-1%
2%
-14%
-18%
-13%
-7%
-9%
-7%
0%
-3%
2% 2%
0%
-2%
-5%
3%
-4%
-10%
-14%-15%
-11%
-5%
-1%
-2%
-20%
-15%
-10%
-5%
0%
5%
Citi 3M T-bill
Barc 1-10 YrMuni Bond
Barc US AggBond
BAML HYMaster II
JPMorganEMBI
Citi WGBIHedged
S&P 500 Russell 2500 MSCI EAFE MSCI EM BbgCommodity
MSCI USREIT
Barc USTIPS
HFRI FoF
QTD YTDSource: Factset
Fixed Income
Equities

Global Growth Even with the slowdown in international markets, robust global growth is forecasted for 2019.
4
Confidential & Proprietary
3.9%4.0%
2.6%
3.6%
4.8%
2.5%
3.0%
4.3%
5.4%
4.9%
5.5%5.6%
3.0%
-0.1%
5.4%
4.3%
3.5% 3.5% 3.6%3.5%
3.3%
3.7% 3.7% 3.7% 3.7%
-1%
0%
1%
2%
3%
4%
5%
6%
1996 1997 1998 1999 2000 2001 2002 2003 2004 2005 2006 2007 2008 2009 2010 2011 2012 2013 2014 2015 2016 2017 2018 2019 2020
Global Real GDP Growth
Forecasted
Source: IMF

Nearing the End of the Economic CycleExpansion could extend further based on its inherently anemic nature, aging capital stock and corporate tax reform.
37
4539
24
106
36
58
12
92
120
73
114
0
20
40
60
80
100
120
140
October 1949to July 1953
May 1954 toAugust 1957
May 1954 toAugust 1957
April 1958 toApril 1960
February1961 to
December1969
November1970 to
November1973
March 1975 toJanuary 1980
July 1980 toJuly 1981
November1982 to July
1990
March 1991 toMarch 2001
November2001 to
December2008
June 2009 toCurrent
Nu
mb
er o
f Mon
ths
Time Period
Length of Economic Expansions Since World War II
Source: NBER
5
Confidential & Proprietary

Drivers of Growth – Capital Spending & ProductivityCapital spending and productivity increases will be vital to a continuation of the current expansion.
-20%
-15%
-10%
-5%
0%
5%
10%
15%
20%
25%
Mar-80 Mar-83 Mar-86 Mar-89 Mar-92 Mar-95 Mar-98 Mar-01 Mar-04 Mar-07 Mar-10 Mar-13 Mar-16
Private Nonresidential Fixed Investment
Private Nonresidential Fixed Investment (year over year %)Source: FRED
Confidential & Proprietary
6
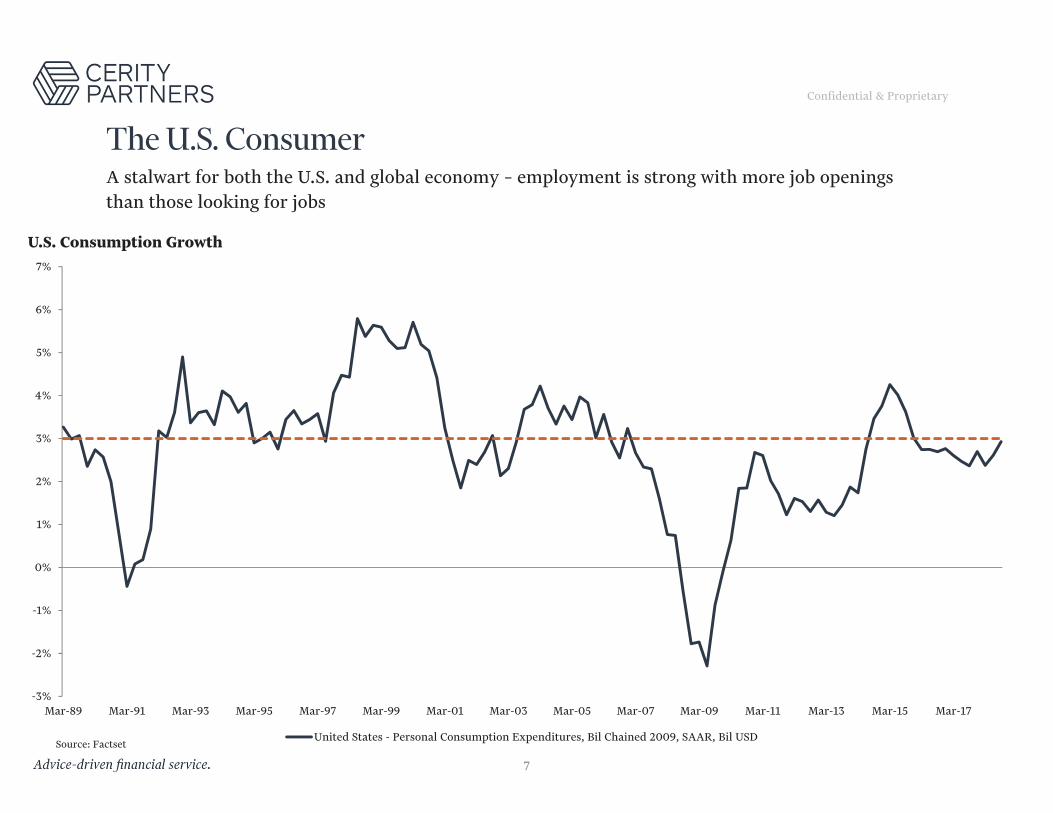
The U.S. ConsumerA stalwart for both the U.S. and global economy – employment is strong with more job openings than those looking for jobs
Confidential & Proprietary
7
-3%
-2%
-1%
0%
1%
2%
3%
4%
5%
6%
7%
Mar-89 Mar-91 Mar-93 Mar-95 Mar-97 Mar-99 Mar-01 Mar-03 Mar-05 Mar-07 Mar-09 Mar-11 Mar-13 Mar-15 Mar-17
U.S. Consumption Growth
United States - Personal Consumption Expenditures, Bil Chained 2009, SAAR, Bil USDSource: Factset

There is a large difference between the slowdown in the growth rate and a directional change in sales, earnings and GDP. A recession does not seem to be an immediate risk.
-20%
-15%
-10%
-5%
0%
5%
10%
15%
Dec-00 Dec-02 Dec-04 Dec-06 Dec-08 Dec-10 Dec-12 Dec-14 Dec-16
S&P 500 Sales Growth
12 Month Sales per Share Growth (year over year %)Source: Factset
Rate of Change
8
Confidential & Proprietary

40%
42%
41%
40%
41%
42%
45%
46% 47%
46% 46%46%
45%
44%
44%
36%
38%
40%
42%
44%
46%
48%
2003 2004 2005 2006 2007 2008 2009 2010 2011 2012 2013 2014 2015 2016 2017
Investment as a % of GDP
Gross Capital Formation as a % of Nominal GDP
China’s Rebalancing ActBeyond the headlines of the tariffs, China is attempting a delicate rebalancing of its economic growth drivers.
Confidential & Proprietary
9
Source: Factset

China & TariffsSo far, the U.S. has “won” the trade war in market terms.
Confidential & Proprietary
10
6.20
6.30
6.40
6.50
6.60
6.70
6.80
6.90
7.00
7.10
90
95
100
105
110
115
120
125
130
135
140
Jan-18 Feb-18 Mar-18 Apr-18 May-18 Jun-18 Jul-18 Aug-18 Sep-18 Oct-18 Nov-18 Dec-18 Jan-19
Relative Performance of the U.S./Chinese Stock Market & U.S. Dollar/Yuan Exchange Rate
iShares Core S&P 500 ETF Relative to iShares MSCI China ETF (Total Return), lhs U.S. Dollar/ Chinese Yuan, rhsSource: Factset

Europe FallingGrowth rates in the Eurozone have been falling since the end of 2017 with Italy at the epicenter.
Confidential & Proprietary
11
40
45
50
55
60
65
Sep-15 Mar-16 Sep-16 Mar-17 Sep-17 Mar-18 Sep-18
European Manufacturing Surveys
Germany Manufacturing PMI Italy Manufacturing PMI
Expanding
Contracting
Source: Factset

0.0%
2.0%
4.0%
6.0%
8.0%
10.0%
12.0%
Jan-89 Jan-91 Jan-93 Jan-95 Jan-97 Jan-99 Jan-01 Jan-03 Jan-05 Jan-07 Jan-09 Jan-11 Jan-13 Jan-15 Jan-17 Jan-19 Jan-21
Fed Funds Rate
Fed Funds Rate FOMC year-end estimates
The Biggest Risk: The FedMonetary policy is now viewed as tight with real rates above zero. Watch the yield curve, but also watch inflation indicators. Without real price pressures, the Fed should be able to pause and then end rate increases.
Confidential & Proprietary
12
Source: FRED
-3%
-2%
-1%
0%
1%
2%
3%
4%
5%
6%
7%
Jan-89 Jan-91 Jan-93 Jan-95 Jan-97 Jan-99 Jan-01 Jan-03 Jan-05 Jan-07 Jan-09 Jan-11 Jan-13 Jan-15 Jan-17
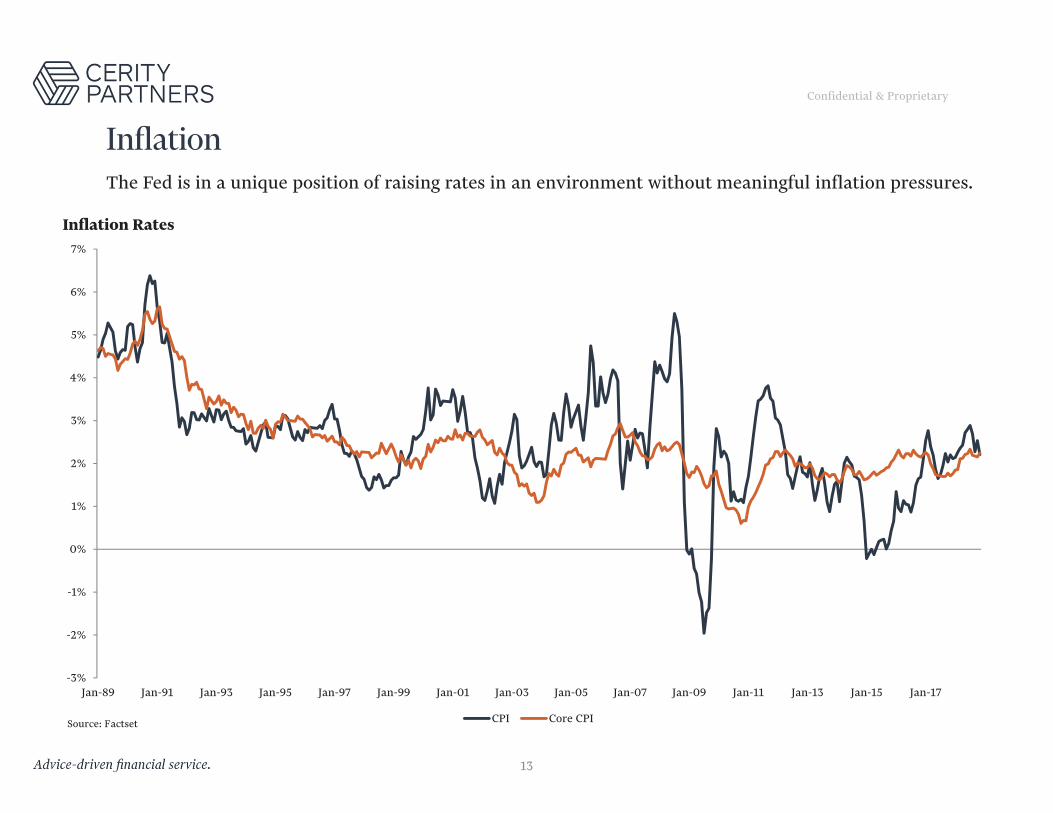
Inflation Rates
CPI Core CPISource: Factset
InflationThe Fed is in a unique position of raising rates in an environment without meaningful inflation pressures.
Confidential & Proprietary
13

-12%
-10%
-8%
-6%
-4%
-2%
0%
2%
4%
1980 1982 1984 1986 1988 1990 1992 1994 1996 1998 2000 2002 2004 2006 2008 2010 2012 2014 2016
Federal Budget Surplus/Deficit as a % of GDP
Fiscal PolicyThe effectiveness of tax cuts and spending increases may be called into question given the impact on the deficit. Watch for the crowding out effect of higher deficits on real interest rates.
Confidential & Proprietary
14
Source: FRED

0.0%
0.5%
1.0%
1.5%
2.0%
2.5%
3.0%
3.5%
4.0%
4.5%
Jan-09 Oct-09 Jul-10 Apr-11 Jan-12 Oct-12 Jul-13 Apr-14 Jan-15 Oct-15 Jul-16 Apr-17 Jan-18 Oct-18
10-Year Treasury Yield
Fixed IncomeInterest rate “normalcy” close to being achieved – maybe the Fed can achieve a soft landing, but rising deficits may awaken the bond vigilantes.
Confidential & Proprietary
15
Source: Factset

Credit Over DurationSpreads continue to reflect the low default environment.
Confidential & Proprietary
16
0%
5%
10%
15%
20%
25%
Dec-97 Dec-99 Dec-01 Dec-03 Dec-05 Dec-07 Dec-09 Dec-11 Dec-13 Dec-15 Dec-17
U.S. High Yield Spread
ICE BofAML US High Yield - Spread - Option Adj Spread AverageSource: Factset

0
10
20
30
40
50
60
VIX (CBOE Volatility Index)
Volatility RisingHeightened volatility should be the norm in a Fed tightening cycle.
Confidential & Proprietary
17
Source: Factset

8x
10x
12x
14x
16x
18x
20x
Jan-04 Jan-05 Jan-06 Jan-07 Jan-08 Jan-09 Jan-10 Jan-11 Jan-12 Jan-13 Jan-14 Jan-15 Jan-16 Jan-17 Jan-18
Forward P/E Ratio of the S&P 500
S&P 500 - PE - NTM Average
Multiple ContractionEarnings will be key. They will be slower than 2018, but still positive. How positive? Mid to high single digits vs. mid to low could make a big difference in equity returns.
Confidential & Proprietary
18
Source: Factset

International EquitiesThe current U.S. / International equity cycle has lasted longer than previous cycles.
Confidential & Proprietary
19
-20%
-15%
-10%
-5%
0%
5%
10%
15%
20%
25%
30%
Dec‐74 Dec‐77 Dec‐80 Dec‐83 Dec‐86 Dec‐89 Dec‐92 Dec‐95 Dec‐98 Dec‐01 Dec‐04 Dec‐07 Dec‐10 Dec‐13 Dec‐16
5-Y
ear
An
nu
aliz
ed R
etu
rns
U.S. Equities vs. Developed International Equities
Difference
U.S. Outperforming
Developed International Outperforming
Source: Morningstar Direct Notes: U.S. index is the S&P 500, Developed International index is the MSCI World ex USA

Emerging Market (EM) EquitiesThe dollar’s rise has been a headwind for emerging markets. The effect, however, is not uniform across EM countries.
Confidential & Proprietary
20
60
65
70
75
80
85
90
95
100
105
110100
105
110
115
120
125
130
135
Jan-14 May-14 Sep-14 Jan-15 May-15 Sep-15 Jan-16 May-16 Sep-16 Jan-17 May-17 Sep-17 Jan-18 May-18 Sep-18 Jan-19
Relative Performance of the MSCI EM/S&P 500 & The Dollar Index
Trade Weighted U.S. Dollar Index: Broad(reversed), rhs iShares MSCI Emerging Markets ETF Relative to iShares Core S&P 500 ETF (total return), lhs
Source: Factset, FRED
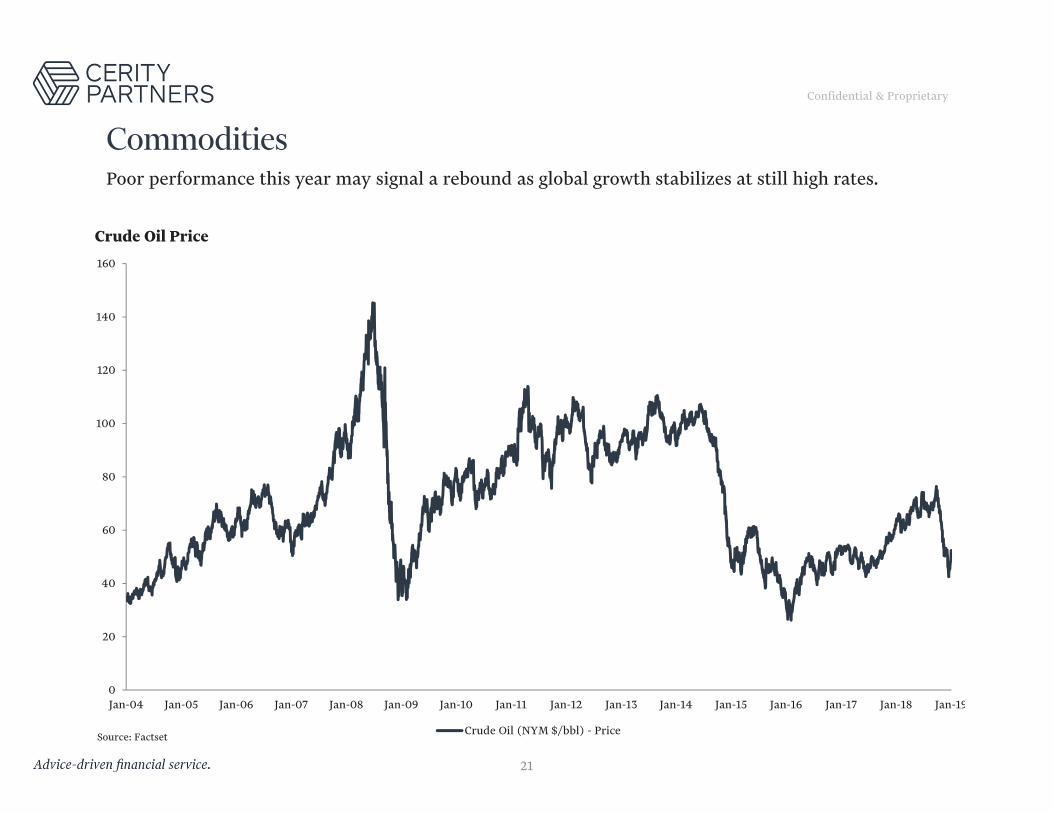
CommoditiesPoor performance this year may signal a rebound as global growth stabilizes at still high rates.
Confidential & Proprietary
21
0
20
40
60
80
100
120
140
160
Jan-04 Jan-05 Jan-06 Jan-07 Jan-08 Jan-09 Jan-10 Jan-11 Jan-12 Jan-13 Jan-14 Jan-15 Jan-16 Jan-17 Jan-18 Jan-19
Crude Oil Price
Crude Oil (NYM $/bbl) - PriceSource: Factset

Confidential & Proprietary
Important NotesCerity Partners LLC (“Cerity Partners”) is an SEC-registered investment adviser with offices in New York, Illinois, Ohio, Michigan and California. This commentaryis limited to general information about Cerity Partners’ services and its financial market outlook, which may not be suitable for everyone. The informationcontained herein should not be construed as personalized investment advice. Past performance is no guarantee of future results. There is no guarantee that theviews and opinions expressed in this brochure will come to pass. Investing in the financial markets involves risk, including the risk of loss of the principal amountinvested; and may not be appropriate for everyone. The information presented is subject to change without notice and should not be considered as an offer to sellor a solicitation of an offer to buy any security. All information is deemed reliable but is not guaranteed. For information pertaining to the registration status ofCerity Partners, please contact us or refer to the Investment Adviser Public Disclosure website (www.adviserinfo.sec.gov). For additional information about CerityPartners, including fees and services, send for our disclosure statement as set forth on Form ADV Part 2A using the contact information herein. Please read thedisclosure statement carefully before you invest or send money.
©2019 Cerity Partners LLC, an SEC-registered investment adviser. All Rights Reserved. (01/19)
22