2018 general rate case - southern california edison · 2018 general rate case transmission &...
TRANSCRIPT
Application No.: A.16-09- Exhibit No.: SCE-02, Vol. 9 Witnesses: C. Fanous
(U 338-E)
2018 General Rate Case
Transmission & Distribution (T&D) Volume 9 - Poles
Before the
Public Utilities Commission of the State of California
Rosemead, California
September 1, 2016

SUMMARY
This exhibit presents SCE’s requests for $44 million in O&M expenses for the 2018 Test Year
and $1,667 million in capital expenditures from 2016-2020.
Poles O&M Expenses 2018 Forecast
(Total Company – Constant 2015 $Millions)
This chapter describes SCE’s activities related to poles, which include:
1. Inspection and remediation of poles as part of the Pole Loading Program;
2. Inspection and remediation of poles as part of the Deteriorated Pole program; and
3. Other T&D activities such as Joint Pole credits and wood pole disposal.

Poles Capital Expenditures 2016-2020 Forecast
(CPUC-Jurisdictional Only – Nominal $Million)

SCE-02: Transmission & Distribution (T&D) Volume 9 - Poles
Table of Contents
Section Page Witness
-i-
SUMMARY OF POLE TESTIMONY ..............................................................1 C. Fanous
A. Overview ................................................................................................1
B. Comparison of Authorized 2015 to Recorded Costs .............................2
C. Summary of O&M Request ...................................................................5
D. Summary of Capital Request .................................................................6
E. Risk factors, Safety, Reliability .............................................................8
F. 2015 GRC Decision Requirements ........................................................8
POLE LOADING PROGRAM........................................................................10
A. Background ..........................................................................................10
B. Changes to Pole Loading Methodology ...............................................11
1. Overview of Changes and Expected Impact ............................11
2. SPIDACalc Selection Process ..................................................11
3. Identification of Areas for Improvement: Review of Software Performance After Deployment ...........................13
4. Technical Summary of Changes ..............................................14
5. Development and Implementation of Software Improvements ..........................................................................14
6. Recalculation Scope .................................................................15
7. Forecast Remediation rates ......................................................16
C. Pole Loading Program O&M Expenses ...............................................17
1. Pole Loading Program Assessment Variance Analysis....................................................................................17
2. Pole Loading Program Assessment Cost Forecast ...................19
3. Pole Loading Program Repair Variance Analysis ...................20

SCE-02: Transmission & Distribution (T&D) Volume 9 - Poles
Table of Contents (Cont.)
Section Page Witness
-ii-
4. Pole Loading Program Repair Cost Forecast ...........................21
5. Shareholder Costs ....................................................................22
D. Forecast Capital Expenditures .............................................................22
1. PLP-driven Pole Replacements ................................................22
2. Alternatives to Pole Replacement ............................................26
3. Coordination of Pole Replacements with Other Programmatic Work .................................................................27
4. Transformer Replacements, PLP Portion ................................27
5. Prefabrication, PLP Portion .....................................................28
DETERIORATED POLE PROGRAM ...........................................................30
A. Background ..........................................................................................30
B. Activity Description .............................................................................30
1. Replacements Driven by Program Inspections ........................30
2. Changes in the Intrusive Pole Inspection Program Standards ..................................................................................31
3. Restoration (steel stubbing) .....................................................34
4. Inspection-driven Replacements ..............................................35
5. Replacements Driven by Non-Programmatic Activities ..................................................................................37
6. Replacements Driven by Pole Loading Calculation Failures .....................................................................................39
C. O&M Cost Forecast .............................................................................41
D. Deteriorated Pole Capital Replacements .............................................43
POLE CAPITAL REMEDIATION UNIT COSTS .........................................45
A. Pole Replacement Unit Cost Summary ................................................45

SCE-02: Transmission & Distribution (T&D) Volume 9 - Poles
Table of Contents (Cont.)
Section Page Witness
-iii-
B. Unit Cost Variance Analysis ................................................................46
1. Distribution Pole Unit Cost Analysis .......................................46
2. Transmission Pole Unit Cost Analysis ....................................49
C. Unit Cost Forecast Development .........................................................50
1. Distribution Pole Unit Cost Forecast .......................................50
2. Transmission Pole Unit Cost Forecast .....................................51
3. Steel Stubbing ..........................................................................52
4. Summary of Unit Cost Forecasts .............................................53
5. Ongoing Efforts to Reduce Unit Costs ....................................53
JOINT POLE ORGANIZATION AND ACTIVITY COST FORECASTS ...................................................................................................55
A. Overview of Joint Use .........................................................................55
B. General Discussion of Cost Sharing with Joint Owners and Renters .................................................................................................56
1. Cost Recovery from Joint Owners ...........................................59
2. Cost Recovery from Renters ....................................................64
3. Evaluation of Current Cost Recovery Practices .......................64
C. Joint Pole O&M Credits.......................................................................68
D. Joint Pole Organization (JPO) Expenses, Portion of FERC Account 583.125 ..................................................................................69
1. Joint Pole Organization Cost Forecast .....................................70
E. Joint Pole Capital Credits.....................................................................71
1. Credit Forecast .........................................................................71
OTHER POLE RELATED ACTIVITIES .......................................................75

SCE-02: Transmission & Distribution (T&D) Volume 9 - Poles
Table of Contents (Cont.)
Section Page Witness
-iv-
A. Wood Pole Disposal .............................................................................75
1. Cost Forecast ............................................................................75
B. Pole Related Expense ...........................................................................78
CONTINUATION OF THE POLE LOADING AND DETERIORATED POLE PROGRAMS BALANCING ACCOUNT ......................................................................................................79
SUMMARY OF GRC ACCOUNTS ...............................................................80
A. GRC Account 566.125 .........................................................................80
B. GRC Account 571.125 .........................................................................81
C. GRC Account 583.125 .........................................................................82
D. GRC Account 593.125 .........................................................................83

1
1
SUMMARY OF POLE TESTIMONY 2
A. Overview 3
This volume will cover SCE’s proposals for Pole related activities. This includes the 4
Deteriorated Pole Program, which inspects and remediates poles in compliance with General Order 165 5
(GO 165). It also includes the Pole Loading Program (PLP). The Pole Loading Program is an inspection 6
and remediation program that identifies poles for repair or replacement that do not meet safety factor 7
requirements of General Order 95 and SCE’s internal design and construction standards, including wind 8
loading in high wind areas of our service territory. This volume also covers other pole expenditures 9
primarily related to the overall activities within T&D such as Joint Pole credits and wood pole disposal 10
costs. 11
The pole programs at SCE address major safety and reliability risks, and compliance 12
requirements. While the Deteriorated Pole program has been active since 1997, the Pole Loading 13
Program was only initiated in 2014, and adopted in SCE’s 2015 GRC. There have been notable 14
enhancements in our pole programs since the 2015 GRC. In 2013, SCE engaged an experienced 15
meteorological engineering firm to perform a system-wide wind study based on a scientific evaluation of 16
historical wind events. The result of this wind study is that SCE added a new 24 pounds per square foot 17
wind loading specification in certain areas and the wind loading criteria in many other areas was 18
increased. The revised wind loadings were implemented in March 2014. Furthermore, we have updated 19
the remediation criteria for deteriorated poles, and leveraged the risk evaluation framework described in 20
SCE-02, Volume 1, in evaluating those criteria. SCE also enhanced the pole loading assessment 21
methodology, and evaluated alternatives to pole replacement to strengthen poles. 22
This testimony describes the impact of these changes on the scope and cost of the programs as 23
follows: 24
Section II outlines changes to the Pole Loading Program methodology, and forecasts 25
expenses and capital expenditures based on those changes 26
Section III describes updated remediation criteria for the Deteriorated Pole Program, and 27
forecasts expenses and capital expenditures based on those new criteria 28
Section IV provides a detailed analysis of historical and forecast trends in unit costs 29
utilized in Pole Loading Program and Deteriorated Pole Program forecasts, including 30
improvements driven by alternative remediations and other efficiencies 31

2
Sections V and VI describe forecasts associated with the Joint Pole Organization and 1
other activities 2
Sections VII and VIII discuss SCE’s proposal to continue balancing account treatment for 3
the Pole Loading Program and Deteriorated Pole Program, and summarizes O&M 4
expenses presented in this volume 5
B. Comparison of Authorized 2015 to Recorded Costs 6
This section compares the amounts authorized by the Commission in the 2015 GRC to 2015 7
recorded O&M and Capital spend. 8
Figure I-1 Poles1
2015 GRC Authorized Variance Summary 2015 O&M (Total Company - Constant 2015 $Millions)
1 Refer to WP SCE-02, Vol. 9, pp. 82-83 (O&M Authorized vs. Recorded).
($11)
($7)($2)
$3
$50
$46
$28
0
10
20
30
40
50
60
2015 Request 2015 Authorized Assessments Repairs & RelatedExpense
InstrusiveInspections
Joint Pole 2015 Recorded
Joint Pole Intrusive Inspections Repairs & Related Expense Assessments

3
SCE performed approximately 63,0002 fewer assessments than originally forecasted for the Pole 1
Loading Program in 2015, which led to significantly fewer repairs. Furthermore, the repair rate was less 2
than the 3% forecast in the 2015 GRC. Also, there was a delay in completing repairs as discussed in 3
Section III.B.6. Lastly, $1.8 million associated with planning the PLP remediation work that was 4
forecast as O&M expense in the 2015 GRC was later determined to be a planning activity and therefore 5
not recorded to expense in 2015. The combined impact of fewer assessments and fewer repairs drove the 6
majority of the variance between authorized and recorded expense. 7
2 205,754 forecast for 2015 (SCE-03, Vol. 06, Part 2 – 2015 GRC testimony), compared to 142,382 performed,
a difference of 63,372. Furthermore, a portion of the spending was funded by shareholders as discussed in Section II.C.5. Therefore, those costs are not shown in the recorded costs.

4
Figure I-2 Pole Replacement3
2015 GRC Authorized Variance Summary4 2015 Capital (CPUC-Jurisdictional – Nominal $Millions)
SCE’s 2015 recorded programmatic pole replacement volumes closely matched the forecast. 1
However, transmission pole replacements represented a larger percentage of the total replacements than 2
anticipated.5 This increased the recorded costs. In addition, both transmission and distribution pole 3
replacement unit costs increased relative to forecasts, which also led to an increase in recorded costs. 4
The mix of replacements under the Deteriorated Pole Program and Pole Loading Program also 5
differed from the forecast for each program (Table I-1). Pole loading replacements were less than the 6
forecast due to fewer assessments being completed. Deteriorated pole replacements increased relative to 7
3 Refer to WP SCE-02, Vol. 9, pp. 84-85 (Capital Authorized vs. Recorded). 4 Includes expenditures associated with the Aged Pole program. 5 This was primarily due to an increase in intrusive inspection failure rates as discussed in Section III.B.2.
($82) ($3)
$320
$1
$465
$337
$573
-100
0
100
200
300
400
500
600
700
2015 Request 2015Authorized
DeterioratedPole
Replacements
PLP PoleReplacements
Joint PoleCredits
Other 2015Recorded
Other Joint Pole Credits PLP Pole Replacements Deteriorated Pole Replacements

5
forecasts. The majority of the variance was driven by pole replacements originally scheduled for 2016 1
that were shifted into 2015 scope due to operational circumstances. These drivers are discussed in more 2
detail in the related sections of testimony that follow. 3
Table I-16 Total Programmatic Pole Replacements, Forecast vs. Recorded
C. Summary of O&M Request 4
Table I-2 Pole O&M Activities
(Total Company – Constant 2015 $000)
6 These unit counts exclude replacements associated with the Aged Pole program.
2013 2014 2015Total, 2013-
152015 GRC Forecast Replacements
PLP 3,000 25,000 28,000 Det Pole 7,500 7,600 8,102 23,202 Total, All Programs 7,500 10,600 33,102 51,202
Recorded ReplacementsPLP - 299 10,690 10,989 Det Pole 12,251 14,065 23,198 49,514 Total, All Programs 12,251 14,364 33,888 60,503
Forecast vs. Recorded VariancePLP - (2,701) (14,310) (17,011) Det Pole 4,751 6,465 15,096 26,312 Total Variance 4,751 3,764 786 9,301
Activity 2018 ForecastPole Loading Program Assessments $24,407Pole Loading Program Related Expense $2,601Pole Loading Program Repairs $5,474Intrusive Pole Inspections $5,668Joint Pole Credits -$3,140Joint Pole Organization $8,548
Total $43,559

6
D. Summary of Capital Request 1
Table I-3 Pole Capital Activities
(Total Company – Nominal $000)
Description WBS/Activity Group 2016 2017 2018 2019 2020Pole Loading Distribution Pole Replacements
CET-PD-IR-PD 106,353 112,368 119,731 123,488 127,414
Pole Loading Transmission Pole Replacements
CET-PD-IR-PT 8,808 16,116 24,628 25,277 25,940
Transformer Capital Expenditures, PLP Portion
CET-PD-OT-TR 4,804 5,360 6,024 6,213 6,411
Prefabrication Capital Expenditures, PLP Portion
CET-PD-OT-PF-PL 3,260 3,638 4,088 4,217 4,351
Distribution Deteriorated Pole Replacement and Restoration
CET-PD-IR-DP 219,123 193,402 177,355 184,746 190,804
Transmission Deteriorated Pole Replacement and Restoration
CET-PD-IR-TR 82,748 76,451 64,362 66,482 68,224
Pole Capital Savings CET-OT-OT-OX (4,002) (19,837) (21,133) (21,663) (22,527)
Joint Pole Capital Credit, Distribution
CET-PD-CR-JD (54,417) (51,615) (50,766) (52,799) (47,469)
Joint Pole Capital Credit, Transmission
CET-PD-CR-JT (9,900) (10,133) (9,846) (10,179) (9,087)
Wood Pole Disposal CET-PD-OT-WP 3,743 3,612 3,548 3,660 3,776
$360,521 $329,362 $317,992 $329,441 $347,837Total

7
Table I-4 Pole Capital Activities
(CPUC-Jurisdictional – Nominal $000)
Table I-5 Summary of Forecast and Recorded Pole Replacement Counts7
7 These counts exclude replacements associated with the Aged Pole program and steel stubbing.
Description WBS/Activity Group 2016 2017 2018 2019 2020Pole Loading Distribution Pole Replacements
CET-PD-IR-PD 106,353 112,368 119,731 123,488 127,414
Pole Loading Transmission Pole Replacements
CET-PD-IR-PT 8,104 14,828 24,351 24,992 25,647
Transformer Capital Expenditures, PLP Portion
CET-PD-OT-TR 4,804 5,360 6,024 6,213 6,411
Prefabrication Capital Expenditures, PLP Portion
CET-PD-OT-PF-PL 3,260 3,638 4,088 4,217 4,351
Distribution Deteriorated Pole Replacement and Restoration
CET-PD-IR-DP 219,123 193,402 177,355 184,746 190,804
Transmission Deteriorated Pole Replacement and Restoration
CET-PD-IR-TR 76,135 70,341 63,636 65,732 67,455
Pole Capital Savings CET-OT-OT-OX (4,002) (19,837) (21,133) (21,663) (22,527)
Joint Pole Capital Credit, Distribution
CET-PD-CR-JD (54,417) (51,615) (50,766) (52,799) (47,469)
Joint Pole Capital Credit, Transmission
CET-PD-CR-JT (9,900) (10,133) (9,846) (10,179) (9,087)
Wood Pole Disposal CET-PD-OT-WP 3,743 3,612 3,548 3,660 3,776
$353,204 $321,964 $316,988 $328,406 $346,774Total
2011 2012 2013 2014 2015 2016 2017 2018 2019 2020Deteriorated Poles
Distribution Replacements 7,715 7,972 11,092 11,050 19,395 14,206 12,177 10,791 10,791 10,791 Transmission Replacements 684 822 1,159 3,015 3,803 3,481 3,133 2,558 2,558 2,558 Deteriorated Pole Total 8,399 8,794 12,251 14,065 23,198 17,686 16,030 14,957 15,821 15,896
Pole LoadingDistribution Replacements 295 10,317 6,853 7,060 7,342 7,342 7,342 Transmission Replacements 4 373 370 663 989 989 989 Pole Loading Total 299 10,690 7,224 7,723 8,331 8,331 8,331
Total Poles Mitigated 8,399 8,794 12,251 14,364 33,888 24,910 23,033 21,680 21,680 21,680 Total Distribution Poles 7,715 7,972 11,092 11,345 29,712 21,059 19,237 18,133 18,133 18,133 Total Transmission Poles 684 822 1,159 3,019 4,176 3,851 3,796 3,547 3,547 3,547
Recorded Forecast

8
E. Risk factors, Safety, Reliability 1
As discussed in SCE-01, SCE continues to improve and use risk-informed planning to identify, 2
assess, and prioritize risks; identify and evaluate ways to mitigate risk; and help develop spending plans 3
to support risk mitigation. As part of this effort, and consistent with the Commission’s direction in the 4
Safety Model Assessment Proceeding (S-MAP),8 SCE has conducted detailed analyses to incorporate a 5
risk-informed approach in evaluating pole program activities. 6
The risk modeling framework developed for pole programs and the degree to which this analysis 7
influenced operational decisions related to pole programs is discussed in SCE-02 Volume 1 on 8
Operational Overview and Risk-Informed Decision Making. 9
F. 2015 GRC Decision Requirements 10
The Commission adopted SCE’s proposed pole related programs and costs with some 11
modifications in D.15-11-021. The Commission expressed some concerns that SCE had not fully 12
evaluated all of the options available on remediating poles, and needed to do more work on the recovery 13
of costs from the other owners of jointly-owned poles and companies that rent space on poles. The 14
Commission set some requirements that SCE must meet in the 2018 GRC. 15
1. SCE will provide a review of its efforts on recovery of costs from other companies that 16
either jointly own or rent space on poles that must be replaced or repaired. (See V.B 17
below.) 18
2. SCE will provide information on the number of jointly owned poles, the number of pole 19
renters (See V.A below), and describe the arrangements for cost sharing with other 20
parties. (See V.B below) 21
3. SCE will provide additional analysis on options to remediate overloaded poles in ways 22
other than repair or replace, and will specifically address the issues of removing 23
attachments, strengthening poles, and increasing the recovery of costs from pole users 24
(See II.D.2, III.B.2, IV.C.5 and V.B below). 25
4. SCE will address unauthorized attachments by providing quantitative information and 26
describing their efforts to minimize their impact. (See V.C below.) 27
8 D.14-12-025. Decision Incorporating a Risk-Based Decision-Making Framework into the Rate Case Plan and
Modifying Appendix A of Decision 07-07-004.

9
5. If SCE believes a Commission proceeding is needed to address issues raised by joint 1
ownership and renters, SCE need not wait for its next GRC.9 (See V.B.3 below.) 2
On April 28, 2016, the Commission held an En Banc to discuss a variety of issues related to 3
poles, including those raised in (5) above. 4
Included in the 2015 GRC was an SCE proposal to systematically replace older poles. This 5
program, called the Aged Pole program, was designed to transition and prepare the company to the 6
greater level of annual pole replacements we were forecasting. The Commission partially accepted our 7
proposal, but determined that the Company had not fully evaluated other alternatives, and disallowed 8
part of our spending for the years 2014 and 2015.10 SCE’s proposal on this previous disallowance for the 9
2018 GRC is addressed in SCE-09, Volume 2 by Mr. Gunn. 10
As part of its implementing advice letter for the 2015 GRC decision, SCE included a section 11
providing a definition of the Pole Loading and Deteriorated Pole Balancing account, Part J of the 12
Preliminary Statement. This included a reporting requirement for SCE’s 2018 GRC filing, to provide 13
recorded information on spending for the Deteriorated Pole and Pole Loading programs, and information 14
on the number of repairs made and poles replaced. This information is provided in various sections of 15
this testimony.16
9 D.15-11-021, p. 104, 137; Ordering Paragraph 9. 10 D.15-11-021, p. 113, Conclusion of Law 57.

10
1
POLE LOADING PROGRAM 2
A. Background 3
The Pole Loading Program (PLP) was adopted in the 2015 General Rate Case as a 4
comprehensive way to address pole overloading issues.11 The program assesses T&D’s poles12 to 5
identify and repair or replace those poles that do not meet G.O. 95 minimum safety factors or, to the 6
extent higher, SCE’s internal safety standards. PLP assessments began in January 2014, with the initial 7
focus on highest-risk areas including high fire regions.13 SCE expects to complete assessments in high 8
fire areas in 2017. The pole remediation phase is expected to continue for 12 years until 2025. Under 9
PLP, a pole will be replaced between 72 hours and 59 months depending on the safety factor and its 10
location relative to high fire areas. On a small percentage of poles, the pole can be made compliant by 11
installing or redesigning a “down guy.”14 12
The main risk associated with poles that do not meet minimum safety factor requirements is that 13
they may break or fail at wind loads below the minimum design wind loads for that geographic location, 14
resulting in an increased risk to public safety and system reliability. 15
SCE’s design and construction standards require that newly constructed poles meet the safety 16
factors specified in G.O. 95 at the time of installation, in addition to any SCE internal design standards 17
that may exceed minimum regulatory requirements. SCE’s internal standards also require that a pole 18
loading calculation be performed whenever equipment is attached or modified that will materially 19
increase the loading on the pole.15 SCE’s facilities are designed and constructed to meet the standards 20
applicable at the time of installation. 21
11 G.O. 95 requires that utility poles maintain a certain safety factor. This safety factor calculation is called “pole
loading.” 12 PLP will include all wood, light duty steel, and other non-engineered structures. Engineered steel poles and
transmission towers are excluded. 13 SCE has defined the high fire regions to exceed the areas defined by the Commission in D.09-08-029 and
D.12-01-032, which adopted, on an interim basis, the CalFire FRAP map “extreme” and “very high” fire threat zones for Southern California.
14 A down guy is a guy wire anchored to the ground. 15 CPUC General Order 95, Rule 44.2 defines a material increase as follows: “a material increase in load is an
addition which increases the load on a structure by more than five percent per installation, or ten percent over a 12-month span, of the electric utility’s or Communication Infrastructure Provider’s current load.”

11
B. Changes to Pole Loading Methodology 1
1. Overview of Changes and Expected Impact 2
SCE began using SPIDACalc as the enterprise-wide tool to calculate pole loading safety 3
factors for its poles in April of 2013. In December of 2014, SCE engineering identified some potential 4
improvement areas in SPIDACalc’s safety factor calculation methodology to increase its accuracy while 5
maintaining compliance with safety factors.16 SCE worked with the software provider to develop the 6
scope of the improvements, which were first incorporated into the SPIDACalc software in May of 2015 7
and fully deployed in the production version of the improved software in November of 2015. The 8
changes enabled SPIDACalc to more accurately model poles in the field, and as a result significantly 9
reduced the rate at which poles fail pole loading calculations. SCE’s initial estimates suggested that 10
remediation rates will be approximately 9%17 compared to the overall remediation rate of approximately 11
22% (3% requiring repair and 19% requiring replacement) forecast in 2015 GRC testimony.18 SCE met 12
with the Commission staff to discuss this impact on April 19, 2016, and also discussed the impact of the 13
change at the Pole En Banc held on April 28, 2016. 14
When SCE understood the impact of this software release in late August of 2015, SCE 15
instructed its pole loading contractor to hold all work not already provided to SCE starting on September 16
1, 2015, so it could be reassessed using the new version of the software. In addition, SCE reassessed all 17
poles at “Gate 1” of the planning and execution process: poles identified for replacement that had not yet 18
been released to design. The reassessment was later expanded to poles in various stages of planning and 19
design. As of March of 2016, the recalculation effort included approximately 40,000 poles, as discussed 20
at the April 19, 2016 meeting with Safety and Enforcement Division.19 21
The technical details of the changes and timeline of the development and deployment 22
process are summarized below. 23
2. SPIDACalc Selection Process 24
The changes described above are SCE’s latest improvements to pole loading methods and 25
processes driven by evolving GO 95 requirements. In August of 2009, D.09-08-029 ordered that pole 26
loading be performed whenever adding facilities could materially increase load, and added a 27
16 Throughout this volume, when the term compliance is used with respect to pole loading safety factors,
compliance refers to compliance with General Order 95 and SCE internal pole loading standards. 17 Refer to WP SCE-02, Vol. 9, pp. 86-87 (August_2015_SCE_SPIDACalc_Impact_Assessment). 18 Refer to WP SCE-02, Vol. 9, pp. 88-104 (2013 SCE Pole Loading Study). 19 Refer to WP SCE-02, Vol. 9, pp. 105-119 (2016-04-19 SED Briefing).

12
requirement that pole load calculations be retained for ten years. In January of 2012, D.12-01-032 1
further increased the record retention requirement for pole load calculations to the life of the structure. 2
SCE initiated the Pole Loading Application Replacement (PoLAR) initiative in 2012 to identify a pole 3
loading software solution that could meet these requirements in a production environment, in which 4
planners would perform a large volume of pole loading calculations. 5
As described in SCE’s 2015 GRC testimony, Wind Load Estimator was deployed in 2001 6
to automate the hand calculation of bending moment at the ground line as described in Appendix F of 7
GO95, and to enable the calculation of safety factors for guy wires.20 While this improved upon the 8
engineering tables previously used, there were scenarios where such methods could not accurately 9
calculate safety factors. SCE sought a replacement for the Wind Load Estimator tool which employed 10
modern calculation techniques, considered safety factors not only at the ground line but also along the 11
entire length of the pole, and came pre-configured with SCE poles, arms, wires, and equipment to enable 12
planners to quickly and accurately perform pole loading analyses. 13
The volume and nature of SCE’s work requires a software package and platform simple 14
enough to be used by non-engineers, capable of hundreds of concurrent users, and robust enough to 15
identify noncompliant poles with high confidence. These requirements necessitated trade-offs that are 16
incorporated into these software packages. To reduce the risk of not identifying noncompliant poles, 17
these software packages use conservative assumptions while requiring less technical sophistication from 18
the operator. 19
Several software packages were evaluated in a Request for Proposal (RFP) process, 20
which detailed technical, business, and integration requirements to continue to meet GO requirements. 21
These packages included SPIDACalc, O-Calc, and PLS-CADD/LITE. The technical requirements of the 22
RFP included the performance of pole loading calculations in various scenarios, including bending, 23
buckling, incorporating pole damage, guying, and varying pole types. In its initial evaluation of software 24
packages identified in its RFP process, SCE determined that SPIDACalc provided the best balance 25
among accuracy, simplicity, and conservatism. SCE selected the SPIDACalc software package and 26
began its utilization in April of 2013. SCE requested cost recovery for purchasing and deploying 27
SPIDACalc in its 2015 GRC testimony,21 and the request was authorized in D.15-11-021. 28
20 SCE-03, Vol. 06, Part 2, p. 5 (2015 GRC). 21 SCE-05, Vol. 02, Part 2 (2015 GRC).

13
3. Identification of Areas for Improvement: Review of Software Performance After 1
Deployment 2
In 2014, SCE planners noted that sometimes SPIDACalc called for larger pole sizes than 3
planners were anticipating to meet minimum safety factor requirements. However, the wind study 4
implemented in March 2014 updated and expanded the boundaries of high-wind areas throughout SCE’s 5
service territory, and introduced new, higher wind loading specifications, which also affected safety 6
factors and pole sizes. This made it difficult to isolate the impact due to the use of SPIDA. In July 2014, 7
SCE engineers began to evaluate how SPIDACalc handled the design situations in which these results 8
were obtained. The review included a detailed re-assessment of pole types representing a variety of 9
configurations, including those associated with the unexpected SPIDACalc results. SCE engineers 10
developed models of these poles using the full engineering version of PLS-CADD, rather than PLS-11
CADD/LITE tested in the original RFP. PLS-CADD required additional field measurements and a much 12
longer model development process, which could take an engineer 1 to 2 days per pole compared to less 13
than an hour for a planner using SPIDACalc. 14
The engineering version of PLS-CADD was not considered in the RFP because it was not 15
suitable for performing large volumes of assessments by planners. In addition, all the software packages 16
considered used broadly similar assumptions, which are described in the following section. These 17
assumptions were considered appropriate by the industry for performing pole loading assessments. Since 18
SCE sought to evaluate the impact of these common assumptions, a standard engineering tool such as 19
PLS-CADD had to provide a basis for comparison. 20
When summarized in December of 2014, the evaluation determined that SPIDACalc 21
calculated a lower safety factor in some of the analyzed poles examined when benchmarked against the 22
full engineering version of PLS-CADD. These results reflected conservative assumptions of the 23
software, as discussed below. As a result of these findings, SCE encouraged SPIDA to incorporate 24
enhancements recommended by SCE into the SPIDACalc upgrade and release cycle. While these 25
changes were expected to impact reject rates and pole classes22 required in certain situations, the general 26
prevalence of these configurations in SCE’s system was not well understood, and the overall impact of 27
the changes on the program was not yet clear. 28
22 Pole sizes are categorized by the pole “class,” which is determined by a pole’s circumference at the base and
top.

14
4. Technical Summary of Changes 1
From its initial deployment in April 2013 through November 2015, SPIDACalc used a 2
pole loading methodology similar to that implemented in comparable software packages. These options 3
surpass the hand-calculation methods shown in GO 95 Appendix F in terms of accuracy, ease of use, 4
and speed. However, in certain circumstances each incorporated conservative assumptions regarding the 5
role of wire tension in balancing the forces exerted on poles. 6
Improvements to SPIDACalc include the integration of geometric nonlinear modeling, 7
displacement-based loading, dynamic wire tensions, and the supporting data needed to enable these 8
capabilities. Together these improvements represent a significant increase in sophistication relative to 9
the software packages considered during the original RFP process. A more technical description of the 10
effect of wire tension on the pole and the changes that were made to more accurately model the pole is 11
in included in workpapers.23 12
5. Development and Implementation of Software Improvements 13
Every software change requires a development and testing process to confirm accuracy, 14
adequate performance, and integration with back-end systems of record. This process is described in this 15
section. Based on the findings of the engineering study, SCE worked with the SPIDA company from 16
December 2014 through the end of March 2015 to develop improvements that would increase the 17
accuracy of the model in these design situations. In April 2015, a test version of SPIDACalc was 18
provided for re-evaluation of the poles used in the initial engineering study. SCE Engineering 19
determined that the software still required additional development to correctly model what are called 20
dynamic wire tensions. Additionally, the database of equipment characteristics used to build models, 21
called a “client file,” was updated to improve the accuracy of equipment characteristics represented in 22
the models.24 In May of 2015, the initial delivery of dynamic wire tensions for the most common SCE 23
conductors were provided to the SPIDA company, and work began on compiling dynamic tension 24
values for telecom and cable TV spans. 25
Two improvements were incorporated in SPIDACalc Version 6.0, which was released on 26
May 21, 2015, to more accurately model the effect of wire tension on the pole. The new capabilities 27
became available not only to SCE but to other utilities that employed SPIDACalc software for pole 28
23 Refer to WP SCE-02, Vol. 9, pp. 120-122 (Technical Summary of SPIDACalc Changes). 24 In order to fully update the tensions in the client file, Engineering had to set up and run a tension calculation
program approximately 6,000 times.

15
loading. However, the dynamic tension data for communication company wires and some SCE wires 1
was not yet complete, so these improvements could not yet be used in the production version of the 2
software. This majority of the data was compiled and provided to SPIDA in June 2015. The data was 3
also provided to SCE’s assessment vendor so that they could determine the level of effort required to 4
adopt the new client file. The final data was delivered to SPIDA early August 2015. SPIDA then 5
configured the data so that it could be used in SPIDACalc, and then provided the configured data to the 6
assessment vendor so that the assessment vendor could make necessary updates in its systems. 7
In July 2015, testing of the software determined that reject rates would drop when the 8
new version was deployed. Accordingly, in August 2015, SCE performed an assessment of 9
approximately 1,400 poles, which suggested that reject rates with the new software and client file may 10
be approximately 9%.25 Testing of the new capabilities and the required client file also revealed 11
significant performance impacts: sometimes, a calculation that previously could have been completed in 12
less than four minutes would take more than an hour to complete. 13
SCE sought to balance the benefit of lower remediation rates against the risk of delaying 14
the identification and remediation of poles with noncompliant safety factors, and impeding the design 15
process and delaying other maintenance and infrastructure replacement work that required a pole 16
loading assessment. SPIDACalc assessments were necessary not only for the PLP program, but for any 17
maintenance or infrastructure replacement activity in any program that would materially impact the load 18
on a pole. For these reasons, SCE decided on August 8, 2015 to delay implementation of the client file 19
until performance issues could be addressed. An improved version of SPIDACalc which addressed these 20
issues was approved on October 27, 2015, and became effective on November 19, 2015. 21
6. Recalculation Scope 22
While performance issues were being addressed, SCE determined that the benefit of 23
reduced remediation rates would justify reassessing certain in-progress poles when the updated 24
SPIDACalc version was ready for deployment. SCE began by instructing the PLP assessment vendor to 25
hold all poles assessed, and placed poles identified as rejects not yet released to design (Gate 1 – see 26
Table II-6 for gate definitions) as of September 1, 2015, in the queue for reassessment when the new 27
SPIDACalc became available. On December 31, 2015, SCE added poles released to design (Gate 2) to 28
the queue, and on March 7, 2016, poles in various stages of design and review prior to being released to 29
25 Refer to WP SCE-02, Vol. 9, pp. 86-87 (August 2015 SCE SPIDACalc Impact Assessment).

16
construction (Gates 3 and 4) were added. As of March 2016, approximately 40,000 pole replacements 1
were included in the recalculation effort.26 2
Table II-6 Summary of Pole Gate Movement
7. Forecast Remediation rates 3
Initial reassessments on approximately 1,400 poles compiled in August 2015 suggested 4
that assessment reject rates could fall to approximately 9%.27 This assessment is the basis for SCE 5
forecasts in this GRC. 6
26 In addition, approximately 2,600 down guys with noncompliant safety factors were included in the
recalculation effort. 27 Refer to WP SCE-02, Vol. 9, pp. 86-87 (August 2015 SCE SPIDACalc Impact Assessment).
• Poles identified for repair or replacement, poles are grouped and work order number is assigned
Gate 1
Identified for Remediation
• Poles assigned to design resourceGate 2
Released for Design
• Work orders in approval process, design completed, Joint Pole Agreements initiated, environmental, rights checks/railroad request submitted
Gate 3
Design Approval
• Work orders approved and pending release to construction based on all constraints being cleared
Gate 4
Pole Program Clearance
• Work scope is assigned to construction resources and in scheduling process for final execution
Gate 5
Released to Construction
• Pole is installed in field and considered “used and useful”
Gate 6
Installation

17
C. Pole Loading Program O&M Expenses 1
PLP operating expenses are composed of pole assessment cost and pole repair costs. Pole 2
loading assessments are performed to determine a pole’s safety factor. Pole loading assessments require 3
a field assessment and a desktop analysis to calculate each pole’s safety factor. Inputs include the 4
physical attributes of the pole, its attachments, and local weather conditions. The field assessment 5
measures or validates the pole’s attributes (such as species and type) and the size and equipment it 6
supports. Collecting the data to perform a pole loading calculation requires an experienced field 7
assessor. The field assessor must be able to access poles throughout SCE’s service territory, including 8
those in remote terrain and other difficult to access locations, such as customer backyards, in order to 9
take accurate measurements. Assessors must be close enough to the pole to measure the ground line 10
circumference and have sufficient room around the pole to measure attachment heights and span lengths. 11
Photographs are also taken of each pole. The desktop analysis uses SPIDACalc to calculate the pole’s 12
safety factor. 13
1. Pole Loading Program Assessment Variance Analysis 14
Table II-7 shows the historical cost and number of assessments completed in 2014 and 15
2015. These volumes are somewhat lower than SCE’s forecast in its 2015 GRC (A.12-11-003). When 16
the forecast was made in early 2013, SCE was in the early stages of planning the program. The forecast 17
had called for 205,000 assessments per year for 7 years beginning in 2014. SCE began the Pole Loading 18
Program in January 2014 and continued ramping up the volume throughout the year. Due to the time to 19
ramp up resources, SCE completed 184,461 assessments in 2014.28 20
In 2015, SCE considered extending the seven-year assessment plan and temporarily 21
adjusted its target assessment rate. SCE considered the challenges of the rapid ramp-up and the 22
regulatory uncertainty associated with SED’s29 and ORA’s30 support for a 10-year assessment plan. In 23
addition, SCE weighed the relative risk impact of extending the assessment timeframe for lower-risk 24
poles while maintaining a shorter timeframe for higher-risk poles.31 In 2015, SCE completed 142,519 25
28 7,252 of the 184,461 assessments were completed under SCE’s Settlement of the Malibu Fire OII as
shareholder-funded work. Therefore, those costs are not shown in the recorded costs of this volume. 29 Refer to WP SCE-02, Vol. 9, pp. 123-126 (SED Letter RE: D.12-11-051, OP 17 and 18). 30 See A.13-11-003 Exhibit ORA-08, page 31. 31 SCE-19, Vol. 06, Pt. 2, page 4 (2015 GRC, Rebuttal Testimony).

18
assessments – an assessment level consistent with a 10-year timeframe.32 When the 2015 GRC decision 1
was issued in November 2015 authorizing a seven year timeframe, SCE revised its assessment forecast. 2
As detailed in Table II-7, SCE intends to complete 200,000 assessments in 2016, 220,000 in 2017 and 3
230,000 in 2018. 4
Pole assessments are performed by contract personnel. Therefore, most of the costs 5
recorded for this activity are non-labor expenses. The cost per assessment has stayed relatively constant 6
throughout the recorded period and is expected to stay constant throughout the forecast period. 7
32 1,338 and 34,758 of the 142,519 were completed under the Malibu and San Gabriel Windstorm Settlements,
respectively as shareholder-funded work. Therefore, those costs are not shown in the recorded costs of this volume.

19
Table II-7 Pole Loading Program Assessments33,34
Portions of GRC Account 566.125 and 583.125 Recorded and Adjusted 2011-2015/Forecast 2016-201835
(Constant 2015 $000)
2. Pole Loading Program Assessment Cost Forecast 1
Pole loading assessments under PLP are primarily driven by contract costs of vendors 2
conducting the assessments; a smaller amount of SCE labor cost is included for the assessment staff. 3
The assessment staff works with the vendor, manages the data exchange between the vendor and SCE, 4
updates SCE’s systems with the assessment results and performs field checks on certain poles. SCE’s 5
assessment contract calls for contract rates to decline by approximately 1.5% per year from 2016 6
through 2018 when the contract expires. 7
33 Refer to WP SCE-02, Vol. 9, pp. 1-63. 34 Total assessments were forecast as Distribution. In reality, there will be a mix of Distribution and
Transmission. Since the price per assessment is the same for both distribution and transmission this has no impact on the expected spend.
35 Refer to Confidential Workpaper: SCE-02, Vol. 9, p. 1-2 (PLP Assessment Forecast).
2011 2012 2013 2014 2015 2016 2017 2018566.125
Labor $ $ $7 $330 $256 $ $ $Non-Labor $ $ $4 $2,457 $1,205 $ $ $ Subtotal 566.125 $ $ $11 $2,787 $1,461 $ $ $
583.125Labor $ $1,022 $828 $3,251 $2,493 $1,692 $1,692 $1,692Non-Labor $ $377 $1,401 $15,113 $9,763 $20,806 $22,053 $22,715 Subtotal 583.125 $ $1,399 $2,229 $18,365 $12,255 $22,499 $23,746 $24,407
Total $ $1,399 $2,239 $21,152 $13,716 $22,499 $23,746 $24,407
Labor $ $1,022 $835 $3,582 $2,749 $1,692 $1,692 $1,692Non-Labor $ $377 $1,405 $17,570 $10,968 $20,806 $22,053 $22,715
Assessments 0 0 0 184,461 142,382 200,000 220,000 230,000Cost Per Assessment 0 0 0 112 106 112 108 106
Ratio of Labor to Total 73% 37% 17% 20% 8% 7% 7%
Basis of Forecast: Itemized ForecastBasis of Labor/Non-Labor Split: Itemized Forecast
Recorded Forecast

20
3. Pole Loading Program Repair Variance Analysis 1
Repair involves the design and installation or modification of guy wires.36 Design 2
involves determining the appropriate size and placement of a guy wire(s) such that the design conforms 3
to SCE design standards and produces a compliant safety factor. Then a drawing is developed that 4
shows the location of the pole that must be repaired, the placement of the guy on the pole and the guy 5
specifications. This drawing is be used by construction to perform the work in the field. Environmental 6
review and land rights checks, when needed, are conducted as part of the design process. Once the 7
design work is completed, the repair notification is sent to construction. The construction of the guy may 8
be completed by either an SCE crew or a contractor. 9
SCE completed 222 repair designs and constructed 20 repairs under the pole loading 10
program in 2014.37 In 2015, SCE completed 2,711 repair designs and constructed 569 repairs under the 11
pole loading program.38 The number of repairs required is directly related to the number of assessments 12
completed. Just as the number of assessments ramped up over 2014, the number of repairs ramped up as 13
well. Repairs may be completed one or two years after the assessment, depending on whether the pole is 14
in a high fire or non-high fire area. 15
36 SCE is responsible for guy repair at electrical levels only. If guy repairs are required at communication levels,
SCE will notify the communication company. The communication company is responsible to make the repair and is solely responsible for its cost of repairs.
37 1 repair design was completed under the Malibu Settlement as shareholder-funded work. Therefore, the costs of that repair are not shown in the recorded costs of this volume.
38 404 repair designs and 89 constructed repairs were completed under the Malibu Settlement as shareholder-funded work. Therefore, those costs are not shown in the recorded costs of this volume.

21
Table II-8 Pole Loading Program Repairs39,40
Portion of GRC Account 571.125 and 593.125 Recorded and Adjusted 2011-2015 / Forecast 2016-2018
(Constant 2015 $000)41
4. Pole Loading Program Repair Cost Forecast 1
Total repair costs are expected to increase relative to 2015 levels as the initial ramp-up in 2
assessments is reflected in repair activity. The current repair rates for poles in high fire areas and non-3
high fire areas are 1.53% and 1.19%, respectively, which are rates based on the new version of 4
SPIDACalc. The repair rates were applied to the assessment forecast to develop a forecast number of 5
repairs.42 The costs to complete the drawing and repair are forecast using historical values as they are 6
39 Refer to WP SCE-02, Vol. 9, pp.1-63. 40 Repairs were forecast as contract non-labor. In reality, there will be a mix of contract and SCE labor. This not
expected to have an impact on the total cost because the cost per repair used in the forecast was based on the historical cost per repair which is a mix of contract and SCE labor.
41 Refer to WP SCE-02, Vol. 9, pp. 129-132 (PLP Distribution Repair Forecast and PLP Transmission Repair Forecast).
42 Refer to WP SCE-02, Vol. 9, pp. 133-134 (PLP Repair Unit Forecast).
2011 2012 2013 2014 2015 2016 2017 2018571.125
Labor $ $ $ $1 $5 $ $ $Non-Labor $ $ $ $ $17 $298 $620 $547 Subtotal 571.125 $ $ $ $1 $22 $298 $620 $547
593.125Labor $ $ $ $19 $261 $ $ $Non-Labor $ $ $ $33 $549 $2,678 $5,579 $4,927 Subtotal 593.125 $ $ $ $52 $810 $2,678 $5,579 $4,927
Total $ $ $ $53 $832 $2,976 $6,199 $5,474Labor $ $ $ $20 $266 $ $ $Non-Labor $ $ $ $33 $566 $2,976 $6,199 $5,474
Ratio of Labor to Total 38% 32% 0% 0% 0%
Basis of Forecast: Itemized ForecastBasis of Labor/Non-Labor Split: Itemized Forecast
Recorded Forecast

22
expected to remain constant over the forecast period. Unit costs are based on the recorded costs to 1
design and construct repairs; the total unit cost for design and repair is $1,913 per pole.43 2
5. Shareholder Costs 3
In D.13-09-028, the Commission approved a settlement agreement (Malibu Settlement) 4
between the SED and SCE resolving issues raised in the Malibu Canyon Fire OII, I.09-01-018. The 5
Malibu Settlement required SCE to spend $17 million of shareholder funds to perform pole loading 6
inspections and remediation in the Malibu area. The Commission further required SCE to perform work 7
along Malibu Canyon Road in conjunction with AT&T Mobility, LLC, Verizon Wireless, and Sprint 8
Communications Company under their settlement with the SED.44 9
In D.14-08-009, the Commission approved a settlement agreement (San Gabriel 10
Windstorm Settlement) between the SED and SCE resolving issues raised in I.14-03-004. The San 11
Gabriel Windstorm Settlement required SCE to spend $3 million of shareholder funds to reduce the 12
probability of overloaded poles. 13
The costs associated with the Settlement Agreement work are not included in the 14
recorded amounts shown here. The unit counts associated with shareholder-funded work are noted 15
separately in the appropriate sections. 16
D. Forecast Capital Expenditures 17
1. PLP-driven Pole Replacements 18
The annual volume of PLP-driven pole replacements is determined by the pace of 19
assessments, assessment remediation rates, and the rate at which these replacements are completed. The 20
expected remediation rates for assessments going forward are described in Section II.B.7 above. 21
After assessments, the poles identified as needing replacement are assigned due dates 22
based on severity. The due dates range from poles which must be made safe within 72 hours to poles 23
that can be scheduled for replacement within 59 months. 24
Sometimes, poles scheduled for replacement may not be remediated due to execution 25
constraints, such as environmental or permitting requirements or limited physical access to the pole due 26
to adjacent structures or remote locations. While SCE goes to great lengths to work with agencies and 27
43 Refer to WP SCE-02, Vol. 9, pp. 129-132 (PLP Distribution Repair Forecast and PLP Transmission Repair
Forecast). 44 D.13-09-028, issued 9/24/2013, OP 1.

23
property owners to get access to poles, a percentage of poles may roll over from the scheduled year for 1
remediation into the following year until these issues are resolved. 2
In other cases, performance of work in one location may offer the opportunity to replace 3
poles in the same location scheduled for replacement in future years. Those poles may be moved 4
forward from their scheduled year and bundled with other work in the current year to achieve 5
efficiencies.45 6
The table below summarizes the forecast rate of pole assessments, expected remediation 7
rates, the volume of poles in the replacement queue, and replacements performed each year. The volume 8
of poles replaced each year depends upon the priority levels of poles in the replacement queue, rollover 9
of poles due to execution challenges, and bundling of poles as described above. The attached 10
workpapers quantify these factors in detail.46 11
Forecast unit costs for replacement shown in Table II-9 are explained in Section IV 12
below and summarized in workpapers.47 13
45 The benefits of bundling work and portfolio management are described in Exhibit SCE-04, Vol. 2. 46 Refer to WP SCE-02, Vol. 9, pp. 135-136 (PLP Detailed Replacement Forecast Volume). 47 Refer to WP SCE-02, Vol. 9, pp. 137-138 ( Pole Replacement Unit Cost Forecast Details).

24
Table II-9 Forecast Assessments, Identified Replacements, and Scheduled Replacement Volumes:
Transmission and Distribution
Forecast capital expenditures in the PLP program are based on the forecast volume of 1
replacements in Table II-9 and on the forecast unit costs discussed in Section IV.C below. The resulting 2
forecast capital expenditures for PLP-driven distribution and transmission pole replacements are shown 3
in Figure II-3 and Figure II-4, respectively. 4
2016 2017 2018 2019 2020Assessments 200,000 220,000 230,000 230,000 230,000Reject Rate
Total 9% 9% 9% 9% 9% 9%
Reject CountTotal 18,000 19,800 20,700 20,700 20,700 Identified Prior to 2016 7,765 0 5 6,053 10,210
Poles in Queue 25,765 38,341 51,318 66,560 79,657
Total Replacements 7,224 7,723 5,458 7,602 11,932 7,224 7,723 8,331 8,331 8,331 6,853 7,060 7,342 7,342 7,342
370 663 989 989 989
Unit Cost, 2015 $Distribution 15,231$ 15,302$ 15,294$ 15,294$ 15,294$ Transmission 23,453$ 23,453$ 23,453$ 23,453$ 23,453$
Total Cost, 2015 $000Distribution 104,382$ 108,039$ 112,290$ 112,290$ 112,290$ Transmission 8,689$ 15,553$ 23,195$ 23,195$ 23,195$
Averaging 2018-2020DistributionTransmission

25
Figure II-3 Pole Loading Distribution Pole Replacements48
CET-PD-IR-PD Recorded 2011-2015/Forecast 2016-2020
(CPUC-Jurisdictional – Constant 2015 and Nominal $000)49
48 Refer to WP SCE-02, Vol. 9, pp. 64-81. 49 Refer to WP SCE-02, Vol. 9, pp. 139-140 (CET-PD-IR-PD Distribution PLP Pole Replacement) and Table
IV-23 for forecast unit costs, and Table II-9 for forecast unit volumes.
2011 2012 2013 2014 2015 2016 2017 2018 2019 2020Nominal $ - - - 5,263 147,324 106,353 112,368 119,731 123,488 127,414Constant 2015$ - - - 5,406 147,324 104,382 108,039 112,290 112,290 112,290
$0
$20,000
$40,000
$60,000
$80,000
$100,000
$120,000
$140,000
$160,000
Nominal $ Constant 2015$

26
Figure II-4 Pole Loading Transmission Pole Replacements50
CET-PD-IR-PT Recorded 2011-2015/Forecast 2016-2020
(Total Company – Constant 2015 and Nominal $000)51
2. Alternatives to Pole Replacement 1
SCE is evaluating the use of an Extended Truss (ET) to remediate poles that have a 2
noncompliant safety factor. SCE is assessing whether the installation of the ET is a viable restoration 3
method for poles with noncompliant safety factors. Since the ET will reach much farther up the length of 4
the pole than a standard steel stub which may be used to restore poles that have internal degradation, 5
new ET design and construction standards compatible with existing construction standards and required 6
clearances must be developed. Furthermore, if SCE decides to move forward with the ET, additional 7
time would be required to set up the ET in SCE’s IT systems, coordinate with joint owners, train 8
employees who will encounter the truss in the field, select and onboard vendors to install the truss and 9
develop work management processes. Because SCE has not made a decision on the feasibility of the ET, 10
and much work remains before that decision can be implemented, the forecast does not include ET 11
remediation. 12
50 Refer to WP SCE-02, Vol. 9, pp. 64-81. 51 Refer to WP SCE-02, Vol. 9, pp.141-142-y (CET-PD-IR-TR CET-PD-IR-PT Transmission PLP Pole
Replacement) and Table IV-24 for forecast unit costs, and Table II-9 for forecast unit volumes.
2011 2012 2013 2014 2015 2016 2017 2018 2019 2020Nominal $ - - - 68 9,574 8,808 16,116 24,628 25,277 25,940Constant 2015$ - - - 69 9,574 8,689 15,552 23,195 23,195 23,195
$0
$5,000
$10,000
$15,000
$20,000
$25,000
$30,000
Nominal $ Constant 2015$

27
3. Coordination of Pole Replacements with Other Programmatic Work 1
PLP program design and operations practices allow coordination with other 2
programmatic work when possible.52 First, SCE has a replacement timeframe for certain PLP failures of 3
up to 59 months. This timeframe enables lower-risk PLP failures to be addressed with other planned 4
work, which may occur prior to the replacement due date. Changes to the intrusive pole inspection 5
remediation timeframes (see Section III.B.2) will also permit bundling pole replacements with other 6
planned pole replacements, or other programmatic work. For example, an overhead conductor 7
replacement project may be combined with nearby deteriorated pole replacements. By grouping work, 8
SCE will minimize customer outages and customer disruption. SCE expects the work to be completed 9
more efficiently when grouped with other work in the same geographic area. 10
4. Transformer Replacements, PLP Portion 11
Distribution transformer replacements are described in SCE-02, Volume 2; a portion of 12
these replacements are associated with pole replacements under the PLP program. We determined the 13
PLP portion of distribution transformer replacements based on the ratio of PLP-driven transformer 14
capital expenditures and PLP-driven pole replacements authorized in the 2015 GRC decision (4.17%).53 15
The resulting forecast for PLP-related transformer replacements is shown below. (Figure II-5) 16
52 As stated in 2015 GRC testimony (SCE-03, Vol. 06, Part 2, p. 14) and D.15-11-021, p. 117. 53 Refer to WP SCE-02, Vol 9, pp. 143-144 (PLP Driven Prefab and Transformer Replacements).

28
Figure II-5 Transformer Capital Expenditures, PLP Portion54
WBS Element CET-PD-OT-TR-PL Recorded 2011-2015/Forecast 2016-2020
(CPUC-Jurisdictional – Constant 2015 and Nominal $000)
5. Prefabrication, PLP Portion 1
Capital expenditures for prefabrication are described in SCE-02, Volume 5; a portion of 2
these capital expenditures are associated with the PLP program. The PLP portion of prefabrication 3
capital expenditures was forecast based on the ratio of PLP-driven prefabrication expenditures and PLP-4
driven pole replacements authorized in the 2015 GRC decision (2.83%).55 The resulting forecast for 5
PLP-related prefabrication expenditures is shown below. (Figure II-6) 6
54 Refer to WP SCE-02, Vol. 9, pp. 64-81 and WP SCE-02, Vol 9, pp. 143-144 (PLP Driven Prefab and
Transformer Replacements). These expenditures are not included in the pole balancing account. 55 WP SCE-02, Vol 9, pp. 143-144 (PLP Driven Prefab and Transformer Replacements).

29
Figure II-6 Prefabrication Capital Expenditures, PLP Portion56
WBS Element CET-PD-OT-PF-PL Recorded 2011-2015/Forecast 2016-2020
(CPUC-Jurisdictional – Constant 2015 and Nominal $000)
56 Refer to WP SCE-02, Vol. 9, pp. 64-81, and WP SCE-02, Vol. 9, pp. 143-144 (PLP Driven Prefab and
Transformer Replacements). These expenditures are not included in the pole balancing account.
2011 2012 2013 2014 2015 2016 2017 2018 2019 2020Nominal $ - - - 148 3,976 3,260 3,638 4,088 4,217 4,351Constant 2015$ - - - 152 3,976 3,200 3,498 3,834 3,834 3,834
$0
$500
$1,000
$1,500
$2,000
$2,500
$3,000
$3,500
$4,000
$4,500
$5,000
Nominal $ Constant 2015$

30
1
DETERIORATED POLE PROGRAM 2
A. Background 3
Several factors drive inspection and replacement of SCE’s over 1.4 million poles, primarily 4
maintaining pole strength, which might be compromised due to pole deterioration or pole loading. The 5
programs to assess and remediate pole deterioration are included in this section. The Pole Loading 6
Program is discussed in Section II. SCE also performs pole replacements after storms, when vehicles or 7
other external factors damage poles, or when poles must be relocated, to name just a few scenarios. The 8
costs associated with these activities are included in the relevant accounts for those activities, and are 9
not included here. This chapter discusses pole inspections, maintenance, and replacement for 10
Distribution and Transmission poles due to deterioration. 11
B. Activity Description 12
1. Replacements Driven by Program Inspections 13
SCE established the distribution pole inspection program to comply with G.O. 165, 14
which became effective in 1997. G.O. 165 requires intrusive inspections for all poles at least 15 years 15
old to be completed within 10 years of program inception. Thereafter, it requires all poles to be 16
intrusively inspected by the time they are 25-years old and then re-inspected at least once every 20 17
years. SCE completed its first cycle of intrusive inspections in 2007. 18
G.O. 165 defines intrusive inspections as “involving movement of soil, taking samples 19
for analysis, and/or using more sophisticated diagnostic tools beyond visual inspections or instrument 20
reading.” “Intrusive” inspections involve drilling into the pole’s interior to identify and measure the 21
extent of internal decay which is typically undetectable with external observation alone. SCE’s 22
inspection standards describe six types of inspections satisfying this definition which apply different 23
combinations of digging, boring, and sounding depending on the type of pole and its setting. Intrusive 24
inspectors may also perform a visual inspection on poles that are in the inspection grid but that are 25
younger than 15 years old, or that have already had an intrusive inspection within the last 10 years, to 26
look for signs of obvious external damage such as damage from vehicles or woodpeckers. 27
Poles due for inspection under G.O. 165 guidelines in any year are spread over SCE’s 28
50,000 square-mile service territory, often requiring significant drive time between poles. Moreover, the 29
number of inspections due any year can vary significantly from year-to-year, depending on the ages of 30
the poles and when the last inspections were performed. This can lead to significant variation in the 31

31
number of pole replacements required from one year to the next. Both are inefficient for resource 1
allocation. 2
These inspections require inspectors with proper training and experience. Maintaining a 3
stable inspection workforce is key to a successful intrusive inspection program. In 2009, SCE performed 4
inspections on a “grid” basis to reduce travel time per inspection and to levelize the number of 5
inspections (and therefore replacements) required per year. Besides inspecting every pole due under the 6
minimum G.O. 165 requirements, SCE inspected all poles within a defined area or “grid” during the 7
same year. All poles receiving intrusive inspections within the grid will be due for their next inspection 8
in the same future year. 9
In 2009, SCE also began transitioning to a 10-year inspection cycle that meets and 10
exceeds G.O. 165 requirements and matches industry best practices. The other two California IOUs, 11
SDG&E and PG&E, have also transitioned to 10-year pole inspection cycles. SCE performs both a 12
visual and an intrusive inspection on every pole due for an intrusive inspection under G.O. 165. For 13
poles not due for an intrusive inspection until the next inspection cycle, SCE only performs a visual 14
inspection. A new pole might be installed within a grid three years after that grid underwent intrusive 15
inspections; seven years later, all poles in that grid will be inspected again. To meet G.O. 165 16
requirements, this pole must be intrusively inspected at least once before the end of its 25th year. 17
However, under the grid-based system it will be inspected twice, once at age 7 and again at age 17. 18
Here, SCE performs a visual inspection in the pole’s 7th year and an intrusive inspection in its 17th year 19
meeting G.O. 165’s requirement. 20
SCE expects to complete its first grid-based cycle in 2018. Completing this transition will 21
cause lower cost per inspection, as shown in Table III-18. Maintaining a steady rate of inspections is 22
necessary to maintain this cost advantage, as non-grid inspections are more expensive than grid-based 23
inspections.57 The grid-based approach yields reduced inspection intervals with a less than proportional 24
increase in average annual inspection costs. Shorter inspection intervals reduce prevalence and severity 25
of pole decay. 26
2. Changes in the Intrusive Pole Inspection Program Standards 27
Three changes were made to inspections standards since 2012 that impact the recorded 28
and forecast rates of pole replacement under the Deteriorated Pole Program. The first change, which 29
57 See A.13-11-003, Exhibit SCE-03, Vol. 07 Part 1 p. 39.

32
took effect in 2013, included clarification of visual reject criteria and reclassified replacement 1
timeframes for certain poles from longer to shorter timeframes. Clarification of visual reject criteria, 2
along with a relatively large proportion of inspections being performed in regions prone to wildlife-3
driven pole damage, resulted in higher than anticipated overall failure rates. In addition, SCE 4
reclassified certain pole structure types58 with decay as one-year rather than two or three-year 5
replacements due to concerns about the potential risk posed by these structures if decay is present. This 6
drove up the required minimum volumes of replacements in the short term. This change contributed to 7
the increase in deteriorated pole replacements relative to the 2015 GRC forecast, which relied on 2011 8
and 2012 inspection failure rates. 9
Table III-10 Historical Reject Rates for Intrusive Pole Inspections
The second and third changes, which took effect in 2016, will reduce replacement rates 10
by changing the criteria for when a pole must be replaced and by reinforcing poles with a steel stub as an 11
alternative to replacement.59 In SCE’s 2015 GRC, the Commission challenged SCE to consider 12
reinforcing poles to avoid a replacement and to reduce the number of poles being replaced.60 To evaluate 13
potential changes to the standards, a team was formed to consider the estimated cost savings, the change 14
in risk and benchmarking of other utilities. 15
Intrusive pole inspection standards are described in SCE’s material standard MS-454. 16
MS-454 provides detailed instructions to inspectors on performing inspections and evaluating inspection 17
results, including a definition of key metrics that determine pole inspection failure. Among these metrics 18
58 Poles with equipment and poles with pole-top extensions. 59 Steel stubbing is described in IV.B.2. 60 D15-11-021, Page 135. While the comment was made in the pole loading discussion section, SCE believes
the commission’s intent is equally applicable to other pole replacements. Therefore, SCE considered alternative methods to remediate noncompliant poles through alternative methods.
Inspection YearAggregate Failure Rate
(Distribution and Transmission)
2013-2015 8%
2008-2012 7%
2001-2007 17%

33
is Remaining Section Modulus (RSM), a numerical assessment of pole degradation. The team evaluated 1
various levels of RSM to determine at what level of degradation the pole should fail the intrusive 2
inspection and at what level of degradation a steel stub installation would be appropriate if the pole 3
failed. The team analyzed the customer savings versus the risk increase for various pole failure 4
thresholds. SCE selected the failure threshold based on the point where the incremental increase in 5
savings did not justify the increased risk. Relative to the benchmarked utilities, SCE appears more 6
conservative in its RSM failure threshold. However, since pole populations, construction practices, 7
environmental conditions etc. vary significantly between utilities, SCE relied on its risk modeling and 8
determined that accepting the risk from additional degradation was not justified. 9
The new standard, introduced in April 2016, includes the second and third change 10
referenced above. The second change will reduce the pole failure threshold to 95% RSM. The change in 11
failure threshold will reduce forecast distribution pole replacement rates from 7.6% to 5.8% and 12
transmission pole replacement rates from 12.5% to 6.2% (Table III-11). With forecast distribution and 13
transmission inspection volumes of 135,000 and 13,000, respectively, in 2017 (Table III-18), this change 14
will cause approximately 2,400 fewer three-year distribution pole replacements and approximately 800 15
fewer three-year transmission pole starting in 2020. The third change will set the allowed RSM 16
threshold for installation of a steel stub to a minimum RSM of 67%.61 This will further reduce the count 17
of pole replacements by an average of approximately 1,700 distribution poles and 180 transmission 18
poles per year from 2017 through 2020. 19
61 Additional criteria described in MS-454 also apply. Refer to WP SCE-02, Vol. 9, pp. 145-207.

34
Table III-11 Impact of Inspection Standard Changes on Forecast Restoration and Replacement
Rates
3. Restoration (steel stubbing) 1
Steel stubbing is expected to extend the life of a deteriorated pole over 15 years and 2
likely much more than that. 3
Steel stubbing offers a significant cost advantage over pole replacement without 4
compromising safety: the forecast unit cost for stubbing is $4,190 for transmission poles and $2,155 for 5
distribution poles,62 compared to a unit cost of $23,453 (Table IV-24) for transmission pole replacement 6
and a weighted average of $15,169 (Table IV-23) for distribution pole replacements. 7
SCE anticipates that approximately 2% of its inspected poles will be steel stub candidates 8
based on their RSM and other criteria established in the inspection standards (Table III-11). Of these, 9
SCE estimates that 10% will be reclassified as replacements after a more detailed evaluation of field 10
circumstances. The expected count of pole restorations is shown in Table III-12 and Table III-13. 11
62 Refer to WP SCE-02, Vol. 9, pp. 208-209, (CET-PD-IR-DP CET-PD-IR-TR Steel Stub Unit Cost Estimate).
2015 Reject Rate (Before SPEC
Change)
Estimated 2015 Reject Rate (After SPEC
Change)
1 Year 5.30% 0.94%
2 Years 1.06% 1.70%
3 Years 1.19% 1.11%
Steel Stub Repairs 0.08% 2.00%
7.63% 5.75%
Distribution Reject Rates
Reject Rate By Priority - Recommended Action (RAC)
Total
2015 Reject Rate (Before SPEC Change)
Estimated 2015 Reject Rate (After SPEC
Change)
1 Year 7.15% 0.74%
2 Years 1.53% 2.38%
3 Years 3.62% 1.11%
Steel Stub Repairs 0.20% 2.00%
12.50% 6.23%
Transmission Reject Rates
Reject Rate By Priority - Recommended Action (RAC)
Total

35
4. Inspection-driven Replacements 1
The annual volume of inspection-driven deteriorated pole remediations determines the 2
rates at which poles flow into the remediation queue, and the rate at which these remediations are 3
completed. The expected remediation rates for intrusive inspections are described in the previous 4
section. 5
After inspection, the poles identified as needing replacement are prioritized based on the 6
extent of deterioration. The priority ratings are: 7
1. Priority 1, the pole must be made safe within 72 hours and replaced within 45 days of 8
inspection 9
2. Priority 2A, the pole must be replaced within one year of inspection 10
3. Priority 2B, the pole needs to be replaced within two years of inspection 11
4. Priority 2C, the pole needs to be replaced within three years of inspection63 12
Sometimes, poles scheduled for replacement may not be remediated due to factors such 13
as unique permitting requirements or limited physical access to the pole due to adjacent structures or 14
remote locations. A percentage of poles may rollover from the scheduled year for remediation into the 15
following year until these issues are resolved. 16
In other cases, performance of work in one location may offer the opportunity to replace 17
poles in the same location scheduled for replacement in future years. Those poles may be moved 18
forward from their scheduled year and bundled with poles in the current year to achieve efficiencies. 19
The table below summarizes the forecast rate of pole inspections, the expected 20
remediation rates by priority level, forecast replacements by scheduled year of replacement, and rollover 21
and bundling for inspection-driven deteriorated pole replacements.64 Unit rates applied to these forecast 22
volumes are described in Section IV below and summarized in workpapers.65 23
63 The visual and RSM criteria for each timeframe are described in MS-454. Refer to WP SCE-02, Vol. 9, pp.
145-207. 64 Refer to WP SCE-02, Vol. 9, pp. 210-211 (IPI Driven Deteriorated Pole Replacement Detailed Forecast
Distribution), WP SCE-02, Vol. 9, pp. 212-213 (IPI Driven Deteriorated Pole Replacement Detailed Forecast Transmission) for details.
65 Refer to WP SCE-02, Vol. 9, pp. 137-138 (Pole Replacement Unit Cost Forecast Details).

36
Table III-12 Forecast Inspection Volumes, Remediation rates, and Inspection-Driven Pole
Remediation: Distribution
2017 2018 2019 2020Q1 Q2-4
Intrusive Inspections 36,739 108,000 135,000 128,500 120,500 120,500Failure Rate
Total 7.63% 5.75% 5.75% 5.75% 5.75% 5.75%
Failure CountTotal 2,803 6,210 7,763 7,389 6,929 6,929
Scheduled ReplacementsIdentified in 2016 or later 381 3,034 3,686 5,375 4,991Identified Prior to 2016 9,809 1,892 1,323 6 0Rollover & Bundling Adjustment (1,632) 1878 1071 635 630
Total Replacements 8,558 6,804 6,080 6,016 5,621 Averaging 2018-2020 8,558 6,804 5,906 5,906 5,906
Unit Cost, 2015 $Replacement 14,722$ 14,794$ 14,785$ 14,785$ 14,785$ Steel Stub 2,155$ 2,155$ 2,155$ 2,155$ 2,155$
Replacement Total Cost, 2015 $000 125,995$ 100,657$ 87,319$ 87,319$ 87,319$
Steel stub count - 648 1,458 2,229 2,304
Steel stub total (Constant $000) -$ 1,396$ 3,142$ 4,803$ 4,965$
Total Expenditures (2015 $000) 125,995 102,053 90,461 92,123 92,285
2016

37
Table III-13 Forecast Inspection Volumes, Remediation rates, and Inspection-driven Deteriorated
Pole Remediation: Transmission
5. Replacements Driven by Non-Programmatic Activities 1
Besides poles identified because of the formal inspection program, poles identified in 2
other activities may be submitted to the deteriorated pole program for replacement based on their 3
external condition. If these poles meet the criteria for external decay outlined in the program standard, 4
they are prioritized according to the standard for replacement in the Deteriorated Pole program. 5
Forecast volumes of replacements driven by non-programmatic activities are based on the 6
counts of poles identified in 2015 for same-year, one-year, and two-year replacement timeframes. As for 7
poles identified through inspections, sometimes a pole may be replaced after the original scheduled 8
timeframe due to issues such as permitting and physical access, or prior to the scheduled timeframe if 9
bundling opportunities are available. The table below summarizes the expected rates of identification, 10
2017 2018 2019 2020Q1 Q2-4
Intrusive Inspections 1,446 12,000 13,000 15,500 12,000 12,000Failure Rate
Total 12.50% 6.23% 6.23% 6.23% 6.23% 6.23%Failure Count
Total 181 748 810 966 748 748
Scheduled ReplacementsIdentified in 2016 or later 87 200 423 634 621Identified Prior to 2016 2,234 526 392 0 0Rollover & Bundling Adjustment (362) 439 176 102 77
Total Replacements 1,959 1,165 991 736 698 Averaging 2018-2020 1,959 1,165 809 809 809
ReplacementsUnit Cost (2015 $) 23,453$ 23,453$ 23,453$ 23,453$ 23,453$ Total Cost (2015 $000) 45,935$ 27,332$ 18,966$ 18,966$ 18,966$
Steel StubUnit Cost (2015 $) 4,190 4,190 4,190 4,190 4,190 Count - 72 150 243 243 Total Cost (2015 $000) - 302 629 1,018 1,018
Total Expenditure (Constant $000) 45,935 27,634 19,594 19,984 19,984
2016

38
scheduled replacement, rollover and bundling for these poles (Table III-14 and Table III-15).66 Unit 1
rates applied to these forecast volumes are described in Section IV below and summarized in 2
workpapers.67 3
Table III-14 Forecast Identification and Replacement of Deteriorated Poles Identified through
Other Activities, Distribution
66 Refer to WP SCE-02, Vol. 9, pp. 214-215 (Other Deteriorated Pole Replacement Detailed Forecast
Distribution), and WP SCE-02, Vol. 9, pp. 216-217 (Other Deteriorated Pole Replacement Detailed Forecast Transmission).
67 Refer to WP SCE-02, Vol 9, pp.137-138 (Pole Replacement Unit Cost Forecast Details).

39
Table III-15 Forecast Identification and Replacement of Deteriorated Poles Identified through
Other Activities, Transmission
6. Replacements Driven by Pole Loading Calculation Failures 1
Pole loading calculations (PLC) performed in the course of design work for programs 2
outside of the Pole Loading Program may identify poles that do not meet GO 95 standards. Planners 3
perform pole loading calculations as part of day-to-day work when they plan to add new equipment to a 4
pole, such as a transformer, capacitor bank, or conductor wire. The planner first performs a pole loading 5
calculation on the pole “as-is,” in its current state, assuming only the currently attached equipment is in 6
place. If the pole does not satisfy compliance requirements “as-is,” the cost of its replacement is 7
included in the Deteriorated Pole program. These PLC failures generally require larger pole 8
replacements on average than intrusive inspection failures or pole loading failures within the PLP 9
program, because these poles are designed to support additional equipment beyond what is on the in-10
service pole. These PLC failures are included within the Deteriorated Pole replacement program. 11
Forecast volumes of replacement driven non-PLP PLC failures are based on the counts of 12
poles identified in 2015 for same-year, one-year, and two-year replacement timeframes. These recorded 13
levels are reduced to reflect the expected impact of changes to the SPIDACalc pole loading tool 14
described in Section II.B.1. Sometimes poles may be replaced after the original scheduled timeframe 15
due to issues such as permitting and physical access, or prior to the scheduled timeframe if bundling 16
opportunities are available. The table below summarizes the expected rates of identification, scheduled 17
2016 2017 2018 2019 2020Total Found 1,479 1,479 1,479 1,479 1,479
Scheduled ReplacementsIdentified in 2016 or later 4 422 509 1,427 1,427Identified Prior to 2016 1,398 1,129 904 6 1Rollover & Bundling Adjustment (219) 242 272 174 168
Total Replacements 1,183 1,793 1,685 1,607 1,596 Averaging 2018-2020 1,183 1,793 1,630 1,630 1,630
Unit Cost (2015 $) 23,453$ 23,453$ 23,453$ 23,453$ 23,453$ Total Cost (2015 $000) 27,747$ 42,050$ 38,217$ 38,217$ 38,217$

40
replacement, rollover and bundling for these poles (Table III-16 and Table III-17).68 Unit rates applied 1
to these forecast volumes are described in Section IV below and summarized in workpapers.69 2
Table III-16 Forecast Identification and Replacement of PLC Failures in Deteriorated Pole
Program, Distribution
68 Refer to WP SCE-02, Vol. 9, pp. 218-219 (NonPLP PLC Driven Replacement Detailed forecast Distribution)
and WP SCE-02, Vol. 9, pp. 220-221 (Non PLP PLC Driven Replacement Detailed forecast Transmission). 69 Refer to WP SCE-02, Vol. 9, pp. 137-138 (Pole Replacement Unit Cost Forecast Details).
2016 2017 2018 2019 2020Total Found 1,545 1,545 1,545 1,545 1,545
Scheduled ReplacementsIdentified in 2016 or Later 103 1,395 1,545 1,545 1,545Identified Prior to 2016 3,366 132 1 2 7Rollover & Bundling Adjustment (556) 643 341 198 183
Total Replacements 2,914 2,169 1,887 1,745 1,735 Averaging 2018-2020 2,914 2,169 1,789 1,789 1,789
Unit Cost, 2015 $ 16,756$ 16,827$ 16,819$ 16,819$ 16,819$
Total cost (2015 $000) 48,818$ 36,506$ 30,091$ 30,091$ 30,091$
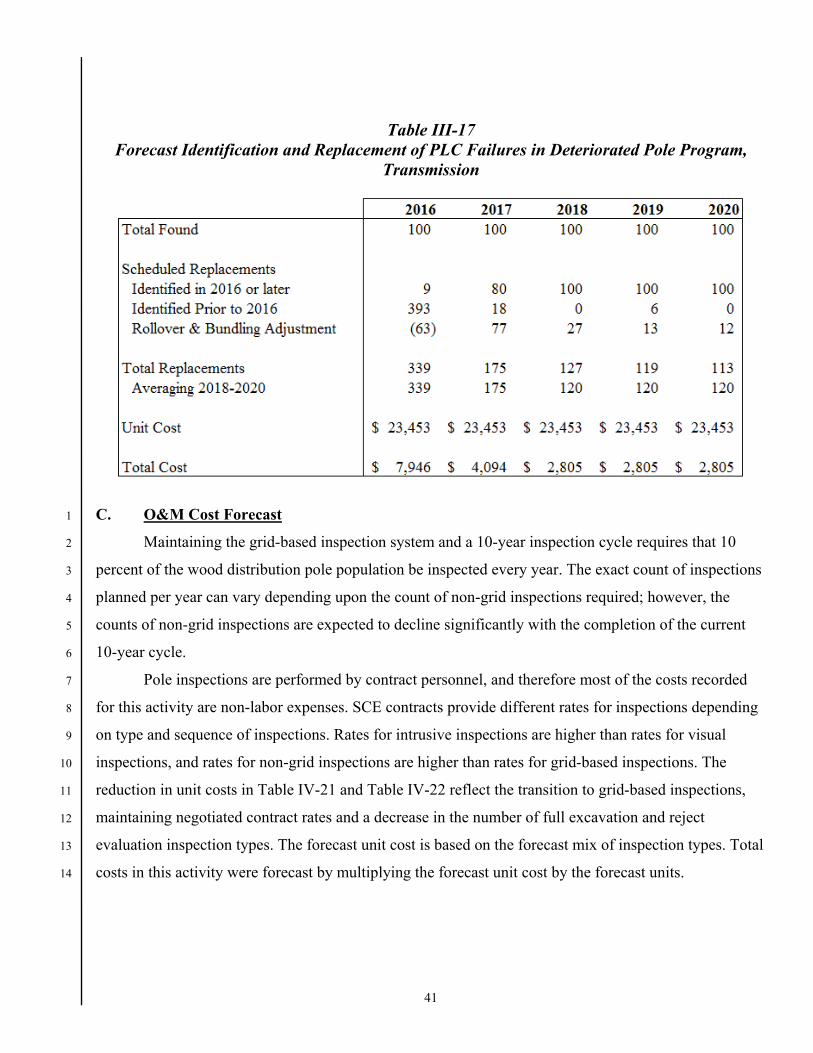
41
Table III-17 Forecast Identification and Replacement of PLC Failures in Deteriorated Pole Program,
Transmission
C. O&M Cost Forecast 1
Maintaining the grid-based inspection system and a 10-year inspection cycle requires that 10 2
percent of the wood distribution pole population be inspected every year. The exact count of inspections 3
planned per year can vary depending upon the count of non-grid inspections required; however, the 4
counts of non-grid inspections are expected to decline significantly with the completion of the current 5
10-year cycle. 6
Pole inspections are performed by contract personnel, and therefore most of the costs recorded 7
for this activity are non-labor expenses. SCE contracts provide different rates for inspections depending 8
on type and sequence of inspections. Rates for intrusive inspections are higher than rates for visual 9
inspections, and rates for non-grid inspections are higher than rates for grid-based inspections. The 10
reduction in unit costs in Table IV-21 and Table IV-22 reflect the transition to grid-based inspections, 11
maintaining negotiated contract rates and a decrease in the number of full excavation and reject 12
evaluation inspection types. The forecast unit cost is based on the forecast mix of inspection types. Total 13
costs in this activity were forecast by multiplying the forecast unit cost by the forecast units. 14

42
Costs associated with distribution and transmission pole inspections (visual and intrusive) are 1
shown in Table III-18. Transmission wood pole inspections are performed on both a grid and circuit 2
basis under SCE’s maintenance practices on file with the California Independent System Operator. 3
Table III-18 Deteriorated Pole Inspections70
Portions of GRC Account 566.125 and 583.125 Recorded and Adjusted 2011-2015/ Forecast 2016-18
(Constant 2015 $000)71
Intrusive pole inspection costs are primarily driven by contractor rates for grid and non-grid 4
inspections. The mix of grid and non-grid inspections varies over time, but will decline as SCE 5
completes its first full ten year grid cycle. 6
70 Refer to WP SCE-02, Vol. 9, pp.1-63. 71 Refer to WP SCE-02, Vol. 9, pp. 222-223 (Det Pole Inspection Forecast Distribution) and WP SCE-02, Vol.
9, pp. 224-225, (Det Pole Inspection Forecast Transmission).
2011 2012 2013 2014 2015 2016 2017 2018566.125
Labor $11 $37 $67 $41 $34 $28 $28 $28Non-Labor $814 $689 $1,283 $642 $479 $657 $551 $657 Subtotal 566.125 $826 $726 $1,350 $683 $513 $685 $579 $685
583.125Labor $259 $372 $644 $675 $743 $249 $249 $249Non-Labor $4,296 $2,814 $7,514 $5,353 $5,299 $5,926 $4,972 $4,734 Subtotal 583.125 $4,555 $3,186 $8,158 $6,028 $6,042 $6,176 $5,222 $4,984
Total $5,381 $3,912 $9,508 $6,712 $6,556 $6,860 $5,801 $5,668
Labor $270 $409 $711 $716 $777 $277 $277 $277Non-Labor $5,111 $3,503 $8,797 $5,995 $5,779 $6,583 $5,524 $5,391
566.125Inspections 13,896 14,074 22,380 15,429 12,930 13,870 13,000 15,500Unit Cost $59 $52 $60 $44 $40 $49 $45 $44583.125Inspections 98,323 74,075 170,614 126,263 131,183 144,130 135,000 128,500Cost Per Inspection $46 $43 $48 $48 $46 $43 $39 $39
Ratio of Labor to Total 5% 10% 7% 11% 12% 4% 5% 5%
Basis of Forecast: Itemized ForecastBasis of Labor/Non-Labor Split: Itemized Forecast
Recorded Forecast

43
D. Deteriorated Pole Capital Replacements 1
This section summarizes the capital expenditures associated with distribution and transmission 2
pole remediation in the deteriorated pole program. The volumes of replacements and steel stubbing 3
anticipated have been described in the previous sections. To these volumes, the unit costs described in 4
Section IV.C below are applied to determine forecast capital expenditures for these activities. 5
Table III-19 Distribution Deteriorated Pole Replacement and Restorations72,73
CET-PD-IR-DP, CET-PD-IR-DL Recorded 2011-2015/Forecast 2016-202074
(CPUC-Jurisdictional – Constant 2015 and Nominal $000)
72 Refer to WP SCE-02, Vol. 9, pp. 64-81. 73 Expenditures associated with the Aged Pole Program are not included in this graph. 74 Refer to WP SCE-02, Vol. 9, pp. 137-138 (Pole Replacement Unit Cost Forecast Details) and Table IV-23 for
forecast unit costs, and Table III-12, Table III-14, and Table III-16 for forecast volumes.

44
Table III-20 Transmission Deteriorated Pole Replacement and Restoration75
CET-PD-IR-TR, CET-PD-IR-TL Recorded 2011-2015/Forecast 2016-202076
(Total Company – Constant 2015 and Nominal $000)
75 Refer to WP SCE-02, Vol. 9, pp. 64-81. 76 Refer to WP SCE-02, Vol. 9, pp. 137-138 (Pole Replacement Unit Cost Forecast Details) for forecast unit
costs, and Table III-13, Table III-15, and Table III-17for forecast volumes.
2011 2012 2013 2014 2015 2016 2017 2018 2019 2020Nominal $ $13,166 $16,918 $25,502 $64,557 $95,607 $82,748 $76,451 $64,362 $66,482 $68,224Constant 2015$ $14,020 $17,798 $26,326 $65,491 $95,607 $81,629 $73,777 $60,616 $61,006 $61,006
$0
$20,000
$40,000
$60,000
$80,000
$100,000
$120,000
Nominal $ Constant 2015$Forecast

45
1
POLE CAPITAL REMEDIATION UNIT COSTS 2
A. Pole Replacement Unit Cost Summary 3
The Deteriorated Pole Program and Pole Loading Program capital forecasts are based on the 4
following drivers and their specific unit costs: 5
Deterioration-driven pole replacement unit costs: These replacements are poles that fail 6
inspection criteria, including intrusive pole inspections and visual inspections. 7
Pole Loading Calculation (PLC)-driven pole replacement unit costs: As described in 8
Section III.B.6 above, in the course of day-to-day work planners may find poles that do 9
not meet GO 95 standards or SCE’s internal standards in their current state. The cost of 10
such replacements is included in the Deteriorated Pole Program.77 These replacements 11
would require a pole upgrade to meet their current loads, and require a larger pole to meet 12
the current wind loading criteria revised in March 2014 and to accommodate the 13
additional equipment. 14
PLP-driven pole replacement unit costs: These replacements are PLC failures, but differ 15
from the Planner-driven replacements discussed immediately above because these are 16
identified through SCE’s Pole Loading Program described in Section III of this volume. 17
Pole strengthening/restoration (Steel Stubbing) unit cost: These represent a subset of 18
deteriorated poles which will be remediated by the installation of a reinforcing steel stub 19
instead of being replaced. 20
Each unit cost reflects drivers unique to the activity requiring the replacement. The historical 21
variance in these unit costs and forecast unit costs for these activities are described in the following 22
sections. 23
The cost drivers described in Sections IV.B and IV.C below, including ongoing cost reduction 24
efforts described in SCE-02, Vol. 1, will result in a distribution replacement unit cost averaging $14,100 25
for 2018-2020, 3% below the recorded costs for 2015. 26
77 If the pole passes pole loading “as is”, but fails pole loading with the additional equipment, the cost for that
pole replacement will be recorded to the project driving the replacement and will not be shown in this volume.

46
B. Unit Cost Variance Analysis 1
1. Distribution Pole Unit Cost Analysis 2
In the 2015 GRC, SCE reported a recorded unit cost equivalent to $13,304 in 2015 3
dollars for distribution pole replacements.78 In 2015, the recorded unit cost for distribution pole 4
replacements, including PLP replacements, increased to $14,554 in 2015 dollars, a 9% increase in 5
constant dollars over 2012. (Note that all percentages in this Section II.B are relative to the 2012 6
recorded unit cost). The contributions to the overall variance are summarized in Table IV-21. 7
Table IV-2179,80 Distribution Pole Unit Cost Variance Analysis
An increase in contractor costs was the main component of the unit cost increase (a 12% 8
increase relative to the 2012 unit cost). SCE resources support pole replacements as well as other capital 9
78 In the 2015 GRC, SCE reported a recorded unit cost of $12,123 (in 2012 $) for distribution pole
replacements, the equivalent of $13,304 in 2015 dollars, and proposed $12,130 as its forecast. In D.15-11-021, the Commission authorized a unit cost of $11,766 in 2012 dollars ($12,913 in 2015 dollars), a 3% reduction. This section focuses on recorded cost; the following section discusses adjustments to the recorded costs that will be incorporated into forecasts.
79 Refer to WP SCE-02, Vol. 9, pp. 226-227 (Distribution Pole Replacement Unit Cost Detailed Variance Analysis) for additional detail.
80 Corporate overheads (row 9) are discussed Mr. Gunn’s testimony in SCE-9, Vol. 02; division overheads (row 5) are discussed in MDR 1.A.12.
1 Contractor 7,180$ 8,826$ 1,646 12%
2 Labor 899$ 618$ (281) -2%
3 Material 956$ 1,884$ 928 7% Larger poles required by updated pole loading methodology
4 Other 318$ 255$ (63) 0%
5 Overhead 3,820$ 2,255$ (1,565) -12% Capital spending increased while total overhead remained constant resulting in a lower allocation to pole
spend
6 Underbuild 132$ 626$ 494 4% Increase in ratio of transmission to distribution pole replacements
7 Environmental 90$ 90 1% Environmental costs inadvertantly excluded from 2012 request
8 Totals 13,304$ 14,554$ 1,250$ 9%
9 Corporate Overhead 1,780$ 1,165$ (615)$
Row #Summary of Drivers
(See following testimony for details)
Increased work volume required increased utilization of contractors and premium time
Unit Cost Component2012 Unit Cost
(2015 $)2015 Unit Cost
(2015 $)
Variance as % of 2012 total
unit cost
Variance in 2015 $

47
and maintenance work. As the volume of work in many areas increased, SCE resources were not 1
adequate to handle the increased volume; therefore contract resources were assigned much of this work. 2
The increase in contractor costs were partially offset by lower SCE labor costs. Table IV-21 shows a 2% 3
decrease relative to the 2012 unit cost. This decrease is only for direct labor of SCE employees, and does 4
not include corporate overheads costs, such as pensions and benefits, Administrative and General 5
expenses or payroll taxes. Contractor charges do include these costs and a profit component; as a result, 6
a shift from SCE labor to contractors will appear to overstate the actual increase in unit costs.81 7
Material costs contributed 7% to the increase in unit costs. Several changes were made to 8
improve the safety and reliability of the poles between 2012 and 2015, which required larger 9
replacement poles. These changes included an increase in clearance requirements, the implementation of 10
SPIDACalc, and introducing higher wind loading standards throughout SCE’s service territory. 11
These changes are notable in the PLC-driven unit costs, accounting for nearly 30% of the 12
overall increase in unit costs.82 PLC-driven pole replacements are those required when planners perform 13
a pole loading calculation as part of day to day work when they plan to add new equipment to a pole, 14
such as a transformer, capacitor bank, or conductor wire. The planner first performs a pole loading 15
calculation on the pole “as-is,” in its current state, assuming only the currently attached equipment is in 16
place. If the pole does not satisfy compliance requirements “as-is,” the cost of its replacement is 17
included in the Deteriorated Pole Program.83 These replacements on average require larger poles than 18
either IPI or PLP replacements, since the replacement pole will often carry larger or additional 19
equipment loads. Therefore, even though the pole failed pole loading with the existing equipment, the 20
replacement pole must be designed to accommodate the new equipment, resulting in a larger pole. The 21
Deteriorated Pole Program has also replaced larger numbers of PLC-driven poles: while approximately 22
1,000 were identified in 2012, over 2,600 were identified in 2015. 23
A component of the cost labeled “Underbuild” contributed 4% to the overall increase. 24
When a pole contains both Transmission and Distribution equipment, SCE refers to it as a ‘combo’ pole. 25
When a combo pole is replaced, the cost to set the new pole and transfer the Transmission equipment is 26
81 Corporate overheads per pole in 2012 equaled $1,780 in 2015 dollars and in 2015 declined to $1,165 as
shown in Row 9 of Table IV-21, a drop which offsets approximately half the $1,250 increase in unit cost. Corporate overheads are discussed Mr. Gunn’s testimony in SCE-9, Vol. 02.
82 Refer to WP SCE-02, Vol. 9, pp.226-227 (Distribution Pole Replacement Unit Cost Detailed Variance Analysis) for additional detail.
83 If the pole passes pole loading “as is”, but fails pole loading with the additional equipment, the cost for that pole replacement will be recorded to the project driving the replacement and will not be shown in this volume.

48
charged to the Transmission budget. The cost to transfer the Distribution equipment is charged to the 1
Distribution budget. This distribution work is called underbuild. The unit count for the pole replacement 2
shows up in the Transmission pole count. Therefore, Distribution unit costs include the cost of 3
Distribution work on combo poles, but include no corresponding unit count. This would not affect unit 4
costs if both transmission and distribution pole replacement volumes grew at the same rate. However, 5
Transmission pole replacements grew faster than Distribution pole replacements. Between 2012 and 6
2015, the ratio of transmission poles replaced to distribution poles replaced increased significantly, from 7
one transmission pole replacement for every ten distribution pole replacements in 2012 to one 8
transmission pole replacement for every seven distribution pole replacements in 2015 (see Table I-5 for 9
recorded counts). Therefore, more cost from the distribution work on a combo pole replacement is being 10
recorded to distribution without a corresponding pole count. The result is an increase in the Distribution 11
pole unit cost. 12
Environmental costs were inadvertently excluded from the unitized work order data used 13
to develop the distribution unit cost estimate provided in the 2015 GRC.84 While these costs were 14
included in the total recorded costs for the program, the unitized work order data used to develop unit 15
cost estimates did not incorporate these costs. These are necessary costs that SCE did incur. The 16
environmental costs based on the 2015 recorded unit cost contributes 1% to the overall variance. 17
As environmental requirements increase, these costs will likely increase as well. For 18
example, as a result of the adoption of a local coastal plan by Los Angeles County for the Santa Monica 19
Mountains local coastal area, Los Angeles Department of Regional Planning (LADRP) is now 20
responsible for issuing coastal permits in the Santa Monica Mountains on behalf of the California 21
Coastal Commission. In the past, SCE performed routine maintenance and replacement work without 22
the need to obtain formal coastal development permits or exemptions. However, LADRP has 23
implemented an approval process where SCE must pay an application fee of $1,200 to apply for a 24
coastal permit exemption, though under specified circumstances up to 20 poles can potentially be 25
grouped into one exemption application. When a coastal development permit and variance are required, 26
an application fee of up to $20,000 applies, though under certain circumstances up to 5 poles could 27
potentially be grouped into one application. The coastal permitting process will take up to two years 28
prior to issuance of a permit. In addition, the cost to prepare each coastal permit application will range 29
84 For a discussion of the environmental work associated with pole replacements, please see SCE-02, Vol. 12.

49
between $5,000 and $10,000 per submission. SCE is currently negotiating with LADRP to streamline 1
the process and requirements. Despite these developments, SCE has not forecast any increase in 2
permitting costs over the 2015 historical values. 3
These cost increases were largely offset by a 12% decrease in division overhead cost 4
relative to 2012. As the workload increased, SCE’s existing regional and district locations and staff 5
achieved greater levels of productivity. Consequently, more capital work was completed with only a 6
moderate increase in division overhead cost. The result was a lower allocation of division overheads to 7
pole spending and a lower per pole unit cost. 8
2. Transmission Pole Unit Cost Analysis 9
SCE’s 2012 recorded transmission pole replacement unit cost was $19,800 per pole 10
(2012 $) or $20,830 per pole (2015 $). In 2015, SCE’s recorded cost for transmission pole replacements 11
increased by 6% to $22,065 per pole. The contributions to this variance are summarized in Table IV-22. 12
Table IV-22 Transmission Pole Unit Cost Variance Analysis
As with distribution pole replacements, contractor costs represented the single largest 13
driver of this increase, and a combination of increased volumes and constrained SCE resources led to an 14
increase in premium time relative to 2012. The use of premium time for both SCE and contractor crews 15
is often necessary to accommodate city or commercial customer requirements that work be performed 16
during certain hours. These increases were partially offset by declines in overhead, which were driven 17
by a change in overhead methodologies as described above. 18
1 Contractor 10,157$ 11,970$ 1,813$
2 Labor 2,837$ 3,077$ 240$
3 Material 4,000$ 4,090$ 90$ Larger poles required by updated pole loading methodology
4 Other 1,008$ 792$ (216)$
5 Overhead 2,828$ 2,137$ (692)$ Capital spending increased while total overhead remained constant resulting in a lower allocation to pole
spend
Totals 20,830$ 22,065$ 1,236$
7 Corporate Overhead 3,324$ 3,726$ 402$
1%
0%
-1%
-3%
6%
Variance as % of 2012 total
unit cost
9%
Row #
6
Summary of Drivers (See following testimony for details)
Increased work volume required increased utilization of contractors and premium time
2012 Unit Cost (2015 $)
Variance in 2015 $
Unit Cost Component2015 Recorded
(2015 $)

50
C. Unit Cost Forecast Development 1
We developed unit costs for pole replacement based on the recorded costs and unit quantities in 2
work orders closed in 2015. We aggregated unit costs by region, and developed a blended unit cost for 3
each activity based on the forecast regional mix of poles to be replaced in 2016. In addition, the 2015 4
rate was adjusted downward to reflect an anticipated reduction in material costs due to a shift in lower 5
pole classes, and an expected reduction in premium time use due to an overall reduction in pole 6
replacement volume. The drivers of the shift in material cost are described in more detail in Section II.B 7
above. 8
1. Distribution Pole Unit Cost Forecast 9
The distribution pole unit cost forecast includes the following components: the base unit 10
cost, environmental costs, and the distribution costs from transmission underbuild. These components 11
for distribution deteriorated pole replacements are summarized in Table IV-23 below. The base unit cost 12
reflects the labor, material, contractor, and overhead costs associated with the replacement of the pole. 13
These costs vary regionally based on contractor unit costs, the mix of poles required, and variations in 14
the complexity of work performed in different areas. Environmental costs include permitting associated 15
with pole replacements. 16

51
Table IV-23 Distribution Pole Replacement Unit Cost Adjustments (2015 $)85,86,87,88
2. Transmission Pole Unit Cost Forecast 1
Transmission pole replacement unit costs were also adjusted to allow for the expected 2
regional mix of pole replacements going forward, and anticipated reductions in material cost and 3
premium time. 4
85 For 2015 recorded total and regional mix adjustments, Refer to WP SCE-02, Vol. 9, pp. 139, 228-231(CET-
PD-IR-DP Distribution IPI Driven Pole Replacement Unit Cost, CET-PD-IR-DP Distribution PLC Driven Pole Replacement Unit Cost, CET-PD-IR-PD-Distribution PLP Pole Replacement).
86 For Environmental costs, refer to WP SCE-02, Vol. 9, pp. 232-233 (Distribution Pole Environmental Cost). 87 For Material Cost reductions, refer to WP SCE-02, Vol. 9, pp. 234-235 (Pole Class Impact and Material Cost
Adjustment). 88 Refer to WP SCE-02, Vol. 9, pp. 236-237 (Distribution Pole Replacement Unit Cost Adjustments for
Forecasting) for individual unit costs for IPI, PLC and PLP distribution replacements.
Row # Unit CostWeighted Average
% increase over 2012
Notes
1 2015 Recorded Total 14,554$ 9% Table IV-21, Row 8
2 Adjustments for forecast work type and regional mix
453$ +3% More work to be performed in regions with higher unit costs; see workpaper for details
3Adjustment for Increase in Underbuild
346$ +3% Ratio of transmission to distribution poles forecast to increase
4 15,353$ 15%
5 Material Cost Adjustment (161)$ -1%
6 15,192$ 14% Weighted average for IPI, PLC, and PLP replacements
Reduction due to modification of pole loading methodology (see workpaper for details)
2018 Forecast, with Material Cost Adjustment
2018 Forecast, Subtotal

52
Table IV-24 Transmission Pole Replacement Unit Cost Adjustments (2015 $)89,f90
The cost associated with replacing the distribution underbuild on transmission poles that 1
support both transmission and distribution equipment is allocated across all distribution pole 2
replacements. The average cost of distribution underbuild per transmission pole is $4,970 per 3
transmission pole replacement.91 The amount of underbuild cost associated with each distribution pole 4
replacement is determined by the ratio of total transmission pole replacements and total distribution pole 5
replacements. Since the ratio of transmission and distribution pole replacements varies over time, the 6
underbuild portion of distribution pole unit costs also varies. This drives the variations in forecast 7
distribution pole unit costs in Table IV-25. 8
3. Steel Stubbing 9
Steel stubbing unit costs are based on recent quotes from contractors, adjusted to include 10
SCE overheads.92 The proposed unit costs for distribution and transmission steel stubbing are also 11
shown in Table IV-25. Steel stubbing, where applicable, provides a lower-cost alternative to pole 12
replacement, and SCE plans to increase the use of steel stubbing from 2017 onward as described in 13
Section III above. The forecast weighted average unit cost of distribution pole remediation will decline 14
10% from 2016 to 2020. Similarly, the weighted average unit cost of transmission pole remediation will 15
decline 5% from 2016 to 2020. 16
89 For Material Cost reductions, refer to WP SCE-02, Vol. 9, pp. 234-235 (Pole Class Impact and Material Cost
Adjustment). 90 For 2015 recorded subtotal and regional mix update, refer to WP SCE-02, Vol. 9, pp. 141-142 (CET-PD-IR-
TR CET PD IR PT Transmission pole replacement unit cost workpaper). 91 Refer to WP SCE-02, Vol. 9, pp. 238-239 (Underbuild Cost per Transmission Pole). 92 Refer to WP SCE-02, Vol. 9, pp. 208-209 (CET PD IR DP CET PD IR TR Steel Stub Unit Cost Estimate).
% increase over 2012
Notes
2015 Recorded Subtotal 22,065$ 6% From Row 6 of Table II-6
Updated Regional Mix 23,834$ 14% More work to be performed in regions with higher unit costs; see workpaper for details
Material Cost (381)$ -2% Reduction due to modification of pole loading methodology
Forecast Unit Cost 23,453$ 13%

53
4. Summary of Unit Cost Forecasts 1
The unit cost forecasts described in the previous sections are summarized below. 2
Table IV-25 Pole Replacement Unit Cost Forecasts93
5. Ongoing Efforts to Reduce Unit Costs 3
In SCE-07, Vol. 06, SCE describes cost-saving activities which will reduce the capital 4
expenditures required for programs described in this testimony by the amounts shown in Figure IV-7. 5
SCE forecasts these efforts to yield a savings equivalent to approximately $1,100 per pole in 2015 6
dollars across forecast distribution pole volumes on average from 2018-2020. This would reduce the 7
weighted average pole remediation cost in 2018 by more than 7% relative to the forecast distribution 8
unit cost of $15,192 (Table IV-25). The resulting adjusted forecast unit cost of $14,100 (2018-2020 9
average) is lower than SCE’s 2015 recorded unit cost of $14,554 (Table IV-21). 10
93 Refer to WP SCE-02, Vol. 9, pp. 137-138 (Pole Replacement Unit Cost Forecast Details) for details.

54
Figure IV-7 Pole Capital Savings
Portion of CET-OT-OT-OX Recorded 2011-2015/Forecast 2016-2020
(CPUC-Jurisdictional – Constant 2015 and Nominal $000)
SCE also conducted a Sectional Composite Pole (SCP) pilot in the summer of 2015. The 1
pilot comprised installing 24 sectional composite poles. SCE expects to install approximately 175 SCPs 2
in 2016. A sectional composite pole is composed of four tapered Fiber Reinforced Plastic (FRP) tubes, 3
connected at slip joints, and bolted together. The replacement of wood poles with a SCP is proposed for 4
rear property line pole replacements because SCPs will eliminate the use of a crane or specialized 5
equipment which is needed when replacing rear property line poles. In addition to reduced installation 6
cost, the benefits of using SCPs would include, but are not limited to, eliminating pole chemical 7
treatment and minimizing pole corrosion and rotting. Additional benefits include simplified 8
transportation to the job site, resulting in lower transportation costs. Overall, despite having a higher 9
material cost, SCPs can be a more cost effective approach for replacing certain poles depending on the 10
location and local operating conditions. 11

55
1
JOINT POLE ORGANIZATION AND ACTIVITY COST FORECASTS 2
This section will describe the joint pole activities and cost and credit forecasts. We first present 3
an overview of joint use poles and the rules governing cost sharing among parties attaching to a pole. 4
Then the cost and credit forecasts will be presented. Three forecasts are included here. The first is the 5
O&M credit received from joint owners regarding certain maintenance work SCE performs on jointly 6
owned poles. The second is the O&M expense associated with the Joint Pole Organization (JPO), which 7
manages SCE’s relationships with joint owners and renters. The third is the capital credit received from 8
joint owners regarding pole replacements. Any amounts received by SCE from its renters are included in 9
Other Operating Revenue and are discussed in SCE-02, Vol 13. 10
A. Overview of Joint Use 11
Under California’s mandatory access policy, implemented in D.98-10-058, SCE must permit 12
certain telecommunications providers to attach to its poles through a rental arrangement.94 SCE also 13
meets its mandatory access obligations by voluntarily providing access to certain third parties through a 14
joint ownership arrangement. SCE’s Joint Pole Organization (JPO) manages SCE’s relationships with 15
joint owners and renters. 16
Two types of third-party entities attach facilities to SCE poles – joint owners and renters. Joint 17
owners purchase an interest in a pole through membership in the Southern California Joint Pole 18
Committee (JPC). The JPC comprises representatives of utilities, communications providers, and 19
municipalities in Southern California who hold joint equity interest in utility poles. Established by 20
telephone, electricity, and railroad companies in 1906, the JPC was formed because of the need to limit 21
the number of poles in the field and to create a uniform procedure for recording pole ownership. The 22
JPC’s principal functions are to keep accurate records of ownership for each jointly-owned pole, to 23
calculate the established value of each transaction involving the sale or purchase of joint pole equity 24
interests or maintenance of those interests, and to prepare monthly Bills of Sale, which are sent to the 25
members to enable them to make monetary settlement of their joint activities. Joint owners are typically 26
telephone or wireless companies, or other electric utilities. There are over 30 members of the JPC.95 27
Importantly, the JPC administers the parties’ interests and arranges payments; it does not 28
perform pole loading calculations, nor does it enforce or track compliance with Commission rules and 29
94 SCE rents space to a small number of renters who do not qualify for mandatory access under the decision. 95 Refer to WP SCE-02, Vol. 9, pp. 240-241 (List of Southern California Joint Pole Committee Members).

56
regulations. Each joint owner is responsible for making sure that it complies with Commission rules and 1
regulations. Once the joint owner has obtained an ownership interest in a pole, the joint owner is solely 2
responsible for conducting pole loading calculations and for making sure that its attachments (or the 3
attachments of its renters) meet G.O. 95 safety factor requirements. 4
The second category, renters, sometimes called “tenants,” rent space for their attachments within 5
space owned by SCE on its poles. Renters, primarily Cable TV companies, execute a license agreement 6
with SCE and then submit their requests to attach to SCE’s poles. Each renter is responsible for ensuring 7
that they comply with Commission rules and regulations. However, SCE independently calculates the 8
resulting safety factors and determines whether the company can attach to an existing pole, or whether 9
modification or replacement of the pole is required before permitting the renter to attach. SCE has over 10
150 active license agreements with pole renters.96 11
As summarized in Table V-26, approximately 920,000, or 63%, of SCE’s poles are jointly 12
owned with other utilities. Approximately 280,000, or 19%, of SCE’s poles have renters attached to 13
them. Of course, some jointly owned poles included in the 920,000 also have renters attached. 14
Approximately 160,000 or 11% of SCE’s poles have both joint owners and renters attached. 15
Table V-26 Summary of SCE Pole Population Occupancy & Ownership
Ownership
Joint Sole Total
Ren
ters
Yes 11% 8% 19%
No 52% 29% 81%
Total 63% 37% 100%
B. General Discussion of Cost Sharing with Joint Owners and Renters 16
This section discusses cost sharing for joint owners and renters. Table V-27 below briefly 17
summarizes and compares key elements of cost sharing under each joint usage arrangement. Then the 18
details of cost sharing under each arrangement are provided including illustrative examples of the 19
96 Refer to WP SCE-02, Vol. 9, pp. 242-243 (List of Renters).

57
derivation of the joint owner credit and the rental rate. Last, there is a discussion of whether SCE is 1
unduly subsidizing joint owners and renters. 2

58
Table V-27 Summary of Cost Sharing for Joint Owners and Renters
Joint Owners Renters
Framework Rates and terms are agreed upon by the JPC members.
Rates and terms are decided by State law and the Commission.
Cost to Attach Initially Joint owners pay the original owner to purchase an interest in the pole.
Renters pay an application fee for SCE to evaluate their application. They make no capital contribution to the cost of the existing pole. If the pole will become overloaded because of their attachment, they must reroute or pay the full cost of the pole replacement.1
Cost of Pole Replacements Joint owners share in the cost to replace a bare pole unless the replacement will solely benefit one owner.
Renters do not contribute to the cost of replacements on poles to which they are already attached.
Ongoing Cost Joint owners reimburse each other for certain maintenance costs such as intrusive pole inspections.
Renters pay a rental fee based on a statutory formula per foot of space (not per attachment).2
Unauthorized Attachment Penalty Attacher must purchase interest in the pole and pay a penalty of an additional 50% of the cost to purchase interest in a new pole.
Renter pays a $500 penalty and renter must apply for attachment permit.
1 The app.lication fees, called a P&E fees, record to Other Operating Revenue. See SCE-02, Vol. 13. 2 The rental fees record to Other Operating Revenue. See SCE-02, Vol. 13.

59
1. Cost Recovery from Joint Owners 1
The members of the JPC (also referred to as joint owners) agree on the amounts that 2
members will charge each other for various joint activities. Examples of joint activities include a 3
member purchasing interest in an existing pole, a pole replacement of a jointly owned pole, and an 4
intrusive pole inspection of a jointly owned pole. The members determine what activities are to be 5
reimbursed and how each member will be compensated for performing joint work on behalf of the other 6
joint owners. There are two major cost categories used to determine how much is owed among joint 7
owners: Approved Pole Prices and Authorized Costs. There are key differences in these categories and 8
how they apply to joint activities. Table V-28 below summarizes fundamental attributes of each 9
category. 10

60
Table V-28 Joint Owner Cost Categories Set by JPC
The following example illustrates the cost sharing among SCE and a joint owner. Assume 1
a joint owner owns 1’ of space for its use and SCE is installing the new pole. Assume also that the 2014 2
JPC Approved Pole Prices apply.97 (The calculations are summarized in Table V-29 and are portrayed in 3
Figure V-8). 4
97 For simplicity the numbers used in this example calculation have been rounded to the nearest dollar.
Approved Pole Prices Authorized Costs
Description The capital cost one joint owner pays another joint owner to purchase an ownership interest in a pole
The cost one joint owner pays another joint owner to perform certain work associated with pole ownership
When is cost used Used to calculate the cost to purchase an interest in a pole either because of a pole replacement or to initially purchase interest in an existing pole
Used to share the cost of work such as removing the old pole after a pole replacement, performing an intrusive inspection or vegetation clearing
How are costs determined Each joint owner submits its pole price and that price is used to charge other joint owners
Each joint owner submits its cost to perform each item of work. However, all joint owner submissions are averaged and that average is used as the Authorized Cost that joint owners charge each other
How costs are shared Each joint owner pays in proportion to its ownership interest in the pole
Costs are shared equally between joint owners
How often are costs updated
Every year Every other year

61
For a 45’ pole jointly owned by two members, the common space (also called the 1
nonusable space) is 30’ and the remaining 15’ is the usable space. The non-usable space is the 6’ in the 2
ground, the 18’ from the ground to the lowest point where facilities can be attached, called the public 3
zone or support structure, and the 6’ of safety clearance zone between the communication and electric 4
facilities in which no attachments can be placed. The 2014 Approved Pole Price that SCE submitted to 5
the JPC for a 45’ pole was $5,130 or $114 per foot. 6
Since SCE will replace the pole in this example, the other joint owner will owe SCE for 7
space on the new pole. Note that regardless of how much space a joint owner purchases, all owners 8
share equally in the cost of common space. The cost of the common space is 30’ * $114 per foot = 9
$3,420. Therefore, the other owner is responsible for half of the cost of the common space or ½ * 30’ * 10
$114 = $1,710. The other owner is also responsible for the full cost per foot of usable space it owns or 1’ 11
* $114 = $114. 12
After SCE replaces a pole, it transfers its equipment to the new pole.98 Let’s assume that 13
the joint owner is responsible for removing the old pole. The next step is for the communication 14
company to transfer its equipment at its own cost and then remove the old pole, referred to as pulling, 15
transporting, and disposing (PTD). The cost to PTD a pole is an Authorized Costs. In contrast to 16
Approved Pole Prices, which are member specific, the Authorized Cost for an activity is the same 17
regardless of which owner performs the work. Authorized Costs are shared equally among the joint 18
owners of the pole. Since there are two owners, each joint owner is responsible for one half of the 19
Authorized Costs. The Authorized Cost for PTD is $1,361. SCE will owe one half of the cost to PTD to 20
the other owner (1/2 * $1,361) = $681. 21
In summary, the other joint owner will owe SCE $114 for its own foot of usable space, 22
plus $1,710 for its half of the common space, totaling $1,824. SCE will owe the other joint owner $681 23
for half the cost of PTD. The net recovery for SCE will be $1,143. 24
Consider the same example above. However, in this scenario, SCE is responsible to PTD 25
the pole. The joint owner will owe SCE for half of the cost to PTD. In summary, the joint owner will 26
owe SCE $114 for its own foot of usable space, plus $1,710 for its half of the common space, plus $681 27
for its half the cost of PTD. The net recovery for SCE will be $2,505. 28
98 In practice, when the joint owner is responsible to remove the old pole, SCE would “top” the pole, which
means that the section of pole above the communication space is cut off and removed. This cost is a shared cost. However, for simplicity, this step is omitted from the example.

62
Figure V-8 Diagram of Jointly Owned Pole Cost Sharing

63
Table V-29 Example of Joint Owner Cost for Pole Replacement
The previous example covered what is called a mutual benefit pole replacement. Mutual 1
benefit pole replacements benefit all owners of a pole. Joint owners have agreed that when a pole is 2
replaced for mutual benefit, joint owners share the cost to set a bare pole in the ground and other 3
associated costs such as the cost to pull, transport, and dispose of the old pole. Each joint owner is 4
responsible for the costs of transferring its own equipment from the old pole to the new pole. 5
Some poles require replacement because SCE is adding equipment or reconductoring 6
with larger wire, which will cause the pole to be overloaded. In these situations, the cost of a pole 7
replacement is not shared because the pole replacement is solely to benefit SCE. Therefore, SCE must 8
bear the cost of the replacement.99 This has the effect of lowering the overall joint owner credit per pole 9
replaced. 10
Thus far we have discussed cost sharing related to capital work. Certain O&M functions 11
are also shared among joint owners. These are intrusive pole inspections, State Responsibility Area 12
vegetation clearing, and pole tagging. These costs are shared equally among the joint owners and the 13
cost recovery is based on the Authorized Cost for each task performed. 14
99 The joint owner must purchase an interest in the new pole at the Approved Pole Price.
Amount Paid to SCE
JPC Authorized Cost Total CostJoint Owner Share of
the Cost
Scenario 1Joint Owner CostSCE Removes the
Old Pole
Scenario 2 Joint Owner Cost
Joint Owner Removes the Old Pole
Cost of Usable Space 1,710$ 1 foot of 15 feet
or 6.67% 114$ 114$ Cost of Common Space 3,420$ 50% 1,710$ 1,710$
Subtotal Cost of Pole 5,130$ 1,824$ 1,824$ gTransporting, Disposal (per pole) 1,361$ 50% 681$ (681)$
Net Payment to SCE 2,505$ 1,143$

64
2. Cost Recovery from Renters 1
The Commission has adopted the statutorily set rate of 7.4% of the cost to own and 2
maintain a pole per foot of space rented.100 The 7.4% came from the Federal Communications 3
Commission’s pricing formula which assumed a hypothetical pole of 37.5 feet. The hypothetical pole 4
was the average of a 35 foot pole and 40 foot pole. A 37.5 foot pole would have 24 feet of unusable 5
space leaving (37.5’ – 24’ = 13.5’) 13.5 feet of usable space. If a renter rents one foot of the 13.5 feet, 6
they have rented (1’ / 13.5’ = 7.4% ) 7.4% of the usable space.101 As of the date of filing, the fee is 7
$11.50 per foot per pole annually. Renters are not responsible for the cost of pole replacements – unless 8
the pole replacement is needed solely because a renter applies to attach to a particular pole and the 9
existing pole cannot accommodate the attachment.102 Renters are not billed for the O&M or inspection 10
cost of the poles on which they attach. Instead the cost of O&M is included in the formula used to 11
calculate the annual rental rate. 12
3. Evaluation of Current Cost Recovery Practices 13
The Commission has asked SCE to determine whether SCE’s customers unduly subsidize 14
renters and joint owners,103 and to evaluate renegotiating payments and unilaterally removing non-SCE 15
attachments.104 The section will evaluate the current cost recovery practices first for joint owners and 16
then for renters. 17
SCE has taken steps to improve its cost recovery from attachers. When SCE submitted its 18
costs for the Approved Pole Prices this year, SCE added a separate set of costs for H class poles to 19
account for the material cost difference between H class and regular class poles. When the discussions 20
for Authorized Cost began, SCE asked to include certain costs that had previously been reimbursed on a 21
case by case basis. SCE further proposed that rather than use the average cost of all members, each 22
member charge its own cost to perform each activity. 23
While there are areas for improvement in the cost sharing with joint owners, SCE 24
generally believes the rules are equitable and SCE is recovering an amount consistent with the JPC 25
rules. 26
100 See Public Utilities Code § 767.5 and D.98-10-058 OP 1 and page 146. 101 See Code of Federal Regulations, Title 47, Chapter I, Subchapter A, Part 1, Subpart J, Section 1.1418. 102 When a renter is denied attachment, the renter may pay for the pole replacement, reroute its attachment to
other poles or underground, or install an interset pole. 103 D.15-11-021, p. 103. 104 D.15-11-021, p. 136.

65
SCE’s cost in 2016 to set a 45’ class 2 bare pole as submitted to the joint pole JPC is 1
$5,119. This submission is based on the categories of cost specified by the JPC. The pole price that SCE 2
submits to the JPC is determined by adding the cost components according to the JPC guidelines 3
regarding what costs may be included. The costs include the cost to dig and erect the pole, material cost, 4
planning cost to site the pole, and A&G.105 5
As stated in the example above, a 45’ pole has 15’ of usable space and 30’ of common 6
(or unusable) space. If two joint owners shared the usable space equally, each joint owner would be 7
responsible for half of the $5,119 or $2,560 each. The owners rarely share the usable space equally. 8
Telecom companies own much less space on the pole than SCE does. Therefore, SCE bears a greater 9
portion of the cost of the pole. If we were to just look at the common (or unusable space), the cost of the 10
common space is $3,413. This is shared equally between joint owners, with each joint owner responsible 11
for $1,706. For each foot of usable space a telecom buys, only an additional $114 is added to their cost. 12
Therefore, the amount of usable space a telecom buys will affect its cost responsibility. 13
SCE’s unit cost for pole replacements, discussed in Section IV, are greater than the 14
$5,119 shared cost for setting a bare pole. The costs SCE incurs above the $5,119 shared cost are for 15
SCE activities, such as the cost of materials and labor to install electrical equipment, including cross 16
arms, conductors, transformers, and switches, which are not shared with other joint owners. 17
Similarly, SCE believes the reimbursement received to pull transport and dispose of 18
(PTD) of the old pole are reasonable. PTD is an Authorized Cost item, and as described above one cost 19
applies regardless of which owner does the work. That cost is determined by averaging the costs 20
submitted by each owner for a particular activity. This average cost is then split equally based on the 21
number of owners on the pole. The 2015-2016 Authorized Cost to pull, transport, and dispose of a pole 22
is $2,078. SCE’s submission to the JPC was lower than the Authorized Cost. In summary, the cost 23
sharing for a pole replacements, is reasonable and is consistent with SCE’s costs to the extent allowed 24
by the JPC rules. 25
The Commission has asked SCE if it can offer assistance to ensure appropriate cost 26
sharing between joint owners and SCE. In some cases, SCE has been unable to collect all the joint 27
credits it is owed because a joint owner objects to SCE’s pole replacement due to SCE’s wind standards 28
that exceed specified GO 95 minimum wind loading. In those cases, the joint owner has refused to agree 29
105 Refer to Confidential WP SCE-02, Vol. 9, pp. 3-4 (SCE JPC Approved Pole Price).

66
that these pole replacements are a mutual benefit replacement, and have instead claimed that these pole 1
replacements are solely to benefit SCE. If the pole replacement is solely for SCE’s benefit, SCE must 2
bear the cost of the replacements and receives no joint owner credit.106 Verizon Telecom and Verizon 3
Wireless have each sent letters to SCE stating their disagreement with SCE’s wind loading standards 4
because SCE’s wind loading standards are in excess of GO 95 minimum loading.107 They further 5
disagree with SCE’s decision not to grandfather poles designed under a previous wind loading 6
standard.108 After Frontier purchased Verizon Telecom, SCE contacted Frontier to reopen discussions on 7
this matter. Unfortunately, Frontier has maintained the position originally espoused by Verizon 8
Telecom. Until these issues are resolved, SCE will not realize the full joint owner credit it is entitled to. 9
In addition, in SCE’s San Gabriel Windstorm Settlement Agreement, SCE and the Safety 10
and Enforcement Division (SED) agreed to the following term, which the CPUC adopted through its 11
approval of the settlement: “(a) SCE agrees to join SED should SED propose as part of the Infrastructure 12
Safety Rulemaking (R.08-11-005) or in a new proceeding that attachments made to joint-use poles with 13
electrical equipment must adhere to the strength and loading requirements of the electrical utility in 14
effect at the time the attachment is made to the extent such standards exceed the minimum standards in 15
General Order 95.” (Emphasis added.) SED has not yet made such a proposal in R.08-11-005 or in its 16
successor rulemaking, R.15-05-006. However, the proceeding is now at a point where such a proposal is 17
ripe. Parties are completing the statewide fire threat maps, and will be working on new rules that will 18
strengthen standards in the newly defined fire threat areas. One way the Commission could assist SCE in 19
collecting its properly incurred costs for pole replacements from joint owners is by directing SED to 20
propose the provision agreed to in the San Gabriel Windstorm Settlement Agreement and support its 21
incorporation into GO 95. 22
Regarding renters, SCE is following applicable law and Commission decisions. The 23
rental rate is set statutorily, and SCE has little control over the rental rate for those entities covered 24
under the mandatory access rules. The Commission has supported the use of the statutory rate in a recent 25
decision. In the Commission’s rulemaking R.14-05-001, the Commission considered how the rights-of-26
way rules adopted in Decision 98-10-058 should be amended to encompass Commercial Mobile Radio 27
106 The joint owner must purchase an interest in the new pole at the Approved Pole Price. 107 Section 31.1 of GO 95 requires utilities to design according to known local conditions when those conditions
exceed GO 95 standards. 108 The letters and SCE’s responses are included in workpapers.

67
Service (CMRS) attachments on utility pole tops, including the fees that utilities like SCE could charge 1
CMRS carriers for leasing space on utility poles. In the rulemaking, SCE advocated that CMRS carriers 2
should pay a market based rate for their telecommunication attachments on utility poles because CRMS 3
providers have a variety of practical market alternatives for placing their attachments, such as 4
commercial, industrial, or residential buildings, other utility poles, and communications towers. For 5
example, CMRS providers pay a market rate for antenna sites on top of buildings or construct cell 6
towers in parking lots and other places disguised as trees, with one intervenor indicating that the market 7
rate for pole top attachments was upwards of $1,000 per year.109 The Commission, however, excluded 8
consideration of a market based rate from the proceeding and ultimately concluded in D.16-01-046 that 9
the attachment fee should be based on the statutory rate of 7.4% of the annual cost of the pole, denying 10
electric distribution customers the full benefit of the utility asset. 11
SCE also cannot use “self-help” to remediate overloaded poles by unilaterally taking 12
down a third-party attachment that may, in SCE’s view, be causing the overloaded condition. This is 13
true whether the attachment was known to and approved by SCE, or not. First, most attachments on 14
SCE’s system were made prior to the adoption of SCE’s heightened wind standards, and using then-15
current pole loading methodologies. Such attachments are authorized by our rental agreement or joint 16
pole agreement and cannot be removed without violating those agreements or the property rights of the 17
attachment owners. When all the attachments on a pole are authorized, but the pole is nonetheless found 18
to be overloaded, the remediation is for the mutual benefit of all the attachers. But even in the few cases 19
where removal of a previously unauthorized attachment could mitigate the need to replace an overloaded 20
pole, SCE still cannot cut down a third-party attachment. Doing so could violate the Commission’s rules 21
regarding critical infrastructure, including 911 service. SCE has separate processes for holding 22
unauthorized attachers accountable. Unauthorized attachers must come into compliance by submitting a 23
proper request, and, where the attachment has resulted in an overloaded pole, either pay to have the pole 24
replaced or remove the attachment and find another route. 25
Given this overview of cost sharing, we will now present the activity descriptions and 26
cost and credit forecast for each area related to the Joint Pole Organization. 27
109 See R. 14-05-001, July 7, 2014 Opening Comments of the Joint Venture: Silicon Valley and the California
Wireless Association, p. 4.

68
C. Joint Pole O&M Credits 1
O&M costs are shared among joint owners according to the rules agreed upon by the members of 2
the JPC. O&M credits are received for intrusive pole inspections, vegetation clearing in State 3
Responsible Areas and pole tagging. SCE receives a credit from joint owners when it performs an 4
intrusive pole inspection on a jointly owned pole. SCE also receives a credit when vegetation clearing in 5
a State Responsible Area is performed, but not for vegetation inspections. Costs are shared ratably by 6
the number of owners of a pole. The cost is based on the Authorized Cost to perform the work, which is 7
similar to SCE’s actual cost. For example, the Authorized Cost agreed to by the JPC to perform an 8
intrusive inspection is $52. If there are two joint owners on a pole, the cost will be split evenly. SCE 9
would receive a credit for $52 divided by two or $26. 10
Credits are also received for the penalty payments for unauthorized attachments. Note that when 11
a joint owner is attached without authorization, the joint owner must pay a penalty and purchase an 12
ownership interest in the pole. The purchase of interest in the pole is shown in section V.5. The 13
unauthorized attachment penalties for joint owners are shown in Table V-30. The unauthorized 14
attachment penalties for renters are reflected in Other Operating Revenue in SCE-02, Volume 13. 15
In the 2015 GRC Decision, the Commission directed SCE to quantify the role of unauthorized 16
attachments in pole loading to discuss efforts to minimize their impacts.110 17
Historically, SCE has found that approximately 2.8% of its poles contain an unauthorized 18
attachment. However, the existence of an unauthorized attachment does not necessarily result in a pole 19
being overloaded. Nevertheless, SCE has taken steps to reduce unauthorized attachments. As described 20
below, SCE has a team that inspects poles to determine if unauthorized attachments exist. At the end of 21
2014, SCE added an additional inspector to this group increasing the size from two to three employees. 22
In May 2015, SCE worked with the law department to develop and implement a new unauthorized 23
attachment process for renters.111 When SCE discovers an unauthorized attachment, it works with the 24
owner or renter of the attachment to either remove the attachment or apply for an authorized attachment. 25
SCE assesses a penalty when an unauthorized attachment is found. 26
As stated above, O&M credits are received for three activities: 1) intrusive pole inspections, 2) 27
maintenance, and 3) unauthorized attachment penalty payments. Historical costs were used to determine 28
110 “SCE should also quantitatively address the role of unauthorized attachments in pole loading and discuss its
efforts to minimize this impact.” D.15-11-021, p. 136. 111 Refer to WP SCE-02, Vol. 9, pp. 246-251 (Unauthorized Attachment procedure).

69
the joint pole O&M credit forecast for each of the three activities. Inspection credits were determined by 1
the multiplying the number of annual intrusive inspections in the intrusive pole inspection plan by the 2
five-year average credit of $20.89 per joint pole. Also, the reimbursement varies by inspection type. For 3
maintenance credits, the 2015 recorded credit was used as the test year forecast based on the expectation 4
that the maintenance activities will continue at the current level. For penalty payments, a two-year 5
average (2014-2015) was used as the test year forecast. The two-year average was used to account for 6
the increase in penalties resulting from the changes described above. SCE did not use the last recorded 7
year as a forecast because some penalty payments identified in 2014 weren’t recorded until 2015 which 8
had the effect of overstating 2015 penalties. Therefore, a two-year average is the most reasonable. 9
Overall, there is an incremental year-to-year decrease in the forecast for joint pole O&M credits 10
forecast. This is due to the fact that intrusive pole inspections are decreasing in the forecast period so the 11
credits resulting from the inspections are decreasing as well. 12
Table V-30 Joint Pole O&M Credits112
Portion of GRC Account 583.125 Recorded and Adjusted 2011-2015 / Forecast 2016-2018
(Constant 2015 $000)113
D. Joint Pole Organization (JPO) Expenses, Portion of FERC Account 583.125 13
JPO is responsible for the execution and administration of all joint pole agreements 14
where SCE shares the ownership of electric poles with other utilities. JPO is also responsible for the 15
execution and administration of agreements to lease pole space to other utilities. Both joint ownership 16
and lease arrangements fulfill SCE’s requirement to provide non-discriminatory access under D.98-17
112 Refer to WP SCE-02, Vol. 9, pp. 1-63. 113 Refer to WP SCE-02, Vol. 9, pp. 252-253 (Joint Pole Expense Credits).
2011 2012 2013 2014 2015 2016 2017 2018Labor $ $ $ $ $ $ $ $Non-Labor -$1,371 -$2,047 -$2,929 -$3,171 -$3,763 -$3,288 -$3,182 -$3,140 Total -$1,371 -$2,047 -$2,929 -$3,171 -$3,762 -$3,288 -$3,182 -$3,140
Ratio of Labor to Total 0% 0% 0% 0% 0% 0% 0% 0%
Basis of Forecast: Itemized ForecastBasis of Labor/Non-Labor Split: Itemized Forecast
Recorded Forecast

70
10.058. JPO generates invoices and receives payments from joint pole users for capital investments and 1
maintenance-related expenses. JPO receives invoices from other joint pole owners, validates the 2
amounts, and makes payment. JPO works with all parties on the JPC to establish policies and resolve 3
issues that affect all JPC members. JPO performs inspections on poles to identify safety deficiencies and 4
unauthorized attachments. The Third Party Attachment Group is responsible for the technical evaluation 5
of third party requests for attachment. This includes performing the planning review, pole loading, and 6
field verification for renter Requests for Access (RFA). The Third Party Attachment Group approves or 7
denies third party access to SCE poles or SCE space on jointly owned poles upon verification of renter 8
fulfilling SCE’s requirements and standards for attachments. As part of their work in the field, TPA 9
planners may also discover and document “as is” pole loading failures, asset corrections, and 10
unauthorized attachments. When an “as is” pole loading failure results in the need for an SCE guy 11
repair, the Third Party Attachment Group creates the drawings for the repair. 12
1. Joint Pole Organization Cost Forecast 13
As shown in Table V-31, the expenses in this account have remained stable through 14
2013. During 2014, JPO added staff to accommodate the increase in pole replacements due to the Pole 15
Loading Program. The 2015 expense level reflects a full year of the staff added in 2014. During 2015, 16
JPO continued to assess its staffing level and determined that the existing staff was not adequate. 17
Additional employees must ensure work is processed timely. Furthermore, several positions in the third 18
party attachments group are staffed with temporary workers even though the work load has been stable 19
year to year. We are therefore proposing to use the last recorded year as the basis for our test year 20
forecast, and add in the costs of the additional personnel and the costs of moving staff from contract to 21
employee. Table V-31 below shows the costs of the positions that will be added towards the end of 2016 22
and the full year labor cost which will be realized in 2017. In the third party attachments group, 4 23
planner positions and 1 administrative aid position will be converted from contract employees to SCE 24
employees. The costs for these positions will move from non-labor to labor. 25

71
Table V-31 Joint Pole Organization114
Portion of GRC Account 583.125 Recorded and Adjusted 2011-2015 / Forecast 2016-2018
(Constant 2015 $000)115
E. Joint Pole Capital Credits 1
As discussed in the previous section, for certain activities, such as when SCE replaces a 2
distribution or transmission pole, it recovers some of the cost of setting a bare pole from joint owners. 3
The capital credits in this section reflect the net payments SCE receives from joint owners for pole 4
replacements. 5
1. Credit Forecast 6
The joint pole capital credit is forecast using the 2015 joint pole billed amounts and 7
applying those amounts to the pole replacements in the forecast period.116 First, an analysis was done to 8
look at how much was recorded for joint pole capital credits related to the pole programs discussed in 9
this volume (i.e. the programmatic pole replacements under the Pole Loading Program and Deteriorated 10
Pole Program). The result was an average capital credit of $2,216 per pole replacement.117 Next, this 11
average credit per pole replacement was applied to the pole replacements during the forecast period to 12
obtain a forecast of joint pole capital credits related to the work discussed in this volume. SCE replaces 13
poles for other reasons such as adding new equipment or storm damage. The capital credit associated 14
114 Refer to WP SCE-02, Vol. 9, pp. 1-63. 115 Refer to WP SCE-02, Vol. 9, pp. 254-255 (JPO Forecast). 116 This method is more accurate than the method used in previous GRCs because of the lag between
construction and billing the joint owner. 117 Refer to WP SCE-02, Vol. 9, pp. 256-257 (Joint Pole Capital Credit).
2011 2012 2013 2014 2015 2016 2017 2018Labor $3,142 $3,443 $3,973 $4,330 $5,212 $6,361 $6,927 $6,927Non-Labor $200 $831 $1,964 $2,220 $1,677 $2,260 $1,621 $1,621 Total $3,342 $4,274 $5,938 $6,550 $6,889 $8,621 $8,548 $8,548
Ratio of Labor to Total 94% 81% 67% 66% 76% 74% 81% 81%
Basis of Forecast: Itemized ForecastBasis of Labor/Non-Labor Split: Itemized Forecast
Recorded Forecast

72
with this work is more difficult to forecast because the joint pole credit owed to SCE will vary based on 1
the type of work. For these cases, the forecast was based on the 2015 recorded credits. Besides pole 2
replacements, members of the JPC will occasionally purchase an ownership interest in an existing pole 3
and become a joint owner in that pole. Also, when a joint owner is found to be unauthorized on a pole, 4
the joint owner must purchase interest in the pole. The purchase of interest in the pole is recorded as a 5
capital credit. The penalty paid by a joint owner for an unauthorized attachment is recorded in Joint Pole 6
O&M Credits, Section V.C. The capital credits from these purchases in interest in a pole are forecast 7
using the 2015 recorded credits. Lastly, as described in Section III.B.3, certain poles will be remediated 8
with the installation of a steel stub. The joint owner credit for this activity was forecast using the 9
forecast steel stub installations and multiplying it by the joint owner credit amount for steel stubbing. 10
The four sources of capital credits are added together and summarized in Table V-32. The resulting 11
forecast represents a significant increase in the joint pole capital credits. 12
Table V-32 Joint Pole Capital Credits, Constant 2015 $ Forecast

73
Table V-33 Joint Pole Capital Credit, Distribution118
CET-PD-CR-JD Recorded 2011-2015/Forecast 2016-2020
(CPUC-Jurisdictional – Constant 2015 and Nominal $000)
118 Refer to WP SCE-02, Vol. 9, pp.64-81.
2011 2012 2013 2014 2015 2016 2017 2018 2019 2020
Nominal $ (10,866) (13,905) (20,344) (21,578) (28,403) (54,417) (51,615) (50,766) (52,799) (47,469)
Constant 2015$ (12,337) (15,260) (21,549) (22,165) (28,403) (53,408) (49,626) (47,611) (48,011) (41,834)
-$60,000
-$50,000
-$40,000
-$30,000
-$20,000
-$10,000
$0
Nominal $ Constant 2015$

74
Table V-34 Joint Pole Capital Credit, Transmission119
CET-PD-CR-JT Recorded 2011-2015/Forecast 2016-2020
(CPUC-Jurisdictional – Constant 2015 and Nominal $000)
119 Refer to WP SCE-02, Vol. 9, pp.64-81.

75
1
OTHER POLE RELATED ACTIVITIES 2
A. Wood Pole Disposal 3
When wood poles are removed from service, they must be appropriately disposed of to mitigate 4
adverse environmental impact. Disposal is complicated, as all poles have been treated with chemical 5
preservatives, and, since 2006, these poles have been considered hazardous waste.120 Wood pole 6
disposal records the cost of disposing of distribution wood poles removed from the system. 7
1. Cost Forecast 8
Table VI-35 shows the recorded costs, pole counts, and unit costs from 2011 to 2015, 9
with the forecast for 2016-2020. Disposal costs vary depending on the type of pole and costs have 10
fluctuated from year to year. Therefore, SCE utilized the five-year average cost of $107 per pole 11
(constant 2015 dollars), as the basis for the forecast. Figure VI-9 summarizes the recorded expenditures 12
and requests in this category. 13
120 See Federal Insecticide, Fungicide, and Rodenticide Act, 7 U.S.C. Sec. 136, et seq.

76
Table VI-35 Wood Pole Disposal Cost Analysis
2011 2012 2013 2014 2015Wood pole disposal 1,849$ 1,433$ 2,751$ 3,768$ 4,966$ (Constant 2015 $000)
Total Replacements (unitized) 22,462 20,840 18,931 32,256 40,414 Unit cost 0.082 0.069 0.145 0.117 0.123Average Unit Cost 0.107
Recorded

77
Figure VI-9 Wood Pole Disposal121
CET-PD-OT-WP Recorded 2011-2015/Forecast 2016-2020
(CPUC-Jurisdictional – Constant 2015 and Nominal $000)
1
121 Refer to WP SCE-02, Vol. 9, pp.64-81.
2011 2012 2013 2014 2015 2016 2017 2018 2019 2020Nominal $ 1,629 1,306 2,597 3,668 4,966 3,743 3,612 3,548 3,660 3,776Constant 2015$ 1,849 1,433 2,751 3,768 4,966 3,674 3,473 3,328 3,328 3,328
$0
$1,000
$2,000
$3,000
$4,000
$5,000
$6,000
Nominal $ Constant 2015$Forecast

78
B. Pole Related Expense 1
Table VI-36 Pole Loading Program Related Expense122
Portion of GRC Account 571.125 and 593.125 Recorded and Adjusted 2011-2015 / Forecast 2016-2018
(Constant 2015 $000)123
Related Expense is discussed in SCE-03, Volume 10. Related expense driven by capital 2
expenditures on pole loading-driven pole replacements are shown in Table VI-36 above; the forecast of 3
related expense is based on the historical ratio of overall capital expenditures and related expense.4
122 Refer to WP SCE-02, Vol. 9, pp. 1-63. 123 Refer to WP SCE-02, Vol. 9, pp. 258-259 (PLP Pole Related Expense).
2011 2012 2013 2014 2015 2016 2017 2018571.125
Labor $ $ $ $1 $59 $3 $6 $9Non-Labor $ $ $ $5 $564 $71 $127 $190 Subtotal 571.125 $ $ $ $7 $623 $74 $133 $199
593.125Labor $ $ $ $4 $111 $99 $103 $108Non-Labor $ $ $ $74 $3,070 $2,104 $2,196 $2,295 Subtotal 593.125 $ $ $ $77 $3,182 $2,203 $2,299 $2,402
Total -$ -$ -$ $84 $3,805 $2,277 $2,432 $2,601
Labor -$ -$ -$ $5 $171 $102 $109 $117Non-Labor -$ -$ -$ $79 $3,634 $2,175 $2,323 $2,485
Ratio of Labor to Total N/A N/A N/A 6% 4% 4% 4% 4%
Basis of Forecast: Itemized ForecastBasis of Labor/Non-Labor Split: Last Year Recorded Labor/Non-Labor Ratio
Recorded Forecast

79
1
CONTINUATION OF THE POLE LOADING AND DETERIORATED POLE PROGRAMS 2
BALANCING ACCOUNT 3
SCE proposes to continue the Pole Loading and Deteriorated Pole Programs Balancing Account 4
(PLDPBA), with modifications, effective January 1, 2018. PLP was proposed in the 2015 General Rate 5
Case as a comprehensive way to address pole loading. The program will assess SCE’s poles to identify 6
and repair or replace those poles that do not meet G.O. 95 minimum safety factors or SCE’s internal 7
safety standards. In its 2015 GRC testimony, SCE noted that the program would be a significant driver 8
of pole inspection, maintenance, and replacements. The forecasts for the program were based on the 9
system-wide pole loading sampling plan mandated in D.12-11-051. SCE anticipated these forecasts 10
might be modified as we developed detailed operational plans for work execution strategy. SCE 11
provided examples of the factors that might affect the costs and were difficult to accurately predict, such 12
as the proportion of poles that would need remediation and the cost of assessment and remediation. 13
Accordingly, SCE proposed a balancing account to record the difference between the cumulative 14
spending under the Pole Loading Program relative to the authorized amounts. Based on comments from 15
TURN, SCE revised its proposal to include the Deteriorated Pole program pole costs in the balancing 16
account, and this is what the Commission adopted in D.15-11-021. SCE’s Pole Loading and 17
Deteriorated Pole Programs Balancing Account (PLDPBA) became effective January 1, 2015.124 18
The Pole Loading Program began in January, 2014. Hence, SCE now has over two years of 19
experience running the Pole Loading Program, and the cost per unit of many activities can now be based 20
upon historical data. However, due to the continued refinement of processes and tools used to identify 21
and remediate pole loading issues, some uncertainty related to the total volume of work required to meet 22
program objectives remains. Therefore, SCE is proposing to modify and continue the balancing account. 23
For further details on SCE’s proposal, please see Mr. Snow’s testimony in Exhibit SCE-09, Volume 1, 24
Part 1.25
124 See D.15-11-021, OP 8.

80
1
SUMMARY OF GRC ACCOUNTS 2
A. GRC Account 566.125 3
Figure VIII-10 Summary of GRC Account 566.125125
Recorded and Adjusted 2011-2015/Forecast 2016-2018 (Total Company – Constant 2015 $000)
125 Refer to WP SCE-02, Vol. 9, pp. 1-63.
2011 2012 2013 2014 2015 2016 2017 2018
Transmission Intrusive Pole InspectionsLabor $11 $37 $67 $41 $34 $28 $28 $28Non-Labor $814 $689 $1,283 $642 $479 $657 $551 $657 Sub- Total $826 $726 $1,350 $683 $513 $685 $579 $685
Transmission Pole Loading ProgramLabor $ $ $7 $330 $256 $ $ $Non-Labor $ $ $4 $2,457 $1,205 $ $ $ Sub- Total $ $ $11 $2,787 $1,461 $ $ $
Total 566.125Labor $11 $37 $74 $372 $290 $28 $28 $28Non-Labor $814 $689 $1,287 $3,098 $1,684 $657 $551 $657 Total Expenses $826 $726 $1,361 $3,470 $1,975 $685 $579 $685
Recorded Forecast
$
$500
$1,000
$1,500
$2,000
$2,500
$3,000
$3,500
$4,000

81
B. GRC Account 571.125 1
Figure VIII-11 Summary of GRC Account 571.125126
Recorded and Adjusted 2011-2015/Forecast 2016-2018 (Total Company – Constant 2015 $000)
126 Refer to WP SCE-02, Vol. 9, pp.1-63.
2011 2012 2013 2014 2015 2016 2017 2018Transmission Pole Loading Program Related ExpenseLabor $ $ $ $1 $59 $3 $6 $9Non-Labor $ $ $ $5 $564 $71 $127 $190 Sub- Total $ $ $ $7 $623 $74 $133 $199
Transmission Pole Loading Program RepairsLabor $ $ $ $1 $5 $ $ $Non-Labor $ $ $ $ $17 $298 $620 $547 Sub- Total $ $ $ $1 $22 $298 $620 $547
Total 571.125Labor $ $ $ $3 $64 $3 $6 $9Non-Labor $ $ $ $5 $581 $369 $747 $737 Total Expenses $ $ $ $8 $645 $373 $753 $746
Recorded Forecast
$
$100
$200
$300
$400
$500
$600
$700
$800

82
C. GRC Account 583.125 1
Figure VIII-12 Summary of GRC Account 583.125127
Recorded and Adjusted 2011-2015/Forecast 2016-2018 (Total Company – Constant 2015 $000)
127 Refer to WP SCE-02, Vol. 9, pp. 1-63.
2011 2012 2013 2014 2015 2016 2017 2018Distribution Intrusive Pole InspectionsLabor $259 $372 $644 $675 $743 $249 $249 $249Non-Labor $4,296 $2,814 $7,514 $5,353 $5,299 $5,926 $4,972 $4,734 Sub- Total $4,555 $3,186 $8,158 $6,028 $6,042 $6,176 $5,222 $4,984
Joint Pole CreditsLabor $ $ $ $ $ $ $ $Non-Labor -$1,371 -$2,047 -$2,929 -$3,171 -$3,763 -$3,288 -$3,182 -$3,140 Sub- Total -$1,371 -$2,047 -$2,929 -$3,171 -$3,762 -$3,288 -$3,182 -$3,140
Distribution Pole Loading Program AssessmentsLabor $ $1,022 $828 $3,251 $2,493 $1,692 $1,692 $1,692Non-Labor $ $377 $1,401 $15,113 $9,763 $20,806 $22,053 $22,715 Sub- Total $ $1,399 $2,229 $18,365 $12,255 $22,499 $23,746 $24,407
Joint Pole OrganizationLabor $3,142 $3,443 $3,973 $4,330 $5,212 $6,361 $6,927 $6,927Non-Labor $200 $831 $1,964 $2,220 $1,677 $2,260 $1,621 $1,621 Sub- Total $3,342 $4,274 $5,938 $6,550 $6,889 $8,621 $8,548 $8,548
Total 583.125Labor $3,400 $4,837 $5,446 $8,256 $8,447 $8,303 $8,869 $8,869Non-Labor $3,126 $1,975 $7,950 $19,516 $12,977 $25,704 $25,464 $25,930 Total Expenses $6,526 $6,812 $13,396 $27,772 $21,424 $34,007 $34,333 $34,799
Recorded Forecast
$
$5,000
$10,000
$15,000
$20,000
$25,000
$30,000
$35,000
$40,000

83
D. GRC Account 593.125 1
Figure VIII-13 Summary of GRC Account 593.125128
Recorded and Adjusted 2011-2015/Forecast 2016-2018 (Total Company – Constant 2015 $000)
128 Refer to WP SCE-02, Vol. 9, pp.1-63.
2011 2012 2013 2014 2015 2016 2017 2018Distribution Pole Loading Program Capital Related ExpenseLabor $ $ $ $4 $111 $99 $103 $108Non-Labor $ $ $ $74 $3,070 $2,104 $2,196 $2,295 Sub- Total $ $ $ $77 $3,182 $2,203 $2,299 $2,402
Distribution Pole Loading Program RepairsLabor $ $ $ $19 $261 $ $ $Non-Labor $ $ $ $33 $549 $2,678 $5,579 $4,927 Sub- Total $ $ $ $52 $810 $2,678 $5,579 $4,927
Total 593.125Labor $ $ $ $22 $372 $99 $103 $108Non-Labor $ $ $ $107 $3,620 $4,782 $7,775 $7,221 Total Expenses $ $ $ $130 $3,992 $4,881 $7,878 $7,329
Recorded Forecast
$
$1,000
$2,000
$3,000
$4,000
$5,000
$6,000
$7,000
$8,000
$9,000