2018 full year financial results - westpac · results announcement to the market iv | westpac group...
TRANSCRIPT

Proudly Supporting AustraliaWestpac Banking CorporationABN 33 007 457 141
2018 Full Year Financial ResultsIncorporating the requirements of Appendix 4E

Results announcement to the market
ii | Westpac Group 2018 Full Year Financial Results Announcement
ASX Appendix 4E Results for announcement to the market1 Report for the full year ended 30 September 20182 Revenue from ordinary activities
3,4 ($m) up 2% to $22,133
Profit from ordinary activities after tax attributable to equity holders4 ($m) up 1% to $8,095
Net profit for the period attributable to equity holders4 ($m) up 1% to $8,095
Dividend Distributions (cents per ordinary share)
Amount per security
Franked amount per security
Final Dividend 94 94
Interim Dividend 94 94
Record date for determining entitlements to the dividend 14 November 2018 (Sydney)
13 November 2018 (New York)
1 This document comprises the Westpac Group 2018 Full Year Financial Results, and is provided to the Australian Securities Exchange
under Listing Rule 4.3A. 2 This report should be read in conjunction with the 2018 Westpac Group Annual Report and any public announcements made in the
period by the Westpac Group in accordance with the continuous disclosure requirements of the Corporations Act 2001 and ASX Listing Rules.
3 Comprises reported interest income, interest expense and non-interest income. 4 All comparisons are with the reported results for the twelve months ended 30 September 2017.

Results announcement to the market
Westpac Group 2018 Full Year Financial Results Announcement | iii
Media Release 5 November 2018
Westpac announces 2018 Full Year Results
Statutory net profit $8,095 million, up 1% Cash earnings $8,065 million, little changed Cash earnings per share, 236.2 cents, down 1% Cash return on equity (ROE) 13.0%, at the lower end of the range Westpac is seeking to achieve Unchanged, final, fully franked dividend of 94 cents per share (cps), (full year, fully franked dividend of 188 cps) Common equity Tier 1 capital ratio 10.6%, above APRA’s unquestionably strong benchmark Bank Levy $378 million (pre-tax), effective tax rate including Bank Levy 33%
Westpac Group CEO, Mr Brian Hartzer said, “In a difficult year, Westpac delivered a flat financial result.
“While the economic environment remains supportive, this result reflects the tough operating conditions for banks, with higher regulatory, compliance, and funding costs, and increased competitive pressure, particularly in the second half. In addition, provisions for customer refunds and related costs, along with legal costs, were $281 million after tax (equivalent to 3.5% of cash earnings) as we continued to work through regulatory investigations, remediations, and putting things right for customers.
“In response to these challenges, we’ve lifted productivity savings 16% to $304 million over the year.
“While earnings were flat, our balance sheet remains strong across all dimensions of asset quality, capital, and liquidity. We have also made substantial progress on our service-led strategy and digital transformation program.
“Westpac’s mortgage book remains fundamentally sound, with around 70% of Australian customers ahead on repayments2 and 90 day delinquencies remaining low.
“Results for the Business Bank and New Zealand divisions were the standout. The Business Bank delivered cash earnings growth of 8% supported by good growth in the small business sector and declining impairment charges. New Zealand’s result benefited from the completion of a two-year restructuring program, with cash earnings up 5% (NZD). WIB maintained good discipline on margin and costs, but cash earnings were down 6% mainly due to lower markets income.
“Elsewhere, conditions were more difficult. Provisions for customer refunds were higher for BT Financial Group, and the Consumer division experienced both increased funding costs and higher remediation costs.
1 Reported throughout this release on a cash earnings basis unless otherwise stated. For an explanation of cash earnings and
reconciliation to reported results refer to pages 4-6 and 125-128 of the Group’s 2018 Full Year Financial Results Announcement. 2 Including offset balances.
Financial highlights Full Year 2018 compared to Full Year 20171

Results announcement to the market
iv | Westpac Group 2018 Full Year Financial Results Announcement
“Out of a total investment spend of $1.4 billion, we invested more than $800 million in system upgrades, digital transformation, and innovation to support our ambition to be one of the world’s great service companies. Our focus has been on delivering our technology platforms, while simplifying and automating processes to make banking easier for customers. We have already migrated 100 applications onto our cloud infrastructure platforms which are now largely complete. Additionally we have over 120 APIs in production and another 180 in development.
“These capabilities support our Customer Service Hub which is progressing to schedule. While delivering these major projects, we have also significantly improved system reliability and response times, helping our people to provide better service to customers.
“We have introduced a number of new digital initiatives including Siri for Westpac, mobile cheque deposits, new online home loan applications, and E-Sign which allows a customer to complete a mortgage application online or via their mobile. Consumer payment innovations include partnerships with Google Pay, Garmin, Fit Bit, and Beem It—a mobile payment app which enables free and instant payments for anyone in Australia with a debit card, regardless of whom they bank with.
“Strategic investments in companies including Assembly Payments, Zip, Uno, and Open Agent, as well as Reinventure’s growing portfolio of Fintech startups, position Westpac to harness the benefits of data and rapid technological change while bringing new value-added services to our customers,” Mr Hartzer said.
Mr Hartzer said Westpac continues to focus on addressing issues that have been highlighted during the Royal Commission into Misconduct in the Banking, Superannuation, and Financial Services Industry.
“We remain committed to getting things right for our customers and have made good progress on implementing the ABA’s Six Point Plan. We have reinforced our values and service culture to all employees through additional training, introduced the Sedgwick remuneration recommendations for employees two years earlier than required, removed grandfathered commission payments for our salaried financial planners, and launched a simpler and more transparent pricing structure for BT’s investment platform, Panorama.
“Importantly, our new Customer and Corporate Relations division has been established to oversee complaints handling across the Group, and to improve the way we deal with customer issues, building on the important role of our Customer Advocate,” Mr Hartzer said.
Strong balance sheet
Margin management
CET1 capital ratio (%)
Net interest margin (NIM) (%)
10.6% CET1 capital ratio, above APRA’s ‘unquestionably strong’ benchmark
Liquidity ratios above regulatory minimums of 100%:
- Liquidity coverage ratio 133%
- Net stable funding ratio 114%
Net interest margin up 2bps over the year
A rise in Treasury & Markets income contributed 1bp to NIM, and margins excluding Treasury & Markets also increased 1bp
Higher lending and deposit spreads were largely offset by the full period impact of the Bank Levy
Royal Commission
Results
Results announcement to the market
Westpac Group 2018 Full Year Financial Results Announcement | v
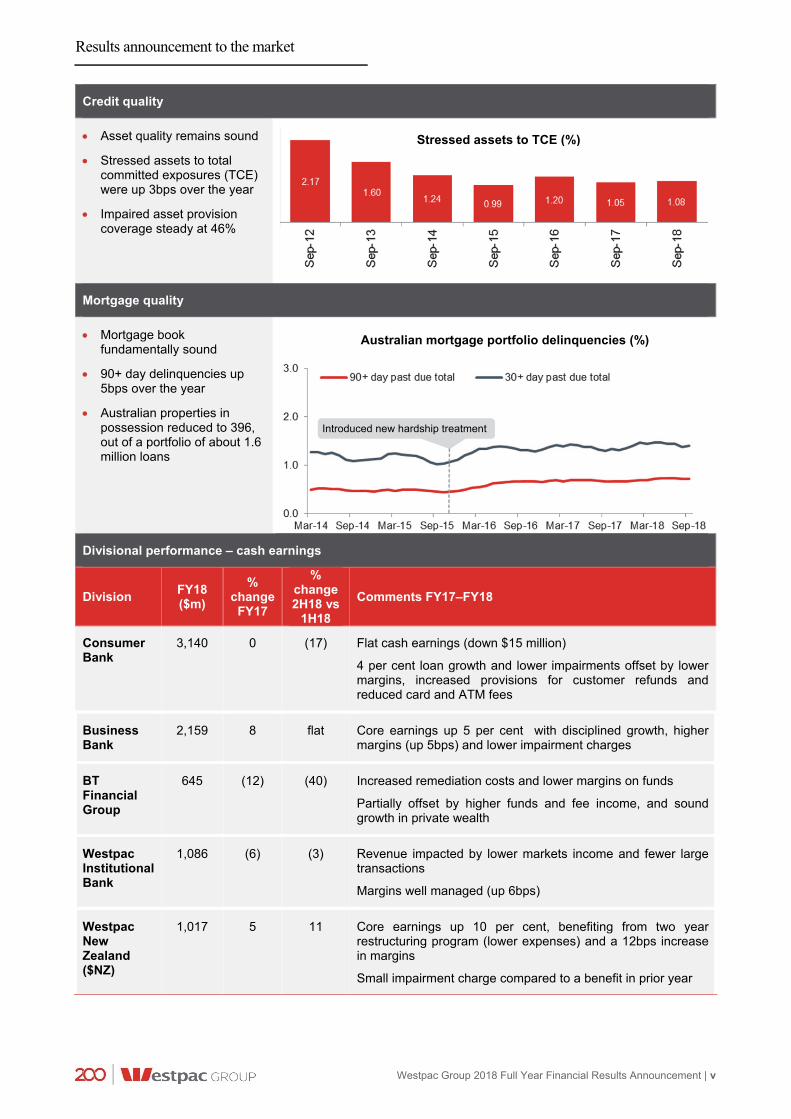
Credit quality
Asset quality remains sound
Stressed assets to total committed exposures (TCE) were up 3bps over the year
Impaired asset provision coverage steady at 46%
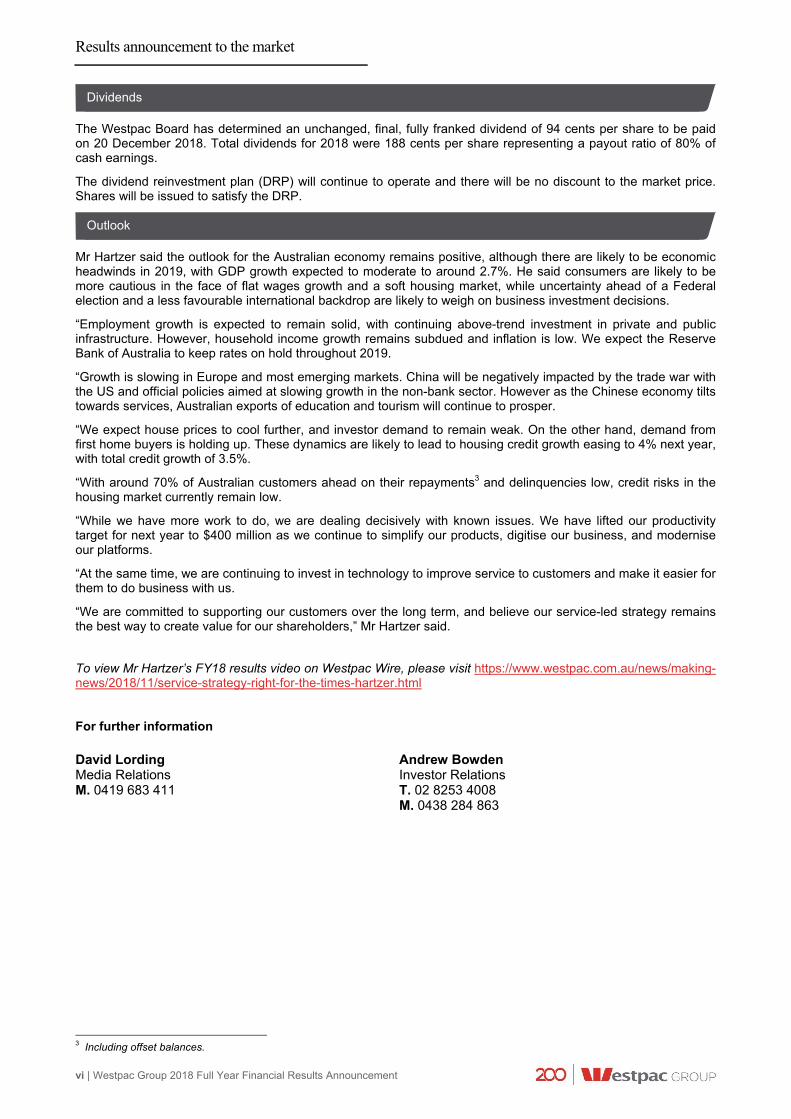
Mortgage quality
Mortgage book fundamentally sound
90+ day delinquencies up 5bps over the year
Australian properties in possession reduced to 396, out of a portfolio of about 1.6 million loans
Divisional performance – cash earnings
Division FY18 ($m)
% change
FY17
% change 2H18 vs
1H18
Comments FY17–FY18
Consumer Bank
3,140
0
(17)
Flat cash earnings (down $15 million)
4 per cent loan growth and lower impairments offset by lower margins, increased provisions for customer refunds and reduced card and ATM fees
Business Bank
2,159
8
flat
Core earnings up 5 per cent with disciplined growth, higher margins (up 5bps) and lower impairment charges
BT Financial Group
645
(12)
(40)
Increased remediation costs and lower margins on funds
Partially offset by higher funds and fee income, and sound growth in private wealth
Westpac Institutional Bank
1,086
(6)
(3)
Revenue impacted by lower markets income and fewer large transactions
Margins well managed (up 6bps)
Westpac New Zealand ($NZ)
1,017
5
11
Core earnings up 10 per cent, benefiting from two year restructuring program (lower expenses) and a 12bps increase in margins
Small impairment charge compared to a benefit in prior year
Stressed assets to TCE (%)
Australian mortgage portfolio delinquencies (%)
Introduced new hardship treatment
Results announcement to the market
vi | Westpac Group 2018 Full Year Financial Results Announcement
The Westpac Board has determined an unchanged, final, fully franked dividend of 94 cents per share to be paid on 20 December 2018. Total dividends for 2018 were 188 cents per share representing a payout ratio of 80% of cash earnings.
The dividend reinvestment plan (DRP) will continue to operate and there will be no discount to the market price. Shares will be issued to satisfy the DRP.
Mr Hartzer said the outlook for the Australian economy remains positive, although there are likely to be economic headwinds in 2019, with GDP growth expected to moderate to around 2.7%. He said consumers are likely to be more cautious in the face of flat wages growth and a soft housing market, while uncertainty ahead of a Federal election and a less favourable international backdrop are likely to weigh on business investment decisions.
“Employment growth is expected to remain solid, with continuing above-trend investment in private and public infrastructure. However, household income growth remains subdued and inflation is low. We expect the Reserve Bank of Australia to keep rates on hold throughout 2019.
“Growth is slowing in Europe and most emerging markets. China will be negatively impacted by the trade war with the US and official policies aimed at slowing growth in the non-bank sector. However as the Chinese economy tilts towards services, Australian exports of education and tourism will continue to prosper.
“We expect house prices to cool further, and investor demand to remain weak. On the other hand, demand from first home buyers is holding up. These dynamics are likely to lead to housing credit growth easing to 4% next year, with total credit growth of 3.5%.
“With around 70% of Australian customers ahead on their repayments3 and delinquencies low, credit risks in the housing market currently remain low.
“While we have more work to do, we are dealing decisively with known issues. We have lifted our productivity target for next year to $400 million as we continue to simplify our products, digitise our business, and modernise our platforms.
“At the same time, we are continuing to invest in technology to improve service to customers and make it easier for them to do business with us.
“We are committed to supporting our customers over the long term, and believe our service-led strategy remains the best way to create value for our shareholders,” Mr Hartzer said.
To view Mr Hartzer’s FY18 results video on Westpac Wire, please visit https://www.westpac.com.au/news/making-news/2018/11/service-strategy-right-for-the-times-hartzer.html For further information
David Lording Media Relations M. 0419 683 411
Andrew Bowden Investor Relations T. 02 8253 4008 M. 0438 284 863
3 Including offset balances.
Dividends
Outlook

Results announcement to the market
Westpac Group 2018 Full Year Financial Results Announcement | 1
Index
01 Group results
1.1 Reported results
1.2 Key financial information
1.3 Cash earnings results
1.4 Market share and system multiple metrics
2
2
3
4
7
02 Review of Group operations
2.1 Performance overview
2.2 Review of earnings
2.3 Credit quality
2.4 Balance sheet and funding
2.5 Capital and dividends
2.6 Sustainability performance
8
9
18
33
35
40
46
03 Divisional results
3.1 Consumer Bank
3.2 Business Bank
3.3 BT Financial Group (Australia)
3.4 Westpac Institutional Bank
3.5 Westpac New Zealand
3.6 Group Businesses
49
49
52
54
59
62
64
04 2018 Full Year financial report
4.1 Significant developments
4.2 Consolidated income statement
4.3 Consolidated statement of comprehensive income
4.4 Consolidated balance sheet
4.5 Consolidated statement of changes in equity
4.6 Consolidated cash flow statement
4.7 Notes to the consolidated financial statements
4.8 Statement in relation to audit of the financial statements
66
67
80
81
82
83
85
86
116
05 Cash earnings financial information 117
06 Other information
6.1 Disclosure regarding forward-looking statements
6.2 References to websites
6.3 Credit ratings
6.4 Dividend reinvestment plan
6.5 Changes in control of Group entities
6.6 Financial calendar and Share Registry details
6.7 Exchange rates
130
130
131
131
131
131
133
138
07 Glossary 140
In this announcement references to ‘Westpac’, ‘WBC’, ‘Westpac Group’, ‘the Group’, ‘we’, ‘us’ and ‘our’ are to Westpac Banking Corporation and its controlled entities, unless it clearly means just Westpac Banking Corporation.
All references to $ in this document are to Australian dollars unless otherwise stated. Financial calendar
Final results announcement 5 November 2018
Ex-dividend date for final dividend 13 November 2018
Record date for final dividend (Sydney) 14 November 2018
Final dividend payable 20 December 2018

2018 Full Year financial results Group results
2 | Westpac Group 2018 Full Year Financial Results Announcement
1.0 Group results
1.1 Reported results
Reported net profit attributable to owners of Westpac Banking Corporation is prepared in accordance with the requirements of Australian Accounting Standards (AAS) and regulations applicable to Australian Authorised Deposit-taking Institutions (ADIs).
% Mov't1 % Mov't1
Half Year Half Year Sept 18 - Full Year Full Year Sept 18 -
$m Sept 18 March 18 Mar 18 Sept 18 Sept 17 Sept 17
Net interest income 8,227 8,278 (1) 16,505 15,516 6
Non-interest income 2,753 2,875 (4) 5,628 6,286 (10)
Net operating income before operating expenses
and impairment charges 10,980 11,153 (2) 22,133 21,802 2
Operating expenses (4,967) (4,725) 5 (9,692) (9,434) 3
Net profit before impairment charges
and income tax expense 6,013 6,428 (6) 12,441 12,368 1
Impairment charges (317) (393) (19) (710) (853) (17)
Profit before income tax 5,696 6,035 (6) 11,731 11,515 2
Income tax expense (1,797) (1,835) (2) (3,632) (3,518) 3
Net profit for the period 3,899 4,200 (7) 8,099 7,997 1
Net profit attributable to non-controlling interests (2) (2) - (4) (7) (43)
Net profit attributable to owners of Westpac
Banking Corporation 3,897 4,198 (7) 8,095 7,990 1
Net profit attributable to owners of Westpac Banking Corporation for Full Year 2018 was $8,095 million, an increase of $105 million or 1% compared to Full Year 2017. Features of this result included a $331 million or 2% increase in net operating income before operating expenses and impairment charges, a $258 million or 3% increase in operating expenses and a $143 million or 17% decrease in impairment charges.
Net interest income increased $989 million or 6% compared to Full Year 2017, with total loan growth of 4%, mostly from Australian housing which grew 4%. Reported net interest margin increased 7 basis points to 2.13%, reflecting increased spreads on certain Australian mortgages, a rise in Treasury income and contribution from fair value gains on economic hedges and higher deposit spreads. These increases were partly offset by the full period impact of the Bank Levy which was effective from July 2017. Wholesale funding costs were little changed, as short term funding costs increased while long term funding costs decreased. Net interest income, loans, deposits and other borrowings and net interest margins are discussed further in Sections 2.2.1 to 2.2.4.
Non-interest income decreased $658 million or 10% compared to Full Year 2017 primarily due to a decrease in trading income of $257 million, the non-repeat of a large gain of $279 million on disposal of an associate in Full Year 2017 (BTIM)2, a revaluation loss of $104 million on the Pendal investment in Full Year 2018, and additional provisions for estimated customer refunds and payments recorded as negative income. These items were partly offset by income related to the exit of the Hastings business ($135 million). Non-interest income is discussed further in Section 2.2.5.
Operating expenses increased $258 million or 3% compared to Full Year 2017. The rise included annual salary increases, higher technology expenses related to the Group’s investment program, and an increase in regulatory and compliance costs and costs associated with the exit of the Hastings business. These increases were partly offset by productivity benefits and lower amortisation of intangibles. Operating expenses are discussed further in Section 2.2.8.
Impairment charges were $143 million or 17% lower compared to Full Year 2017. Asset quality remained sound, with stressed exposures as a percentage of total committed exposures at 1.08%, up 3 basis points over the year. The decrease in impairment charges was primarily due to reduced individual provisions for larger facilities. Impairment charges are discussed further in Section 2.2.9.
The effective tax rate of 31.0% was higher than the Full Year 2017 effective tax rate of 30.6% mostly related to an increase in non-deductible expenses. Income tax expense is discussed further in Section 2.2.10.
1 Percentage movement represents an increase / (decrease) to the relevant comparative period. 2 Pendal Group Limited (Pendal) was previously called BT Investment Management (BTIM).

2018 Full Year financial results Group results
Westpac Group 2018 Full Year Financial Results Announcement | 3
1.2 Key financial information
% Mov't % Mov't
Half Year Half Year Sept 18 - Full Year Full Year Sept 18 -
Sept 18 March 18 Mar 18 Sept 18 Sept 17 Sept 17
Shareholder value Earnings per ordinary share (cents) 113.8 123.7 (8) 237.5 238.0 - Weighted average ordinary shares (millions)1 3,421 3,392 1 3,406 3,355 2 Fully franked dividends per ordinary share (cents) 94 94 - 188 188 - Return on average ordinary equity 12.34% 13.79% (145bps) 13.05% 13.65% (60bps) Average ordinary equity ($m) 62,978 61,051 3 62,017 58,556 6 Average total equity ($m) 63,026 61,065 3 62,048 58,576 6 Net tangible asset per ordinary share ($) 15.39 15.00 3 15.39 14.66 5 Business performance Interest spread 1.92% 2.00% (8bps) 1.95% 1.89% 6bps Benefit of net non-interest bearing assets, liabilities and equity 0.18% 0.16% 2bps 0.18% 0.17% 1bps Net interest margin 2.10% 2.16% (6bps) 2.13% 2.06% 7bps Average interest-earning assets ($m) 782,834 767,011 2 774,944 752,294 3 Expense to income ratio 45.24% 42.37% 287bps 43.79% 43.27% 52bps Capital, funding and liquidity Common equity Tier 1 capital ratio - APRA Basel III 10.63% 10.50% 13bps 10.63% 10.56% 7bps - Internationally comparable2 16.14% 16.13% 1bps 16.14% 16.20% (6bps) Credit risk weighted assets (credit RWA) ($m) 362,749 361,391 - 362,749 349,258 4 Total risk weighted assets (RWA) ($m) 425,384 415,744 2 425,384 404,235 5 Liquidity coverage ratio (LCR) 133% 134% (131bps) 133% 124% large Net stable funding ratio (NSFR)3 114% 112% 135bps 114% 109% large Asset quality Gross impaired assets to gross loans 0.20% 0.22% (2bps) 0.20% 0.22% (2bps) Gross impaired assets to equity and total provisions 2.09% 2.33% (24bps) 2.09% 2.39% (30bps) Gross impaired asset provisions to gross impaired assets 46.12% 45.54% 58bps 46.12% 46.30% (18bps) Total committed exposures (TCE) ($m) 1,038,006 1,023,017 1 1,038,006 1,005,882 3 Total stressed exposures as a % of TCE 1.08% 1.09% (1bps) 1.08% 1.05% 3bps Total provisions to gross loans 43bps 45bps (2bps) 43bps 45bps (2bps) Mortgages 90+ day delinquencies 0.67% 0.65% 2bps 0.67% 0.62% 5bps Other consumer loans 90+ day delinquencies 1.64% 1.64% - 1.64% 1.57% 7bps Collectively assessed provisions to credit RWA 73bps 75bps (2bps) 73bps 76bps (3bps) Balance sheet ($m)4 Loans 709,690 701,393 1 709,690 684,919 4 Total assets 879,592 871,855 1 879,592 851,875 3 Deposits and other borrowings 559,285 547,736 2 559,285 533,591 5 Total liabilities 815,019 809,190 1 815,019 790,533 3 Total equity 64,573 62,665 3 64,573 61,342 5 Wealth Management
Average Group funds ($bn)5 217.3 217.3 - 217.3 208.4 4
Life insurance in-force premiums (Australia) ($m) 1,277 1,276 - 1,277 1,068 20
General insurance gross written premiums (Australia) ($m) 252 251 - 503 508 (1)
1 Weighted average number of fully paid ordinary shares listed on the ASX for the relevant period less average Westpac shares held by
the Group (“Treasury shares”). 2 Refer Glossary for definition. 3 The NSFR was effective from 1 January 2018 for Australian Authorised Deposit-taking Institutions (ADIs). Full Year September 2017
is presented on a proforma basis. 4 Spot balances. 5 Averages are based on six months for the halves and twelve months for the full year.

2018 Full Year financial results Group results
4 | Westpac Group 2018 Full Year Financial Results Announcement
1.3 Cash earnings results
Throughout this results announcement, reporting and commentary of financial performance will refer to ‘cash earnings results’, unless otherwise stated. Section 4 is prepared on a reported basis. A reconciliation of cash earnings to reported results is set out in Section 5, Note 8.
% Mov't % Mov't
Half Year Half Year Sept 18 - Full Year Full Year Sept 18 -
$m Sept 18 March 18 Mar 18 Sept 18 Sept 17 Sept 17
Net interest income 8,038 8,301 (3) 16,339 15,704 4
Non-interest income 2,762 2,850 (3) 5,612 5,852 (4)
Net operating income 10,800 11,151 (3) 21,951 21,556 2
Operating expenses (4,932) (4,654) 6 (9,586) (9,105) 5
Core earnings 5,868 6,497 (10) 12,365 12,451 (1)
Impairment charges (317) (393) (19) (710) (853) (17)
Operating profit before income tax 5,551 6,104 (9) 11,655 11,598 -
Income tax expense (1,735) (1,851) (6) (3,586) (3,529) 2
Net profit 3,816 4,253 (10) 8,069 8,069 -
Net profit attributable to non-controlling interests (2) (2) - (4) (7) (43)
Cash earnings 3,814 4,251 (10) 8,065 8,062 -
1.3.1 Key financial information – cash earnings basis1
% Mov't % Mov't
Half Year Half Year Sept 18 - Full Year Full Year Sept 18 -
$m Sept 18 March 18 Mar 18 Sept 18 Sept 17 Sept 17
Shareholder value
Cash earnings per ordinary share (cents) 111.2 125.0 (11) 236.2 239.7 (1)
Economic profit ($m)2 1,395 2,049 (32) 3,444 3,774 (9)
Weighted average ordinary shares (millions)3 3,429 3,400 1 3,414 3,364 1
Dividend payout ratio4 84.66% 75.28% large 79.94% 78.71% 123bps
Cash earnings on average ordinary equity (ROE) 12.08% 13.96% (188bps) 13.00% 13.77% (77bps)
Cash earnings on average tangible
ordinary equity (ROTE) 14.27% 16.60% (233bps) 15.41% 16.55% (114bps)
Average ordinary equity ($m) 62,978 61,051 3 62,017 58,556 6
Average tangible ordinary equity ($m)5 53,327 51,344 4 52,338 48,725 7 Business performance
Interest spread 1.87% 2.00% (13bps) 1.94% 1.91% 3bps
Benefit of net non-interest bearing assets,
liabilities and equity 0.18% 0.17% 1bps 0.17% 0.18% (1bps)
Net interest margin 2.05% 2.17% (12bps) 2.11% 2.09% 2bps
Average interest-earning assets ($m) 782,834 767,011 2 774,944 752,294 3
Expense to income ratio 45.67% 41.74% 393bps 43.67% 42.24% 143bps
Full time equivalent employees (FTE) 35,029 35,720 (2) 35,029 35,096 -
Revenue per FTE ($ '000's) 305 315 (3) 620 613 1
Effective tax rate 31.26% 30.32% 94bps 30.77% 30.43% 34bps Impairment charges
Impairment charges to average loans annualised 9bps 11bps (2bps) 10bps 13bps (3bps)
Net write-offs to average loans annualised 14bps 13bps 1bps 14bps 22bps (8bps)
1 Averages are based on six months for the halves and twelve months for the full year. 2 Refer to Section 5, Note 9 for further details. 3 Weighted average ordinary shares – cash earnings represents the weighted average number of fully paid ordinary shares listed on the ASX for
the relevant period. 4 The dividend payout ratio for 1H18 was based on the number of shares on issue as at 31 March. On 3 April 2018, some CPS converted into
ordinary shares. Inclusion of these shares would have resulted in a dividend payout ratio of 75.70%. 5 Average tangible ordinary equity is calculated as average equity less intangible assets (excluding capitalised software).

2018 Full Year financial results Group results
Westpac Group 2018 Full Year Financial Results Announcement | 5
Cash earnings policy
In assessing financial performance, including divisional results, Westpac Group uses a measure of performance referred to as ‘cash earnings’. Cash earnings is viewed as a measure of the level of profit that is generated by ongoing operations and is therefore considered in assessing distributions, including dividends. Cash earnings is neither a measure of cash flow nor net profit determined on a cash accounting basis, as it includes both cash and non-cash adjustments to statutory net profit.
Management believes this allows the Group to more effectively assess performance for the current period against prior periods and to compare performance across business divisions and across peer companies.
To determine cash earnings, three categories of adjustments are made to reported results:
Material items that key decision makers at the Westpac Group believe do not reflect ongoing operations;
Items that are not considered when dividends are recommended, such as the amortisation of intangibles, impact of Treasury shares and economic hedging; and
Accounting reclassifications between individual line items that do not impact reported results.
A full reconciliation of reported results to cash earnings is set out in Section 5, Note 8.
Reconciliation of reported results to cash earnings
% Mov't % Mov't
Half Year Half Year Sept 18 - Full Year Full Year Sept 18 -
$m Sept 18 March 18 Mar 18 Sept 18 Sept 17 Sept 17
NET PROFIT ATTRIBUTABLE TO OWNERS OF
WESTPAC BANKING CORPORATION 3,897 4,198 (7) 8,095 7,990 1
Amortisation of intangible assets - 17 (100) 17 137 (88)
Fair value (gain)/loss on economic hedges (163) 37 large (126) 69 large
Ineffective hedges 4 9 (56) 13 16 (19)
Adjustments related to Pendal (previously BTIM) 73 - - 73 (171) large
Treasury shares 3 (10) large (7) 21 large
Total cash earnings adjustments (post-tax) (83) 53 large (30) 72 large
Cash earnings 3,814 4,251 (10) 8,065 8,062 -
Outlined below are the cash earnings adjustments to the reported result:
Amortisation of intangible assets: Identifiable intangible assets arising from business acquisitions are amortised over their useful lives, ranging between four and twenty years. This amortisation (excluding capitalised software) is a cash earnings adjustment because it is a non-cash flow item and does not affect cash distributions available to shareholders. The last of these intangible assets were fully amortised in December 2017;
Fair value on economic hedges (which do not qualify for hedge accounting under AAS) comprise:
- The unrealised fair value (gain)/loss on foreign exchange hedges of future New Zealand earnings impacting non-interest income is reversed in deriving cash earnings as they may create a material timing difference on reported results but do not affect the Group’s cash earnings over the life of the hedge; and
- The unrealised fair value (gain)/loss on hedges of accrual accounted term funding transactions are reversed in deriving cash earnings as they may create a material timing difference on reported results but do not affect the Group’s cash earnings over the life of the hedge.
Ineffective hedges: The unrealised (gain)/loss on ineffective hedges is reversed in deriving cash earnings because the gain or loss arising from the fair value movement in these hedges reverses over time and does not affect the Group’s profits over time;

2018 Full Year financial results Group results
6 | Westpac Group 2018 Full Year Financial Results Announcement
Adjustments related to Pendal (previously BTIM): The Group recognised a gain, net of costs, associated with
the partial sale of shares in Pendal Group Limited in Full Year 2017. In Full Year 2018, the Group marked to market its current holding of Pendal shares. Consistent with prior years, these items have been treated as a cash earnings adjustment given their size and that it does not reflect ongoing operations. The Group has indicated that it may sell the remaining 10% shareholding in Pendal at some future date. Any future gain or loss on this shareholding will similarly be excluded from the calculation of cash earnings;
Treasury shares: Under AAS, Westpac shares held by the Group in the managed funds and life businesses are deemed to be Treasury shares and the results of holding these shares cannot be recognised in the reported results. In deriving cash earnings, these results are included to ensure there is no asymmetrical impact on the Group’s profits because the Treasury shares support policyholder liabilities and equity derivative transactions which are re-valued in determining income; and
Accounting reclassifications between individual line items that do not impact reported results comprise:
- Policyholder tax recoveries: Income and tax amounts that are grossed up to comply with the AAS covering Life Insurance Business (policyholder tax recoveries) are reversed in deriving income and taxation expense on a cash earnings basis; and
- Operating leases: Under AAS rental income on operating leases is presented gross of the depreciation of the assets subject to the lease. These amounts are offset in deriving non-interest income and operating expenses on a cash earnings basis.
The guidance provided in Australian Securities and Investments Commission (ASIC) Regulatory Guide 230 has been followed when presenting this information.
This Full Year Results Announcement is unaudited
PricewaterhouseCoopers has audited the financial statements contained within the Westpac 2018 Full Year financial report and has issued an unmodified audit report. This Full Year Results Announcement has not been subject to audit by PricewaterhouseCoopers. The financial information contained in this Full Year Results Announcement includes financial information extracted from the audited financial statements together with financial information that has not been audited. The cash earnings disclosed as part of this Full Year Results Announcement have not been separately audited, however they are consistent with the financial information included in Note 2 Segment Reporting of the financial statements in the 2018 Annual Report.
2018 Full Year financial results Group results
Westpac Group 2018 Full Year Financial Results Announcement | 7
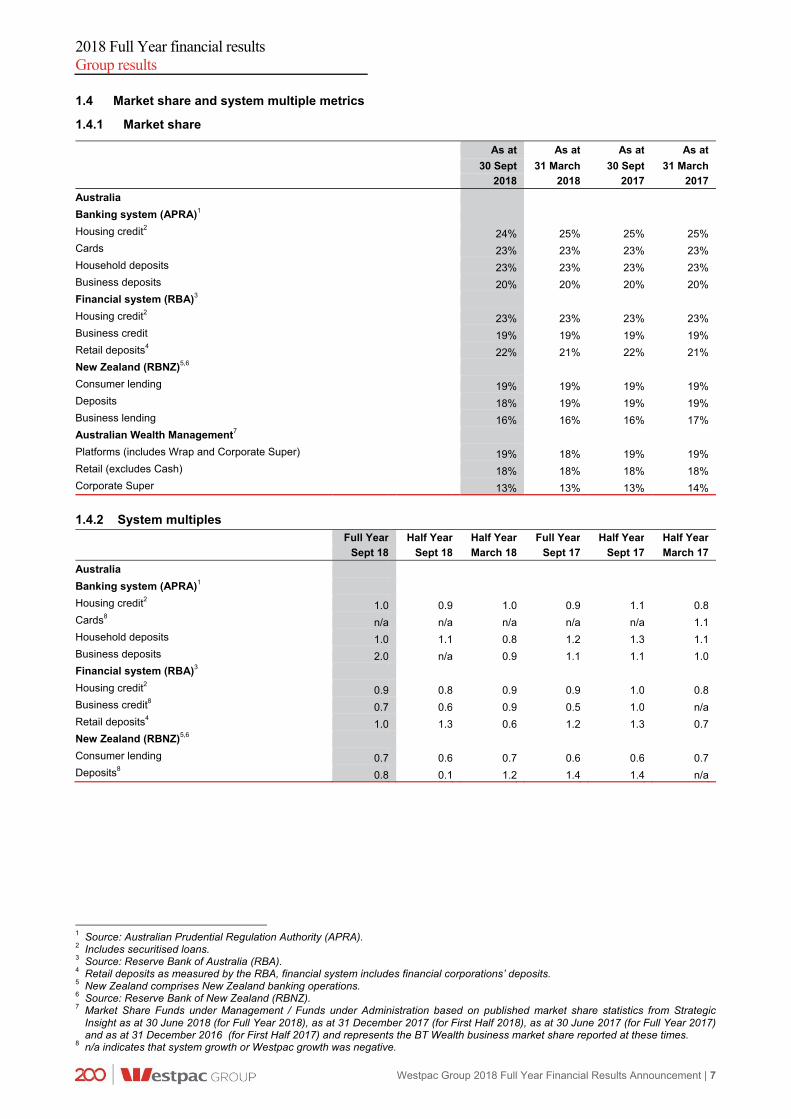
1.4 Market share and system multiple metrics
1.4.1 Market share
As at As at As at As at
30 Sept 31 March 30 Sept 31 March
2018 2018 2017 2017
Australia
Banking system (APRA)1
Housing credit2 24% 25% 25% 25%
Cards 23% 23% 23% 23%
Household deposits 23% 23% 23% 23%
Business deposits 20% 20% 20% 20%
Financial system (RBA)3
Housing credit2 23% 23% 23% 23%
Business credit 19% 19% 19% 19%
Retail deposits4 22% 21% 22% 21%
New Zealand (RBNZ)5,6
Consumer lending 19% 19% 19% 19%
Deposits 18% 19% 19% 19%
Business lending 16% 16% 16% 17%
Australian Wealth Management7
Platforms (includes Wrap and Corporate Super) 19% 18% 19% 19%
Retail (excludes Cash) 18% 18% 18% 18%
Corporate Super 13% 13% 13% 14%
1.4.2 System multiples Full Year Half Year Half Year Full Year Half Year Half Year
Sept 18 Sept 18 March 18 Sept 17 Sept 17 March 17
Australia
Banking system (APRA)1
Housing credit2 1.0 0.9 1.0 0.9 1.1 0.8
Cards8 n/a n/a n/a n/a n/a 1.1
Household deposits 1.0 1.1 0.8 1.2 1.3 1.1
Business deposits 2.0 n/a 0.9 1.1 1.1 1.0
Financial system (RBA)3
Housing credit2 0.9 0.8 0.9 0.9 1.0 0.8
Business credit8 0.7 0.6 0.9 0.5 1.0 n/a
Retail deposits4 1.0 1.3 0.6 1.2 1.3 0.7
New Zealand (RBNZ)5,6
Consumer lending 0.7 0.6 0.7 0.6 0.6 0.7
Deposits8 0.8 0.1 1.2 1.4 1.4 n/a
1 Source: Australian Prudential Regulation Authority (APRA). 2 Includes securitised loans. 3 Source: Reserve Bank of Australia (RBA). 4 Retail deposits as measured by the RBA, financial system includes financial corporations’ deposits. 5 New Zealand comprises New Zealand banking operations. 6 Source: Reserve Bank of New Zealand (RBNZ). 7 Market Share Funds under Management / Funds under Administration based on published market share statistics from Strategic
Insight as at 30 June 2018 (for Full Year 2018), as at 31 December 2017 (for First Half 2018), as at 30 June 2017 (for Full Year 2017) and as at 31 December 2016 (for First Half 2017) and represents the BT Wealth business market share reported at these times.
8 n/a indicates that system growth or Westpac growth was negative.

2018 Full Year financial results Review of Group operations
8 | Westpac Group 2018 Full Year Financial Results Announcement
2.0 Review of Group operations
Movement in cash earnings ($m)Second Half 2018 – First Half 2018
76116
(278)
(263)
Net interest income
(88)
Tax & non-controlling interests
Impairment charges
Operating expenses
4,251
3,814
Non-interest income
Second Half 2018 cash earnings
-437
First Half 2018 cash earnings
Movement in cash earnings ($m)Full Year 2018 – Full Year 2017
635
143
Full Year 2018 cash earnings
8,065
(240)
Net interest income
Impairment charges
Tax & non-controlling interests
(54)
Non-interest income
8,062
Operating expenses
Full Year 2017 cash earnings
(481)
+3

2018 Full Year financial results Review of Group operations
Westpac Group 2018 Full Year Financial Results Announcement | 9
2.1 Performance overview
Overview
Full Year 2018 has been a challenging period for financial services companies, including Westpac, with the commencement of The Royal Commission into Misconduct in the Banking, Superannuation and Financial Services Industry (Royal Commission), a slowdown in system loan and deposit growth, and the full impact of the Bank Levy introduced in July 2017. Within this environment, Westpac reported cash earnings of $8,065 million in Full Year 2018, $3 million higher than for Full Year 2017.
Given the significance of the Royal Commission it is important to outline its impact and to discuss how Westpac has been responding to some of the developments.
The Royal Commission has been a valuable and rigorous process. Established in mid-December 2017, the Royal Commission has now completed the majority of its hearings, and on 28 September 2018 released its interim report. The interim report raised a number of important points of policy and principle for consideration by Westpac, the industry, regulators and policy makers. It signalled that financial services organisations, including Westpac, must do more to meet the needs of customers and the community, including by preventing, detecting and addressing misconduct while at the same time consistently meeting legal and regulatory obligations. Westpac provided a formal response to the interim report on 26 October 2018.
Improving outcomes for customers
The stories and examples of poor behaviour affecting customers that have come to light in the Royal Commission are confronting and have understandably impacted the public’s trust in the industry.
Westpac has already commenced a number of initiatives to improve its policies, procedures and practices for customers. Many of these started prior to the establishment of the Royal Commission. Major initiatives have included:
changing the way Westpac pays its employees. This included the removal of all individual product incentives for branch staff and the full implementation of the Sedgwick recommendations two years ahead of schedule. As a result, 70% of incentives for our front line people are now non-financial measures;
ceasing the payment of grandfathered commissions to Westpac employed financial advisers. This will directly benefit more than 140,000 BT advice customers;
implementing the Australian Banking Association’s “Six point plan” aimed at improving the sector’s reputation;
continuing to conduct detailed product by product reviews to reassess their features and how they can best be structured to meet customer’s needs; and
creating a new Group Executive role of Customer and Corporate Relations which, amongst other responsibilities, has been tasked with bringing together the complaints management processes from across the Group to complement the role of Customer Advocate Officer, materially improving complaints handling, more systematically identifying root causes of complaints, helping to protect more vulnerable customers and resolving long-standing issues.
At the same time, where Westpac gets things wrong the Group puts things right for customers. In Full Year 2018 the Group booked provisions of $380 million (after tax cost of $281 million) for estimated customer refunds, payments and associated costs. Of these provisions, $105 million was charged against net interest income, and $163 million was charged against non-interest income. A further $112 million was included in expenses. The provisions covered matters including:
certain advice fees associated with the Group’s salaried financial planners, including where inadequate advice was provided, incidences where advice services were not provided, or where it has not been possible to verify if the advice services were provided;
additional provisions to resolve legacy product issues; and
costs associated with the above along with provisions for recent litigation.
In Full Year 2017 the Group booked $169 million of provisions for customer refunds and payments, or $118 million after tax.

2018 Full Year financial results Review of Group operations
10 | Westpac Group 2018 Full Year Financial Results Announcement
Financial Performance
Westpac’s cash earnings of $8,065 million in Full Year 2018 was little changed over Full Year 2017 cash earnings of $8,062 million. While underlying business growth was sound, with loan growth of 4%, average funds up 4%, and life insurance in-force premiums 20% higher, the result in Full Year 2018 was impacted by the higher provisions indicated above, the full period impact of the Bank Levy, and a weaker markets contribution ($151 million) in Westpac Institutional Bank (WIB). The Group began the year well with cash earnings of $4,251 million in First Half 2018, however as the provisions and weaker markets impacts were concentrated in the second half of the year, Second Half 2018 cash earnings were 10% lower to $3,814 million. Second Half 2018 also saw a decline in margins, including from higher short term wholesale funding costs.
The relatively flat cash earnings combined with a 1% increase in shares on issue, led to a 1% decline in cash earnings per share (EPS) to 236.2 cents in Full Year 2018. New share issuance, as part of the dividend reinvestment plan and the conversion of a portion of Westpac CPS into ordinary shares, increased average ordinary equity by 6% which in turn led to the Group’s ROE falling to 13.0%, down 77 basis points. Consistent with the rise in capital, net tangible assets per share increased 5% to $15.39.
While the economic environment remains positive with real GDP reaching 3.4% for the year to June 2018, unemployment remaining at historical lows and business conditions generally improving, the operating environment for financial services has been more challenging. In particular, findings from the Royal Commission have contributed to a deterioration in sentiment towards the sector while credit growth has eased by around 1 percentage point to 4.5% from both a moderation in the housing market and the full period impact of macro-prudential rules on lending. Weaker sentiment toward the sector has also contributed to lower activity in wealth management and insurance. At the same time, competition has remained intense from both local and international financial institutions, including non-banks.
While Australia’s cash rate was unchanged over the year, short term interest rates increased with the bank bill swap rate (BBSW) rising from early in calendar 2018 from around 1.7% to closer to 2.0%. The second half of 2018 also saw reduced opportunities in financial markets which in turn led to a lower contribution from WIB markets.
Over the year, lending across the Group grew at 4%, a little below system in Australia and New Zealand. Growth eased through the year, with two thirds of the lending increase recorded in the first half. The slower growth in the second half reflected a moderation in housing growth, a small decline in offshore lending and a weakening $NZ. Growth for the year was spread across Australian mortgages (up 4%), Australian Business (up 3%) and in New Zealand (up 4%) while other personal lending (cards, personal lending and auto finance) declined. In Australia, Westpac grew comfortably below APRA’s mortgage macro-prudential rules through the year maintaining investor property growth below 10% per annum and holding the proportion of new interest only mortgages to less than 30% of new flows.
Customer deposits increased 6% over the year as the Group continues to target deposit growth higher than lending growth. This year, the increase in customer deposits fully funded loan growth, lifting the deposit to loan ratio to 73% at 30 September 2018. This ratio was up almost 2 percentage points over the year and further improved Westpac’s funding mix. Deposit growth was spread across categories, with term deposits the largest contributor. Savings, transaction and interest offset accounts all experienced sound growth.
Net interest margins were up 2 basis points over the year although the trends were different across the halves. In First Half 2018, margins were higher, lifted by the repricing of investor and interest only mortgages in late 2017, higher deposit spreads and increased Treasury income. In Second Half 2018 margins were 12 basis points lower (compared to First Half 2018) as competition remained intense and customers continued to switch to lower spread products (including the switching of interest only lending into principal and interest loans). Margins in Second Half 2018 were also reduced by higher short term wholesale funding costs and lower Treasury income.
The Bank Levy cost $378 million in Full Year 2018, up from $95 million in Full Year 2017, and reduced margins by a further 4 basis points over the year. On a cash earnings per share basis, the Full Year 2018 impact of the Bank Levy is equivalent to around 8 cents per share. The Bank Levy only applied for one quarter in 2017.
In 2018, Westpac finalised the exit of its infrastructure funds business, Hastings Funds Management (Hastings). While the exit had a small impact on cash earnings it had a more significant impact on non-interest income and costs. In particular, as part of the exit this year, the business recognised $135 million in income while writing off $105 million in goodwill, and incurring other exit costs of $16 million (including restructuring costs).
Non-interest income declined $240 million in Full Year 2018 to $5,612 million or 4%. The decline included a $52 million increase in provisions for estimated customer refunds and payments and the Hastings income of $135 million. Excluding these items non-interest income was down $323 million or 5% with the decline mostly due to lower trading income of $291 million and lower fee income including the full period effect of eliminating foreign ATM fees, removing certain transaction fees, and capping account-keeping fees for some legacy accounts to no more than $5 per month. Partially offsetting these declines were higher business line fees, a rise in insurance revenue and gains on NZ hedges.

2018 Full Year financial results Review of Group operations
Westpac Group 2018 Full Year Financial Results Announcement | 11
In aggregate, the 4% rise in net interest income, combined with the 4% decline in non-interest income led to total operating income rising 2%.
Expenses increased 5% or $481 million. Expense growth this year was impacted by the exit of Hastings, higher provisions for implementing customer refunds and payments, and provisions for estimated litigation settlements. Excluding these infrequent items of $233 million, expenses increased 3%.
The Group has continued to offset business as usual cost increases with productivity gains. Productivity savings were $304 million in Full Year 2018, up $42 million over the year. Savings were achieved by:
simplifying the organisation: through product rationalisation, reducing the number of products, and operating model changes - such as removing management spans and layers ($180 million);
migrating more activity to digital: This included more customers using e-statements, and a shift to digital transactions and self-service, which allowed us to amalgamate 47 branches and remove 443 ATMs across Australia and New Zealand ($61 million); and
modernising systems, automating processes, and reviewing and re-negotiating contracts ($63 million).
Excluding the infrequent items, most of the increase in costs was related to higher investment and regulatory and compliance spending. This included $62 million in additional expenses associated with the Royal Commission, and higher technology costs including from the NPP, Panorama, and cybersecurity.
Given the significant infrequent items (higher costs and negative revenues), the expense to income ratio increased 143 basis points over the year, to be 43.7% for Full Year 2018.
Core earnings (revenue less expenses but before impairment charges) were down 1%.
Credit quality remained sound, with key metrics relatively stable over the year and over the prior half. Impaired assets were little changed over the year with no new facilities greater than $50 million becoming impaired.
As a result, impairment charges were $710 million for Full Year 2018, down 17% (or $143 million) on Full Year 2017 and representing 10 basis points to gross loans. Most of the decline was due to lower new individually assessed provisions with fewer new impairment provisions partially offset by lower write-backs.
Lower new impaired assets, along with the continued work-out of facilities contributed to a reduction of $66 million in total provisions for impairment charges on loans and credit commitments for Full Year 2018. The Group’s ratio of gross impaired asset provisions to impaired assets was 46% (down 18 basis points on the year) while the ratio of collectively assessed provisions to credit risk weighted assets was down 3 basis points to 0.73%. The decline in this ratio was due mostly to mortgage modelling changes which lifted RWA. The overlay provision was $22 million lower (to $301 million) mostly from the continuing improvement in the NZ dairy sector.
The effective tax rate was 30.8% for the year, this is above the corporate tax rate and higher over the year due to the non-deductibility of certain expenses, including litigation penalties, the write-off of Hastings goodwill, and hybrid distributions.
Across divisions, earnings results were mixed. Business Bank recorded an 8% rise cash earnings with higher margins and a 15% decline in impairment charges while New Zealand (in NZ$) recorded a 5% increase in cash earnings, with core earnings up 10% from higher margins and improved efficiency. Consumer Bank’s cash earnings were relatively flat over the year (down $15 million), with lower non-interest income and higher operating expenses mostly offset by lower impairment charges. BT Financial Group recorded a 12% decrease in cash earnings with growth in funds and insurance premiums more than offset by higher provisions for estimated customer refunds and payments and associated costs. WIB recorded a 6% decrease in cash earnings reflecting lower revenue, primarily in Financial Markets, partially offset by an impairment benefit.
Balance sheet and credit quality
The Group maintained the strength of its balance sheet across all dimensions:
a CET1 capital ratio of 10.6%, slightly above the “unquestionably strong” benchmark set by APRA of 10.5%. The ratio was 7 basis points higher over the year as organic capital generation was largely offset by RWA model changes;
a liquidity coverage ratio (LCR) of 133%, above the 100% regulatory minimum;
a net stable funding ratio (NSFR) of 114%, comfortably above the 100% regulatory minimum which applied from 1 January 2018; and
credit quality remaining sound with stressed exposures to TCE remaining low relative to historical experience.

2018 Full Year financial results Review of Group operations
12 | Westpac Group 2018 Full Year Financial Results Announcement
Stressed exposures to TCE were 1.08% at 30 September 2018, 1 basis point down from 31 March 2018, and 3 basis points higher from September 2017. Looking at the three categories within stressed exposures, impaired assets were little changed, 90+ days past due and not impaired increased by 5 basis points, while watchlist and substandard exposures were 1 basis point lower. Stress has particularly improved across Institutional and in New Zealand, with a small rise in stress in the commercial portfolio.
Credit quality of the mortgage portfolio has remained sound with 90+ day delinquencies of 0.67% at 30 September 2018. This ratio was 5 basis points higher over the year and up 2 basis points over the prior six months. There were 396 properties in possession at 30 September 2018, 41 lower than the same period last year.
Dividends
The Board determined a final ordinary dividend of 94 cents per share, fully franked, unchanged over both Second Half 2017 and First Half 2018.
The final ordinary dividend represents a Second Half 2018 payout ratio of 84.7% (Full Year 2018: 79.9%) and a dividend yield of 6.7%1. The Board has determined to issue shares to satisfy the dividend reinvestment plan (DRP) for the final 2018 dividend and to apply no discount to the market price used to determine the number of shares issued under the DRP. The final ordinary dividend will be paid on 20 December 2018 with the record date of 14 November 20182. After allowing for the final dividend, the Group’s adjusted franking account balance was $1,357 million.
Strategic Progress
Westpac’s vision is:
To be one of the world’s great service companies, helping our customers, communities and people to prosper and grow.
Westpac’s service-led strategy has remained consistent through the year. This consistency has enabled the Group to make significant progress over the year, modernising its infrastructure, digitising processes and seeking to make banking and financial services easier for customers.
The Group invested $1,411 million over Full Year 2018 with 59% of this spend devoted to growth and productivity initiatives, 27% was directed to regulatory change projects and the residual 14% was spent on other technology programs. Overall investment was up 12% over the year with the increase spread across all categories.
To outline the Group’s strategic progress, the commentary has been segmented into three categories, service leadership, digital transformation and workforce. The following sections summarise progress through this year.
Service leadership
Westpac strives to deliver a world class customer experience, combining great in-person service with market leading digital capabilities. In the context of the Royal Commission, there has been a decline in customer satisfaction and net promoter (NPS) scores through the year. While Westpac’s NPS has declined, the fall has been less than peers and this has improved Westpac’s relative consumer NPS ranking (against the major banks) from 4th to 2nd over the last 12 months.
To address the underlying causes of this decline much effort has been focused on the Group’s product reviews and ensuring that customer complaints are seen as a second chance to retain customers. Other initiatives completed over the year included:
For businesses:
enhanced support for small business including new, shorter, plain-English loan documents and strengthened protections under small business contracts;
introduced least-cost routing providing choice for contactless debit payments; and
further expanding the reach and functionality the Group’s online loan origination system, LOLA.
For consumers:
introduced voice banking for Siri, Google Assistant and Amazon’s Alexa. Customers can now ask for their account balance and conduct simple banking transactions using their voice;
Westpac customers can now access secure live chat on their desktop – often a more convenient way to connect with banking specialists; and
1 Based on the closing share price as at 28 September 2018 of $27.93. 2 Record date for 2018 final dividend in New York is 13 November 2018.

2018 Full Year financial results Review of Group operations
Westpac Group 2018 Full Year Financial Results Announcement | 13
launched mobile cheque deposit, a first in Australia that allows customers to deposit cheques via the mobile
app.
Digital transformation
Advances in digital technology provide the Group with the ability to enhance the customer experience while simultaneously improving productivity and risk management. Major developments over the year have included:
piloting the Group’s “customer service hub” that will ultimately be the centrepiece of customer origination and service processes. The new system will be rolled out for Westpac mortgages in First Half 2019;
extending e-statements to closed deposit and card accounts;
introducing BT Open Services, a new online advisor hub supporting independent financial advisors;
enhancing the Group’s infrastructure to further reduce cybersecurity risks; and
continuing to move applications on to the Group’s private cloud environment, reducing application installation from weeks to hours.
Workforce
Successful achievement of the Group’s vision depends on the quality and engagement of our people. Westpac is already regarded as a leader in staff engagement, diversity, and flexibility but recognises there is more to do. Recent highlights include:
Reinforced our commitment to supporting Veterans. In 2018 Westpac supported the Invictus Games and through a veterans employee action group are seeking to lift Veteran employment while aiming to increase support for Defence Force personnel and their families;
Commenced the fourth year of the Equilibrium program, supporting accomplished female leaders (both from within the company and outside financial services) to build a career in Westpac and to bring different perspectives to the Group;
Completed the roll-out of a new performance management framework called “Motivate”. The framework is a behaviours-first approach that seeks to emphasise that how outcomes are delivered is just as important as what is delivered;
Monthly surveys of employee sentiment have been largely unchanged over the year at 73%;
Further reduced the lost time injury frequency rate to 0.39 at 30 September 2018, down from 0.60 at 30 September 2017;
Implemented a new half day training program completed for the majority of employees. Called “Navigate”, brings together the Group’s vision, values, code of conduct and service standards to help employees manage tough decisions and have the courage to challenge decisions. The half day sessions reinforced the Group’s expectations around ethical behaviour and appropriate treatment of customers; and
Further enhanced LearningBank, the Group’s online portal for self-directed learning. Over 200,000 courses were completed on the platform in 2018.
Financial performance summary Second Half 2018 – First Half 2018
Cash earnings of $3,814 million were down 10% with core earnings also down 10%, while impairment charges fell 19%. The result was impacted by a number of infrequent items, the largest of which was $281 million (after tax) in provisions for estimated customer refunds and payments and associated costs along with provisions for estimated litigation settlements.
Net interest income fell 3% with a 12 basis point decrease in margins only partially offset by a 2% rise in average interest-earning assets. Margins excluding Treasury and Markets decreased 10 basis points over the half, with the decline due to the customer provisions, higher short term wholesale funding costs and lower mortgage spreads. The decline in mortgage spreads has been due to customers switching from interest only to principal and interest, changes in portfolio mix towards lower margin products (basic products) and lower rates on new mortgages.
Total loans grew 1%, with most of the rise due to an increase in Australian mortgage lending. Other areas of growth included 3% growth in SME business lending and 1% growth in commercial loans. In New Zealand, lending was up 2% (down 1% in A$ terms) from growth in mortgages. Australian personal lending was lower over the half, mostly reflecting lower demand. Customer deposits grew 3% over First Half 2018 and fully funded lending over the half.

2018 Full Year financial results Review of Group operations
14 | Westpac Group 2018 Full Year Financial Results Announcement
Non-interest income was down 3%, impacted by infrequent items, including provisions for estimated customer refunds and payments ($163 million) mostly offset by fees associated with the Hastings exit. Excluding these, non-interest income was down 2% mostly from lower Financial Markets trading income, a reduction in funds management income (from revaluation of investment in boutique funds and seed fund performance and lower fund margins). These declines were offset by higher business line fees, an increase in merchant income, and lower insurance claims.
Expenses increased 6%. This included a number of infrequent items, including provisions for estimated costs associated with implementing customer refunds and payments, litigation and the exit of Hastings. Excluding these items, expenses were $79 million higher. Most of this expense growth was due to higher spending associated with investment and an increase in regulatory and compliance costs, with $173 million of productivity savings more than offsetting ordinary cost growth.
Impairment charges were $76 million (or 19%) lower than First Half 2018, with most of the decrease due to lower new collectively assessed provisions linked to a reduction in consumer early-cycle (30+ day) delinquencies. In aggregate, mortgage 90+ day delinquencies were 2 basis points higher, while consumer unsecured 90+ day delinquencies were unchanged over the half at 1.64%.
The effective tax rate was 31.3% in Second Half 2018, higher due to the non-deductibility of certain expenses, including penalties and the write-off of goodwill.
Divisional performance summary
The performance of each division based on performance in Full Year 2018 compared to Full Year 2017 is discussed below.
Consumer Bank
Consumer Bank’s (CB) cash earnings of $3,140 million were $15 million lower than Full Year 2017. Growth in net interest income of 1% and a $114 million reduction in impairment charges were more than offset by lower non-interest income and higher operating expenses. Net interest income increased from a 4% rise in mortgages, and a 5% increase in deposits, offset by a 7 basis point reduction in net interest margin. Margins were impacted by higher short term wholesale funding costs, the full period impact of the Bank Levy, and provisions for estimated customer refunds and payments, partly offset by higher deposit spreads. Mortgage spreads were little changed over the year as the full period impact of repricing undertaken in 2017 was offset by increased competition and customers switching into principal and interest loans from interest-only lending. Non-interest income was $67 million lower, mostly due to the elimination or reduction of certain transaction and account-keeping fees and lower credit card interchange fees. Expenses were up $164 million (or 5%), mostly due to higher investment related costs and regulatory and compliance costs. More customers using digital channels has reduced branch transactions and enabled the rationalisation of 40 branches over the year. The $114 million decrease in impairment charges was largely due to improved collection processes which led to a reduction in write-offs and higher recoveries from the maturity of hardship changes. Recoveries were also higher.
Business Bank
Business Bank (BB) delivered an 8% increase in cash earnings to $2,159 million reflecting a 5% lift in core earnings and a 15% decline in impairment charges. Lending increased 2%, with SME lending up 3%, and commercial lending up 3%. Deposits rose 4% over the year, with growth spread across term deposits and transaction accounts. The net interest margin was up 5 basis points, from the full period effect of repricing on certain mortgages in Second Half of 2017 and higher deposit spreads. This was partially offset by the full-period impact of the Bank Levy. Non-interest income was up 4% with higher business line fees. Expenses were 3% higher, mostly from higher investment related costs, and regulatory and compliance spending. Credit quality has been sound, although stressed assets to TCE were up 58 basis points, from the downgrade of a small number of commercial customers into the watchlist category. Impairment charges were $52 million lower from lower write-offs in the Auto finance and credit card portfolios.
BT Financial Group
BT Financial Group (BTFG) cash earnings were 12% lower to $645 million. While the division recorded higher insurance income (both higher premiums and lower claims), a stronger contribution from Private Wealth and 7% growth in funds, this was more than offset by higher provisions for estimated customer refunds and payments and associated costs along with fee changes in advice and platforms. Funds increased $14.2 billion, with most of the growth in platforms. Growth was supported by stronger investment markets and $5.7 billion of net flows onto Panorama. Funds management contribution was lower, impacted by a reduction in platform fees and product mix changes. Expenses were up 8% mostly due to a provision for the costs associated with implementing customer refunds and payments ($55 million) and higher investment related spending including costs associated with Panorama and BT Open Services. Regulatory and compliance costs were lower over the year due to the completion of the MySuper migration in 2017.

2018 Full Year financial results Review of Group operations
Westpac Group 2018 Full Year Financial Results Announcement | 15
Westpac Institutional Bank
Westpac Institutional Bank (WIB) recorded a 6% decrease in cash earnings to $1,086 million. The $73 million decline was principally due to lower Markets revenue and was partially offset by an impairment benefit. The net impact of Hastings on cash earnings was not material year on year, as additional revenue from the exit of Hastings was largely offset by higher expenses (mostly goodwill write-off) and a higher tax expense (due to non-deductibility of the goodwill writedown). Expenses were up 7%, but excluding Hastings expenses, were well managed, up 1%. The $38 million impairment benefit was due to the successful workout of several large impaired facilities.
Westpac New Zealand
Westpac New Zealand delivered cash earnings of NZ$1,017 million, up 5%, over the prior year. The business generated 10% core earnings growth although this was offset by a small impairment charge of NZ$3 million which followed a NZ$76 million impairment benefit in Full Year 2017. An 8% lift in net interest income was the main driver of core earnings growth with lending up 4%, deposits rising 6% and margins increasing 12 basis points. The rise in margins followed some repricing of mortgage and business lending partially offset by lower deposit spreads. Expenses were 3% lower as the benefits from the division’s transformation program flowed through. The program has led to a reduction in the size of the branch network and increased self-service via digital.
Group Businesses
Group Businesses delivered cash earnings of $101 million in Full Year 2018, up $9 million on the prior year. The increase was due to a higher Treasury contribution (from interest rate risk management) and a $68 million improvement in non-interest income due to gains on NZ earnings hedges. These were partially offset by higher expenses and a lower impairment benefit. The rise in expenses was mainly due to a rise in regulatory and compliance costs, including expenses associated with the Royal Commission along with higher restructuring costs. The impairment benefit was $41 million lower mostly due to movements in centrally held impairment overlays.

2018 Full Year financial results Review of Group operations
16 | Westpac Group 2018 Full Year Financial Results Announcement
Divisional cash earnings summary
Half Year Sept 18 BT Financial Westpac Westpac
Consumer Business Group Institutional New Zealand1 Group
$m Bank Bank (Australia) Bank (A$) Businesses Group
Net interest income 3,708 2,044 293 741 877 375 8,038
Non-interest income 369 600 750 807 214 22 2,762
Net operating income 4,077 2,644 1,043 1,548 1,091 397 10,800
Operating expenses (1,812) (946) (690) (771) (431) (282) (4,932)
Core earnings 2,265 1,698 353 777 660 115 5,868
Impairment (charges) / benefits (218) (154) (3) 21 22 15 (317)
Operating profit before income tax 2,047 1,544 350 798 682 130 5,551
Income tax expense (624) (465) (109) (261) (189) (87) (1,735)
Net profit 1,423 1,079 241 537 493 43 3,816
Non-controlling interests - - - (2) - - (2)
Cash earnings 1,423 1,079 241 535 493 43 3,814
Half Year March 18 BT Financial Westpac Westpac
Consumer Business Group Institutional New Zealand1 Group
$m Bank Bank (Australia) Bank (A$) Businesses Group
Net interest income 4,040 2,021 285 675 843 437 8,301
Non-interest income 377 589 898 749 224 13 2,850
Net operating income 4,417 2,610 1,183 1,424 1,067 450 11,151
Operating expenses (1,730) (930) (601) (675) (429) (289) (4,654)
Core earnings 2,687 1,680 582 749 638 161 6,497
Impairment (charges) / benefits (233) (137) (3) 17 (24) (13) (393)
Operating profit before income tax 2,454 1,543 579 766 614 148 6,104
Income tax expense (737) (463) (175) (212) (173) (91) (1,851)
Net profit 1,717 1,080 404 554 441 57 4,253
Non-controlling interests - - - (3) - 1 (2)
Cash earnings 1,717 1,080 404 551 441 58 4,251
Mov't Sept 18 - Mar 18 BT Financial Westpac Westpac
Consumer Business Group Institutional New Zealand1 Group
% Bank Bank (Australia) Bank (A$) Businesses Group
Net interest income (8%) 1% 3% 10% 4% (14%) (3%)
Non-interest income (2%) 2% (16%) 8% (4%) 69% (3%)
Net operating income (8%) 1% (12%) 9% 2% (12%) (3%)
Operating expenses 5% 2% 15% 14% - (2%) 6%
Core earnings (16%) 1% (39%) 4% 3% (29%) (10%)
Impairment (charges) / benefits (6%) 12% - 24% large large (19%)
Operating profit before income tax (17%) - (40%) 4% 11% (12%) (9%)
Income tax expense (15%) - (38%) 23% 9% (4%) (6%)
Net profit (17%) - (40%) (3%) 12% (25%) (10%)
Non-controlling interests - - - (33%) - (100%) -
Cash earnings (17%) - (40%) (3%) 12% (26%) (10%)
1 Refer to Section 3.5 for the Westpac New Zealand NZ$ divisional result.
Movement in core earnings by division ($m)Second Half 2018 – First Half 2018
18
28 22
First Half 2018 core earnings
5,868
Business Bank
(422)
Consumer Bank
WIBBTFG Westpac New Zealand
(A$)
(46)
Group Businesses
Second Half 2018 core earnings
(229)
6,497-629

2018 Full Year financial results Review of Group operations
Westpac Group 2018 Full Year Financial Results Announcement | 17
Divisional cash earnings summary (continued)
Full Year Sept 18 BT Financial Westpac Westpac
Consumer Business Group Institutional New Zealand1 Group
$m Bank Bank (Australia) Bank (A$) Businesses Group
Net interest income 7,748 4,065 578 1,416 1,720 812 16,339
Non-interest income 746 1,189 1,648 1,556 438 35 5,612
Net operating income 8,494 5,254 2,226 2,972 2,158 847 21,951
Operating expenses (3,542) (1,876) (1,291) (1,446) (860) (571) (9,586)
Core earnings 4,952 3,378 935 1,526 1,298 276 12,365
Impairment (charges) / benefits (451) (291) (6) 38 (2) 2 (710)
Operating profit before income tax 4,501 3,087 929 1,564 1,296 278 11,655
Income tax expense (1,361) (928) (284) (473) (362) (178) (3,586)
Net profit 3,140 2,159 645 1,091 934 100 8,069
Non-controlling interests - - - (5) - 1 (4)
Cash earnings 3,140 2,159 645 1,086 934 101 8,065
Full Year Sept 172 BT Financial Westpac Westpac
Consumer Business Group Institutional New Zealand1 Group
$m Bank Bank (Australia) Bank (A$) Businesses Group
Net interest income 7,638 3,885 511 1,328 1,629 713 15,704
Non-interest income 813 1,141 1,744 1,707 480 (33) 5,852
Net operating income 8,451 5,026 2,255 3,035 2,109 680 21,556
Operating expenses (3,378) (1,818) (1,199) (1,351) (903) (456) (9,105)
Core earnings 5,073 3,208 1,056 1,684 1,206 224 12,451
Impairment (charges) / benefits (565) (343) (4) (56) 72 43 (853)
Operating profit before income tax 4,508 2,865 1,052 1,628 1,278 267 11,598
Income tax expense (1,353) (862) (316) (462) (361) (175) (3,529)
Net profit 3,155 2,003 736 1,166 917 92 8,069
Non-controlling interests - - - (7) - - (7)
Cash earnings 3,155 2,003 736 1,159 917 92 8,062
Mov't Sept 18 - Sept 17 BT Financial Westpac Westpac
Consumer Business Group Institutional New Zealand1 Group
% Bank Bank (Australia) Bank (A$) Businesses Group
Net interest income 1% 5% 13% 7% 6% 14% 4%
Non-interest income (8%) 4% (6%) (9%) (9%) large (4%)
Net operating income 1% 5% (1%) (2%) 2% 25% 2%
Operating expenses 5% 3% 8% 7% (5%) 25% 5%
Core earnings (2%) 5% (11%) (9%) 8% 23% (1%)
Impairment (charges) / benefits (20%) (15%) 50% large large (95%) (17%)
Operating profit before income tax - 8% (12%) (4%) 1% 4% -
Income tax expense 1% 8% (10%) 2% - 2% 2%
Net profit - 8% (12%) (6%) 2% 9% -
Non-controlling interests - - - (29%) - - (43%)
Cash earnings - 8% (12%) (6%) 2% 10% -
1 Refer to Section 3.5 for the Westpac New Zealand NZ$ divisional result. 2 Divisional comparatives have been restated.
Movement in core earnings by division ($m)Full Year 2018 – Full Year 2017
170
9252 12,365
(121)
Consumer Bank
Full Year 2018 core earnings
Business Bank
Group Businesses
(121)
12,451
Westpac New Zealand
(A$)
WIB
(158)
BTFGFull Year 2017 core earnings
-86
2018 Full Year financial results Review of Group operations
18 | Westpac Group 2018 Full Year Financial Results Announcement
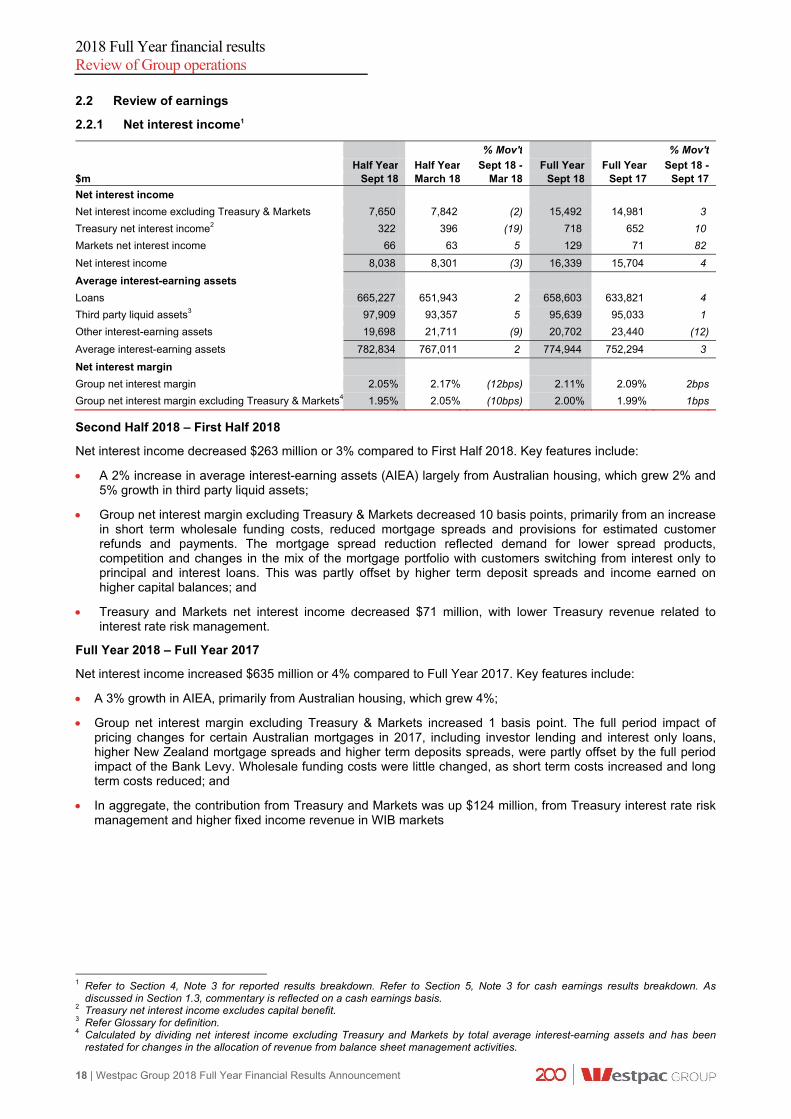
2.2 Review of earnings
2.2.1 Net interest income1
% Mov't % Mov't
Half Year Half Year Sept 18 - Full Year Full Year Sept 18 - $m Sept 18 March 18 Mar 18 Sept 18 Sept 17 Sept 17
Net interest income
Net interest income excluding Treasury & Markets 7,650 7,842 (2) 15,492 14,981 3
Treasury net interest income2 322 396 (19) 718 652 10
Markets net interest income 66 63 5 129 71 82
Net interest income 8,038 8,301 (3) 16,339 15,704 4
Average interest-earning assets
Loans 665,227 651,943 2 658,603 633,821 4
Third party liquid assets3 97,909 93,357 5 95,639 95,033 1
Other interest-earning assets 19,698 21,711 (9) 20,702 23,440 (12)
Average interest-earning assets 782,834 767,011 2 774,944 752,294 3
Net interest margin
Group net interest margin 2.05% 2.17% (12bps) 2.11% 2.09% 2bps
Group net interest margin excluding Treasury & Markets4 1.95% 2.05% (10bps) 2.00% 1.99% 1bps
Second Half 2018 – First Half 2018
Net interest income decreased $263 million or 3% compared to First Half 2018. Key features include:
A 2% increase in average interest-earning assets (AIEA) largely from Australian housing, which grew 2% and 5% growth in third party liquid assets;
Group net interest margin excluding Treasury & Markets decreased 10 basis points, primarily from an increase in short term wholesale funding costs, reduced mortgage spreads and provisions for estimated customer refunds and payments. The mortgage spread reduction reflected demand for lower spread products, competition and changes in the mix of the mortgage portfolio with customers switching from interest only to principal and interest loans. This was partly offset by higher term deposit spreads and income earned on higher capital balances; and
Treasury and Markets net interest income decreased $71 million, with lower Treasury revenue related to interest rate risk management.
Full Year 2018 – Full Year 2017
Net interest income increased $635 million or 4% compared to Full Year 2017. Key features include:
A 3% growth in AIEA, primarily from Australian housing, which grew 4%;
Group net interest margin excluding Treasury & Markets increased 1 basis point. The full period impact of pricing changes for certain Australian mortgages in 2017, including investor lending and interest only loans, higher New Zealand mortgage spreads and higher term deposits spreads, were partly offset by the full period impact of the Bank Levy. Wholesale funding costs were little changed, as short term costs increased and long term costs reduced; and
In aggregate, the contribution from Treasury and Markets was up $124 million, from Treasury interest rate risk management and higher fixed income revenue in WIB markets
1 Refer to Section 4, Note 3 for reported results breakdown. Refer to Section 5, Note 3 for cash earnings results breakdown. As
discussed in Section 1.3, commentary is reflected on a cash earnings basis. 2 Treasury net interest income excludes capital benefit. 3 Refer Glossary for definition. 4 Calculated by dividing net interest income excluding Treasury and Markets by total average interest-earning assets and has been
restated for changes in the allocation of revenue from balance sheet management activities.

2018 Full Year financial results Review of Group operations
Westpac Group 2018 Full Year Financial Results Announcement | 19
2.2.2 Loans1
As at As at As at % Mov't % Mov't 30 Sept 31 March 30 Sept Sept 18 - Sept 18 - $m 2018 2018 2017 Mar 18 Sept 17 Australia 619,630 610,397 599,162 2 3
Housing 444,741 437,239 427,167 2 4 Personal (loans and cards) 21,079 21,789 21,952 (3) (4) Business 154,347 151,904 150,542 2 3 Other2 1,918 1,963 1,985 (2) (3) Provisions (2,455) (2,498) (2,484) (2) (1)
New Zealand (A$) 74,045 74,687 71,484 (1) 4 New Zealand (NZ$) 80,860 79,557 77,680 2 4
Housing 48,893 47,907 46,943 2 4 Personal (loans and cards) 1,958 2,047 2,017 (4) (3) Business 30,251 29,898 28,979 1 4 Other 82 81 92 1 (11) Provisions (324) (376) (351) (14) (8)
Other overseas 16,015 16,309 14,273 (2) 12
Trade finance 3,600 3,942 2,818 (9) 28 Other loans 12,477 12,429 11,515 - 8 Provisions (62) (62) (60) - 3
Total loans 709,690 701,393 684,919 1 4
Second Half 2018 – First Half 2018
Total loans increased $8.3 billion or 1% compared to First Half 2018. Excluding foreign currency translation impacts, total loans increased $9.3 billion or 1%.
Key features of total loan growth were:
Australian housing loans increased $7.5 billion or 2% which was below system growth3. Owner occupied housing balances grew 3% to now comprise 57% of the portfolio (March 2018: 56%, September 2017: 56%). The Group continues to manage interest only growth below the macro-prudential limit of 30% of new flows, with new interest only facilities representing 23% of new mortgage limits for the half. In addition, customers have switched $15.9 billion of interest only loans to principal and interest during this period. Interest only loans now comprise 35% of the portfolio (March 2018: 40%, September 2017: 46%);
Australian personal loans and cards decreased $0.7 billion or 3% from lower auto finance and credit card balances;
Australian business loans increased $2.4 billion or 2%, with institutional lending up 2% from increased utilisation of existing warehouse facilities and a 1% increase in Business Bank largely from growth in SME and agriculture; and
New Zealand loans increased NZ$1.3 billion or 2% due to growth in housing (up 2%), mostly in fixed rate products to owner occupiers. Owner occupied housing represents 75% of the portfolio.
1 Spot loan balances. 2 Includes margin lending. 3 Source: RBA.

2018 Full Year financial results Review of Group operations
20 | Westpac Group 2018 Full Year Financial Results Announcement
Full Year 2018 – Full Year 20171
Total loans increased $24.8 billion or 4% compared to Full Year 2017. Excluding foreign currency translation impacts, total loans increased $24.0 billion or 3%.
Key features of total loan growth were:
Australian housing loans increased $17.6 billion or 4% (slightly below system growth1). Owner occupied loans increased 6% over the year, while the Group’s investor property lending grew by 2%. Principal and interest loan flows represented 77% of all new flows and now comprise 61% of the portfolio (September 2017: 50%);
Australian business loans increased $3.8 billion or 3% from broad based growth in Business Bank including SME, agriculture, manufacturing and property;
New Zealand lending increased NZ$3.2 billion or 4%. Housing loans grew at 4% mostly in fixed rate products, while business lending increased 4% supported by growth across agriculture, property and corporate lending; and
Other overseas lending increased $1.7 billion or 12%, across trade finance and institutional lending in Asia.
1 Source: RBA.

2018 Full Year financial results Review of Group operations
Westpac Group 2018 Full Year Financial Results Announcement | 21
2.2.3 Deposits and other borrowings1
As at As at As at % Mov't % Mov't
30 Sept 31 March 30 Sept Sept 18 - Sept 18 -
$m 2018 2018 2017 Mar 18 Sept 17
Customer deposits
Australia 446,667 429,852 420,841 4 6
At call 233,052 227,021 224,268 3 4
Term 171,832 161,864 156,249 6 10
Non-interest bearing 41,783 40,967 40,324 2 4 New Zealand (A$) 56,671 57,856 53,746 (2) 5 New Zealand (NZ$) 61,887 61,628 58,405 - 6
At call 23,339 24,164 23,117 (3) 1
Term 32,645 31,595 30,014 3 9
Non-interest bearing 5,903 5,869 5,274 1 12 Other overseas (A$) 14,413 14,355 12,083 - 19
Total customer deposits 517,751 502,063 486,670 3 6
Certificates of deposit 41,534 45,673 46,921 (9) (11)
Australia 28,746 30,387 37,515 (5) (23)
New Zealand (A$) 1,116 521 546 114 104
Other overseas (A$) 11,672 14,765 8,860 (21) 32
Total deposits and other borrowings 559,285 547,736 533,591 2 5
Second Half 2018 – First Half 2018
Total customer deposits increased $15.7 billion or 3% compared to First Half 2018, with the increase more than fully funding loan growth in the half. Excluding foreign currency translation impacts, customer deposits increased $15.9 billion or 3%.
Key features of total customer deposits growth were:
Australian customer deposits increased $16.8 billion or 4%, with above system growth2 in household deposits and higher Government balances; and
New Zealand customer deposits were little changed (up NZ$0.3 billion). Growth in term deposits of 3% was offset by a decline in business transaction balances.
Certificates of deposits decreased $4.1 billion or 9%, reflecting reduced short-term wholesale funding issuance in this form.
Full Year 2018 – Full Year 2017
Total customer deposits increased $31.1 billion or 6% compared to Full Year 2017, with the increase more than fully funding loan growth in the year. Excluding foreign currency translation impacts, customer deposits increased $29.5 billion or 6%.
Key features of total customer deposits growth were:
Australian customer deposits increased $25.8 billion or 6%, particularly across term deposits (up 10%). Household deposits growth was in line with system2 and non-financial corporation deposits grew above system2 Customers continued to direct funds to mortgage offset accounts, supporting 4% growth in Australian non-interest bearing deposits;
New Zealand customer deposits increased NZ$3.5 billion or 6%, with the increase fully funding loan growth during the year. Term deposits grew 9%, particularly across household and institutional segments. Non-interest bearing deposits increased 12% from growth in business and consumer transaction deposits, including growth in mortgage offset accounts; and
Other overseas deposits increased $2.3 billion or 19% due to growth in deposits across Asia.
Certificates of deposits decreased $5.4 billion or 11%, reflecting reduced short-term wholesale funding issuance in this form.
1 Spot deposit balances. 2 Source: APRA.

2018 Full Year financial results Review of Group operations
22 | Westpac Group 2018 Full Year Financial Results Announcement
2.2.4 Net interest margin
Second Half 2018 – First Half 2018
Group net interest margin was 2.05%, a decrease of 12bps compared to First Half 2018. Key features include:
2 basis point decrease from the impact of provisions for estimated customer refunds and payments;
4 basis points decrease from loan spreads primarily due to changes in the mix of the Australian mortgage portfolio as customers preferred lower spread products, retention pricing and continued switching from interest only to principal and interest loans. Competition is impacting lending spreads across all loan markets, particularly mortgages;
1 basis point increase from customer deposit spreads, primarily from term deposits;
5 basis points decrease from a rise in short term wholesale funding costs, including the impact of the bank bill swap rate (BBSW) increasing in Second Half 2018;
Capital and other increased 1 basis point largely from income earned on higher capital balances;
1 basis point decrease from liquidity reflecting the increased holdings in third party liquid assets and a higher CLF fee following a $8 billion increase to the CLF from 1 January 2018; and
Treasury and Markets contribution decreased 2 basis points, with less market opportunities impacting returns from interest rate risk management.
(2bps)
(5bps)
Term wholesale
funding
Loans Customer deposits
0bps
Second Half 2018
Treasury & Markets
1bps
Capital & other
1bps
0bps
2.05%
Bank LevyFirst Half 2018
Liquidity
(2bps)
Provisions for
customer refunds
2.17%
2.05%
Short term wholesale
funding
(4bps)(1bps)
Group margin down 12bps
Excluding Treasury and Markets down 10bps
Group net interest margin movement (%)Second Half 2018 – First Half 2018
1.95%

2018 Full Year financial results Review of Group operations
Westpac Group 2018 Full Year Financial Results Announcement | 23
Full Year 2018 – Full Year 20171
Group net interest margin was 2.11%, an increase of 2 basis points from Full Year 2017. Key features include:
2 basis points increase from loan spreads. This reflected the full period impact of pricing changes for certain Australian mortgages in late 2017, including interest only and investor lending, along with higher spreads on New Zealand mortgages. These gains were partly offset by the impact of customers switching from interest only to principal and interest loans, retention pricing, customer preference for lower spread basic products and competition across loan markets;
2 basis points increase related to customer deposit spreads, mainly from term deposits, partly offset by the impact of lower rates on the hedging of transaction deposits;
2 basis points decrease from a rise in short term wholesale funding costs, particularly in Second Half 2018;
2 basis points increase from term wholesale funding as pricing for new term issuance was lower than the portfolio average;
4 basis point decrease from the full period impact of the Bank Levy, which was introduced on 1 July 2017;
Capital and other increased 1 basis point largely from the positive effect of higher capital balances, partly offset by the impact of lower interest rates; and
1 basis point increase from Treasury and Markets, due to increased Treasury revenue from interest rate risk management.
1 Group net interest margin excluding Treasury and Markets has been restated for changes in the allocation of revenue from balance
sheet management activities.
Bank LevyProvisions for
customer refunds
Short term wholesale
funding
Customer deposits
Treasury & Markets
Liquidity
(4bps)
Full Year 2017
2bps
Capital & other
0bps2bps
2.00%
Full Year 2018
Loans
2.09%
Term wholesale
funding
1bps
2bps
(2bps)
2.11%0bps 1bps
Group margin up 2bps
Excluding Treasury and Markets up 1bps
Group net interest margin movement (%)Full Year 2018 – Full Year 2017
1.99%

2018 Full Year financial results Review of Group operations
24 | Westpac Group 2018 Full Year Financial Results Announcement
2.2.5 Non-interest income1
% Mov't % Mov't
Half Year Half Year Sept 18 - Full Year Full Year Sept 18 -
$m Sept 18 Mar 18 Mar 18 Sept 18 Sept 17 Sept 17
Fees and commissions 1,202 1,348 (11) 2,550 2,755 (7)
Wealth management and insurance income 1,088 929 17 2,017 1,810 11
Trading income 419 507 (17) 926 1,217 (24)
Other income 53 66 (20) 119 70 70
Non-interest income 2,762 2,850 (3) 5,612 5,852 (4)
Second Half 2018 – First Half 2018
Non-interest income decreased $88 million or 3% compared to First Half 2018. The impact of provisions for estimated customer refunds and payments ($163 million) was mostly offset by fees associated with the exit of the Hastings business ($144 million). Excluding these infrequent items, non-interest income reduced $69 million or 2% mostly reflecting lower markets income, partly offset by growth in business lending fees and higher insurance income.
Fees and commissions
Fees and commissions decreased $146 million or 11% compared to First Half 2018, largely from:
Provisions for estimated customer refunds and payments in the half ($156 million); partly offset by
Increase in business lending fees of $15 million primarily driven by portfolio growth.
Wealth management and insurance income
Wealth management and insurance income increased $159 million, or 17% in the half, due to:
Hastings revenue, including fees associated with the exit of Hastings ($144 million); and
Higher insurance income ($31 million) primarily from lower general insurance claims; partly offset by
Provisions for estimated customer refunds and payments related to wealth products ($7 million); and
Platforms and superannuation revenue was little changed. Margin compression from competition and pricing changes to BT Panorama in July 2018, was mostly offset by the benefit of higher asset markets. Refer to Section 2.2.6 for further information on Group funds balance movements.
Trading income
Trading income was $88 million or 17% lower compared to First Half 2018. Refer to Section 2.2.7 for further detail on Markets related income.
Other income
Other income decreased $13 million compared to First Half 2018, mostly reflecting lower gains on financial instruments designated at fair value. Full Year 2018 – Full Year 2017
Non-interest income decreased $240 million or 4% over the year. Full Year 2018 was impacted by a number of infrequent items, including income related to the exit of the Hastings business ($135 million), partly offset by an increase in provisions for estimated customer refunds and payments (up $52 million from $111 million in Full Year 2017 to $163 million in Full Year 2018).
Excluding the impact of these infrequent items, non-interest income was $323 million or 5% lower, primarily due to reduced markets income and lower banking fee income from the full period impact of regulatory changes to Australian credit card interchange fees and removal of ATM withdrawal fees.
Fees and commissions
Fees and commissions decreased $205 million or 7% compared to Full Year 2017, largely due to:
Additional provisions for estimated customer refunds and payments ($101 million), related to Advice and retail banking products;
Lower revenue from the removal of ATM withdrawal fees and changes to transaction fees ($64 million); 1 Refer to Section 4, Note 4 for reported results breakdown. Refer to Section 5, Note 4 for cash earnings results breakdown. As
discussed in Section 1.3, commentary is on a cash earnings basis.

2018 Full Year financial results Review of Group operations
Westpac Group 2018 Full Year Financial Results Announcement | 25
Lower credit card income ($49 million) from the full period impact of regulatory changes to Australian interchange rates from 1 July 2017 and lower rewards redemptions; and
Lower corporate and institutional lending fees ($23 million) from a reduction in unused customer limits; partly offset by
Higher business lending fees ($40 million) primarily driven by portfolio growth.
Wealth management and insurance income
Wealth management and insurance income increased $207 million or 11% over the year reflecting:
A rise in Hastings revenue which included fees of $144 million related to the exit of the business, the associated costs can be seen in other expenses;
A fall in provisions for estimated customer refunds and payments for wealth products ($49 million);
Higher revenue from investments in boutique funds ($43 million); and
Higher insurance income ($17 million) reflecting:
- Increase in general insurance income (up $24 million) from lower claims, with the prior year impacted by Cyclone Debbie, and a 2% increase in net earned premiums;
- Life insurance income up $10 million from a 17% increase to earned premiums, primarily due to BTFG commencing the management of Group Insurance for BTFG Corporate Super in Full Year 2018. This was partly offset by a rise in claims; and
- Lower LMI contribution ($17 million) due to a reduction in loans written at higher LVR bands; partly offset by
Lower platforms income ($14 million), impacted by margin compression and pricing changes to BT Panorama in July 2018. This was partly offset by the benefit of higher asset markets. Refer to Section 2.2.6 for further information on Group funds balance movements.
Trading income
Trading income decreased $291 million or 24% compared to Full Year 2017. The majority of the reduction was due to a lower fixed income trading result. Refer to Section 2.2.7 for further detail on Markets related income.
Other income
Other income increased $49 million over the year, reflecting the impact of hedging New Zealand earnings, partly offset by a loss on the sale of offshore Hastings business in first half. 2.2.6 Group funds
As at As at As at % Mov't % Mov't
30 Sept 31 March 30 Sept Sept 18 - Sept 18 -
$bn 2018 2018 2017 Mar 18 Sept 17
Superannuation 39.3 37.4 36.2 5 9
Platforms 122.9 118.6 115.3 4 7
Packaged Funds 39.6 38.0 36.4 4 9
Other 3.8 3.7 3.5 3 9
New Zealand (A$) 9.8 9.7 9.3 1 5
Total Group funds (excluding Westpac Institutional Bank) 215.4 207.4 200.7 4 7
Westpac Institutional Bank - 6.6 12.5 (100) (100)
Total Group funds 215.4 214.0 213.2 1 1
Average funds for the Group (excluding Westpac
Institutional Bank) 214.9 207.6 201.9 4 6
Westpac Institutional Bank 2.4 9.7 12.0 (75) (80)
Average funds for the Group1 217.3 217.3 213.9 - 2
1 Averages are based on a six month period.

2018 Full Year financial results Review of Group operations
26 | Westpac Group 2018 Full Year Financial Results Announcement
2.2.7 Markets related income1
% Mov't % Mov't
Half Year Half Year Sept 18 - Full Year Full Year Sept 18 -
$m Sept 18 Mar 18 Mar 18 Sept 18 Sept 17 Sept 17
Net interest income 66 63 5 129 71 82
Non-interest income 456 547 (17) 1,003 1,212 (17)
Total Markets income 522 610 (14) 1,132 1,283 (12)
Customer income 448 448 - 896 918 (2)
Non-customer income 60 162 (63) 222 319 (30)
Derivative valuation adjustments 14 - - 14 46 (70)
Total Markets income 522 610 (14) 1,132 1,283 (12)
Markets income comprises sales and risk management revenue derived from the creation, pricing and distribution of risk management products to the Group’s consumer, business, corporate and institutional customers. Dedicated relationship specialists provide product solutions to these customers to help manage their interest rate, foreign exchange, commodity, credit and structured products risk exposures.
Second Half 2018 - First Half 2018
Total markets income decreased by $88 million, or 14% compared to First Half 2018 from a fall in non-customer income from lower trading income in foreign currency and commodities. Full Year 2018 – Full Year 2017
Total markets income decreased by $151 million, or 12%, compared to Full Year 2017, primarily due to lower non-customer income from a reduced fixed income trading result.
Customer income decreased 2% year on year, driven by lower fixed income and foreign exchange sales revenue.
Markets Value at Risk (VaR)2
$m Average High Low
Six months ended 30 September 2018 10.8 27.1 7.0
Six months ended 31 March 2018 9.0 19.9 3.8
Six months ended 30 September 2017 11.2 16.0 7.6
The Components of Markets VaR are as follows:
Average
Half Year Half Year Half Year
$m Sept 18 March 18 Sept 17
Interest rate risk 2.7 2.7 3.0
Foreign exchange risk 2.4 1.5 1.5
Equity risk - 0.1 0.1
Commodity risk3 6.6 6.4 8.1
Credit and other market risks4 4.4 2.6 3.4
Diversification benefit (5.3) (4.3) (4.9)
Net market risk 10.8 9.0 11.2
1 Markets income includes WIB Markets, Business Bank, Consumer Bank, BTFG and Westpac New Zealand markets. 2 The daily VaR presented above reflects a WIB divisional view of VaR. It varies from presentations of VaR in the 2018 Westpac Group
Annual Report and Australian Prudential Standard (APS) 330 Prudential Disclosure under Basel III where market risk disclosures are segregated into trading and banking book. VaR measures the potential for loss using a history of price volatility.
3 Includes electricity risk. 4 Includes prepayment risk and credit spread risk (exposures to generic credit rating bonds).

2018 Full Year financial results Review of Group operations
Westpac Group 2018 Full Year Financial Results Announcement | 27
2.2.8 Operating expenses1
% Mov't % Mov't
Half Year Half Year Sept 18 - Full Year Full Year Sept 18 -
$m Sept 18 March 18 Mar 18 Sept 18 Sept 17 Sept 17
Staff expenses (2,489) (2,398) 4 (4,887) (4,666) 5
Occupancy expenses (477) (475) - (952) (962) (1)
Technology expenses (1,068) (1,042) 2 (2,110) (2,008) 5
Other expenses (898) (739) 22 (1,637) (1,469) 11
Total operating expenses (4,932) (4,654) 6 (9,586) (9,105) 5
Second Half 2018 – First Half 2018
Operating expenses increased $278 million or 6% compared to First Half 2018. Expenses were impacted by a number of infrequent items in second half ($199 million)2. Excluding these infrequent items, expenses rose $79 million or 2%. This increase was primarily driven by higher investment spend (up $66 million) across our key programs and an increase in regulatory and compliance costs (up $60 million). Productivity benefits increased $42 million in the half to $173 million, which more than offset growth in operating costs.
Staff expenses increased $91 million or 4% during the half due to the full period impact of salary increases and infrequent items of $49 million. In addition, higher restructuring costs resulted from accelerated productivity initiatives in the last quarter which supported a 2% decrease in FTE. These costs were partly offset by productivity benefits.
Occupancy expenses were littled changed, with rental increased across retail and corporate sites mostly offset by a reduction in branch numbers (down 20 in the half).
Technology expenses increased $26 million or 2% compared to First Half 2018, reflecting a rise in costs related to the Group’s investment program. Higher technology services costs were driven by increased spend across our key platform programs and enhancements to the Group’s technology infrastructure. Amortisation of software assets also increased as programs delivered additional capability (up $16 million). These increases were partly offset by lower software maintenance and license costs (down $28 million) supported by productivity, including renegotiation with vendors.
Other expenses increased $159 million or 22% and were impacted by $150 million of infrequent items. Excluding these items, other expenses increased $9 million or 1% due to additional regulatory and compliance activity, partly offset by lower Royal Commission costs and reduced postage and stationary expenses from increased customer use of electronic statements. Full Year 2018 – Full Year 2017
Operating expenses increased $481 million or 5% compared to Full Year 2017, impacted by a number of infrequent items ($233 million)3. Excluding these infrequent items, operating expenses increased 3% primarily from higher regulatory and compliance costs (up $184 million), including expenses relating to the Royal Commission ($62 million), and investment related spend (up $125 million) largely across our banking and wealth platforms. Productivity benefits increased 16% to $304 million, more than offsetting growth in operating costs.
Staff expenses increased $221 million or 5% compared to Full Year 2017 from the full period impact of annual salary increases, higher restructuring costs (up $39 million) and additional FTE for regulatory and compliance activities and the Group’s investment program. This was partly offset by lower bonuses and productivity benefits largely related to simplifying the organisation and digitising processes across the branch network and operations.
Occupancy expenses decreased $10 million or 1%, with benefits from retail property consolidation (branch numbers down by 47 across the Group) partly offset by higher energy costs.
Technology expenses increased $102 million or 5% compared to Full Year 2017, primarily due to the Group’s investment program. Higher technology services costs (up $82 million) and software maintenance and licensing costs (up $29 million) were driven by continued investment spend, increased volumes and new software licences following upgraded capability. This was partly offset by lower IT equipment depreciation (down $17 million) as prior investment in data centres was fully depreciated.
1 Refer to Section 4, Note 5 for reported results breakdown. Refer to Section 5, Note 5 for cash earnings breakdown. As discussed in
Section 1.3, commentary is on a cash earnings basis. 2 Exit of Hastings business ($87 million), estimated costs associated with implementing customer refunds and payments ($62 million)
and provisions for litigation ($50 million). 3 Exit of Hastings business ($121 million), estimated costs associated with implementing customer refunds and payments ($62 million)
and provisions for litigation ($50 million).
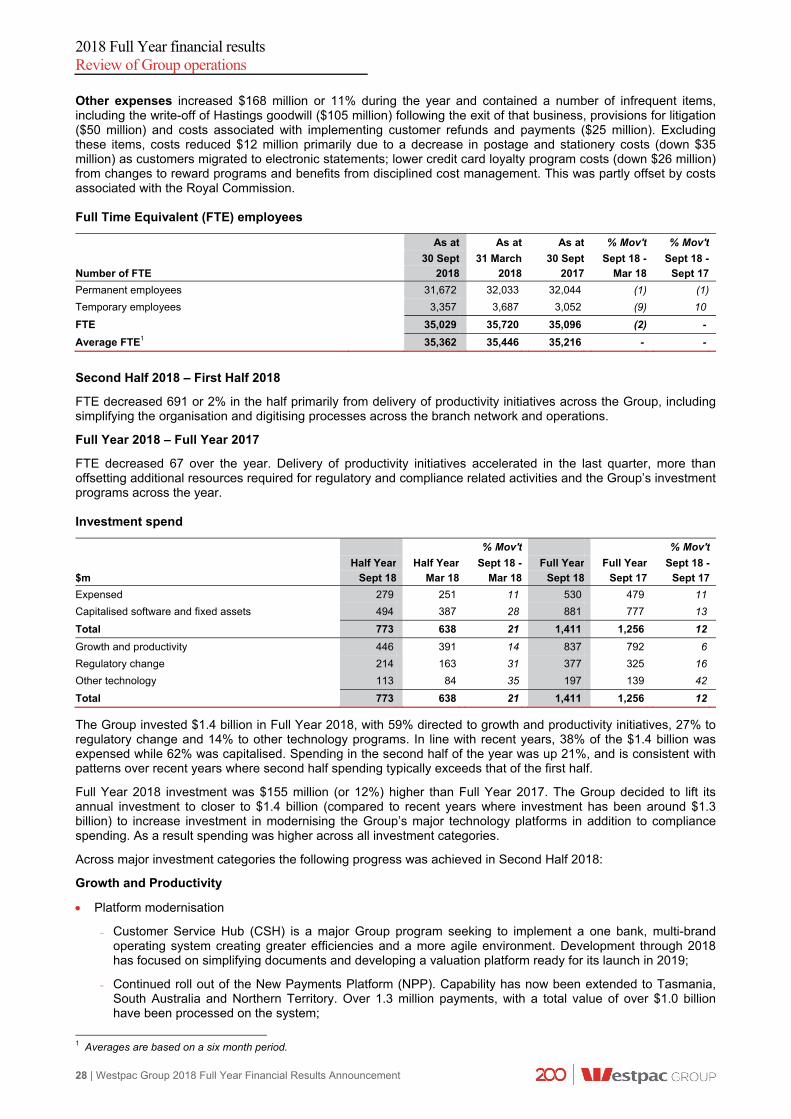
2018 Full Year financial results Review of Group operations
28 | Westpac Group 2018 Full Year Financial Results Announcement
Other expenses increased $168 million or 11% during the year and contained a number of infrequent items, including the write-off of Hastings goodwill ($105 million) following the exit of that business, provisions for litigation ($50 million) and costs associated with implementing customer refunds and payments ($25 million). Excluding these items, costs reduced $12 million primarily due to a decrease in postage and stationery costs (down $35 million) as customers migrated to electronic statements; lower credit card loyalty program costs (down $26 million) from changes to reward programs and benefits from disciplined cost management. This was partly offset by costs associated with the Royal Commission. Full Time Equivalent (FTE) employees
As at As at As at % Mov't % Mov't
30 Sept 31 March 30 Sept Sept 18 - Sept 18 -
Number of FTE 2018 2018 2017 Mar 18 Sept 17
Permanent employees 31,672 32,033 32,044 (1) (1)
Temporary employees 3,357 3,687 3,052 (9) 10
FTE 35,029 35,720 35,096 (2) -
Average FTE1 35,362 35,446 35,216 - -
Second Half 2018 – First Half 2018
FTE decreased 691 or 2% in the half primarily from delivery of productivity initiatives across the Group, including simplifying the organisation and digitising processes across the branch network and operations.
Full Year 2018 – Full Year 2017
FTE decreased 67 over the year. Delivery of productivity initiatives accelerated in the last quarter, more than offsetting additional resources required for regulatory and compliance related activities and the Group’s investment programs across the year. Investment spend
% Mov't % Mov't
Half Year Half Year Sept 18 - Full Year Full Year Sept 18 -
$m Sept 18 Mar 18 Mar 18 Sept 18 Sept 17 Sept 17
Expensed 279 251 11 530 479 11
Capitalised software and fixed assets 494 387 28 881 777 13
Total 773 638 21 1,411 1,256 12
Growth and productivity 446 391 14 837 792 6
Regulatory change 214 163 31 377 325 16
Other technology 113 84 35 197 139 42
Total 773 638 21 1,411 1,256 12
The Group invested $1.4 billion in Full Year 2018, with 59% directed to growth and productivity initiatives, 27% to regulatory change and 14% to other technology programs. In line with recent years, 38% of the $1.4 billion was expensed while 62% was capitalised. Spending in the second half of the year was up 21%, and is consistent with patterns over recent years where second half spending typically exceeds that of the first half.
Full Year 2018 investment was $155 million (or 12%) higher than Full Year 2017. The Group decided to lift its annual investment to closer to $1.4 billion (compared to recent years where investment has been around $1.3 billion) to increase investment in modernising the Group’s major technology platforms in addition to compliance spending. As a result spending was higher across all investment categories.
Across major investment categories the following progress was achieved in Second Half 2018:
Growth and Productivity
Platform modernisation
- Customer Service Hub (CSH) is a major Group program seeking to implement a one bank, multi-brand operating system creating greater efficiencies and a more agile environment. Development through 2018 has focused on simplifying documents and developing a valuation platform ready for its launch in 2019;
- Continued roll out of the New Payments Platform (NPP). Capability has now been extended to Tasmania, South Australia and Northern Territory. Over 1.3 million payments, with a total value of over $1.0 billion have been processed on the system;
1 Averages are based on a six month period.

2018 Full Year financial results Review of Group operations
Westpac Group 2018 Full Year Financial Results Announcement | 29
- LOLA (online lending platform) has been rolled out to St.George bankers and expanded to include more products and features; and
- Additional products and capabilities on Panorama were delivered, including CMA Saver, an interest bearing cash account with no fees and annuities products with integrated account opening and reporting. BT Corporate Super employers have the ability to set up plans online and members can access their super via Panorama and Westpac Live. Advisers can set up client bank accounts online using digital consent capture.
Digitising the company
- Launched a range of new features for customers to make it easier for them to manage their banking and finances. This includes real time details of Handycard or Debit Mastercard transactions, live chat support, the ability to recover incomplete applications, currency converter, and travel insurance. Customers can now deposit cheques via the mobile banking app, by taking a photo of the cheque with their smartphone;
- Launched an Online Home Loan Application – St.George, Bank of Melbourne and BankSA customers can now complete their mortgage application online or via mobile. The process includes on the spot personalised pricing and valuations, live chat support, and ability to stop and re-start the process at any time. Bank of Melbourne customers can receive and sign their mortgage documents electronically through e-sign;
- Increased the ways a customer can access their banking, including through simple voice commands with Apple’s Siri, Amazon’s Alexa and Google Assistant. Customers can also transact via wearable devices, such as via FitBit, Garmin and Apple watch; and
- Launched Beem It, a third party payment app that allows instant secure payments between family and friends, no matter who they bank with. Beem It was developed jointly with CBA and NAB.
Reducing complexity
- Expansion of Presto Smart, an integrated payment solution enabling merchants to link payments from different sources to their terminal, removing manual input and reconciliations; and
- Closed 27 business deposit products making it easier for customers and bankers.
Regulatory Change
Major developments over the half included:
Delivered a number of regulatory and industry reporting requirements including Common Reporting Standards and Tax Country by Country reporting which supports global tax compliance, reporting of business transactions through the payments systems to the Australian Taxation Office, reporting of life insurance commissions, implementation of AASB 9, and updates to a range of economic and financial statistics reporting; and
Continued update of systems and processes to comply with Comprehensive Credit Reporting and Open Banking.
Other technology
Major initiatives under this category included further upgrades to the Group's infrastructure, migration of applications onto cloud technologies and reducing cybersecurity risks. Capitalised software
% Mov't % Mov't
Half Year Half Year Sept 18 - Full Year Full Year Sept 18 -
$m Sept 18 March 18 Mar 18 Sept 18 Sept 17 Sept 17
Opening balance 2,005 1,916 5 1,916 1,781 8
Total additions 493 389 27 882 766 15
Amortisation expense (317) (301) 5 (618) (614) 1
Impairment expense - (2) (100) (2) (14) (86)
Foreign exchange translation (4) 3 large (1) (3) (67)
Closing balance 2,177 2,005 9 2,177 1,916 14
Capitalised software increased 9% over the half and 14% over the year. Contributing to the increase was both higher investment spending (up $155 million over the year) and a higher proportion of investment spent on larger infrastructure programs (CSH, NPP, Panorama) which have a longer assessed life. A number of projects remain in development which has also contributed to the higher capitalisation rate, as amortisation is yet to commence.

2018 Full Year financial results Review of Group operations
30 | Westpac Group 2018 Full Year Financial Results Announcement
Software amortisation was $4 million higher compared to Full Year 2017. In Second Half 2018 amortisation increased $16 million (5%) compared to First Half 2018 as more projects were completed. In addition, as part of the Group’s regular asset review, $2 million in amortised software was assessed as impaired and written off during the year.
Overall, the average amortisation period for capitalised software assets is 3.1 years.

2018 Full Year financial results Review of Group operations
Westpac Group 2018 Full Year Financial Results Announcement | 31
2.2.9 Impairment charges
% Mov't % Mov't
Half Year Half Year Sept 18 - Full Year Full Year Sept 18 -
$m Sept 18 March 18 Mar 18 Sept 18 Sept 17 Sept 17
Individually assessed provisions (IAPs)
New IAPs (198) (173) 14 (371) (610) (39)
Write-backs 83 67 24 150 288 (48)
Recoveries 79 100 (21) 179 168 7
Total IAPs, write-backs and recoveries (36) (6) large (42) (154) (73)
Collectively assessed provisions (CAPs)
Write-offs (428) (430) - (858) (968) (11)
Other changes in CAPs 147 43 large 190 269 (29)
Total new CAPs (281) (387) (27) (668) (699) (4)
Total impairment charges (317) (393) (19) (710) (853) (17)
Asset quality remained sound through Full Year 2018 with stressed assets to total committed exposures increasing by 3 basis points to 1.08%. The increase in stress mostly reflects higher mortgage delinquencies and a small rise in stressed exposures in Business Bank. Impaired assets were lower, with gross impaired assets to gross loans 2 basis points lower at 0.20% compared to 30 September 2017.
Provisioning levels at 30 September 2018 of $3,053 million were $66 million lower compared to 30 September 2017. IAPs were $58 million lower in line with the decline in impaired facilities while CAPs were $8 million lower. Within collectively assessed provisions the overlay was down $22 million to $301 million at 30 September 2018.
Second Half 2018 – First Half 2018
Impairment charges for Second Half 2018 were $317 million, down $76 million compared to First Half 2018, and were equivalent to 9 basis points of average gross loans. The decrease was mostly due to lower total new CAPs.
Key movements included:
Total IAPs less write-backs and recoveries were $30 million higher than First Half 2018 principally due to:
- New IAPs were up $25 million mostly from higher new impaired assets in Business Bank. No facility greater than $50 million migrated to impaired in either half. This rise was partially offset by a small reduction in New Zealand IAPs; and
- Recoveries were $21 million lower primarily in the Australian unsecured consumer portfolio and the New Zealand institutional portfolio; partly offset by:
- Write-backs were $16 million higher with WIB, Business Bank and New Zealand (in business) all recording a small increase in write-backs.
Total new CAPs were $106 million lower than First Half 2018. Key movements included:
- Write-offs were $2 million lower in Second Half 2018;
- Benefits from other changes in CAPs were $104 million higher related to the seasonal decrease in consumer early cycle delinquencies in Australia and New Zealand. Second Half 2018 continued to benefit from improved conditions in the dairy sector, with lower stressed assets and an associated reduction in provisions; and
- The provisioning overlay was reduced $34 million in Second Half 2018 compared to an increase of $12 million in First Half 2018. The reduction in Second Half 2018 was mostly due to provisions utilised or no longer required for New Zealand dairy and the Australian automotive industry.
Full Year 2018 – Full Year 2017
Impairment charges for Full Year 2018 of $710 million are equivalent to 10 basis points of average loans and were down $143 million when compared to Full Year 2017.
Key movements included:
Total new IAPs less write-backs and recoveries were $112 million lower than Full Year 2017. This was due to lower new IAPs (down $239 million) partially offset by lower write-backs. The reduction in new IAPs was due to a small number of large impairments in WIB in Full Year 2017 while in 2018 no new large impaired loans (greater than $50 million) emerged during the year. New IAP’s in Business Bank were also lower. This was partially offset by higher new IAPs in New Zealand; and

2018 Full Year financial results Review of Group operations
32 | Westpac Group 2018 Full Year Financial Results Announcement
Total new CAPs were $31 million lower due to a $110 million reduction in write-offs partially offset by a $79
million fall in the benefit from other changes in CAPs. Write-offs were lower, principally in Consumer Bank from the credit card portfolio and in Business Bank related to the auto finance and commercial portfolios. The overlay was $22 million lower over Full Year 2018 compared to a $66 million reduction in Full Year 2017.
2.2.10 Income tax expense
Second Half 2018 – First Half 2018
The effective tax rate of 31.3% in Second Half 2018 was higher than the 30.3% recorded in First Half 2018. The increase was largely due to the non-deductibility of certain expenses, including penalties and the write-off of Hastings goodwill associated with the exit of that business.
Full Year 2018 – Full Year 2017
The effective tax rate of 30.8% in Full Year 2018 is higher than the 30.4% recorded in Full Year 2017. The increase was largely due to the non-deductibility of certain expenses, including penalties and the write-off of Hastings goodwill associated with the exit of that business. 2.2.11 Non-controlling interests
Non-controlling interests represent profits of non-wholly owned subsidiaries attributable to shareholders other than Westpac. These include profits attributable to the 10.1% shareholding in Westpac Bank-PNG-Limited and the 25% shareholding in St.George Motor Finance Limited that are not owned by Westpac.

2018 Full Year financial results Review of Group operations
Westpac Group 2018 Full Year Financial Results Announcement | 33
2.3 Credit quality
Credit quality remained sound over the year with total stressed exposures to TCE increasing modestly and remaining low relative to historical experience. Stressed exposures to TCE were 1.08%, 3 basis points higher than 30 September 2017 and 1 basis point lower compared to 31 March 2018 (see 2.3.1 Credit quality key metrics).
The 3 basis points rise in stressed assets relates to 90 days past due and not impaired facilities which increased by 5 basis points over the year, partially offset by a 1 basis point reduction in both impaired and in watchlist and substandard facilities. The increase in 90 day past due and not impaired was due to an increase in mortgage 90 + day delinquencies and a small increase in business facilities.
Provisioning levels at 30 September 2018 of $3,053 million were $66 million lower compared to 30 September 2017, due mainly to a decrease in IAPs from the workout of impaired facilities. The ratio of gross impaired asset provisions to gross impaired assets remains high at 46.1%, while the ratio of collectively assessed provisions to credit risk weighted assets was lower at 73 basis points.
Portfolio segments
The institutional segment continued to perform well – this has been reflected in no new large (greater than $50 million) facilities migrating to impaired over the last 18 months. With little growth in new stressed facilities, the overall level of stressed assets has reduced as the Group continued to work-out existing stressed assets through refinance or repayment.
The tightening of standards on new commercial property lending over recent years has continued to contribute to relatively low levels of stress. At 30 September 2018 the level of stressed assets to TCE was 1.7% and remains well below long term averages. Over the year, stress has increased modestly (up from 1.3%) with the rise due predominantly to a small number of medium sized apartment developments becoming stressed.
The small and medium business portfolio has seen stress emerge in a small number of companies in Second Half 2018. Over recent years, new stress has typically been concentrated in Western Australia (WA) and Queensland (Qld), consistent with the more challenging conditions in those states. In 2018, new stress in these markets has abated and new stressed assets have tended to originate in South Australia (SA), Victoria (Vic) and New South Wales (NSW). Over the year, there has been little stress emerge in the agriculture portfolio from drought conditions evident in NSW and Qld. New stress has been more prevalent in the retail trade and health sectors.
The New Zealand business portfolio has continued to benefit from the improving prospects of the New Zealand dairy sector with a number of facilities returning to performing.
The credit quality of the mortgage portfolio remains sound with Australian mortgage 90+ day delinquencies 5 basis points higher over the twelve months to 30 September 2018 to end the year at 0.72%. The rise in delinquencies has been more broadly spread across the country. This year NSW delinquencies have risen from a low base and while they remain below the portfolio average, given NSW accounts for a large portion of the Group’s portfolio it had the largest influence on overall delinquencies.
Australian properties in possession decreased over Full Year 2018 by 41 to 396 due principally to those states and regions impacted by the slowing of the mining investment cycle which had seen elevated levels in Second Half 2017. Realised mortgage losses for the Group were $89 million for Full Year 2018, equivalent to 2 basis points.
Consumer unsecured delinquencies were higher over Full Year 2018. Total Group other consumer 90+ day delinquencies were 1.64%, up 7 basis points since 30 September 2017 and were unchanged compared to 31 March 2018.
New Zealand mortgage 90+ day delinquencies decreased 1 basis point from 30 September 2018 to 0.11% and improved 5 basis points in Second Half 2018 in line with seasonal trends. Delinquencies remain at or near historical lows and reflect the favourable economic conditions, and the positive impact of prudential controls reducing the level of higher LVR lending.
New Zealand unsecured delinquencies were higher at 0.62%. Other consumer 90+ day delinquencies increased 5 basis points since 30 September 2017 and were 24 basis points lower than 31 March 2018. Provisioning
Westpac has maintained adequate provisioning coverage:
The ratio of gross impaired asset provisions to gross impaired assets remain high at 46.1% (46.3% at 30 September 2017); and
The ratio of collectively assessed provisions to credit risk weighted assets was 73 basis points with the ratio down 2 basis points compared to 30 September 2017. Most of the decline is due to higher risk weighted assets, mostly from mortgage RWA modelling changes.

2018 Full Year financial results Review of Group operations
34 | Westpac Group 2018 Full Year Financial Results Announcement
2.3.1 Credit quality key metrics
As at As at As at As at
30 Sept 31 March 30 Sept 31 March
2018 2018 2017 2017
Stressed exposures by credit grade as a % of TCE: Impaired 0.14% 0.15% 0.15% 0.20% 90 days past due and not impaired 0.39% 0.37% 0.34% 0.35% Watchlist and substandard 0.55% 0.57% 0.56% 0.59%
Total stressed exposures 1.08% 1.09% 1.05% 1.14%
Gross impaired assets to TCE for business and institutional: Business Australia 0.47% 0.48% 0.47% 0.63% Business New Zealand 0.50% 0.74% 0.62% 0.68%
Institutional 0.02% 0.04% 0.06% 0.17%
Mortgage 90+ day delinquencies: Group 0.67% 0.65% 0.62% 0.63% Australia 0.72% 0.69% 0.67% 0.67% New Zealand 0.11% 0.16% 0.12% 0.14%
Other consumer loans 90+ day delinquencies:
Group 1.64% 1.64% 1.57% 1.55%
Australia 1.73% 1.71% 1.66% 1.63%
New Zealand 0.62% 0.86% 0.57% 0.58%
Other:
Gross impaired assets to gross loans 0.20% 0.22% 0.22% 0.30%
Gross impaired asset provisions to gross impaired assets 46.12% 45.54% 46.30% 52.07%
Total provisions to gross loans 43bps 45bps 45bps 52bps
Collectively assessed provisions to risk weighted assets 62bps 65bps 65bps 67bps
Collectively assessed provisions to credit risk weighted assets 73bps 75bps 76bps 77bps
Total provisions to risk weighted assets 72bps 76bps 77bps 87bps
Impairment charges to average loans annualised1 9bps 11bps 11bps 15bps
Net write-offs to average loans annualised1 14bps 13bps 25bps 19bps
1 Averages are based on a six month period.

2018 Full Year financial results Review of Group operations
Westpac Group 2018 Full Year Financial Results Announcement | 35
2.4 Balance sheet and funding
2.4.1 Balance sheet
As at As at As at % Mov't % Mov't
30 Sept 31 March 30 Sept Sept 18 - Sept 18 -
$m 2018 2018 2017 Mar 18 Sept 17
Assets
Cash and balances with central banks 26,431 21,580 18,397 22 44
Receivables due from other financial institutions 5,790 3,977 7,128 46 (19)
Trading securities and financial assets designated at fair value and
available-for-sale securities 83,253 85,484 86,034 (3) (3)
Derivative financial instruments 24,101 26,904 24,033 (10) -
Loans 709,690 701,393 684,919 1 4
Life insurance assets 9,450 10,481 10,643 (10) (11)
Other assets 20,877 22,036 20,721 (5) 1
Total assets 879,592 871,855 851,875 1 3
Liabilities
Payables due to other financial institutions 18,137 19,073 21,907 (5) (17)
Deposits and other borrowings 559,285 547,736 533,591 2 5
Other financial liabilities at fair value through income statement 4,297 5,590 4,056 (23) 6
Derivative financial instruments 24,407 24,066 25,375 1 (4)
Debt issues 172,596 174,138 168,356 (1) 3
Life insurance liabilities 7,597 8,763 9,019 (13) (16)
Loan capital 17,265 18,333 17,666 (6) (2)
Other liabilities 11,435 11,491 10,563 - 8
Total liabilities 815,019 809,190 790,533 1 3
Equity
Total equity attributable to owners of Westpac Banking Corporation 64,521 62,615 61,288 3 5
Non-controlling interests 52 50 54 4 (4)
Total equity 64,573 62,665 61,342 3 5
Second Half 2018 – First Half 2018
Key movements during the half included:
Assets
Cash and balances with central banks increased $4.9 billion or 22% reflecting higher liquid assets held in this form;
Receivables due from other financial institutions increased $1.8 billion or 46% mainly due to an increase in collateral posted with derivative counterparties and higher interbank lending;
Trading securities and financial assets designated at fair value and available-for-sale securities decreased $2.2 billion or 3% reflecting lower holdings of liquid assets in this form;
Derivative assets decreased $2.8 billion or 10% mainly driven by foreign currency translation impacts on cross currency swaps and forward contracts, and movements in interest rate swaps;
Loans grew $8.3 billion or 1%. Refer to Section 2.2.2 Loans for further information; and
Life insurance assets decreased $1.0 billion or 10%, due to the transfer by an investor to another Group managed fund that is not consolidated.
Liabilities
Payables due to other financial institutions decreased $0.9 billion or 5% due to lower securities sold under agreements to repurchase, and collateral posted by derivative counterparties, partly offset by higher interbank borrowings and offshore central bank deposits;
Deposits and other borrowings increased $11.5 billion or 2%. Refer to Section 2.2.3 Deposits and other borrowings for further information;
Other financial liabilities at fair value through the income statement decreased $1.3 billion or 23% reflecting lower securities sold under agreements to repurchase;

2018 Full Year financial results Review of Group operations
36 | Westpac Group 2018 Full Year Financial Results Announcement
Life insurance liabilities decreased $1.2 billion or 13%, due to the transfer by an investor to another Group managed fund that is not consolidated;
Debt issues decreased $1.5 billion or 1% ($7.8 billion or 4% decrease excluding foreign currency impacts). Refer to Section 2.4.2 Funding and liquidity risk management for further information; and
Loan capital decreased $1.1 billion or 6% as maturities exceeded new issuance for Tier 2 capital instruments offset by higher Additional Tier 1 capital.
Equity attributable to owners of Westpac Banking Corporation increased $1.9 billion or 3% reflecting retained profits less dividends paid during the period and shares issued under the 2018 interim dividend reinvestment plan (DRP) and the conversion of some convertible preference shares to ordinary share capital. Full Year 2018 – Full Year 2017
Key movements included:
Assets
Cash and balances with central banks increased $8.0 billion or 44% reflecting higher liquid assets held in this form;
Receivables due from other financial institutions decreased $1.3 billion or 19% mainly due to a reduction in collateral posted with derivative counterparties and lower interbank lending;
Trading securities and financial assets designated at fair value and available-for-sale securities decreased $2.8 billion or 3% reflecting lower holdings of liquid assets in this form;
Loans grew $24.8 billion or 4%. Refer to Section 2.2.2 Loans for further information; and
Life insurance assets decreased $1.2 billion or 11%, due to the transfer by an investor to another Group managed fund that is not consolidated.
Liabilities
Payables due to other financial institutions decreased $3.8 billion or 17% due to lower securities sold under agreements to repurchase, interbank borrowings and collateral posted by derivative counterparties, partly offset by higher offshore central bank deposits;
Deposits and other borrowings increased $25.7 billion or 5%. Refer to Section 2.2.3 Deposits and other borrowings for further information;
Debt issues increased $4.2 billion or 3% ($6.8 billion or 4% decrease excluding foreign currency impacts). Refer to Section 2.4.2 Funding and liquidity risk management for further information; and
Life insurance liabilities decreased $1.4 billion or 16%, due to the transfer by an investor to another Group managed fund that is not consolidated.
Equity attributable to owners of Westpac Banking Corporation increased $3.2 billion reflecting retained profits less dividends paid during the period and shares issued under the 2018 interim DRP and 2017 final DRP and the conversion of some convertible preference shares to ordinary share capital.

2018 Full Year financial results Review of Group operations
Westpac Group 2018 Full Year Financial Results Announcement | 37
2.4.2 Funding and liquidity risk management
Liquidity risk is the risk that the Group will be unable to fund assets and meet obligations as they become due. This type of risk is inherent for all banks through their role as intermediaries between depositors and borrowers. The Group has a liquidity risk management framework which seeks to meet the objective of meeting cash flow obligations under a wide range of market conditions, including name specific and market-wide stress scenarios, as well as meeting the regulatory requirements of the LCR and NSFR1.
In Full Year 2018 the Group maintained an appropriate funding and liquidity profile. Key measures of balance sheet strength and funding and liquidity metrics remained comfortably above regulatory minimums at 30 September 2018, including an LCR of 133% and an NSFR of 114%.
Liquid Assets
The Group’s liquid asset portfolio includes both high-quality liquid assets (HQLA) and other securities that are eligible for repurchase with a central bank. In total, Westpac held $153.7 billion in unencumbered liquid assets as at 30 September 2018 (31 March 2018: $147.6 billion; 30 September 2017: $137.8 billion). At 30 September 2018 the portfolio comprised:
$76.3 billion of cash, deposits at central banks, government and semi-government bonds;
$21.9 billion of repo-eligible private securities; and
$55.5 billion of self-originated AAA rated mortgage backed securities, which are eligible collateral for repurchase agreement with the RBA or the RBNZ.
LCR
The LCR requires banks to hold sufficient HQLA, as defined, to withstand 30 days under a regulator-defined acute stress scenario.
Given the limited amount of government debt in Australia, the RBA, jointly with APRA, makes available to ADIs a CLF. Subject to satisfaction of qualifying conditions, the CLF can be accessed to help meet the LCR requirement. In order to have access to a CLF, ADIs are required to pay a fee of 15 basis points (0.15%) per annum to the RBA on the approved undrawn facility. APRA approved Westpac’s CLF allocation of $57 billion for the 2018 calendar year (2017 calendar year: $49 billion). APRA has approved a CLF allocation for Westpac of $54 billion for the 2019 calendar year.
The Group’s LCR as at 30 September 2018 was 133% (31 March 2018: 134%; 30 September 2017: 124%) and the average LCR for the quarter ended 30 September 2018 was 131%2.
NSFR
The Group is required to maintain a NSFR, designed to encourage longer-term funding resilience, of at least 100%. The NSFR came into effect for Australian ADIs on 1 January 2018. Westpac had a NSFR of 114% at 30 September 2018 (31 March 2018: 112%). Improvement in the ratio since 31 March 2018 mainly reflects growth in customer deposits and higher capital balances.
Funding
The Group monitors the composition and stability of its funding so that it remains within the Group’s funding risk appetite. This includes compliance with both the LCR and NSFR.
The Group’s funding composition improved over Full Year 2018, with an increase in the proportion of stable funding. Customer deposits as a proportion of total funding increased by 127 basis points to 63.1% (30 September 2017: 61.8%), while the proportion of long term funding to total funding increased by 45 basis points to 15.7% (30 September 2017: 15.2%). There was little change in other sources of stable funding, with securitisation and equity to total funding remaining relatively stable.
Short term wholesale funding as a proportion of total funding decreased by 165 basis points to 12.4% (30 September 2017: 14.1%). The Group’s short term funding portfolio (including long term to short term scroll) of $102 billion has a weighted average maturity of 151 days and is more than covered by the $153.7 billion of repo-eligible liquid assets held by the Group.
In Full Year 2018, the Group raised $32 billion of long term wholesale funding. The majority of new issuance came in the form of senior unsecured and covered bond format, in core currencies of AUD, USD, EUR and GBP. The Group also continued to benefit from its position as the only major Australian bank with an active Auto ABS capability and the only Australian bank with access to the US SEC registered market, raising funds in both these markets during the year. New term issuance also included $3 billion of Basel III compliant Additional Tier 1 and Tier 2 capital.
1 Refer to Glossary for definition. 2 Calculated as a simple average of the daily observations over the 30 September 2018 quarter.

2018 Full Year financial results Review of Group operations
38 | Westpac Group 2018 Full Year Financial Results Announcement
The Group maintained its consistent approach to lengthening the tenor of its long term funding portfolio. In Full Year 2018, 76% of new term issuance had a contractual maturity of five years or more and this contributed to a weighted average maturity (excluding securitisation) of new term issuance in Full Year 2018 of 6.5 years (Full Year 2017: 5.8 years).
Liquidity coverage ratio
As at As at As at % Mov't % Mov't
30 Sept 31 March 30 Sept Sept 18 - Sept 18 -
$m 2018 2018 2017 Mar 18 Sept 17
High Quality Liquid Assets (HQLA)1 76,482 71,952 71,904 6 6
Committed Liquidity Facility (CLF)1 57,000 57,000 49,100 - 16
Total LCR liquid assets 133,482 128,952 121,004 4 10
Cash outflows in a modelled 30-day APRA defined
stressed scenario
Customer deposits 70,348 66,222 65,612 6 7
Wholesale funding 9,570 8,411 12,231 14 (22)
Other flows2 20,476 21,405 20,109 (4) 2
Total 100,394 96,038 97,952 5 2
LCR3 133% 134% 124% (131bps) large
Net stable funding ratio4 Proforma As at As at as at % Mov't % Mov't 30 Sept 31 March 30 Sept Sept 18 - Sept 18 - $m 2018 2018 2017 Mar 18 Sept 17
Available stable funding 601,184 593,669 566,304 1 6 Required stable funding 529,463 529,100 521,048 - 2
Net stable funding ratio 114% 112% 109% 135bps large
Funding by residual maturity As at 30 Sept 2018 As at 31 March 2018 As at 30 Sept 2017
$m Ratio % $m Ratio % $m Ratio %
Wholesale funding
Less than 6 months 53,649 6.5 61,245 7.6 63,173 8.0
6 to 12 months 18,537 2.3 16,973 2.1 19,776 2.5
Long term to short term scroll5 29,894 3.6 27,522 3.4 27,955 3.6
Wholesale funding - residual maturity less
than 12 months 102,080 12.4 105,740 13.1 110,904 14.1
Securitisation 7,588 0.9 8,186 1.0 8,209 1.0
Greater than 12 months 128,276 15.7 128,921 16.0 119,494 15.2
Wholesale funding - residual maturity greater
than 12 months 135,864 16.6 137,107 17.0 127,703 16.2
Customer deposits 517,751 63.1 502,063 62.1 486,670 61.8
Equity6 64,978 7.9 63,225 7.8 61,925 7.9
Total funding 820,673 100.0 808,135 100.0 787,202 100.0
Deposits to net loans ratio1 As at 30 Sept 2018 As at 31 March 2018 As at 30 Sept 2017
$m Ratio % $m Ratio % $m Ratio %
Customer deposits 517,751 502,063 486,670
Net loans 709,690 73.0 701,393 71.6 684,919 71.1
1 Refer to Glossary for definition. 2 Other flows include credit and liquidity facilities, collateral outflows and inflows from customers. 3 Calculated on a spot basis. 4 The NSFR was effective from 1 January 2018 for ADIs. 5 Scroll represents wholesale funding with an original maturity greater than 12 months that now has a residual maturity less than
12 months. 6 Includes total share capital, share based payments reserve and retained profits.

2018 Full Year financial results Review of Group operations
Westpac Group 2018 Full Year Financial Results Announcement | 39
Funding view of the balance sheet
Total liquid Customer Wholesale Customer Market
$m assets1 deposits funding franchise inventory Total
As at 30 Sept 2018
Total assets 153,694 - - 668,237 57,661 879,592
Total liabilities - (517,751) (237,944) - (59,324) (815,019)
Total equity - - - (64,978) 405 (64,573)
Total 153,694 (517,751) (237,944) 603,259 (1,258) -
Net loans2 55,500 - - 654,190 - 709,690
As at 31 Mar 2018
Total assets 147,634 - - 660,417 63,804 871,855
Total liabilities - (502,063) (242,847) - (64,280) (809,190)
Total equity - - - (63,225) 560 (62,665)
Total 147,634 (502,063) (242,847) 597,192 84 -
Net loans2 55,058 - - 646,335 - 701,393
As at 30 Sept 2017
Total assets 137,797 - - 651,573 62,505 851,875
Total liabilities - (486,670) (238,607) - (65,256) (790,533)
Total equity - - - (61,925) 583 (61,342)
Total 137,797 (486,670) (238,607) 589,648 (2,168) -
Net loans2 47,935 - - 636,984 - 684,919
1 Refer to Glossary for definition. 2 Liquid assets in net loans include internally securitised assets that are eligible for repurchase agreements with the RBA / RBNZ.

2018 Full Year financial results Review of Group operations
40 | Westpac Group 2018 Full Year Financial Results Announcement
2.5 Capital and dividends
As at As at As at % Mov't % Mov't
30 Sept 31 March 30 Sept Sept 18 - Sept 18 -
2018 2018 2017 Mar 18 Sept 17
Regulatory capital structure
Common equity Tier 1 capital after deductions ($m) 45,239 43,639 42,670 4 6
Risk weighted assets (RWA) ($m) 425,384 415,744 404,235 2 5
Common equity Tier 1 capital ratio (CET1) 10.63% 10.50% 10.56% 13bps 7bps
Additional Tier 1 capital ratio 2.15% 2.31% 2.10% (16bps) 5bps
Tier 1 capital ratio 12.78% 12.81% 12.66% (3bps) 12bps
Tier 2 capital ratio 1.96% 2.02% 2.16% (6bps) (20bps)
Total regulatory capital ratio 14.74% 14.83% 14.82% (9bps) (8bps)
APRA leverage ratio1 5.84% 5.75% 5.66% 9bps 18bps
Capital management strategy
In light of APRA’s announcement on ‘unquestionably strong’ capital benchmarks on 19 July 2017, Westpac will seek to operate with a CET1 capital ratio of at least 10.5% in March and September as measured under the existing capital framework. This also takes into consideration:
Current regulatory capital minimums and the capital conservation buffer (CCB), which together are the total CET1 requirement. In line with the above, the total CET1 requirement for Westpac is at least 8.0%, based upon an industry minimum CET1 requirement of 4.5% plus a capital buffer of at least 3.5% applicable to domestic systemically important banks (D-SIBs)2;
Stress testing to calibrate an appropriate buffer against a downturn; and
Quarterly volatility of capital ratios due to the half yearly cycle of ordinary dividend payments.
Should the CET1 capital ratio fall below the total CET1 requirement, restrictions on the distribution of earnings will apply. This includes restrictions on the amount of earnings that can be distributed through dividends, Additional Tier 1 capital distributions and discretionary staff bonuses.
Westpac will revise its target capital level once APRA finalises its review of the capital adequacy framework.
Common Equity Tier 1 capital ratio movement for Second Half 2018
Westpac’s CET1 capital ratio was 10.63% at 30 September 2018, up 13 basis points from 31 March 2018. The increase was principally due to 20 basis points of organic capital growth and conversion of some preference shares (14 basis points increase), with these items partially offset by regulatory measurement changes of 30 basis points for mortgage risk weights and operational risk RWA.
Organic capital generation of 20 basis points included:
Second Half 2018 cash earnings of $3.8 billion (90 basis point increase);
The 2018 interim dividend payment, net of DRP share issuance (68 basis point decrease);
1 Refer to Glossary for definition. 2 Noting that APRA may apply higher CET1 requirements for an individual ADI.
3bps4bps
31Mar2018
10.63%
90bps
Cashearnings
Othercapital
movements
(30bps)
Impact ofRWA model
changes
(5bps) 14bps
$566mresidual
CPSconverted
5bps
OrdinaryRWA
growth
FXtranslation
impact
30Sep2018
Interimdividend
(net of DRP)
(68bps)10.50%
Exit of investments
Other items(-7bps)
Organic(+20bps)

2018 Full Year financial results Review of Group operations
Westpac Group 2018 Full Year Financial Results Announcement | 41
Ordinary RWA (3 basis point increase); and
A 5 basis point reduction from other capital movements.
Other items, in aggregate, reduced the CET1 capital ratio by 7 basis points. Regulatory measurement changes impacting mortgages and operational risk RWA (30 basis point decrease) were mostly offset by the conversion of $566m of convertible preference shares to ordinary shares (14 basis point increase), the exit of Hastings and the reduction in equity investments in Ascalon (5 basis point increase) and foreign currency translation impacts (4 basis point increase).
Additional Tier 1 and Tier 2 capital movement for Second Half 2018
During the half Westpac:
Converted $566 million of convertible preference shares to ordinary shares (14 basis point decrease to the additional Tier 1 capital ratio);
Issued $0.7 billion of new Tier 2 capital instruments (17 basis point increase); and
Redeemed $0.9 billion of Tier 2 capital instruments (22 basis points decrease). Common Equity Tier 1 capital ratio movement for Full Year 2018
The 30 September 2018 CET1 capital ratio of 10.63%, 7 basis points higher than reported at 30 September 2017, mostly reflects organic capital generation (38 basis point increase), conversion of $566 million of convertible preference shares (14 basis point increase) and the exit of Hastings and reduction in equity investments in Ascalon (5 basis point increase) offset by regulatory modelling changes (52 basis point decrease).
Leverage ratio
The leverage ratio represents the amount of Tier 1 capital relative to exposure. At 30 September 2018, Westpac’s leverage ratio was 5.8%1, up 9 basis points since 31 March 2018.
Internationally comparable capital ratios
The APRA Basel III capital adequacy requirements are more conservative than those of the Basel Committee on Banking Supervision (BCBS), leading to lower reported capital ratios when compared to international peers. APRA conducted a study in July 2015 outlining its methodology for measuring international comparable capital ratios. For details on the adjustments refer to Westpac’s 2018 Full Year Investor Discussion Pack.
The table below calculates the Group’s reported capital ratios consistent with this methodology.
As at As at As at % Mov't % Mov't
30 Sept 31 March 30 Sept Sept 18 - Sept 18 -
2018 2018 2017 Mar 18 Sept 17
Internationally comparable capital ratios
Common equity Tier 1 capital ratio 16.14% 16.13% 16.20% 1bps (6bps)
Tier 1 capital ratio 19.02% 19.06% 18.64% (4bps) 38bps
Total regulatory capital ratio 21.50% 21.68% 21.09% (18bps) 41bps
Leverage ratio 6.48% 6.39% 6.33% 9bps 15bps
1 The leverage ratio is based on the same definition of Tier 1 as used for APRA capital requirements and is not comparable to the Basel
Committee for Banking Supervision leverage ratio calculation.
192bps
10.56%
OrdinaryRWA
growth
Cashearnings
2bps
30Sep2017
(52bps)
Impact ofRWA model
changes
14bps
$566mresidual
CPSconverted
5bps
Exit of investments
FXtranslation
impact
Dividends(net of DRP)
(11bps)(138bps)
Othercapital
movements
(5bps) 10.63%
30Sep2018
Organic(+38bps)
Other items(-31bps)
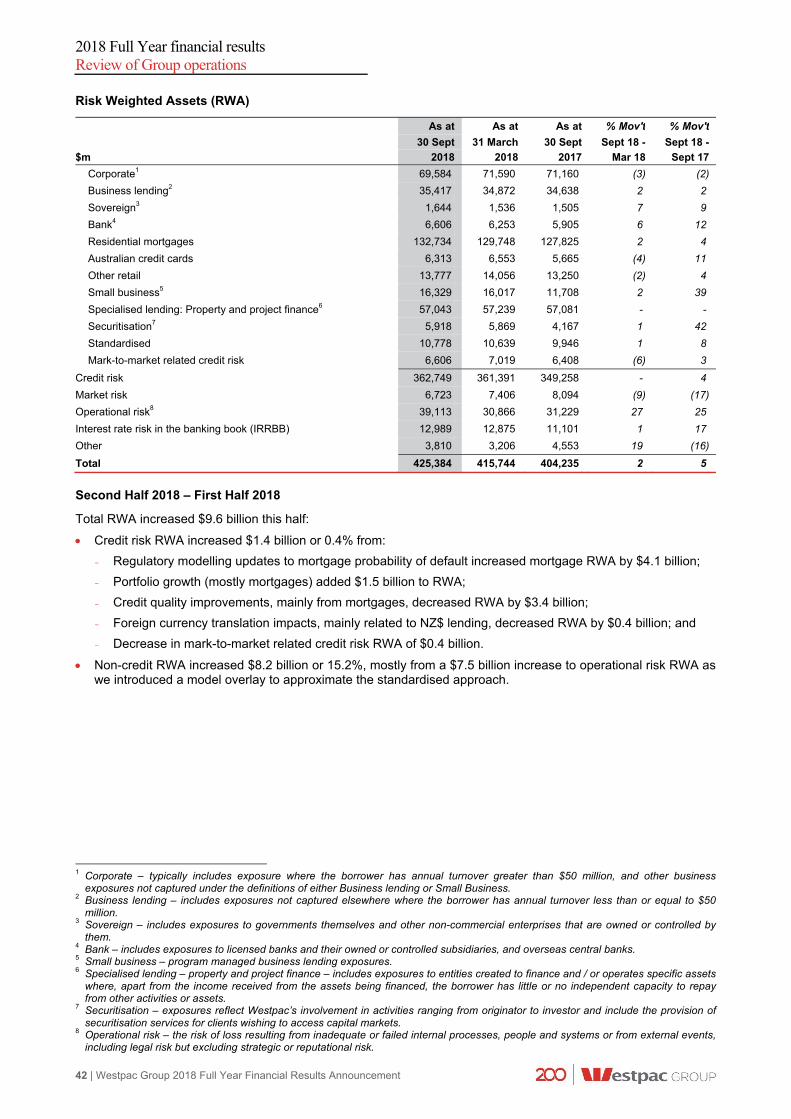
2018 Full Year financial results Review of Group operations
42 | Westpac Group 2018 Full Year Financial Results Announcement
Risk Weighted Assets (RWA)
As at As at As at % Mov't % Mov't
30 Sept 31 March 30 Sept Sept 18 - Sept 18 -
$m 2018 2018 2017 Mar 18 Sept 17
Corporate1 69,584 71,590 71,160 (3) (2)
Business lending2 35,417 34,872 34,638 2 2
Sovereign3 1,644 1,536 1,505 7 9
Bank4 6,606 6,253 5,905 6 12
Residential mortgages 132,734 129,748 127,825 2 4
Australian credit cards 6,313 6,553 5,665 (4) 11
Other retail 13,777 14,056 13,250 (2) 4
Small business5 16,329 16,017 11,708 2 39
Specialised lending: Property and project finance6 57,043 57,239 57,081 - -
Securitisation7 5,918 5,869 4,167 1 42
Standardised 10,778 10,639 9,946 1 8
Mark-to-market related credit risk 6,606 7,019 6,408 (6) 3
Credit risk 362,749 361,391 349,258 - 4
Market risk 6,723 7,406 8,094 (9) (17)
Operational risk8 39,113 30,866 31,229 27 25
Interest rate risk in the banking book (IRRBB) 12,989 12,875 11,101 1 17
Other 3,810 3,206 4,553 19 (16)
Total 425,384 415,744 404,235 2 5
Second Half 2018 – First Half 2018
Total RWA increased $9.6 billion this half:
Credit risk RWA increased $1.4 billion or 0.4% from:
- Regulatory modelling updates to mortgage probability of default increased mortgage RWA by $4.1 billion;
- Portfolio growth (mostly mortgages) added $1.5 billion to RWA;
- Credit quality improvements, mainly from mortgages, decreased RWA by $3.4 billion;
- Foreign currency translation impacts, mainly related to NZ$ lending, decreased RWA by $0.4 billion; and
- Decrease in mark-to-market related credit risk RWA of $0.4 billion.
Non-credit RWA increased $8.2 billion or 15.2%, mostly from a $7.5 billion increase to operational risk RWA as we introduced a model overlay to approximate the standardised approach.
1 Corporate – typically includes exposure where the borrower has annual turnover greater than $50 million, and other business
exposures not captured under the definitions of either Business lending or Small Business. 2 Business lending – includes exposures not captured elsewhere where the borrower has annual turnover less than or equal to $50
million. 3 Sovereign – includes exposures to governments themselves and other non-commercial enterprises that are owned or controlled by
them. 4 Bank – includes exposures to licensed banks and their owned or controlled subsidiaries, and overseas central banks. 5 Small business – program managed business lending exposures. 6 Specialised lending – property and project finance – includes exposures to entities created to finance and / or operates specific assets
where, apart from the income received from the assets being financed, the borrower has little or no independent capacity to repay from other activities or assets.
7 Securitisation – exposures reflect Westpac’s involvement in activities ranging from originator to investor and include the provision of securitisation services for clients wishing to access capital markets.
8 Operational risk – the risk of loss resulting from inadequate or failed internal processes, people and systems or from external events, including legal risk but excluding strategic or reputational risk.

2018 Full Year financial results Review of Group operations
Westpac Group 2018 Full Year Financial Results Announcement | 43
Full Year 2018 – Full Year 2017
Total RWA increased $21.1 billion over the year:
Credit risk RWA increased $13.5 billion or 3.9%:
- Regulatory modelling changes added $10.1 billion to RWA mostly from:
o updates to mortgage probability of default models increased mortgage RWA by $4.1 billion:
o implementation of APRA’s revised prudential standard for securitisation (APS 120) effective from 1 January 2018 ($1.4 billion increase);
o updates to models for small business in line with APRA guidance on the definition of default ($1.8 billion increase);
o changes in the modelling for credit cards and personal loans which include updated data for facilities in hardship ($2.1 billion increase); and
o reclassification of $6.6 billion of mortgage exposures to business related categories ($0.7 billion net RWA increase). The reclassification follows APRA industry guidance that where the purpose of a mortgage loan is business related these loans should be reclassified under business related categories.
- Portfolio growth added $4.9 billion to RWA;
- Foreign currency translation impacts increased RWA by $0.8 billion;
- Increase in mark-to-market related credit risk RWA of $0.2 billion; and
- Credit quality improvements, mainly from mortgages, decreased RWA by $2.5 billion.
Non-credit RWA increased $7.6 billion or 13.9%, mostly from a $7.5 billion increase to operational risk RWA as we introduced a model overlay to approximate the standardised approach.

2018 Full Year financial results Review of Group operations
44 | Westpac Group 2018 Full Year Financial Results Announcement
Capital adequacy
As at As at As at
30 Sept 31 March 30 Sept
$m 2018 2018 2017
Tier 1 capital Common equity Tier 1 capital
Paid up ordinary capital 36,054 35,168 34,889 Treasury shares (507) (506) (436) Equity based remuneration 1,441 1,414 1,356 Foreign currency translation reserve (379) (522) (558) Accumulated other comprehensive income (11) (14) 15 Non-controlling interests - other 55 50 54 Retained earnings 27,883 27,122 26,100 Less retained earnings in life and general insurance, funds management and securitisation entities (1,218) (1,238) (1,153) Deferred fees 258 254 253
Total common equity Tier 1 capital 63,576 61,728 60,520
Deductions from common equity Tier 1 capital Goodwill (excluding funds management entities) (8,644) (8,656) (8,670) Deferred tax assets (1,169) (1,116) (1,110) Goodwill in life and general insurance, funds management and securitisation entities (942) (1,032) (1,065) Capitalised expenditure (1,838) (1,867) (1,913) Capitalised software (1,792) (1,628) (1,603) Investments in subsidiaries not consolidated for regulatory purposes (1,567) (1,532) (1,589) Regulatory expected loss in excess of eligible provisions (1,312) (1,192) (861) General reserve for credit losses adjustment (356) (339) (332) Securitisation - - - Equity investments (570) (680) (679) Defined benefit superannuation fund Surplus (78) - - Regulatory adjustments to fair value positions (68) (46) (27) Other Tier 1 deductions (1) (1) (1)
Total deductions from common equity Tier 1 capital (18,337) (18,089) (17,850)
Total common equity Tier 1 capital after deductions 45,239 43,639 42,670 Additional Tier 1 capital
Basel III complying instruments 9,144 9,041 7,315 Basel III transitional instruments - 566 1,190
Total Additional Tier 1 capital 9,144 9,607 8,505
Net Tier 1 regulatory capital 54,383 53,246 51,175 Tier 2 capital
Basel III complying instruments 8,025 8,102 7,375 Basel III transitional instruments 486 473 1,526 Eligible general reserve for credit loss 54 55 51 Basel III transitional adjustment - - -
Total Tier 2 capital 8,565 8,630 8,952
Deductions from Tier 2 capital Investments in subsidiaries not consolidated for regulatory purposes (140) (140) (140) Holdings of own and other financial institutions Tier 2 capital instruments (93) (83) (77)
Total deductions from Tier 2 capital (233) (223) (217) Net Tier 2 regulatory capital 8,332 8,407 8,735
Total regulatory capital 62,715 61,653 59,910
Risk weighted assets 425,384 415,744 404,235
Common equity Tier 1 capital ratio 10.63% 10.50% 10.56% Additional Tier 1 capital ratio 2.15% 2.31% 2.10%
Tier 1 capital ratio 12.78% 12.81% 12.66% Tier 2 capital ratio 1.96% 2.02% 2.16%
Total regulatory capital ratio 14.74% 14.83% 14.82%

2018 Full Year financial results Review of Group operations
Westpac Group 2018 Full Year Financial Results Announcement | 45
Dividends
% Mov't % Mov't
Half Year Half Year Sept 18 - Full Year Full Year Sept 18 -
Ordinary dividend (cents per share) Sept 18 March 18 Mar 18 Sept 18 Sept 17 Sept 17
Interim (fully franked) - 94 (100) 94 94 -
Final (fully franked) 94 - - 94 94 -
Total ordinary dividend 94 94 - 188 188 -
Payout ratio (reported)1 82.77% 76.07% large 79.52% 79.28% 24bps
Payout ratio (cash earnings)1 84.66% 75.28% large 79.94% 78.71% 123bps
Adjusted franking credit balance ($m) 1,357 1,279 6 1,357 1,063 28
Imputation credit (cents per share - NZ) 7.0 7.0 - 14.0 14.0 -
The Board has determined a final fully franked dividend of 94 cents per share, to be paid on 20 December 2018, to shareholders on the register at the record date of 14 November 20182. The final dividend represents a Second Half 2018 payout ratio on a cash earnings basis of 84.7% (Full Year 2018: 79.9%). In addition to being fully franked, the dividend will also carry NZ$0.07 in New Zealand imputation credits that may be used by New Zealand residents.
The Board has determined to satisfy the DRP for the 2018 final dividend by issuing Westpac ordinary shares. The Market Price used to determine the number of shares issued to DRP participants will be set over the 10 trading days commencing 19 November 2018 and will not include any discount. Capital deduction for regulatory expected credit loss
For capital adequacy purposes APRA requires the amount of regulatory expected credit losses in excess of eligible provisions to be deducted from CET1 capital. The table below shows the calculation of this capital deduction.
As at As at As at
30 Sept 31 March 30 Sept
$m 2018 2018 2017
Provisions associated with eligible portfolios Total provisions for impairment charges (Section 4 Note 10) 3,053 3,165 3,119 plus general reserve for credit losses adjustment 356 339 332 plus provisions associated with partial write-offs 101 82 148
less ineligible provisions3 (80) (79) (74)
Total eligible provisions 3,430 3,507 3,525
Regulatory expected downturn loss 4,742 4,699 4,386
Shortfall in eligible provisions compared to regulatory expected downturn loss 1,312 1,192 861
Common equity Tier 1 capital deduction for regulatory expected downturn loss
in excess of eligible provisions (1,312) (1,192) (861)
1 The dividend payout ratio for 1H18 was based on the number of shares on issue as at 31 March. On 3 April 2018, some CPS
converted into ordinary shares. Inclusion of these shares would have resulted in a dividend payout ratio of 76.50% (75.70% on a cash basis).
2 Record date in New York is 13 November 2018. 3 Provisions associated with portfolios subject to the Basel standardised approach to credit risk are not eligible.

2018 Full Year financial results Review of Group operations
46 | Westpac Group 2018 Full Year Financial Results Announcement
2.6 Sustainability performance
As one of Australia’s largest companies, Westpac Group can play a role in helping to create positive social, economic and environmental impact, for the benefit of all. At a time of great scrutiny of the financial services sector and the Royal Commission, it is particularly important that we work in an open and transparent way to build a strong banking system that delivers good outcomes for customers and the economy as a whole. Where mistakes are identified we put it right and seek to remediate the situation.
The Group’s approach to operating sustainably is designed to anticipate, respond to and shape new and emerging opportunities and challenges that have the potential to materially impact customers, employees, suppliers, shareholders and communities. We believe that as one of Australia’s largest companies we have a role to play in helping to create positive social, economic and environmental impact, and contribute to the United Nation’s Sustainable Development Goals. This view is embedded within the Group’s business activities, and aligns with the priorities set out in the Group’s strategy.
It’s about all of us: 2018-2020 Sustainability Strategy
This year marks the start of Westpac Group’s 2018-2020 Sustainability Strategy which outlines the Group’s commitment to building a sustainable future. This includes taking action in the areas where the Group can have the greatest impact and create sustainable, long-term value for customers, communities and the nation by:
Helping people make better financial decisions;
Helping people by being there when it matters most to them; and
Helping people create a prosperous nation.
Underpinning these priority areas is a commitment to fostering a culture of care and doing the right thing, and continuing to lead on the sustainability fundamentals – policies, action plans, frameworks and metrics reporting, in particular building on the climate change, human rights and reconciliation action plans.
Westpac is committed to regular reporting to enable a comparison of performance over time. The table below summarises first year progress on our 2018-2020 Sustainability Strategy.
Further disclosures available in the Westpac Annual Report and Sustainability Performance Report.
Performance against sustainability goals
Priority areas Goals Full Year 2018 performance
Helping people make better financial decisions
Help more people better understand their financial position, improving their financial confidence
Continued to offer a range of products and services, including Westpac SmartPlan, an online tool to help customers manage their credit card balance and pay down their debts more easily; and Westpac Life, a flexible savings account that supports customers’ savings goals;
Delivered financial literacy programs to individuals, businesses, not-for-profit organisations and community groups through Davidson Institute in Australia and the Managing Your Money program in New Zealand; and
Delivered communications promoting financial capability communication for different customer segments, including 512,000 children through Mathspace and Year 13 partnerships, 1.5 million young Australians via The Cusp, 229,000 women through Ruby Connection and 2.5 million Australians aged 65+ via Starts at 60.
Helping people by being there when it matters most to them
Help people recover from financial hardship
Helped customers experiencing financial hardship, issuing over 37,000 financial assistance packages; and
Established a specialist team, with experience in areas such as health and social work, to help customers in highly complex vulnerable circumstances.
Help people lift out of a difficult time and recover stronger
Announced a $100 million Drought Assistance Package including a range of lending support options such as discounted loans, deferring repayments and adjusted interest rates for customers with Farm Management Deposit (FMD);
Donated $100,000 to the Salvation Army Rural Support Services Program and a further $100,000 in Community Recovery Resilience grants;
Provided 104 relief packages for customers impacted by natural disasters across Australia; and
Donated $50,000 to the PNG Salvation Army to assist with relief efforts following a magnitude 7.5 earthquake in Papua New Guinea.

2018 Full Year financial results Review of Group operations
Westpac Group 2018 Full Year Financial Results Announcement | 47
Priority areas Goals Full Year 2018 performance
Helping people by being there when it matters most to them
Helping our most vulnerable customers
Convened the Vulnerable Customer Council which brings together representatives from customer advocate groups, financial counsellors and community organisations to understand their views and perspectives on our approach to issues impacting vulnerable customers;
Established processes to assist customers in vulnerable situations earlier in the complaints process for escalation to a high priority resolution team;
Announced ‘Loss of a loved one’ tools and resources to help customers and their family managing a deceased estate;
Introduced the option for credit cardholders to block transactions with gambling merchants to support customers vulnerable to a gambling problem manage their credit card spend;
Commenced preparations to establish a dedicated customer care team to provide specialist support for remote and Indigenous communities; and
Expanded dementia-friendly banking to BankSA and Bank of Melbourne.
Helping people creating a prosperous nation
Build the workforce of the future
Launched additional learning and development offerings as part of our focus on the future of work to assist employees to develop ‘skills for life’;
Introduced a Young Leader Program to develop and support high-potential emerging leaders; and
Published our Science, Technology, Engineering and Mathematics (STEM) Commitment, a series of initiatives and programs centred on investing in and inspiring the next generation, talent incubation, championing change and fostering innovation.
Invest and back the people and ideas shaping Australia
Westpac Bicentennial Foundation paid $3.7 million in educational scholarships to 100 scholars during Full Year 2018, bringing the total cohort of Westpac Scholars to 330;
Westpac Foundation Social Scale-up Grants supported social enterprises to create over 513 jobs1 for vulnerable Australians;
Westpac Foundation awarded $2 million in Community Grants to support 200 not-for-profit organisations;
275 businesses established through our Many Rivers partnership. Since its establishment the partnership has created jobs for 1,949 people, with 718 identifying as Indigenous;
Westpac has directly invested in eight early-stage companies;
To date, committed $150 million to Reinventure as part of its investment in three funds, supporting 23 early stage companies;
Announced 200 Business of Tomorrow program recipients, including a two week study tour to Silicon Valley, $50,000 professional services package and a mentor matching program with notable Australian business leaders offered to the top 20 businesses; and
Supported eight early-stage companies through the FUELD accelerator program by supporting them with Data Republic’s data-sharing platform, helping to develop ideas to solve customer and business problems across a range of industries.
Back the growth of climate change solutions
Increased committed exposure to climate change solutions relative to Full Year 2017, taking total committed exposure to more than $9 billion, progressing towards our 2020 target of $10 billion;
Arranged and issued climate-related bonds of $1.7 billion supporting the Group’s $3 billion funding for climate change solutions; and
Undertook analysis to understand the implications of 2-degree and 4-degree climate scenarios on our business.
Back the growth of housing affordability solutions
Lent $1.36 billion to the social and affordable housing sector, up from $1.32 billion at 30 September 2017; and
Conducted an extensive review of the housing affordability challenge, explored support for innovative housing solutions (such as build-to-rent and shared equity), and providing funding to emerging charity HeadStart Homes to help Australians living in social housing take steps towards owning their own home.
Bring together partners and harness the Group’s capacity to tackle pressing social issues that matter most to the nation
Joined 28 banks in co-founding and drafting the Principles for Responsible Banking, a UNEP-FI initiative to promote alignment of the global banking sector, in making progress on the Sustainable Development Goals and Paris Climate Agreement;
Supported dialogue across institutional customers and Westpac experts to collaborate on initiatives towards eradicating modern slavery and other severe human rights issues; and
Hosted Westpac’s first Sustainable & Inclusive Sourcing Forum to encourage cross-sector collaboration.
1 All results as at 30 September 2018 except Westpac Social Scale-up jobs created which is as at 30 June 2018. Refer to
www.westpac.com.au/sustainabilty for glossary of terms and metrics definitions.
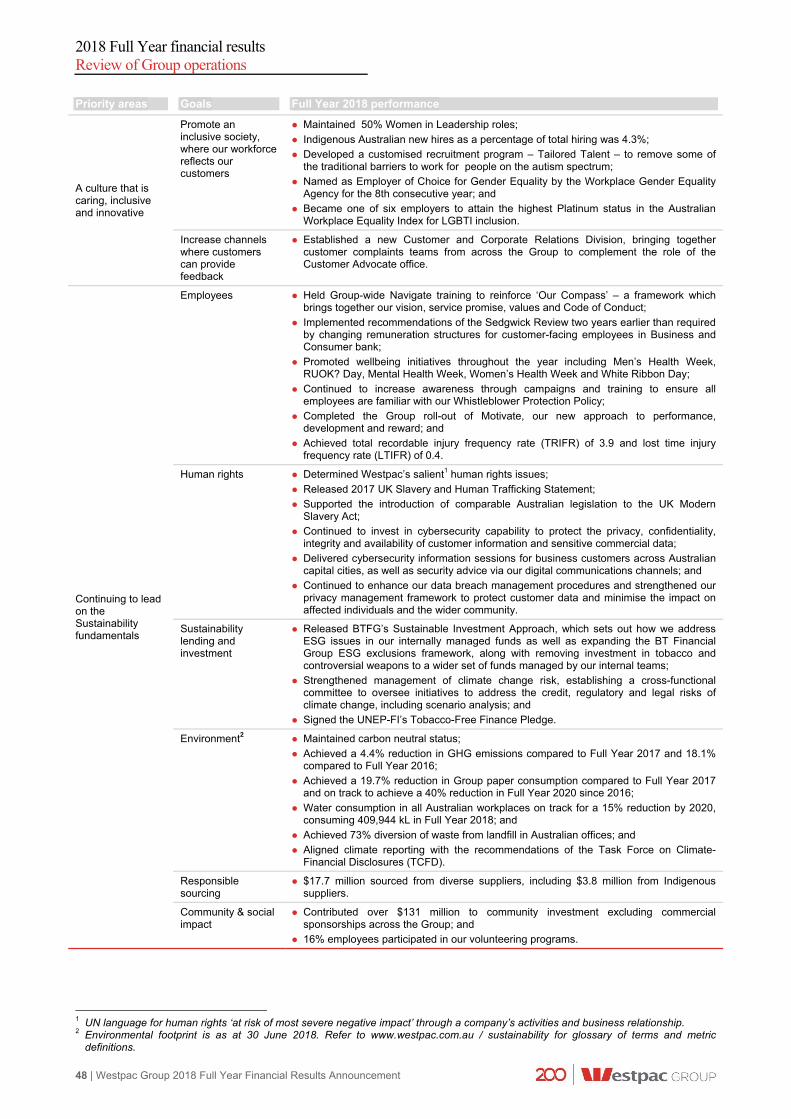
2018 Full Year financial results Review of Group operations
48 | Westpac Group 2018 Full Year Financial Results Announcement
Priority areas Goals Full Year 2018 performance
A culture that is caring, inclusive and innovative
Promote an inclusive society, where our workforce reflects our customers
Maintained 50% Women in Leadership roles;
Indigenous Australian new hires as a percentage of total hiring was 4.3%;
Developed a customised recruitment program – Tailored Talent – to remove some of the traditional barriers to work for people on the autism spectrum;
Named as Employer of Choice for Gender Equality by the Workplace Gender Equality Agency for the 8th consecutive year; and
Became one of six employers to attain the highest Platinum status in the Australian Workplace Equality Index for LGBTI inclusion.
Increase channels where customers can provide feedback
Established a new Customer and Corporate Relations Division, bringing together customer complaints teams from across the Group to complement the role of the Customer Advocate office.
Continuing to lead on the Sustainability fundamentals
Employees Held Group-wide Navigate training to reinforce ‘Our Compass’ – a framework which brings together our vision, service promise, values and Code of Conduct;
Implemented recommendations of the Sedgwick Review two years earlier than required by changing remuneration structures for customer-facing employees in Business and Consumer bank;
Promoted wellbeing initiatives throughout the year including Men’s Health Week, RUOK? Day, Mental Health Week, Women’s Health Week and White Ribbon Day;
Continued to increase awareness through campaigns and training to ensure all employees are familiar with our Whistleblower Protection Policy;
Completed the Group roll-out of Motivate, our new approach to performance, development and reward; and
Achieved total recordable injury frequency rate (TRIFR) of 3.9 and lost time injury frequency rate (LTIFR) of 0.4.
Human rights Determined Westpac’s salient1 human rights issues;
Released 2017 UK Slavery and Human Trafficking Statement;
Supported the introduction of comparable Australian legislation to the UK Modern Slavery Act;
Continued to invest in cybersecurity capability to protect the privacy, confidentiality, integrity and availability of customer information and sensitive commercial data;
Delivered cybersecurity information sessions for business customers across Australian capital cities, as well as security advice via our digital communications channels; and
Continued to enhance our data breach management procedures and strengthened our privacy management framework to protect customer data and minimise the impact on affected individuals and the wider community.
Sustainability lending and investment
Released BTFG’s Sustainable Investment Approach, which sets out how we address ESG issues in our internally managed funds as well as expanding the BT Financial Group ESG exclusions framework, along with removing investment in tobacco and controversial weapons to a wider set of funds managed by our internal teams;
Strengthened management of climate change risk, establishing a cross-functional committee to oversee initiatives to address the credit, regulatory and legal risks of climate change, including scenario analysis; and
Signed the UNEP-FI’s Tobacco-Free Finance Pledge.
Environment2 Maintained carbon neutral status;
Achieved a 4.4% reduction in GHG emissions compared to Full Year 2017 and 18.1% compared to Full Year 2016;
Achieved a 19.7% reduction in Group paper consumption compared to Full Year 2017 and on track to achieve a 40% reduction in Full Year 2020 since 2016;
Water consumption in all Australian workplaces on track for a 15% reduction by 2020, consuming 409,944 kL in Full Year 2018; and
Achieved 73% diversion of waste from landfill in Australian offices; and
Aligned climate reporting with the recommendations of the Task Force on Climate- Financial Disclosures (TCFD).
Responsible sourcing
$17.7 million sourced from diverse suppliers, including $3.8 million from Indigenous suppliers.
Community & social impact
Contributed over $131 million to community investment excluding commercial sponsorships across the Group; and
16% employees participated in our volunteering programs.
1 UN language for human rights ‘at risk of most severe negative impact’ through a company’s activities and business relationship. 2 Environmental footprint is as at 30 June 2018. Refer to www.westpac.com.au / sustainability for glossary of terms and metric
definitions.

2018 Full Year financial results Divisional results
Westpac Group 2018 Full Year Financial Results Announcement | 49
3.0 Divisional results
Comparative divisional results for Full Year 2017 have been restated. The changes include updates to the methodologies to allocate certain costs, revenues and capital to divisions. These changes have no impact on the overall Group’s results or balance sheet. Refer Section 4, Note 2 for further details.
3.1 Consumer Bank
Consumer Bank (CB) is responsible for sales and service to consumer customers in Australia under the Westpac, St.George, BankSA, Bank of Melbourne and RAMS brands. Activities are conducted through a dedicated team of specialist consumer relationship managers along with an extensive network of branches, call centres and ATMs. Customers are also supported by a range of internet and mobile banking solutions. CB works in an integrated way with Business Bank, BTFG and WIB in the sales and service of certain financial services and products including wealth and foreign exchange. The revenue from these products is mostly retained by the product originators.
% Mov't % Mov't
Half Year Half Year Sept 18 - Full Year Full Year Sept 18 -
$m Sept 18 March 18 Mar 18 Sept 18 Sept 17 Sept 17
Net interest income 3,708 4,040 (8) 7,748 7,638 1
Non-interest income 369 377 (2) 746 813 (8)
Net operating income 4,077 4,417 (8) 8,494 8,451 1
Operating expenses (1,812) (1,730) 5 (3,542) (3,378) 5
Core earnings 2,265 2,687 (16) 4,952 5,073 (2)
Impairment charges (218) (233) (6) (451) (565) (20)
Operating profit before tax 2,047 2,454 (17) 4,501 4,508 -
Tax and non-controlling interests (624) (737) (15) (1,361) (1,353) 1
Cash earnings 1,423 1,717 (17) 3,140 3,155 -
Economic profit 835 1,266 (34) 2,101 2,420 (13)
Expense to income ratio 44.44% 39.17% large 41.70% 39.97% 173bps
Net interest margin 2.11% 2.37% (26bps) 2.24% 2.31% (7bps)
As at As at % Mov't As at As at % Mov't
30 Sept 31 March Sept 18 - 30 Sept 30 Sept Sept 18 -
$bn 2018 2018 Mar 18 2018 2017 Sept 17
Deposits
Term deposits 63.9 58.1 10 63.9 57.9 10
Other 142.3 141.3 1 142.3 138.6 3
Total deposits 206.2 199.4 3 206.2 196.5 5
Net loans
Mortgages 373.0 366.0 2 373.0 357.4 4
Other 13.3 13.6 (2) 13.3 13.9 (4)
Provisions (0.9) (0.9) - (0.9) (0.9) -
Total net loans 385.4 378.7 2 385.4 370.4 4
Deposit to loan ratio 53.50% 52.65% 85bps 53.50% 53.05% 45bps
Total assets 392.5 386.0 2 392.5 377.5 4
TCE 448.0 441.1 2 448.0 432.3 4
Average interest-earning assets1 349.8 341.6 2 345.7 330.1 5
As at As at As at As at 30 Sept 31 March 30 Sept 31 March 2018 2018 2017 2017 Credit quality
Impairment charges to average loans annualised2 0.11% 0.12% 0.16% 0.15% Mortgage 90+ day delinquencies 0.75% 0.73% 0.71% 0.72% Other consumer loans 90+ day delinquencies 1.54% 1.65% 1.64% 1.86% Total stressed assets to TCE 0.66% 0.65% 0.64% 0.66%
1 Averages are based on a six month period for the halves and a twelve month period for the full year. 2 The presented ratios are for the halves ended 30 September and 31 March.
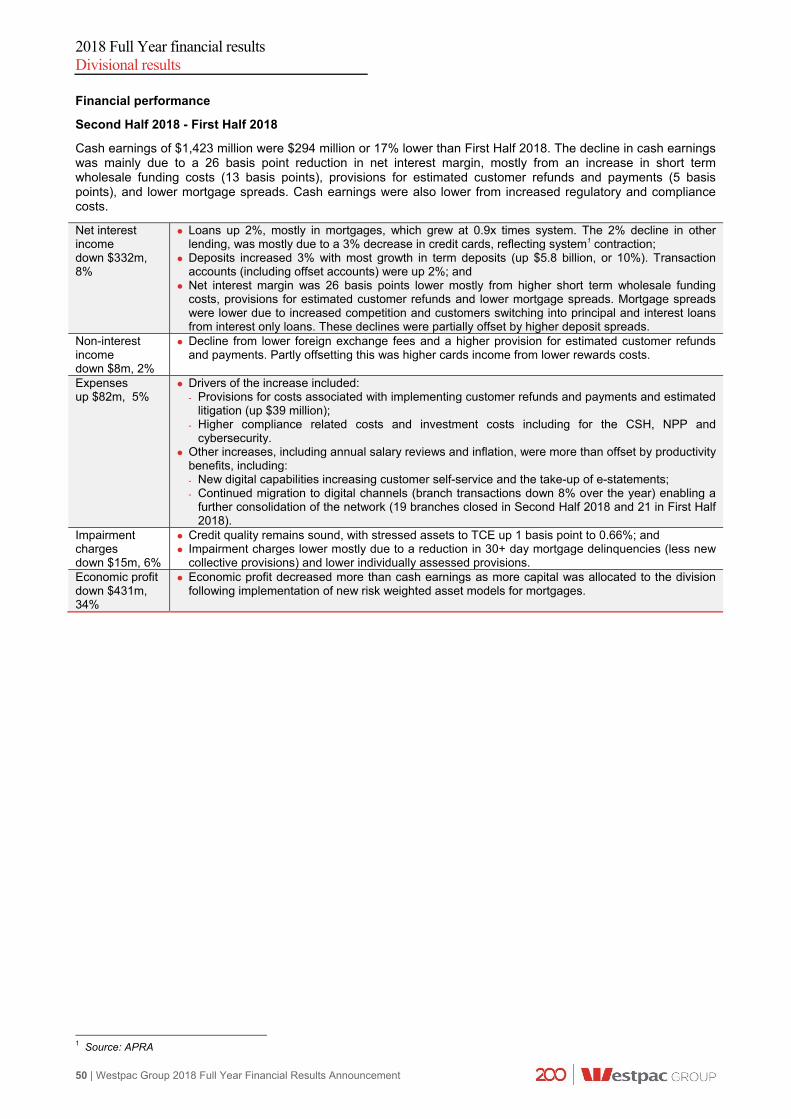
2018 Full Year financial results Divisional results
50 | Westpac Group 2018 Full Year Financial Results Announcement
Financial performance
Second Half 2018 - First Half 2018
Cash earnings of $1,423 million were $294 million or 17% lower than First Half 2018. The decline in cash earnings was mainly due to a 26 basis point reduction in net interest margin, mostly from an increase in short term wholesale funding costs (13 basis points), provisions for estimated customer refunds and payments (5 basis points), and lower mortgage spreads. Cash earnings were also lower from increased regulatory and compliance costs.
Net interest income down $332m, 8%
Loans up 2%, mostly in mortgages, which grew at 0.9x times system. The 2% decline in other lending, was mostly due to a 3% decrease in credit cards, reflecting system1 contraction;
Deposits increased 3% with most growth in term deposits (up $5.8 billion, or 10%). Transaction accounts (including offset accounts) were up 2%; and
Net interest margin was 26 basis points lower mostly from higher short term wholesale funding costs, provisions for estimated customer refunds and lower mortgage spreads. Mortgage spreads were lower due to increased competition and customers switching into principal and interest loans from interest only loans. These declines were partially offset by higher deposit spreads.
Non-interest income down $8m, 2%
Decline from lower foreign exchange fees and a higher provision for estimated customer refunds and payments. Partly offsetting this was higher cards income from lower rewards costs.
Expenses up $82m, 5%
Drivers of the increase included: - Provisions for costs associated with implementing customer refunds and payments and estimated
litigation (up $39 million); - Higher compliance related costs and investment costs including for the CSH, NPP and
cybersecurity. Other increases, including annual salary reviews and inflation, were more than offset by productivity
benefits, including: - New digital capabilities increasing customer self-service and the take-up of e-statements; - Continued migration to digital channels (branch transactions down 8% over the year) enabling a
further consolidation of the network (19 branches closed in Second Half 2018 and 21 in First Half 2018).
Impairment charges down $15m, 6%
Credit quality remains sound, with stressed assets to TCE up 1 basis point to 0.66%; and Impairment charges lower mostly due to a reduction in 30+ day mortgage delinquencies (less new
collective provisions) and lower individually assessed provisions. Economic profit down $431m, 34%
Economic profit decreased more than cash earnings as more capital was allocated to the division following implementation of new risk weighted asset models for mortgages.
1 Source: APRA

2018 Full Year financial results Divisional results
Westpac Group 2018 Full Year Financial Results Announcement | 51
Full Year 2018 – Full Year 2017
Core earnings were 2% lower from a 7 basis point decline in net interest margin, the removal of certain ATM fees, changes in card interchange fees and increased regulatory and compliance costs. A $114 million decline in impairment charges resulted in cash earnings of $3,140 million, down $15 million, over the year.
Net interest income up $110m, 1%
Lending increased 4% mostly in mortgages. Other lending decreased 4% mostly due to a 3% decline in credit cards, which was in line with the decline in the overall system;
A 10% increase in term deposits, and a 5% rise in transaction accounts (including offsets) supported the 5% rise in deposits; and
Net interest margin was down 7 basis points. The decline was due to higher short term wholesale funding costs, the full period impact of the Bank Levy, and higher provisions for estimated customer refunds and payments. The decline was partly offset by higher deposit spreads.
Non-interest income down $67m, 8%
The decline was mostly due to the removal of certain ATM fees and changes to account keeping fees announced in 2017; and
Lower credit card income, mostly from changes in interchange fees, contributed to the fall. Expenses up $164m, 5%
Most of the expense increase was due to: - Provisions for costs associated with implementing customer refunds and payments and estimated
litigation; - Compliance costs (up $61 million) and investment related costs (up $61 million); and - Investment to improve financial crime systems and processes, cyber security and complaints
management. Other cost increases including annual salary reviews and inflationary rises were more than offset by
productivity from: - Digital capabilities increasing customer self-service including take-up of e-statements; - Full period benefit of 45 branches closed in 2017 and 40 branches closed in 2018; and - Benefits from organisation redesign.
Impairment charges down $114m, 20%
Credit quality remains sound. Other consumer delinquencies reduced 10 basis points to 1.54% from improved collections processes; and
Impairment charges were lower from reduced write-offs due to improved collection processes and higher recoveries from the maturing of hardship changes.
Economic profit down $319m, 13%
Additional capital allocated to the division following new risk weighted asset models for mortgages reduced economic profit.

2018 Full Year financial results Divisional results
52 | Westpac Group 2018 Full Year Financial Results Announcement
3.2 Business Bank
Business Bank (BB) is responsible for sales and service to SME and commercial business customers in Australia for facilities up to approximately $150 million. The division operates under the Westpac, St.George, BankSA and Bank of Melbourne brands. Customers are provided with a wide range of banking and financial products and services to support their borrowing, payments and transaction needs. In addition, specialist services are provided for cash flow finance, trade finance, automotive and equipment finance and property finance. The division is also responsible for consumer customers with auto finance loans. BB works in an integrated way with BTFG and WIB in the sales, referral and service of certain financial services and products including corporate superannuation, foreign exchange and interest rate hedging. The revenue from these products is mostly retained by the product originator.
% Mov't % Mov't
Half Year Half Year Sept 18 - Full Year Full Year Sept 18 -
$m Sept 18 March 18 Mar 18 Sept 18 Sept 17 Sept 17
Net interest income 2,044 2,021 1 4,065 3,885 5
Non-interest income 600 589 2 1,189 1,141 4
Net operating income 2,644 2,610 1 5,254 5,026 5
Operating expenses (946) (930) 2 (1,876) (1,818) 3
Core earnings 1,698 1,680 1 3,378 3,208 5
Impairment charges (154) (137) 12 (291) (343) (15)
Operating profit before tax 1,544 1,543 - 3,087 2,865 8
Tax and non-controlling interests (465) (463) - (928) (862) 8
Cash earnings 1,079 1,080 - 2,159 2,003 8
Economic profit 710 717 (1) 1,427 1,300 10
Expense to income ratio 35.78% 35.63% 15bps 35.71% 36.17% (46bps)
Net interest margin 2.76% 2.78% (2bps) 2.77% 2.72% 5bps
As at As at % Mov't As at As at % Mov't
30 Sept 31 March Sept 18 - 30 Sept 30 Sept Sept 18 -
$bn 2018 2018 Mar 18 2018 2017 Sept 17
Deposits
Term deposits 46.8 45.0 4 46.8 43.7 7
Other 64.0 63.3 1 64.0 63.3 1
Total deposits 110.8 108.3 2 110.8 107.0 4
Net loans
Mortgages 54.9 54.7 - 54.9 53.9 2
Business 90.6 89.5 1 90.6 87.9 3
Other 8.3 8.6 (3) 8.3 8.7 (5)
Provisions (1.1) (1.1) - (1.1) (1.1) -
Total net loans 152.7 151.7 1 152.7 149.4 2
Deposit to loan ratio 72.56% 71.39% 117bps 72.56% 71.62% 94bps
Total assets 156.5 155.0 1 156.5 153.1 2
TCE 199.2 199.8 - 199.2 199.1 -
Average interest-earning assets1 147.8 145.8 1 146.8 142.8 3
As at As at As at As at
30 Sept 31 March 30 Sept 31 March
2018 2018 2017 2017
Credit quality
Impairment charges to average loans annualised2 0.20% 0.18% 0.19% 0.27%
Mortgage 90+ day delinquencies 0.71% 0.64% 0.60% 0.55%
Other consumer loans 90+ day delinquencies 2.02% 1.81% 1.68% 1.32%
Business: impaired assets to TCE 0.48% 0.48% 0.47% 0.63%
Total stressed assets to TCE 2.71% 2.48% 2.13% 2.29%
1 Averages are based on a six month period for the halves and a twelve month period for the full year. 2 The presented ratios are for the halves ended 30 September and 31 March.

2018 Full Year financial results Divisional results
Westpac Group 2018 Full Year Financial Results Announcement | 53
Financial performance
Second Half 2018 - First Half 2018
Core earnings increased 1% supported by 1% loan growth and increased fee revenue. Impairment charges increased $17 million over the half resulting in flat cash earnings over Second Half 2018 (down $1 million). The higher impairment charge principally relates to a small number of Commercial exposures migrating to stressed risk grades through the half.
Net interest income up $23m, 1%
Loans increased 1% with most of the growth across a range of industries and in equipment finance. Mortgage lending was little changed from a slowdown in investment lending while auto finance decreased;
Deposits increased 2%, fully funding loan growth over the half. Most of the growth was in transaction accounts and term deposits; and
Net interest margin 2 basis points lower, mostly driven by the reduction in the proportion of higher spread interest only mortgages and higher short term wholesale funding costs. Competition in business lending has also remained high. This was partly offset by increased term deposit spreads.
Non-interest income up $11m, 2%
Higher business line fees from a combination of portfolio growth and pricing for facilities including unused limits.
Expenses up $16m, 2%
Most of the increase was due to higher investment related costs and higher regulatory and compliance costs; and
Other cost increases have been largely offset by productivity from: - Changes to the way the division engages with customers including better alignment of customers
to industry specialists and SME bankers, along with changes to operational support provided to bankers; and
- Additional functionality in credit risk management (Optimist), and loan origination (LOLA) platforms and extending their use across more bankers.
Impairment charges up $17m, 12%
The level of stressed assets to TCE increased 23 basis points to 2.71% from 2.48% from Commercial customers in the property and health sectors;
Auto finance delinquencies were higher, mostly due to an operational delay in the write-off of defaulted loans; and
Impairment charges were higher, mostly from the rise in stressed commercial facilities partially offset by lower auto finance write-offs.
Economic profit down $7m, 1%
Economic profit decreased reflecting flat cash earnings and higher allocated capital (up 1%), in line with asset growth.
Full Year 2018 – Full Year 2017
Cash earnings increased 8% ($156 million), compared to Full Year 2017 from core earnings growth of 5% and a 15% decline in impairment charges. The result was supported by increased fee income and higher margins.
Net interest income up $180m, 5%
Lending growth of 2% was supported by diversified growth across industries including property, agriculture and manufacturing and in equipment finance. Mortgage growth slowed through the year as demand for investment lending slowed;
The 7% increase in term deposits, and 5% higher transaction balances supported the 4% increase in deposits; and
Net interest margin was up 5 basis points from repricing of certain mortgages types in the second half of 2017 and higher deposits spreads. These were partly offset by the full period impact of the Bank Levy (5 basis points).
Non-interest income up $48m, 4%
Higher business line fees from portfolio growth and pricing for facilities, including unused limits.
Expenses up $58m, 3%
Most of the increase was due to higher investment related costs and regulatory and compliance costs;
Increases from other costs were largely offset by productivity benefits from: - Improved banker coverage and support structures; - Better alignment of customers to bankers across SME and industries; and - Process improvements from the extension of LOLA, improved online functionality and
standardising risk reviews. Impairment charges down $52m, 15%
The level of stressed assets to TCE increased 58 basis points to 2.71% from 2.13%. Most of the increase was from Commercial customers moving into stressed risk grades; and
Impairment charges benefited from lower credit card and auto write-offs.
Economic profit up $127m, 10%
Economic profit increased 10%, with cash earnings growing 8% and capital increasing 6% as capital allocated benefited from optimisation of facility limits and loans under offer.

2018 Full Year financial results Divisional results
54 | Westpac Group 2018 Full Year Financial Results Announcement
3.3 BT Financial Group (Australia)
BT Financial Group (Australia) (BTFG) is the Australian wealth management and insurance arm of the Westpac Group providing a broad range of associated services. BTFG’s funds management operations include the manufacturing and distribution of investment, superannuation and retirement products, wealth administration platforms, private wealth, margin lending and equities broking. BTFG’s insurance business covers the manufacturing and distribution of life, general and lenders mortgage insurance. The division also uses a third party to manufacture certain general insurance products. In managing risk across all insurance classes the division reinsures certain risks using external providers. In addition to the BT brand, BTFG operates a range of financial service brands along with the banking brands of Westpac, St.George, Bank of Melbourne and BankSA for Private Wealth and Insurance.
% Mov't % Mov't
Half Year Half Year Sept 18 - Full Year Full Year Sept 18 -
$m Sept 18 March 18 Mar 18 Sept 18 Sept 17 Sept 17
Net interest income 293 285 3 578 511 13
Non-interest income 750 898 (16) 1,648 1,744 (6)
Net operating income 1,043 1,183 (12) 2,226 2,255 (1)
Operating expenses (690) (601) 15 (1,291) (1,199) 8
Core earnings 353 582 (39) 935 1,056 (11)
Impairment charges (3) (3) - (6) (4) 50
Operating profit before tax 350 579 (40) 929 1,052 (12)
Tax and non-controlling interests (109) (175) (38) (284) (316) (10)
Cash earnings 241 404 (40) 645 736 (12)
Economic profit 117 332 (65) 449 565 (21)
Expense to income ratio 66.16% 50.80% large 58.00% 53.17% large
Income on invested capital1 33 25 32 58 66 (12)
As at As at % Mov't As at As at % Mov't
30 Sept 31 March Sept 18 - 30 Sept 30 Sept Sept 18 -
$bn 2018 2018 Mar 18 2018 2017 Sept 17
Deposits 33.0 31.7 4 33.0 30.7 7
Net loans
Loans 21.0 20.8 1 21.0 20.1 4
Provisions - - - - - -
Total net loans 21.0 20.8 1 21.0 20.1 4
Deposit to loan ratio 157.14% 152.40% large 157.14% 152.74% large
Total funds 205.6 197.7 4 205.6 191.4 7
Average funds2 205.2 198.2 4 201.7 188.0 7
Cash earnings % Mov't % Mov't
Half Year Half Year Sept 18 - Full Year Full Year Sept 18 -
$m Sept 18 March 18 Mar 18 Sept 18 Sept 17 Sept 17
Funds Management business 74 253 (71) 327 413 (21)
Insurance 145 133 9 278 290 (4)
Total Funds Management and Insurance 219 386 (43) 605 703 (14)
Capital and other 22 18 22 40 33 21
Total cash earnings 241 404 (40) 645 736 (12)
1 Income on Invested Capital represents revenue generated from investing BTFG’s capital balances (required for regulatory purposes). 2 Averages are based on a six month period for the halves and a twelve month period for the full year.

2018 Full Year financial results Divisional results
Westpac Group 2018 Full Year Financial Results Announcement | 55
Financial performance1
Second Half 2018 - First Half 2018
Cash earnings of $241 million was 40% (or $163 million) lower than First Half 2018 with performance impacted by increased provisions for estimated customer refunds and payments, and costs associated with these matters ($141 million, net of tax). Excluding these provisions, cash earnings were $22 million down with lower activity in funds management partially offset by a higher Insurance contribution.
Net interest income up $8m, 3%
Growth in Private Wealth was the main contributor to the increase with deposits up 4% mostly in term deposits; and
Net interest margin was 2 basis points lower, mostly from higher short term wholesale funding costs, partly offset by higher deposit spreads.
Non-interest income down $148m, 16%
Funds Management contribution was down $182 million (or 29%): - Provisions for customer refunds and payments ($140 million); - Revaluation of investment in boutique funds and lower seed pool performance ($20 million); - Lower advice income, mostly from reduced activity ($10 million); - Lower funds related revenue from lower margins from repricing and product mix changes, partly
offset by a 4% increase in funds to $205.6 billion; and - Panorama has seen funds on the platform rise by around 32% to $12.4 billion. These gains have
been partially offset by net outflows on legacy platforms. Insurance income was $26 million or (11%) higher:
- General insurance was $34 million higher, mostly from lower claims across both major weather events and working claims. First Half 2018 included a number of major weather events (Victoria hailstorms, Cyclone Marcus, and bushfires in NSW and Victoria);
- Life insurance was flat on First Half 2018 with an increase in earned premiums offset by higher claims; and
- Partly offsetting this was increased provisions for estimated customer refunds and payments ($6 million) and a lower contribution from LMI ($3 million) from a reduction in new high LVR loans.
Return on capital increased $8 million due to a higher investment contribution. Expenses up $89m, 15%
Increased expenses due to: - Provision for costs associated with implementing customer refunds and payments ($55 million); - Higher regulatory and compliance costs ($17 million); - Higher costs associated with removal of grandfathered commissions across a number of systems
and the implementation of BT Open Services (the new online advisor hub); and - Productivity savings offset seasonally higher expenses in the second half of the year from end of
financial year processing. Economic profit down $215m, 65%
The decline in economic profit is consistent with decline in cash earnings.
1 On 28 September 2018, Westpac entered an agreement with Generation Development Group Limited (GDG) under which GDG will
invest in Ascalon Capital Manager and become its ultimate owner. Completion is expected to occur by March 2019.

2018 Full Year financial results Divisional results
56 | Westpac Group 2018 Full Year Financial Results Announcement
Full Year 2018 – Full Year 2017
Cash earnings were 12% lower ($91 million) than Full Year 2017 impacted by additional provisions for estimated customer refunds and payments and associated costs. Excluding these items, performance was down 1% over the year. Disciplined balance sheet growth, and lower weather related insurance claims were offset by a lower Advice contribution, fund margin compression and higher life insurance claims.
Net interest income up $67m, 13%
The 4% increase in lending was mostly in mortgages in Private Wealth. Deposits increased 7%, supported by an increase in term deposits, as customers looked for yield; and
Net interest margin was up 20 basis points due to disciplined margin management combined with repricing of certain mortgage types and term deposits. This was partly offset by the full period impact of the Bank Levy (an increase of $15 million).
Non-interest income down $96m, 6%
Funds Management contribution was down $103 million (or 9%): - Increase in provisions for estimated customer refunds and payments ($57 million); - Lower advice income, mostly from reduced activity ($37 million); - Contribution from Pendal (previously BT Investment Management) was $17 million lower,
following the further sale of shares in Pendal in May 2017; - Partly offset by a reduced revaluation loss from investments in boutique funds ($22 million) and
higher seed pool performance ($5 million); - Funds related revenue was also higher, ($10 million) from a 7% growth in funds, partly offset by
lower margins from repricing and product mix changes; and - Panorama has seen funds on the platform increased from $6.7 billion to $12.4 billion (up 85%).
These gains have been partially offset by net outflows on legacy platforms. Insurance income was $13 million or, 3%, higher:
- General insurance was $29 million higher, mostly from lower claims for major weather events; - Life insurance was $8 million higher from an increase in in-force premiums relating to Group
Insurance for BTFG Corporate Super. These gains were partly offset by higher claims and lapses; and
- Provisions for estimated customer refunds and payments reduced insurance income by $6 million;
- LMI contribution was lower ($17 million) from a reduction in loans originated with an LVR >90%. Return on capital decreased $6 million mostly due to higher hedging costs.
Expenses up $92m, 8%
Increase mostly due to: - Provisions for the costs associated with customer refunds and payments ($55 million); - Investment costs ($44 million) from the roll-out of additional functionality in Panorama, the
implementation of BT Open Services and removing grandfathered commissions across systems; Regulatory costs were lower due to the completion of the MySuper migration and FoFA (Future of
Financial Advice); and Productivity savings largely offset other costs increases, including annual salary reviews, property
and technology related spending. Economic profit down $116m, 21%
The decline in economic profit is consistent with decline in cash earnings.
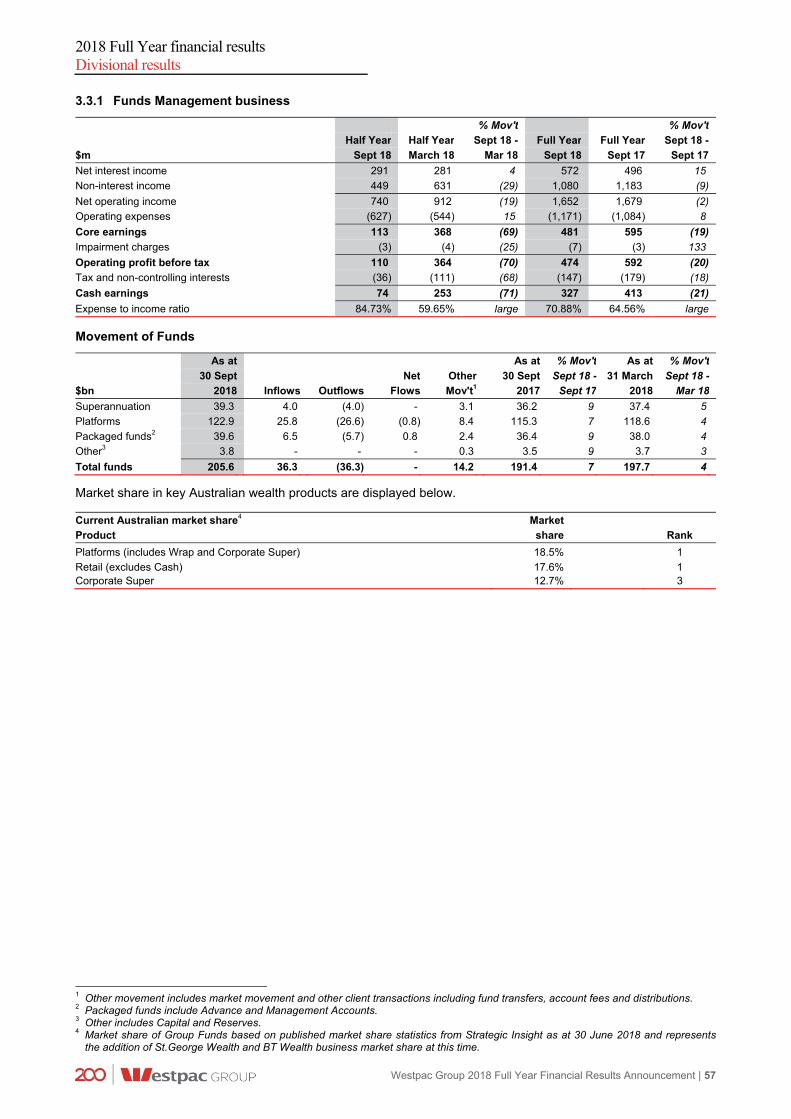
2018 Full Year financial results Divisional results
Westpac Group 2018 Full Year Financial Results Announcement | 57
3.3.1 Funds Management business
% Mov't % Mov't
Half Year Half Year Sept 18 - Full Year Full Year Sept 18 -
$m Sept 18 March 18 Mar 18 Sept 18 Sept 17 Sept 17
Net interest income 291 281 4 572 496 15
Non-interest income 449 631 (29) 1,080 1,183 (9)
Net operating income 740 912 (19) 1,652 1,679 (2)
Operating expenses (627) (544) 15 (1,171) (1,084) 8
Core earnings 113 368 (69) 481 595 (19)
Impairment charges (3) (4) (25) (7) (3) 133
Operating profit before tax 110 364 (70) 474 592 (20)
Tax and non-controlling interests (36) (111) (68) (147) (179) (18)
Cash earnings 74 253 (71) 327 413 (21)
Expense to income ratio 84.73% 59.65% large 70.88% 64.56% large
Movement of Funds
As at As at % Mov't As at % Mov't
30 Sept Net Other 30 Sept Sept 18 - 31 March Sept 18 -
$bn 2018 Inflows Outflows Flows Mov't1 2017 Sept 17 2018 Mar 18
Superannuation 39.3 4.0 (4.0) - 3.1 36.2 9 37.4 5
Platforms 122.9 25.8 (26.6) (0.8) 8.4 115.3 7 118.6 4
Packaged funds2 39.6 6.5 (5.7) 0.8 2.4 36.4 9 38.0 4
Other3 3.8 - - - 0.3 3.5 9 3.7 3
Total funds 205.6 36.3 (36.3) - 14.2 191.4 7 197.7 4
Market share in key Australian wealth products are displayed below. Current Australian market share4 Market
Product share Rank
Platforms (includes Wrap and Corporate Super) 18.5% 1
Retail (excludes Cash) 17.6% 1 Corporate Super 12.7% 3
1 Other movement includes market movement and other client transactions including fund transfers, account fees and distributions. 2 Packaged funds include Advance and Management Accounts. 3 Other includes Capital and Reserves. 4 Market share of Group Funds based on published market share statistics from Strategic Insight as at 30 June 2018 and represents
the addition of St.George Wealth and BT Wealth business market share at this time.

2018 Full Year financial results Divisional results
58 | Westpac Group 2018 Full Year Financial Results Announcement
3.3.2 Insurance business
The Insurance business result includes the Westpac and St.George Life Insurance, General Insurance and Lenders Mortgage Insurance (LMI) businesses.
% Mov't % Mov't
Half Year Half Year Sept 18 - Full Year Full Year Sept 18 -
$m Sept 18 March 18 Mar 18 Sept 18 Sept 17 Sept 17
Net interest income 2 3 (33) 5 10 (50) Non-interest income 269 243 11 512 499 3 Net operating income 271 246 10 517 509 2 Operating expenses (60) (55) 9 (115) (99) 16 Core earnings 211 191 10 402 410 (2) Impairment (charges) / benefits - - - - - - Operating profit before tax 211 191 10 402 410 (2) Tax and non-controlling interests (66) (58) 14 (124) (120) 3 Cash earnings 145 133 9 278 290 (4) Expense to income ratio 22.14% 22.36% (22bps) 22.24% 19.45% 279bps Cash earnings % Mov't % Mov't
Half Year Half Year Sept 18 - Full Year Full Year Sept 18 -
$m Sept 18 March 18 Mar 18 Sept 18 Sept 17 Sept 17
Life Insurance 71 75 (5) 146 160 (9) General Insurance 62 43 44 105 91 15 Lenders Mortgage Insurance 12 15 (20) 27 39 (31) Total cash earnings 145 133 9 278 290 (4)
Insurance key metrics Life Insurance in-force premiums % Mov't % Mov't
Half Year Half Year Sept 18 - Full Year Full Year Sept 18 -
$m Sept 18 March 18 Mar 18 Sept 18 Sept 17 Sept 17
Life Insurance in-force premiums at start of period 1,276 1,068 19 1,068 973 10 Sales / New Business1 80 283 (72) 363 234 55 Lapses (79) (75) 5 (154) (139) 11 Life Insurance in-force premiums at end of period2 1,277 1,276 - 1,277 1,068 20 Claims ratios3 for Insurance Business % Mov't % Mov't
Half Year Half Year Sept 18 - Full Year Full Year Sept 18 -
(%) Sept 18 March 18 Mar 18 Sept 18 Sept 17 Sept 17
Life Insurance 42 44 (5) 43 37 16 General Insurance 37 54 (31) 46 53 (13) Lenders Mortgage Insurance 11 20 (45) 16 17 (6) Gross written premiums % Mov't % Mov't
Half Year Half Year Sept 18 - Full Year Full Year Sept 18 -
$m Sept 18 March 18 Mar 18 Sept 18 Sept 17 Sept 17
General Insurance gross written premium 252 251 - 503 508 (1) Lenders Mortgage Insurance gross written premium4 90 90 - 180 250 (28)
1 Full Year 2017 includes a methodology change for the calculation of premium discounts, creating a one-off increase of $32 million.
This has no impact on earned premiums. Sales/New Business for Full Year 2018 includes $203 million from Group Life insurance for BTFG Corporate Super.
2 As at 1 January 2018, Westpac Life Insurance Services Limited became the preferred insurer for BTFG Corporate Superannuation members. The life insurance in-force premium as at 30 September 2018 consists of $994 million retail, $283 million Group Life Insurance. (31 March 2018: $1 billion retail, $276 million Group Life insurance; 30 September 2017: $993 million retail, $75 million Group Life Insurances).
3 Claims ratios are claims over earned premium plus reinsurance rebate. The lenders mortgage insurance claims ratios have been calculated to include exchange commission.
4 LMI gross written premium includes loans >90% LVR reinsured with Arch Reinsurance Limited. Full Year 2018 gross written premiums includes $123 million from the arrangement (Second Half 2018: $61 million; First Half 2018 $62 million).

2018 Full Year financial results Divisional results
Westpac Group 2018 Full Year Financial Results Announcement | 59
3.4 Westpac Institutional Bank
Westpac Institutional Bank (WIB) delivers a broad range of financial products and services to commercial, corporate, institutional and government customers with connections to Australia and New Zealand. WIB operates through dedicated industry relationship and specialist product teams, with expert knowledge in financing, transactional banking, and financial and debt capital markets. Customers are supported throughout Australia as well as via branches and subsidiaries located in New Zealand, the US, UK and Asia. WIB is also responsible for Westpac Pacific currently providing a range of banking services in Fiji and PNG. WIB works in an integrated way with all the Group’s divisions in the provision of more complex financial needs including across foreign exchange and fixed interest solutions.
% Mov't % Mov't
Half Year Half Year Sept 18 - Full Year Full Year Sept 18 -
$m Sept 18 March 18 Mar 18 Sept 18 Sept 17 Sept 17
Net interest income 741 675 10 1,416 1,328 7
Non-interest income 807 749 8 1,556 1,707 (9)
Net operating income 1,548 1,424 9 2,972 3,035 (2)
Operating expenses (771) (675) 14 (1,446) (1,351) 7
Core earnings 777 749 4 1,526 1,684 (9)
Impairment (charges) / benefits 21 17 24 38 (56) large
Operating profit before tax 798 766 4 1,564 1,628 (4)
Tax and non-controlling interests (263) (215) 22 (478) (469) 2
Cash earnings 535 551 (3) 1,086 1,159 (6)
Economic profit 254 224 13 478 467 2
Expense to income ratio 49.81% 47.40% 241bps 48.65% 44.51% large
Net interest margin 1.72% 1.58% 14bps 1.65% 1.59% 6bps
As at As at % Mov't As at As at % Mov't
30 Sept 31 March Sept 18 - 30 Sept 30 Sept Sept 18 -
$bn 2018 2018 Mar 18 2018 2017 Sept 17
Deposits 104.8 98.9 6 104.8 92.1 14
Net loans
Loans 77.5 76.4 1 77.5 74.4 4
Provisions (0.3) (0.3) - (0.3) (0.3) -
Total net loans 77.2 76.1 1 77.2 74.1 4
Deposit to loan ratio 135.75% 129.96% large 135.75% 124.29% large
Total assets 102.4 104.8 (2) 102.4 103.1 (1)
TCE 262.1 251.2 4 262.1 249.1 5
Average interest-earning assets1 86.0 85.9 - 86.0 83.6 3
Impairment charges/(benefits) to average
loans annualised (0.05%) (0.05%) - (0.05%) 0.08% (13bps)
Impaired assets to TCE 0.02% 0.04% (2bps) 0.02% 0.07% (5bps)
Total stressed assets to TCE 0.44% 0.52% (8bps) 0.44% 0.55% (11bps)
Total funds - 6.6 (100) - 12.5 (100)
Revenue contribution
% Mov't % Mov't
Half Year Half Year Sept 18 - Full Year Full Year Sept 18 -
$m Sept 18 March 18 Mar 18 Sept 18 Sept 17 Sept 17
Lending and deposit revenue 844 790 7 1,634 1,549 5
Markets, sales and fee income 439 451 (3) 890 951 (6)
Total customer revenue 1,283 1,241 3 2,524 2,500 1
Derivative valuation adjustments 14 - - 14 46 (70)
Trading revenue 60 161 (63) 221 317 (30)
Hastings 180 23 large 203 93 118
Other2 11 (1) large 10 79 (87)
Total WIB revenue 1,548 1,424 9 2,972 3,035 (2)
1 Averages are based on a six month period for the halves and a twelve month period for the full year. 2 Includes capital benefit and the Bank Levy.

2018 Full Year financial results Divisional results
60 | Westpac Group 2018 Full Year Financial Results Announcement
Financial performance
Second Half 2018 - First Half 2018
Cash earnings were $16 million or 3% lower than First Half 2018, mostly driven by lower markets income partly offset by a 14 basis point rise in net interest margin. During Second Half 2018 the exit of the Hastings business increased both revenue and expenses (and contributed to a higher tax rate). Hastings contributed $19 million in cash earnings in the half.
Net interest income up $66m, 10%
Loans up 1%, from higher utilisation of mortgage warehouse facilities, following a run down in balances in First Half 2018;
Deposits up 6%, from higher Australian transaction balances; and Net interest margin up 14 basis points, from higher margins on transaction deposits and reduced
wholesale funding requirements. Non-interest income up $58m, 8%
Hastings contribution up $157 million primarily from income associated with the exit of the business and higher performance fees, which typically occur in second half; and
Excluding Hastings, other non-interest income was down $99 million from a decline in trading revenue across commodities and foreign exchange.
Expenses up $96m, 14%
Hastings expenses were up $84 million, from goodwill write-off and restructuring costs from the exit of the business; and
Excluding Hastings, operating expenses were up $12 million or 2% from increased technology and regulatory and compliance expenses.
Impairment benefit up $4m, 24%
Credit quality remained sound, with both stressed and impaired assets to TCE decreasing over the half; and
The impairment benefit reflects no new large impaired assets emerging over the period. Economic profit up $30m, 13%
Economic profit increased as disciplined management of credit limits and improving credit quality reduced allocated capital; and
Economic profit was also supported by higher franking benefit due to the higher effective tax rate associated with the non-deductibility of the goodwill write-off.
Full Year 2018 – Full Year 2017
Cash earnings were $73 million or 6% lower than Full Year 2017 mostly due to lower markets revenue. The decline was partially offset by higher margins and an impairment benefit. In Full Year 2018 the division exited the Hastings business which lifted both revenues and expenses (and contributed to a higher tax rate) but had little impact on cash earnings.
Net interest income up $88m, 7%
Lending was up 4%, from increased utilisation of mortgage warehouse facilities and a fall in the A$ lifting Asia trade finance and loan balances;
Deposits increased 14% from higher Australian transaction balances and term deposits. Asia term deposits also increased due to foreign exchange translation impacts and to support lending in that region; and
Net interest margin was up 6 basis points, from higher transaction deposit margins and reduced wholesale funding costs. This was partially offset by the full period impact of the Bank Levy (5 basis points).
Non-interest income down $151m, 9%
Hastings contribution up $110 million, mainly from income associated with the exit of Hastings business;
Excluding Hastings, non-interest income was down $261 million, or 16%, primarily from the non-repeat of several large infrastructure transactions and lower markets revenue in fixed income sales and trading; and
Fee income was also lower from increased utilisation of existing credit limits. Expenses up $95m, 7%
Hastings expenses up $87 million, from goodwill write-off and restructuring costs associated with the exit of the business; and
Excluding Hastings, operating expenses were up $8 million, or 1%, due to higher technology, regulatory and compliance expenses.
Impairment charge positive movement of $94m
Stressed and impaired assets to TCE decreased over the year to near historical lows; and The movement in impairment charges was due to the absence of any large downgrade over the
year.
Economic profit up $11m, 2%
Disciplined balance sheet management and a reduction in capital allocated to certain institutional facilities reduced allocated capital;
Higher effective tax rate (from non-deductible nature of the goodwill write-off) increased the franking benefit; and
These benefits more than offset the lower cash earnings contribution.

2018 Full Year financial results Divisional results
Westpac Group 2018 Full Year Financial Results Announcement | 61
Hastings1
During 2018 the Hastings business was exited. The business contributed $17 million to cash earnings in Full Year 2018.
Full Year Full Year
$m Sept 17 Sept 18
Net operating income1 94 204
Operating expenses (71) (158)
Tax and non-controlling interests (9) (29)
Cash earnings 14 17
1 Includes capital benefit.

2018 Full Year financial results Divisional results
62 | Westpac Group 2018 Full Year Financial Results Announcement
3.5 Westpac New Zealand
Westpac New Zealand is responsible for sales and service of banking, wealth and insurance products for consumers, business and institutional customers in New Zealand. Westpac conducts its New Zealand banking business through two banks in New Zealand: Westpac New Zealand Limited, which is incorporated in New Zealand and Westpac Banking Corporation (New Zealand Branch), which is incorporated in Australia. Westpac New Zealand operates via an extensive network of branches and ATMs across both the North and South Islands. Business and institutional customers are also served through relationship and specialist product teams. Banking products are provided under the Westpac brand while insurance and wealth products are provided under Westpac Life and BT brands, respectively. New Zealand also maintains its own infrastructure, including technology, operations and treasury.
% Mov't % Mov't
Half Year Half Year Sept 18 - Full Year Full Year Sept 18 -
NZ$m Sept 18 March 18 Mar 18 Sept 18 Sept 17 Sept 17
Net interest income 950 922 3 1,872 1,738 8
Non-interest income 233 244 (5) 477 511 (7)
Net operating income 1,183 1,166 1 2,349 2,249 4
Operating expenses (468) (468) - (936) (962) (3)
Core earnings 715 698 2 1,413 1,287 10
Impairment (charges) / benefits 24 (27) large (3) 76 large
Operating profit before tax 739 671 10 1,410 1,363 3
Tax and non-controlling interests (204) (189) 8 (393) (392) -
Cash earnings 535 482 11 1,017 971 5
Economic profit 253 207 22 460 431 7
Expense to income ratio 39.56% 40.14% (58bps) 39.85% 42.77% (292bps)
Net interest margin 2.16% 2.15% 1bps 2.15% 2.03% 12bps
As at As at % Mov't As at As at % Mov't
30 Sept 31 March Sept 18 - 30 Sept 30 Sept Sept 18 -
NZ$bn 2018 2018 Mar 18 2018 2017 Sept 17
Deposits
Term deposits 32.6 31.6 3 32.6 30.0 9
Other 29.3 30.0 (2) 29.3 28.4 3
Total deposits1 61.9 61.6 - 61.9 58.4 6
Net loans
Mortgages 48.9 47.9 2 48.9 46.9 4
Business 29.8 29.5 1 29.8 28.6 4
Other 2.0 2.1 (5) 2.0 2.2 (9)
Provisions (0.3) (0.4) (25) (0.3) (0.4) (25)
Total net loans 80.4 79.1 2 80.4 77.3 4
Deposit to loan ratio 76.99% 77.88% (89bps) 76.99% 75.55% 144bps
Total assets 90.0 89.8 - 90.0 88.3 2
TCE 112.0 111.7 - 112.0 108.8 3
Third party liquid assets 7.5 8.6 (13) 7.5 8.7 (14)
Average interest-earning assets2 87.9 86.0 2 87.0 85.8 1
Total funds 10.7 10.3 4 10.7 10.1 6
As at As at As at As at
30 Sept 31 March 30 Sept 31 March
2018 2018 2017 2017
Credit quality
Impairment charges/(benefits) to average loans annualised3 (0.06%) 0.07% (0.10%) (0.09%)
Mortgage 90+ day delinquencies 0.11% 0.16% 0.12% 0.14%
Other consumer loans 90+ day delinquencies 0.62% 0.86% 0.57% 0.58%
Impaired assets to TCE 0.15% 0.21% 0.18% 0.20%
Total stressed assets to TCE 1.57% 1.86% 2.06% 2.41%
1 Total deposits in this table refer to total customer deposits. 2 Averages are based on a six month period for the halves and a twelve month period for the full year. 3 The presented ratios are for the halves ended 30 September and 31 March.

2018 Full Year financial results Divisional results
Westpac Group 2018 Full Year Financial Results Announcement | 63
Financial performance (NZ$)
Second Half 2018 – First Half 2018
Core earnings increased 2% over the half supported by a 1 basis point increase in net interest margin partly offset by lower non-interest income. A $51 million turnaround in impairments (a $24 million benefit compared to a $27 million charge in First Half 2018), supported the 11% increase in cash earnings.
Net interest income up $28m, 3%
Loans were up 2%, mostly from mortgages. Growth was below system for the half (mortgage growth 0.7 times system1) as the division balanced return with growth;
Deposits were little changed over the half with growth in term deposits offset by a decline in business deposits. The business focused on retail consumer deposits, with household deposits growing at 1.1 times system1; and
Net interest margin was up 1 basis point from higher mortgage and business spreads partly offset by lower deposit spreads.
Non-interest income down $11m, 5%
Decline was primarily due to the removal of certain consumer fees (including some ATM fees); and Partly offset by higher investment income from a 4% rise in fund balances, an increase in financial
markets income, and higher business fees. Expenses flat
Productivity from the division's transformation program, including lower network costs, increased self-service and digitising more activity, offset increases in business as usual expenses; and
Project spend associated with the transformation program was lower and this offset higher regulatory and compliance costs.
Impairment benefit of $24m compared to an impairment charge of $27m
Credit quality improved with stressed assets to TCE reducing 29 basis points to 1.57%. The decline was mostly due to the continued improvement in the dairy sector. Other consumer delinquencies decreased 24 basis points to 0.62%, mostly from the resolution of an operational issue in collections; and
Impairment charges benefited from the write-back and recovery of some facilities and a benefit for provisions no longer required for the New Zealand dairy overlay.
Economic profit up $46m, 22%
Economic profit increased 22%, with cash earnings growing 11% and allocated capital increasing 2% in line with lending growth.
Full Year 2018 – Full Year 2017
Core earnings increased 10% over the year supported by a 12 basis point increase in net interest margin, and a 3% decline in expenses, partly offset by lower non-interest income. Cash earnings growth was up 5% as Full Year 2018 recorded an impairment charge of $3 million compared to an impairment benefit in Full Year 2017.
Net interest income up $134m, 8%
Loans increased $3.1 billion (4%), with the majority ($2.0 billion) in mortgages. Business growth of $1.2 billion, was across a broad range of sectors. Overall consumer lending was below system as the division balanced return with growth;
Deposits increased $3.5 billion, more than funding loan growth over the year, and resulting in the deposit to loan ratio increasing 144 basis points to 77.0%. Most deposit growth was in term products as customers sought higher yields; and
Net interest margin was 12 basis points higher from increased mortgage and business lending spreads, partly offset by lower deposit spreads.
Non-interest income down $34m, 7%
Decline was driven by lower cards income, product simplification (reducing some fees on existing accounts), and customer migration to lower/no fee digital channels; and
Higher investment income from a 6% rise in funds and higher merchant and business lending fees, partly offset these declines.
Expenses down $26m, 3%
Benefits from the transformation program include a reduction in branch numbers (down 6 over the year), lower FTE, and increased self-service from digitisation;
Project costs associated with the transformation program were also lower; and Partly offsetting these benefits were increased risk management and regulatory costs and higher
costs from annual salary reviews and inflation. Impairment charge of $3m compared to an impairment benefit of $76m
Credit quality improved with stressed assets to TCE reducing 49 basis points to 1.57%. The decline was mostly due to the continued improvement in the dairy sector. Consumer 90+ day delinquencies remain near historic lows; and
Impairment charges were higher due to the non-repeat of write-backs of some large facilities and improvement in the dairy industry across Full Year 2017.
Economic profit up $29m, 7%
Growth was broadly in line with the rise in cash earnings of 5%.
.
1 RBNZ data: five months April–August 2018.

2018 Full Year financial results Divisional results
64 | Westpac Group 2018 Full Year Financial Results Announcement
3.6 Group Businesses
This segment comprises:
Treasury, which is responsible for the management of the Group’s balance sheet including wholesale funding, capital and management of liquidity. Treasury also manages the interest rate risk and foreign exchange risks inherent in the balance sheet, including managing the mismatch between Group assets and liabilities. Treasury’s earnings are primarily sourced from managing the Group’s balance sheet and interest rate risk (excluding Westpac New Zealand) within set risk limits;
Group Technology1, which comprises functions for the Australian businesses, is responsible for technology strategy and architecture, infrastructure and operations, applications development and business integration;
Core Support2, which comprises functions performed centrally, including Australian banking operations, property services, strategy, finance, risk, compliance, legal, human resources and customer and corporate relations; and
Group Businesses also includes earnings on capital not allocated to divisions, certain intra-group transactions that facilitate presentation of performance of the Group’s operating segments, earnings from non-core asset sales, earnings and costs associated with the Group’s Fintech investments, and certain other head office items such as centrally raised provisions.
% Mov't % Mov't
Half Year Half Year Sept 18 - Full Year Full Year Sept 18 -
$m Sept 18 March 18 Mar 18 Sept 18 Sept 17 Sept 17
Net interest income 375 437 (14) 812 713 14
Non-interest income 22 13 69 35 (33) large
Net operating income 397 450 (12) 847 680 25
Operating expenses (282) (289) (2) (571) (456) 25
Core earnings 115 161 (29) 276 224 23
Impairment (charges) / benefits 15 (13) large 2 43 (95)
Operating profit before tax 130 148 (12) 278 267 4
Tax and non-controlling interests (87) (90) (3) (177) (175) 1
Cash earnings 43 58 (26) 101 92 10
Treasury % Mov't % Mov't
Half Year Half Year Sept 18 - Full Year Full Year Sept 18 -
$m Sept 18 March 18 Mar 18 Sept 18 Sept 17 Sept 17
Net interest income 331 406 (18) 737 675 9
Non-interest income 4 6 (33) 10 8 25
Net operating income 335 412 (19) 747 683 9
Cash earnings 211 269 (22) 480 436 10
Treasury Value at Risk (VaR)3 $m Average High Low
Six months ended 30 September 2018 29.3 32.6 25.6
Six months ended 31 March 2018 39.3 56.7 27.0
Six months ended 30 September 2017 33.2 57.4 24.2
1 Costs are fully allocated to other divisions in the Group. 2 Costs are partially allocated to other divisions in the Group, with costs attributed to enterprise activity retained in Group Businesses. 3 VaR includes trading book and banking book exposures. The banking book component includes interest rate risk, credit spread risk in
liquid assets and other basis risks as used for internal management purposes.
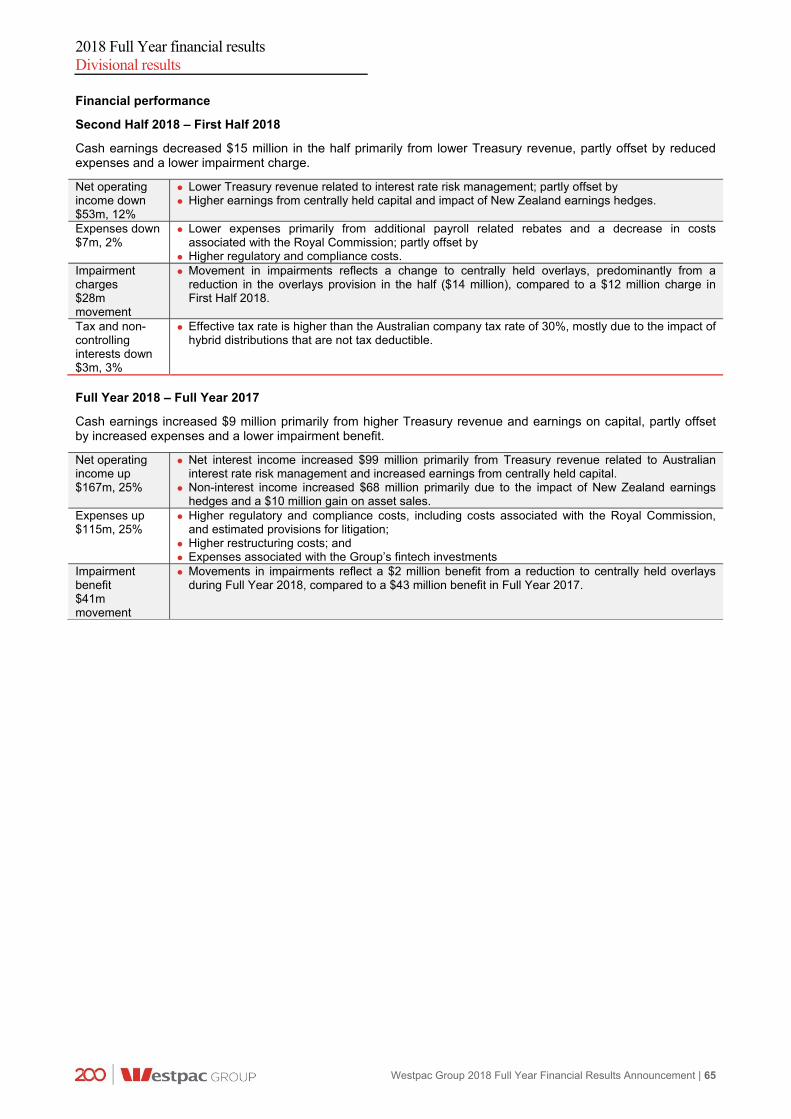
2018 Full Year financial results Divisional results
Westpac Group 2018 Full Year Financial Results Announcement | 65
Financial performance
Second Half 2018 – First Half 2018
Cash earnings decreased $15 million in the half primarily from lower Treasury revenue, partly offset by reduced expenses and a lower impairment charge.
Net operating income down $53m, 12%
Lower Treasury revenue related to interest rate risk management; partly offset by Higher earnings from centrally held capital and impact of New Zealand earnings hedges.
Expenses down $7m, 2%
Lower expenses primarily from additional payroll related rebates and a decrease in costs associated with the Royal Commission; partly offset by
Higher regulatory and compliance costs. Impairment charges $28m movement
Movement in impairments reflects a change to centrally held overlays, predominantly from a reduction in the overlays provision in the half ($14 million), compared to a $12 million charge in First Half 2018.
Tax and non-controlling interests down $3m, 3%
Effective tax rate is higher than the Australian company tax rate of 30%, mostly due to the impact of hybrid distributions that are not tax deductible.
Full Year 2018 – Full Year 2017
Cash earnings increased $9 million primarily from higher Treasury revenue and earnings on capital, partly offset by increased expenses and a lower impairment benefit.
Net operating income up $167m, 25%
Net interest income increased $99 million primarily from Treasury revenue related to Australian interest rate risk management and increased earnings from centrally held capital.
Non-interest income increased $68 million primarily due to the impact of New Zealand earnings hedges and a $10 million gain on asset sales.
Expenses up $115m, 25%
Higher regulatory and compliance costs, including costs associated with the Royal Commission, and estimated provisions for litigation;
Higher restructuring costs; and Expenses associated with the Group’s fintech investments
Impairment benefit $41m movement
Movements in impairments reflect a $2 million benefit from a reduction to centrally held overlays during Full Year 2018, compared to a $43 million benefit in Full Year 2017.

2018 Full Year financial results Table of Contents
66 | Westpac Group 2018 Full Year Financial Results Announcement
4.0 Full Year financial report 2018
4.1 Significant developments 67
4.2 Consolidated income statement 80
4.3 Consolidated statement of comprehensive income 81
4.4 Consolidated balance sheet 82
4.5 Consolidated statement of changes in equity 83
4.6 Consolidated cash flow statement 85
4.7 Notes to the consolidated financial statements 86
Note 1 Basis of preparation 86
Note 2 Segment reporting 87
Note 3 Net interest income 91
Note 4 Non-interest income 92
Note 5 Operating expenses 93
Note 6 Income tax 94
Note 7 Earnings per share 95
Note 8 Average balance sheet and interest rates 96
Note 9 Loans 97
Note 10 Provisions for impairment charges 98
Note 11 Credit quality 99
Note 12 Deposits and other borrowings 101
Note 13 Fair values of financial assets and liabilities 102
Note 14 Contingent liabilities, contingent assets and credit commitments 108
Note 15 Shareholders’ equity 112
Note 16 Notes to the consolidated cash flow statement 114
Note 17 Subsequent events 115
4.8 Statement in relation to the audit of the financial statements 116

2018 Full Year financial results Significant Developments
Westpac Group 2018 Full Year Financial Results Announcement | 67
Significant developments
Corporate significant developments
Royal Commission into the banking, superannuation and financial services industries
On 14 December 2017, the Australian Government established a Royal Commission into potential misconduct in Australia's banks and other financial services entities. The terms of reference for the Royal Commission require it to consider (amongst other things) the conduct of banks, insurers, financial service providers, superannuation funds (not including self-managed superannuation funds) and intermediaries between borrowers and lenders, and the effectiveness of Australian regulators in addressing misconduct in financial institutions. The Royal Commission is not required to inquire into matters such as the financial stability of Australia's banks. A final report is to be provided by the Commission to the Australian Government by 1 February 2019, and an interim report was released and tabled in parliament on 28 September 2018.
The Royal Commission is inquiring into potential misconduct and conduct, practices, behaviour or business activities by financial services entities that may fall below community standards and expectations. The Commission has sought and received public submissions as to misconduct issues in financial services and conducted a range of public hearings which have considered case studies of alleged misconduct issues.
Westpac has provided the Commission with documents and witness statements and made submissions in all rounds of the Royal Commission to date. The Interim Report of the Commission released on 28 September 2018 outlined a range of views the Commissioner has formed to date based on the information and hearings so far and has requested submissions on key areas of policy that might affect or address misconduct in the financial services industry. Many of those matters could have significant impacts on particular entities (including Westpac) and the financial services industry generally, as well as affecting the financial performance of financial institutions, including banks. Recommendations may include matters which could cause structural change to the financial services industry and/or business models used in the industry, changes to the compensation and incentive structures within the financial services industry, and changes involving the way financial services are regulated. Westpac made submissions in relation to the questions posed in the Interim Report on 26 October 2018.
The Commission will ultimately make findings and recommendations having considered the submissions Counsel Assisting, relevant financial institutions, other relevant bodies including regulators and the general public have made during the course of the proceedings of the Commission. The Commission’s findings and recommendations may include recommendations as to civil or criminal prosecutions that should be conducted against financial institutions and individuals, recommendations as to legislative reform and in respect of matters which regulatory or other policy bodies should consider.
In the event that the Federal Government supports recommended regulatory changes, the Royal Commission may result in changes to legislation and regulation. The Royal Commission is also considering the regulation and enforcement practices of our regulators. Any findings or recommendations made by the Royal Commission are likely to have and could continue to prompt regulators to commence investigations into various financial services entities including Westpac. Those steps could subsequently result in administrative or enforcement action being taken. The Commission may also prompt our regulators to alter their existing policies and practices (including increasing their expectations for entities that they regulate, including Westpac) and increase the number of potential contraventions they choose to publicly litigate rather than otherwise resolve, which could harm our reputation and increase our liabilities related to legal proceedings. There is also a risk that matters considered during the Royal Commission have resulted in or could encourage civil claims against financial institutions including class actions.
Parliamentary inquiries and other reviews
On 16 September 2016, the Chairman of the House of Representatives Standing Committee on Economics announced that the Committee had commenced its Review of the Four Major Banks (Parliamentary Review). The terms of reference for the Parliamentary Review are wide-ranging, with one area of focus being how individual banks and the industry as a whole are responding to issues identified through other inquiries, including through the Australian Banking Association (ABA) action plan. Westpac attended public hearings of the Parliamentary Review on 6 October 2016, 8 March 2017, 11 October 2017 and 11 October 2018.
The third report of the Parliamentary Review was published on 7 December 2017. In its third report, the Committee made recommendations to ensure merchants have the choice of how to process "tap and go" payments on dual network cards, that the Australian Competition and Consumer Commission (ACCC) as part of its inquiry into residential mortgage products should assess the repricing of interest-only mortgages that occurred in June 2017, that legislation is introduced to mandate banks' participation in Comprehensive Credit Reporting (discussed below) and that the Attorney-General should review the threshold transaction reporting obligations in light of the issues identified in a case brought by the Australian Transaction Reports and Analysis Centre against the Commonwealth Bank of Australia.

2018 Full Year financial results Significant Developments
68 | Westpac Group 2018 Full Year Financial Results Announcement
On 29 November 2016, the Senate referred an inquiry into the regulatory framework for the protection of consumers, including small businesses, in the banking, insurance and financial services sector to the Senate Economics References Committee. The terms of reference for the inquiry focus on a range of matters relating to the protection of consumers against wrongdoing in the sector. They also require the inquiry to examine the availability and adequacy of redress and support for consumers who have been victims of wrongdoing. The inquiry reporting date has been revised to 15 November 2018 to allow for the interim report of the Royal Commission to be handed down.
In addition to the reviews and inquiries mentioned above, the ACCC is undertaking a specific inquiry into the pricing of residential mortgages by those banks affected by the Bank Levy (including Westpac), which include monitoring the extent to which the Bank Levy is passed on to customers. An interim report was published in March 2018 and a final report is due in November 2018.
The inquiry into the pricing of residential mortgages is the first task of the Financial Services Unit (FSU), established by the ACCC in 2017 to undertake regular inquiries into specific financial services competition issues. The FSU has commenced market studies work from July 2018. The precise scope of that work has not yet been determined, and could include a review of the impact of regulatory measures which affect the ability of smaller banks to compete against the major banks, barriers to entry in financial services markets and consumer switching.
On 2 October 2018, the ACCC announced it was holding an inquiry into the supply of foreign currency conversion services in Australia. The inquiry is the second task of the FSU, and will examine the pricing of foreign currency conversion services and evaluate whether there are impediments to effective price competition in the sector. A report is due to be provided by the ACCC to the Treasurer by 31 May 2019.
As these reviews and inquiries progress, they may lead to further regulation and reform.
APRA self-assessment
On 1 May 2018, in the context of the publication of the final report in relation to the prudential inquiry into the Commonwealth Bank of Australia, APRA indicated that all regulated financial institutions would benefit from conducting a self-assessment into their frameworks and practices in relation to governance, culture and accountability. For large financial institutions such as Westpac, APRA noted it will also be seeking written assessments in relation to these matters that have been reviewed and endorsed by their Board. Westpac’s self-assessment is currently underway and the report is due to APRA on 30 November 2018.
Productivity Commission Inquiry into Competition in the Australian Financial System
In May 2017, the Australian Government announced a Productivity Commission inquiry into competition in the financial system. This review was a recommendation of the Financial System Inquiry (FSI). The terms of reference were broad and required the Productivity Commission to review competition in Australia's financial system with a view to improving consumer outcomes, the productivity and international competitiveness of the financial system and the economy more broadly, and supporting ongoing financial system innovation, while balancing these with financial stability objectives.
The Productivity Commission released its final report on 3 August 2018 in which it found that financial system regulation since the Global Financial Crisis had favoured stability over competition. A number of the Productivity Commission's recommendations were aimed at addressing this perceived regulatory imbalance, including that:
the Australian Government should implement an open banking system;
the ACCC should receive a mandate to 'champion' competition in the financial system;
trail commissions, volume-based commissions, campaign-based commissions and volume-based payments should be banned in mortgage broking and clawback of commissions from brokers restricted to a maximum 2 year period;
all brokers, aggregators, lenders and their employees who provide home loans to customers should have a clear legally-backed best interest obligation to their clients;
all banks should appoint a Principal Integrity Officer (PIO) obliged by law to report directly to their board on the alignment of any payments made by the institution with the new customer best interest duty. The PIO would also have an obligation to report independently to ASIC in instances in which a board is not responsive to their advice;
the ACCC should undertake five-yearly market studies on the effect of vertical and horizontal integration on competition in the financial system. The first of these studies should commence in 2019 and include establishing a robust evidence base of integration activity in the financial system;

2018 Full Year financial results Significant Developments
Westpac Group 2018 Full Year Financial Results Announcement | 69
ASIC should require all lenders to provide those borrowers that are levied with lenders mortgage insurance
(LMI) with the option of such insurance being levied once at the commencement of their home loan (whether paid as a lump sum or as deferred payments) or it being levied annually over the first 6 years of their loan, including requiring them to also provide borrowers with transparency in relation to the comparison of these options;
where LMI is levied at the commencement of the home loan, all lenders should be required to set a schedule of refunds on the cost of LMI when borrowers choose to refinance or pay out their loan within 6 years of the loan being originated. The refund schedule should be made available to the borrower before any fee or charge is levied; and
the Payments System Board should introduce a ban on card payment interchange fees by mid-2019.
ASIC action on compliance breaches with fees disclosure and renewal notices
On 12 October 2018, ASIC announced a review of compliance with requirements for Fee Disclosure Statements (FDS) and Renewal Notices. ASIC advised that it has received a number of breach reports from licensees which indicate they may have failed to comply with the FDS and Renewal Notice requirements that were implemented as part of the FoFA reforms. These reports are currently being investigated by ASIC, and ASIC may take enforcement action where breaches are substantiated. In addition to investigating these particular instances, ASIC announced that it will test compliance with FDS and Renewal Notice requirements across the financial advice sector.
ASIC will report its findings in 2019.
Residential mortgage lending - reviews by and engagement with regulators
In recent years, regulators have focused on aspects of residential mortgage lending standards across the industry. APRA has been looking at, and speaking publicly about, the broader issue of bank serviceability standards pertaining to residential mortgage lending.
During the year, Westpac further strengthened its controls on mortgage serviceability requirements. This work has been guided by the findings identified through the 2016/17 targeted review of data used in residential mortgage serviceability assessments, which was undertaken by Westpac (and other large ADIs) at APRA’s request. The focus of the review was on the adequacy of controls used to ensure borrower information in serviceability assessments was complete and accurate. Westpac engaged PricewaterhouseCoopers (PwC) to undertake the targeted review which was completed in May 2017. Based on the results of their evaluation of the design and operating effectiveness of the controls in place, PwC issued a qualified opinion on the basis of 8 of the 10 control objectives stipulated by APRA. While PwC found that Westpac had implemented a wide range of controls related to verifying certain categories of borrower information (particularly in relation to income), they noted that Westpac should give further consideration to strengthening controls in certain areas, such as declared expenses and other debts.
Westpac is continuing to engage with APRA in relation to its progress in strengthening these controls together with its risk management framework for residential mortgage lending, including in relation to oversight, operating systems and controls, and assurance.
Additionally, in line with APRA’s letter to ADIs dated 26 April 2018 (Embedding Sound Residential Mortgage Lending Practices), Westpac has been engaging with APRA in relation to its residential mortgage lending policies and practices.
In the mortgage area, ASIC continues to focus on interest only mortgage origination and high risk customer groups (such as customers with reverse mortgages). ASIC has also reviewed public statements by some banks (including Westpac) about interest rate changes, following the introduction of APRA's macro-prudential limits for ADIs in respect of interest only lending flows. Westpac is working with ASIC on their reviews in these areas.
Anti-Money laundering and counter-terrorism financing reforms and initiatives
On 13 December 2017, the Anti-Money Laundering and Counter-Terrorism Financing Amendment Act 2017 (Cth) (Amendment Act) became effective and introduced a number of reforms to the Anti-Money Laundering and Counter Terrorism Financing Act 2006 (Cth) (AML/CTF Act), including:
expanding the Australian Transaction Reports and Analysis Centre's (AUSTRAC) power to issue infringement notices and remedial directions;
refining the 'tipping-off' provisions so that reporting entities can share information with certain related bodies corporate; and
regulating digital currency exchange providers.

2018 Full Year financial results Significant Developments
70 | Westpac Group 2018 Full Year Financial Results Announcement
Many of the changes introduced by the Amendment Act arise from a recent review of Australia's AML/CTF framework (Statutory Review), the findings of which were set out in the Report on the Statutory Review of the AML/CTF Act and Associated Rules and Regulations, which was tabled in Parliament on 29 April 2016. The Statutory Review took into account the relevant findings of the Financial Action Task Force's mutual evaluation of Australia's AML/CTF regime. The Government has published a 'Project Plan' for implementing the reforms recommended by the Statutory Review, and it is likely further reforms will be legislated in the near future.
In addition to the potential for ongoing legislative change, over the past few years AUSTRAC has increasingly emphasised its role in collecting, analysing and disseminating financial intelligence data to its law enforcement partners. One way AUSTRAC has sought to do this is through greater collaboration with the financial services industry. In 2016, AUSTRAC created the Fintel Alliance, an initiative which involves AUSTRAC, various financial services entities (including Westpac) and public sector bodies collaborating with the aim of developing and sharing actionable intelligence and insights that address key AML/CTF risks.
In this environment of ongoing legislative reform, regulatory change and increased industry focus, Westpac continues to engage with AUSTRAC and has been undertaking a review of its AML/CTF control environment that is designed to consider and assess our AML/CTF policies, the completeness of data feeding into our AML/CTF systems and our anti-money laundering and counter-terrorism financing processes and controls. Westpac has been regularly updating AUSTRAC on the progress of this review and has commenced implementing a number of improvements to its AML/CTF policies, systems and controls together with related remediation work in respect of certain reporting practices. These efforts have related to matters such as customer on-boarding and ongoing customer due diligence.
The Group has recently self-reported to AUSTRAC a failure to report a large number of International Funds Transfer Instructions (IFTIs) (as required under Australia’s AML/CTF Act) in relation to one WIB product. These IFTIs relate to batch instructions received from 2009 until recently from a small number of correspondent banks for payments made predominantly to beneficiaries in Australia in Australian dollars. Through the product, Westpac facilitates payments on behalf of clients of certain of its correspondent banks. The majority of the payments are low value and made by Government pension funds and corporates. The Group is investigating and working with AUSTRAC to remediate the failure to report IFTIs. Further details regarding the consequences of the failure to comply with financial crime obligations are set out in the Risk Factors section of the 2018 Westpac Annual Report.
Banking Executive Accountability Regime
On 1 July 2018 the Banking Executive Accountability Regime (BEAR), which applies to large ADIs such as Westpac, came into effect. The Government's stated intention of BEAR is to introduce a strengthened responsibility and accountability framework for the most senior and influential directors and executives in ADI groups (referred to as 'accountable persons' under BEAR).
BEAR involves a range of new measures, including:
imposing a set of requirements to be met by ADIs and accountable persons, including accountability obligations;
requirements for ADIs to register accountable persons with APRA prior to their commencement in an accountable person role, to maintain and provide APRA with a map of the roles and responsibilities of accountable persons across the ADI group, to give APRA accountability statements for each accountable person detailing that individual's roles and responsibilities and to report any breaches by the ADI or an accountable person of their respective accountability obligations to APRA; and
new and stronger APRA enforcement powers, including disqualification powers in relation to accountable persons who breach the obligations of BEAR and a new civil penalty regime that will enable APRA to seek civil penalties in the Federal Court of up to $210 million (for large ADIs, such as Westpac) where an ADI breaches its obligations under BEAR and the breach relates to 'prudential matters'.
Westpac implemented BEAR, including filing all required documents with APRA, by the required date of 1 July 2018.
Australian Securities and Investments Commission (ASIC) Enforcement Review Taskforce
On 19 October 2016, the Australian Government announced that the ASIC Enforcement Review Taskforce (Taskforce) would conduct a review into the suitability of ASIC's existing regulatory tools (including the penalties available) and whether they need to be strengthened.
The Taskforce completed its report in December 2017 and made 50 recommendations to the Australian Government. On 20 April 2018, the Australian Government announced that it has agreed, or agreed in principle, to all 50 recommendations and will prioritise the implementation of 30 of those recommendations. The remaining 20 recommendations will be considered with the final report of the Royal Commission.

2018 Full Year financial results Significant Developments
Westpac Group 2018 Full Year Financial Results Announcement | 71
The Taskforce made recommendations on, among other things:
reforms to the mandatory breach reporting framework including when a reporting obligation is triggered, expanding the class of reports that must be made to include misconduct by individual advisers and employees and strengthening the penalties for failing to report, including through the introduction of an infringement notice regime;
strengthening ASIC's licensing powers, which would enable ASIC to take action to refuse to grant, or to suspend or cancel, a licence where the applicant or licensee is not considered to be a fit and proper person;
expanding ASIC's powers to ban individuals working in financial services businesses where they are found to be unfit, improper or incompetent;
increasing fines and strengthening penalties for corporate and financial sector misconduct;
providing ASIC with the power to issue directions to financial services licensees and credit licensees in relation to the conduct of their business; and
enhancing ASIC’s search warrant powers to provide them with greater flexibility to use seized materials and granting ASIC access to telecommunications intercept material.
Progress has been made in implementing these recommendations, including:
ASIC releasing a report on 25 September 2018 on the breach reporting processes of 12 financial services groups, including Westpac;
the Australian Government publicly endorsing the proposal by the ASIC Enforcement Review Taskforce to expand ASIC’s powers in respect of corporate and financial services misconduct, including the criminal and civil penalties which apply and introducing the ‘Treasury Laws Amendment (Strengthening Corporate and Financial Sector Penalties) Bill 2018’ (Cth); and
the Australian Government announcing an increase in ASIC’s funding in order to introduce a close and continuous monitoring program, in which ASIC embeds staff within the institutions which it supervises.
Enhanced penalties for corporate and financial sector misconduct
On 24 October 2018, the Australian Government introduced into Parliament the Treasury Laws Amendment (Strengthening Corporate and Financial Sector Penalties) Bill 2018 (Cth), which proposes to strengthen penalties for corporate and financial sector misconduct consistent with the ASIC Enforcement Review Taskforce recommendations. If passed in its current form, the Bill will:
update the penalties for certain criminal offences in legislation administered by ASIC, including increasing the maximum imprisonment penalties for certain criminal offences, introducing a formula to calculate financial penalties for criminal offences, and removing imprisonment as a penalty but increasing the financial penalties for all strict and absolute liability offences;
introduce ordinary criminal offences that sit alongside strict and absolute liability offences;
introduce the ability for courts to make relinquishment orders for civil penalty provision contraventions;
modernise and expand the civil penalty regime by making a wider range of offences subject to civil penalties;
harmonise and expand the infringement notice regime;
introduce a new test that applies to all dishonesty offences under the Corporations Act 2001 (Cth); and
ensure the courts prioritise compensating victims over ordering the payment of financial penalties.
Product design and distribution obligations and product intervention power
On 21 December 2017, the Australian Treasury released draft legislation that would amend the Corporations Act 2001 (Cth) and the National Consumer Credit Protection Act 2009 (Cth) in order to grant ASIC a product intervention power and introduce a new 'principles-based' product design and distribution obligation on issuers and distributors. A further exposure draft was released for consultation in July 2018.
Westpac lodged a submission with the Australian Treasury on 12 February 2018 and on 16 August 2018 in response to the draft legislation and its revision respectively.
On 20 September 2018, the Treasury Laws Amendment (Design and Distribution Obligations and Product Intervention Powers) Bill 2018 (Cth) was introduced into Parliament. The Bill is currently before the House of Representatives. Exposure draft regulations in relation to the Bill were released for consultation on 23 October 2018.

2018 Full Year financial results Significant Developments
72 | Westpac Group 2018 Full Year Financial Results Announcement
Australian Banking Association Banking Reform Program and industry initiatives
On 21 April 2016, the ABA announced an action plan to protect consumer interests, increase transparency and accountability and build trust and confidence in banks.
The reform program includes a number of industry-led initiatives including:
a review of product sales commissions and product based payments;
the establishment of an independent customer advocate in each bank;
supporting the broadening of external dispute resolution schemes;
evaluating the establishment of an industry-wide, mandatory, last resort compensation scheme;
strengthening protections available to whistleblowers;
the implementation of a new information sharing protocol to help stop individuals with a history of poor conduct moving around the industry;
strengthening the commitment to customers in the Banking Code of Practice; and
supporting ASIC as a strong regulator.
On 17 April 2018, the independent governance expert overseeing the ABA action plan, Mr Ian McPhee, released his eighth and final report titled, Australian banking industry: Package of initiatives, which noted that banks have made good progress in delivering the initiatives, with most initiatives now implemented. Reporting by the banks to Ian McPhee about their implementation of key industry initiatives has now concluded. The ABA has committed to member banks providing further bi-annual external reporting on their implementation progress.
On 31 July 2018, ASIC approved the Banking Code of Practice with an implementation date of 1 July 2019. The new code replaces the previous version, the Code of Banking Practice 2013.
Westpac has fully implemented the recommendations from the Retail Banking Remuneration review chaired by Mr Stephen Sedgwick on 1 October 2018 for our employees, two years ahead of schedule.
Changes to wealth business
On 20 June 2018, BT Financial Advice announced that its customers operating through the Westpac, St.George, Bank of Melbourne and BankSA networks will benefit from the removal of grandfathered payments attributable to their BT products. The change to remove the majority of grandfathered payments occurred on 1 October 2018 with the removal of certain more complex grandfathered payments to follow shortly. The introduction of the Future of Financial Advice (FoFA) reforms in 2013 included a prospective ban on conflicted remuneration. Generally, arrangements in place prior to the commencement of FoFA were grandfathered, permitting the continuation of grandfathered payments, such as commissions, under those arrangements.
On 23 July 2018, BT Financial Group announced three new initiatives:
significant pricing changes to its flagship platform, BT Panorama, so that the pricing structure is significantly lower, simpler and no longer based on scale;
the launch of a ‘compact’ BT Panorama offer for simpler investment; and
an online adviser services hub, BT Open Services.
Open banking regime
On 9 February 2018, the final report of the Review into Open Banking in Australia was released. The report makes 50 recommendations in total, including recommendations on:
the regulatory framework to support open banking;
what data should be shared and with whom;
what safeguards are needed to inspire confidence in data sharing;
how data should be transferred; and
how open banking should be rolled out.
On 9 May 2018 the Government announced that it agreed with the recommendations of the report, and that it would phase in open banking in stages with all major banks (including Westpac) required to make data available on credit and debit cards, together with deposit and transaction accounts by 1 July 2019 and on mortgages by 1 February 2020. Data on all products recommended by the report will be required to be made available by 1 July 2020. All remaining banks will be required to implement open banking with a 12-month delay on the timelines set for the major banks. The ACCC will be empowered to adjust timeframes if necessary.

2018 Full Year financial results Significant Developments
Westpac Group 2018 Full Year Financial Results Announcement | 73
On 15 August 2018, the Australian Treasury released draft legislation that would amend the Competition and Consumer Act 2010 (Cth), the Privacy Act 1988 (Cth) and the Australian Information Commissioner Act 2010 (Cth) to introduce a consumer data right which will apply to particular sectors designated by the Treasurer, in response to which Westpac lodged a submission. A further draft of the legislation (including a draft designation) was released by the Australian Treasury on 24 September 2018. The banking sector is the first sector to which the right will apply. A Consumer Data Right Rules Framework was also released by the ACCC in September 2018 and Westpac lodged a submission on the Framework on 12 October 2018.
Harper Competition Reforms
In November 2017, the Competition and Consumer Amendment (Competition Policy Review) Act 2017 (Cth) and the inter-related Competition and Consumer Amendment (Misuse of Market Power) Act 2017 (Cth) came into effect, making significant changes to the Competition and Consumer Act 2010 (Cth) following recommendations by the Competition Policy Review which was chaired by Professor Ian Harper.
These reforms included:
broadening the scope of the existing prohibition on misuse of market power. Corporations with substantial market power are prohibited from engaging in any conduct with the purpose or likely effect of substantially lessening competition in a market in which the corporation (or its related bodies corporate) supplies or acquires goods or services;
a new prohibition on engaging in a 'concerted practice' that has the purpose, effect or likely effect of substantially lessening competition;
in light of the new concerted practices prohibition, the repeal of the bank-specific prohibition on price signalling;
providing the ACCC with a 'class exemption' power which enables it to determine that various provisions in the Competition and Consumer Act 2010 (Cth) do not apply to certain types of conduct;
removing the per se prohibition on third line forcing or ‘third party bundling’ of goods and services unless the conduct is notified to the ACCC. Instead this practice will be subject to a test of whether the bundling is likely to have the purpose, effect or likely effect of substantially lessening competition; and
streamlining the existing procedure to review proposed mergers.
Comprehensive Credit Reporting (CCR)
On 28 March 2018, the National Consumer Credit Protection Amendment (Mandatory Comprehensive Credit Reporting) Bill 2018 (Cth) was introduced into Parliament. Whilst the bill remains in the Senate, if passed in its current form, the bill will mandate the provision of CCR data to credit reporting bodies. Westpac is committed to the use of CCR to support our principles of responsible lending, and as such we voluntarily supplied 55% of our consumer credit accounts on 17 September 2018.
Westpac will supply the residual 45% of consumer credit accounts by 17 September 2019. To support our implementation, Westpac is now a signatory of the Principles of Reciprocity and Data Exchange, which provides governance and most importantly key consumer data protection protocols within the CCR data sharing environment.
Financial benchmarks reform
The Treasury Laws Amendment (2017 Measures No.5) Act 2018 (Cth) commenced on 12 April 2018 which strengthens the regulation of financial benchmarks. The measures include:
ASIC being empowered to develop enforceable rules for administrators and entities that make submissions to significant benchmarks (such as Westpac), including the power to compel submissions to benchmarks in the case that other calculation mechanisms fail;
administrators of significant benchmarks being required to hold a new 'benchmark administrator' licence issued by ASIC (unless granted an exemption); and
the manipulation of any financial benchmark or financial product used to determine a financial benchmark (such as negotiable certificates of deposit) being made a specific criminal offence and subject to civil penalties.
Issue of Westpac Capital Notes 5
On 13 March 2018, Westpac issued $1.69 billion of securities known as Westpac Capital Notes 5, which qualify as Additional Tier 1 capital under APRA's capital adequacy framework.

2018 Full Year financial results Significant Developments
74 | Westpac Group 2018 Full Year Financial Results Announcement
Transfer and conversion of Westpac convertible preference shares (CPS)
On 13 March 2018, $623 million of CPS were transferred to the Westpac CPS nominated party for $100 each pursuant to the Westpac Capital Notes 5 reinvestment offer. Those CPS were subsequently bought back and cancelled by Westpac.
On 3 April 2018, the remaining $566 million of CPS were transferred to the Westpac CPS nominated party for $100 each. Following the transfer, those remaining CPS were converted into 19,189,765 ordinary shares.
ASIC's responsible lending litigation against Westpac
On 1 March 2017, ASIC commenced Federal Court proceedings against Westpac in relation to home loans entered into between December 2011 and March 2015, which were automatically approved by Westpac's systems as part of broader processes. On 4 September 2018 Westpac and ASIC agreed to settle the proceedings on the basis of a proposed $35 million penalty and declarations that Westpac contravened the National Consumer Credit Protection Act 2009 (Cth) (NCCPA). The proposed settlement is subject to Court approval, and involves Westpac accepting that during the relevant period (December 2011 – March 2015), the way that Westpac used the Household Expenditure Measure (HEM) benchmark to assess home loans, and the way that Westpac assessed certain interest only loans breached the NCCPA. This meant that during the relevant period, approximately 10,500 home loans should have been referred to manual assessment by a credit officer. A hearing on the proposed settlement was held on 24 October 2018 and judgment has been reserved.
Outbound scaled advice division proceedings
On 22 December 2016, ASIC commenced Federal Court proceedings against BT Funds Management Limited (BTFM) and Westpac Securities Administration Limited in relation to a number of superannuation account consolidation campaigns conducted between 2013 and 2016. ASIC has alleged that in the course of some of these campaigns, customers were provided with personal advice in contravention of a number of Corporations Act 2001 (Cth) provisions. ASIC has selected 15 specific customers as the focus of their claim. The proceedings were heard in February 2018. Judgment is pending.
ASIC’s proceedings against Westpac for poor financial advice by a financial planner
On 14 June 2018, ASIC commenced proceedings in the Federal Court against Westpac in relation to alleged poor financial advice provided by a former financial planner, Mr Sudhir Sinha. Mr Sinha was dismissed by Westpac in November 2014 and subsequently banned by ASIC. Westpac has proactively initiated remediation to identify and compensate affected customers and has completed remediation activities. ASIC’s proceedings relate to advice provided by Mr Sinha in respect of four specific customer files. Westpac has filed a response to ASIC’s allegations.
Class action against Westpac Banking Corporation and Westpac Life Insurance Services Limited
On 12 October 2017 a class action was filed in the Federal Court of Australia on behalf of customers who, since October 2011, obtained insurance issued by Westpac Life Insurance Services Limited (WLIS) on the recommendation of financial advisers employed within the Westpac Group. The plaintiffs have alleged that aspects of the financial advice provided by those advisers breached fiduciary and statutory duties owed to the advisers' clients, including the duty to act in the best interests of the client, and that WLIS was knowingly involved in those alleged breaches. Westpac and WLIS are defending the proceedings. These proceedings are currently stayed by order of the Court, pending the outcome of an appeal concerning a procedural issue unrelated to the substantive claims made in the class action.
BBSW proceedings
Following ASIC's investigations into the interbank short-term money market and its impact on the setting of the bank bill swap reference rate (BBSW), on 5 April 2016, ASIC commenced civil proceedings against Westpac in the Federal Court of Australia, alleging certain misconduct, including market manipulation and unconscionable conduct. The conduct that was the subject of the proceedings was alleged to have occurred between 6 April 2010 and 6 June 2012. ASIC sought declarations from the court that Westpac breached various provisions of the Corporations Act 2001 (Cth) and the Australian Securities and Investments Commission Act 2001 (Cth), pecuniary penalties of unspecified amounts and orders requiring Westpac to implement a comprehensive compliance program for persons involved in Westpac's trading in the relevant market. The proceedings were heard in late 2017. On 24 May 2018, Justice Beach found that Westpac had not engaged in market manipulation or misleading or deceptive conduct under the Corporations Act 2001 (Cth). His Honour also found that there was no ‘trading practice’ of manipulating the BBSW rate. However, the Court found that Westpac engaged in unconscionable conduct on 4 occasions and that Westpac breached its supervisory duty. Costs and penalties will be determined in the coming months.
In August 2016, a class action was filed in the United States District Court for the Southern District of New York against Westpac and a large number of other Australian and international banks alleging misconduct in relation to BBSW. These proceedings are at an early stage and the level of damages sought has not been specified. Westpac is defending these proceedings.

2018 Full Year financial results Significant Developments
Westpac Group 2018 Full Year Financial Results Announcement | 75
Bank Levy for Authorised Deposit-taking Institutions (ADIs)
On 23 June 2017, legislation was enacted that introduced a new levy on ADIs with liabilities of at least $100 billion (Bank Levy). The Bank Levy became effective from 1 July 2017 and the rate is set at 0.06% per annum of certain ADI liabilities. There is no end date provided for the Bank Levy. In the first 12 months following the introduction of the Bank Levy, Westpac paid $376 million to the Australian Government.
Taxation of cross-border financing arrangements
The Australian and New Zealand Governments have each decided to implement the Organisation for Economic Co-operation and Development's (OECD) proposals relating to the taxation treatment of cross-border financing arrangements. These proposals affect the taxation arrangements for certain 'hybrid' regulatory capital instruments issued by Westpac. The Australian provisions were enacted on 24 August 2018 and provide for limited grandfathering of certain previously issued Additional Tier 1 capital securities. The New Zealand provisions were enacted on 27 June 2018 and similarly provide for limited grandfathering of certain previously issued Tier 2 capital securities.
APRA's proposed changes to capital standards
The final report of the FSI in 2014 recommended that APRA set capital standards such that the capital ratios of Australian ADIs are "unquestionably strong".
On 19 July 2017, APRA released an Information Paper titled 'Strengthening Banking System Resilience - Establishing Unquestionably Strong Capital Ratios'. In its release, APRA concluded that the four major Australian banks, including Westpac, need to have a CET1 ratio of at least 10.5%, as measured under the existing capital framework to be considered "unquestionably strong." Banks are expected to meet this new benchmark by 1 January 2020. APRA has announced that it expects to consult on draft prudential standards giving effect to the new framework in 2018, leading to the determination of final prudential standards in 2019. The new framework is anticipated to take effect in early 2021.
During 2018, APRA commenced consultation and issued the following discussion papers:
'Revision to the Capital Framework for Authorised Deposit-Taking Institutions'. The paper included proposed revisions to the capital framework which incorporates the finalisation of the Basel Committee on Banking Supervision (BCBS) Basel III reforms in December 2017, as well as other changes to better align the framework to risks, including in relation to home lending. In relation to proposed traded market risk reforms published by the BCBS (also referred to as “Fundamental Review of the Trading Book”), APRA have advised that it will defer its decision on the scope and timing of any domestic implementation of the market risk framework until after it has been finalised by the BCBS.
'Leverage Ratio Requirements for Authorised Deposit-Taking Institutions'. This discussion paper proposes to impose a minimum leverage ratio requirement of 4% for ADIs that use the internal ratings-based approach to determine capital adequacy from 1 July 2019. Australian banks are currently required to report leverage ratios under the existing requirements as part of Pillar 3 disclosures.
‘Improving the transparency, comparability and flexibility of the ADI capital framework’. The discussion paper outlines options APRA is considering for the presentation of capital ratios, minimum capital requirements and capital instrument triggers. This could result in changes to capital ratios and minimum capital requirements and the Capital Trigger Event level of 5.125% could stay the same or increase. The dollar amount of CET1 surplus above the Capital Trigger Event level of 5.125% will depend on the final option implemented by APRA. As the proposals are at an early consultation stage it is too soon to determine final impacts.
APRA has announced that its revisions to the capital framework are not intended to necessitate further capital increases for the industry above the 10.5% benchmark. However, given the proposals include higher risk weights for certain mortgage products, such as interest only loans and loans for investment purposes, the impact on individual banks may vary. Given that the proposals are at the early consultation stage and final details remain unclear, it is too soon to determine the impact on Westpac.
Further details of Westpac’s other regulatory disclosures required in accordance with prudential standard APS 330 can be accessed at https://www.westpac.com.au/about-westpac/investor-centre/financial-information/regulatory-disclosures/.
Resolution planning including additional loss absorbing capacity and APRA's crisis management powers
In response to the FSI recommendations, the Australian Government also agreed to further reforms regarding crisis management and to establish a framework for minimum loss-absorbing and recapitalisation capacity.

2018 Full Year financial results Significant Developments
76 | Westpac Group 2018 Full Year Financial Results Announcement
On 5 March 2018, legislation came into effect which strengthens APRA's crisis management powers. The intention of these reforms is to strengthen APRA's powers to facilitate the orderly resolution of an institution so as to protect the interests of depositors and to protect the stability of the financial system. The reforms also enhance APRA's ability to take actions in relation to resolution planning, including measures to ensure regulated entities and their groups are better prepared for resolution.
APRA expects to commence consultation on a framework for minimum loss-absorbing and recapitalisation capacity later in 2018. The intention of this would be to facilitate the orderly resolution of banks and minimise taxpayer support.
Macro-prudential regulation
From December 2014, APRA began using macro-prudential measures targeting mortgage lending. This included limiting investment property lending growth to below 10%, imposing additional levels of conservatism in serviceability assessments, and restricting mortgage lending with interest only terms to 30% of new mortgage lending. APRA also indicated that it expects ADIs to place strict internal limits on the volume of interest only loans with loan-to-valuation ratios (LVR) above 80%.
Westpac has implemented steps to achieve these limits, including introducing differential pricing for investor property loans and interest only loans, a restriction on the volume of interest only loans with an LVR of greater than 80% (includes limit increases, interest only term extension and switches), no repayment switch fee for customers switching to principal and interest from interest only loans and no longer accepting external refinances (from other financial institutions) for owner occupied interest only loans. Interest only residential mortgages constituted 22.6% of new mortgage lending for the quarter ended 30 September 2018 (currently 34.7% of Westpac's overall Australian residential mortgage portfolio as at 30 September 2018).
On 26 April 2018, APRA announced its intention to remove the existing 10% limit on investment property lending growth and replace it with more permanent measures to strengthen lending standards. In order to no longer be subject to this limit from 1 July 2018, ADIs will be required to demonstrate to APRA that they have been operating below the 10% limit for at least the past 6 months. In addition, an ADI’s Board will be required to provide an assurance to APRA in relation to its lending policies and practices. Westpac is currently subject to the 10% limit.
Net Stable Funding Ratio
In December 2016, APRA released an updated prudential standard on liquidity (APS 210) which took effect from 1 January 2018. The revised APS 210 includes the Net Stable Funding Ratio (NSFR) requirement; a measure designed to encourage longer-term funding of assets and better match the duration of assets and liabilities. Westpac's NSFR as at 30 September 2018 was 114%, above the NSFR requirement of 100%.
Committed Liquidity Facility - annual application
The Reserve Bank of Australia makes available to ADIs a Committed Liquidity Facility (CLF) that, subject to qualifying conditions, can be accessed to meet LCR requirements under APS210 Liquidity. Westpac's CLF allocation has been decreased from $57.0 billion in 2018 to $54.0 billion for 2019.
Transition to AASB 9
AASB 9 Financial Instruments (AASB 9) will replace AASB 139 Financial Instruments: Recognition and Measurement from 1 October 2018. AASB 9 includes a forward looking 'expected credit loss' impairment model, revised classification and measurement model and modifies the approach to hedge accounting.
The adoption of AASB 9 is expected to reduce retained earnings at 1 October 2018 by approximately $709 million (net of tax) primarily due to the increase in impairment provisions under the new standard. The Group continues to assess and refine certain aspects of our impairment provisioning process. There is no significant impact to our regulatory capital.
Further details of the changes under the new standard are included in Note 1 to the financial statements.
Transition to AASB 15
AASB 15 Revenue from Contracts with Customers (AASB 15) will replace AASB 118 Revenue and related Interpretations from 1 October 2018. AASB 15 provides a systematic approach to revenue recognition by introducing a five-step model governing revenue measurement and recognition. The application of AASB 15 will not have a material impact on the Group’s net profit or retained earnings.
Further details of the changes under the new standard are included in Note 1 to the financial statements.
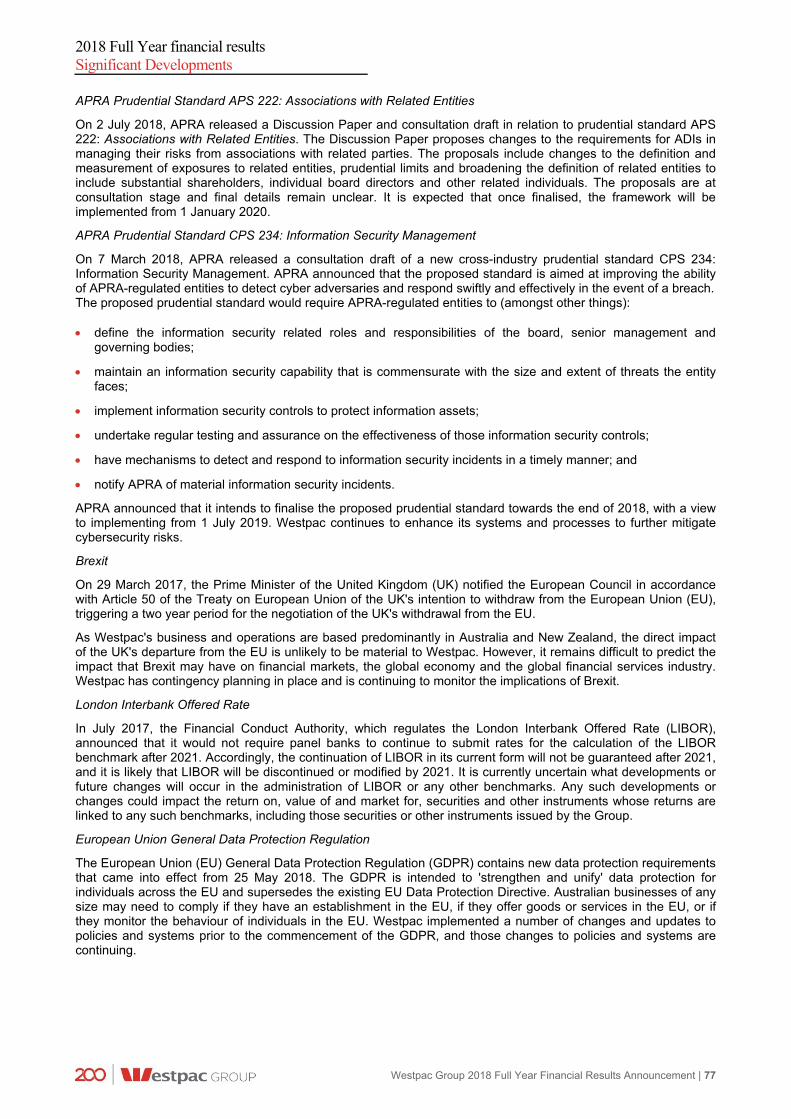
2018 Full Year financial results Significant Developments
Westpac Group 2018 Full Year Financial Results Announcement | 77
APRA Prudential Standard APS 222: Associations with Related Entities
On 2 July 2018, APRA released a Discussion Paper and consultation draft in relation to prudential standard APS 222: Associations with Related Entities. The Discussion Paper proposes changes to the requirements for ADIs in managing their risks from associations with related parties. The proposals include changes to the definition and measurement of exposures to related entities, prudential limits and broadening the definition of related entities to include substantial shareholders, individual board directors and other related individuals. The proposals are at consultation stage and final details remain unclear. It is expected that once finalised, the framework will be implemented from 1 January 2020.
APRA Prudential Standard CPS 234: Information Security Management
On 7 March 2018, APRA released a consultation draft of a new cross-industry prudential standard CPS 234: Information Security Management. APRA announced that the proposed standard is aimed at improving the ability of APRA-regulated entities to detect cyber adversaries and respond swiftly and effectively in the event of a breach. The proposed prudential standard would require APRA-regulated entities to (amongst other things): define the information security related roles and responsibilities of the board, senior management and
governing bodies;
maintain an information security capability that is commensurate with the size and extent of threats the entity faces;
implement information security controls to protect information assets;
undertake regular testing and assurance on the effectiveness of those information security controls;
have mechanisms to detect and respond to information security incidents in a timely manner; and
notify APRA of material information security incidents.
APRA announced that it intends to finalise the proposed prudential standard towards the end of 2018, with a view to implementing from 1 July 2019. Westpac continues to enhance its systems and processes to further mitigate cybersecurity risks.
Brexit
On 29 March 2017, the Prime Minister of the United Kingdom (UK) notified the European Council in accordance with Article 50 of the Treaty on European Union of the UK's intention to withdraw from the European Union (EU), triggering a two year period for the negotiation of the UK's withdrawal from the EU.
As Westpac's business and operations are based predominantly in Australia and New Zealand, the direct impact of the UK's departure from the EU is unlikely to be material to Westpac. However, it remains difficult to predict the impact that Brexit may have on financial markets, the global economy and the global financial services industry. Westpac has contingency planning in place and is continuing to monitor the implications of Brexit.
London Interbank Offered Rate
In July 2017, the Financial Conduct Authority, which regulates the London Interbank Offered Rate (LIBOR), announced that it would not require panel banks to continue to submit rates for the calculation of the LIBOR benchmark after 2021. Accordingly, the continuation of LIBOR in its current form will not be guaranteed after 2021, and it is likely that LIBOR will be discontinued or modified by 2021. It is currently uncertain what developments or future changes will occur in the administration of LIBOR or any other benchmarks. Any such developments or changes could impact the return on, value of and market for, securities and other instruments whose returns are linked to any such benchmarks, including those securities or other instruments issued by the Group.
European Union General Data Protection Regulation
The European Union (EU) General Data Protection Regulation (GDPR) contains new data protection requirements that came into effect from 25 May 2018. The GDPR is intended to 'strengthen and unify' data protection for individuals across the EU and supersedes the existing EU Data Protection Directive. Australian businesses of any size may need to comply if they have an establishment in the EU, if they offer goods or services in the EU, or if they monitor the behaviour of individuals in the EU. Westpac implemented a number of changes and updates to policies and systems prior to the commencement of the GDPR, and those changes to policies and systems are continuing.

2018 Full Year financial results Significant Developments
78 | Westpac Group 2018 Full Year Financial Results Announcement
OTC derivatives reform
International regulatory reforms relating to over-the-counter (OTC) derivatives continue to be implemented across the globe, with a current focus on initial margin and risk mitigation practices for non-centrally cleared derivatives.
Australian standards for risk mitigation practices relating to trading relationship documentation, trade confirmations, portfolio reconciliation and compression and valuation and dispute resolution processes came into force in March 2018 and have now been implemented.
Global initial margin requirements commenced on 1 September 2016. These requirements are being introduced in phases until 1 September 2020 and work is underway within Westpac to comply with these regulations.
New Zealand
Regulatory reforms and significant developments in New Zealand include:
RBNZ - Revised Outsourcing Policy
On 19 September 2017, the RBNZ advised Westpac New Zealand Limited (WNZL) of changes to its conditions of registration that will give effect to the RBNZ's revised Outsourcing Policy (BS11) (Revised Outsourcing Policy). Both the changes to the conditions of registration and the Revised Outsourcing Policy came into effect on 1 October 2017. The Revised Outsourcing Policy sets out requirements that banks need to meet when outsourcing particular functions and services, especially if the service provider is a related party of the bank. WNZL will have two years before it must fully comply with the requirement to maintain a compendium of outsourcing arrangements and five years to fully comply with other aspects of the Revised Outsourcing Policy.
RBNZ Capital Review
The RBNZ is undertaking a Bank Capital Adequacy Framework review on the makeup of bank capital. The RBNZ has now made “in principle” decisions on the risk weighted assets framework, including the introduction of dual reporting, a standardised methodology for operational risk, and capital floors to internal rating models. These changes will be reflected in the revised framework which is scheduled to be released in Q4 2019. The RBNZ will progress the in principle decisions over 2018 and 2019, informed by a quantitative impact study and feedback on the minimum capital settings during Q4 2018.
Reform of the regulation of financial advice
In July 2016, the New Zealand Government announced plans for changes to the regime regulating financial advice. The new regime is set out in the Financial Services Legislation Amendment Bill (FSLAB), which had its second reading in Parliament in September 2018. Under FSLAB, financial advice will be provided by licensed firms who will employ financial advisers and nominated representatives. A Code of Conduct will apply to all advice and advisers and representatives will be subject to the same duties and ethical standards. Firms will be responsible for ensuring that their advisers and representatives comply with these duties. The reforms will also remove legislative barriers to the provision of robo-advice.
A two stage transition is proposed. At this stage, the Code of Conduct is expected to be approved in Q2 2019. There will be a 9-month period from the Code’s approval to initial implementation of the new regime, after which a 2-year safe harbour for competency requirements will apply.
RBNZ - Review under section 95 of the Reserve Bank of New Zealand Act 1989
On 10 February 2017, the RBNZ issued WNZL with a notice under section 95 of the Reserve Bank of New Zealand Act 1989, requiring WNZL to obtain an independent review of its compliance with advanced internal rating-based aspects of the RBNZ's 'Capital Adequacy Framework (Internal Models Based Approach)' (BS2B). WNZL has disclosed non-compliance with BS2B (compliance with which is a condition of registration for WNZL) in its quarterly disclosure statements. On 15 November 2017, the RBNZ advised WNZL of changes to its conditions of registration resulting from the review. The changes to WNZL's conditions of registration came into effect on 31 December 2017 and increase the minimum Total Capital ratio, Tier 1 Capital ratio and Common Equity Tier 1 Capital ratio of WNZL and its controlled entities by 2%. WNZL has also undertaken to the RBNZ to maintain the Total Capital ratio of WNZL and its controlled entities above 15.1%. WNZL and its controlled entities retain an appropriate amount of capital to comply with the increased minimum ratios. The RBNZ requires WNZL to sufficiently address non-compliance issues by 30 June 2019. A remediation plan has been provided to the RBNZ. WNZL is providing regular updates on the scope of its remediation activity to the RBNZ to ensure compliance by 30 June 2019.

2018 Full Year financial results Significant Developments
Westpac Group 2018 Full Year Financial Results Announcement | 79
Review of the Reserve Bank of New Zealand Act
In November 2017, the New Zealand Government announced it will undertake a review of the Reserve Bank of New Zealand Act 1989 (Act) (RBNZ Review). The RBNZ Review aims to ensure the RBNZ's monetary and financial policy framework still provides the most efficient and effective model for New Zealand. The RBNZ Review will consist of two phases. Phase 1 focuses on whether the RBNZ's decision-making process for monetary policy is robust, and draft legislation for the proposed Phase 1 related changes to the Act has been published. The terms of reference for Phase 2 were released in June 2018 and will consider broader issues, including the macro-prudential framework, the current prudential supervision model and trans-Tasman coordination. The first consultation on Phase 2 was issued on 1 November 2018.
Residential Mortgage Bond Collateral Standard Review
When the RBNZ lends to banks and other counterparties it does so against 'eligible collateral' (mortgage bonds). In New Zealand, mortgage bonds are not generally traded. On 17 December 2017, the RBNZ published an issues paper proposing an enhanced mortgage bond standard aimed at supporting confidence and liquidity in the financial system, and a more standardised and transparent framework for mortgage bonds, which would improve their quality and make them more marketable and a new format for mortgage bonds. The RBNZ is engaging with industry to develop this new mortgage bond standard.
RBNZ/FMA – Financial Services Conduct & Culture Review
In May 2018, the RBNZ and FMA commenced a review in respect of New Zealand’s 10 major banks & 15 life insurers, including WNZL and Westpac Life-NZ-Limited, to explain why conduct issues highlighted by the Australian Royal Commission are not present in New Zealand. WNZL and Westpac Life have provided the regulators with information in relation to this review. An industry thematic review report for the banks is expected to be released in November 2018 and for the life insurers in December 2018.

2018 Full Year financial results Consolidated financial statements
80 | Westpac Group 2018 Full Year Financial Results Announcement
4.2 Consolidated income statement
Westpac Banking Corporation and its controlled entities
% Mov't % Mov't
Half Year Half Year Sept 18 - Full Year Full Year Sept 18 -
$m Note Sept 18 March 18 Mar 18 Sept 18 Sept 17 Sept 17
Interest income 3 16,481 16,090 2 32,571 31,232 4
Interest expense 3 (8,254) (7,812) 6 (16,066) (15,716) 2
Net interest income 8,227 8,278 (1) 16,505 15,516 6
Non-interest income 4 2,753 2,875 (4) 5,628 6,286 (10)
Net operating income before
operating expenses and impairment charges 10,980 11,153 (2) 22,133 21,802 2
Operating expenses 5 (4,967) (4,725) 5 (9,692) (9,434) 3
Impairment charges 10 (317) (393) (19) (710) (853) (17)
Profit before income tax 5,696 6,035 (6) 11,731 11,515 2
Income tax expense 6 (1,797) (1,835) (2) (3,632) (3,518) 3
Net profit for the period 3,899 4,200 (7) 8,099 7,997 1
Net profit attributable to non-controlling interests (2) (2) - (4) (7) (43)
Net profit attributable to owners of
Westpac Banking Corporation 3,897 4,198 (7) 8,095 7,990 1
Earnings per share (cents)
Basic 7 113.8 123.7 (8) 237.5 238.0 -
Diluted 7 110.0 119.7 (8) 230.1 229.3 -
The above consolidated income statement should be read in conjunction with the accompanying notes.
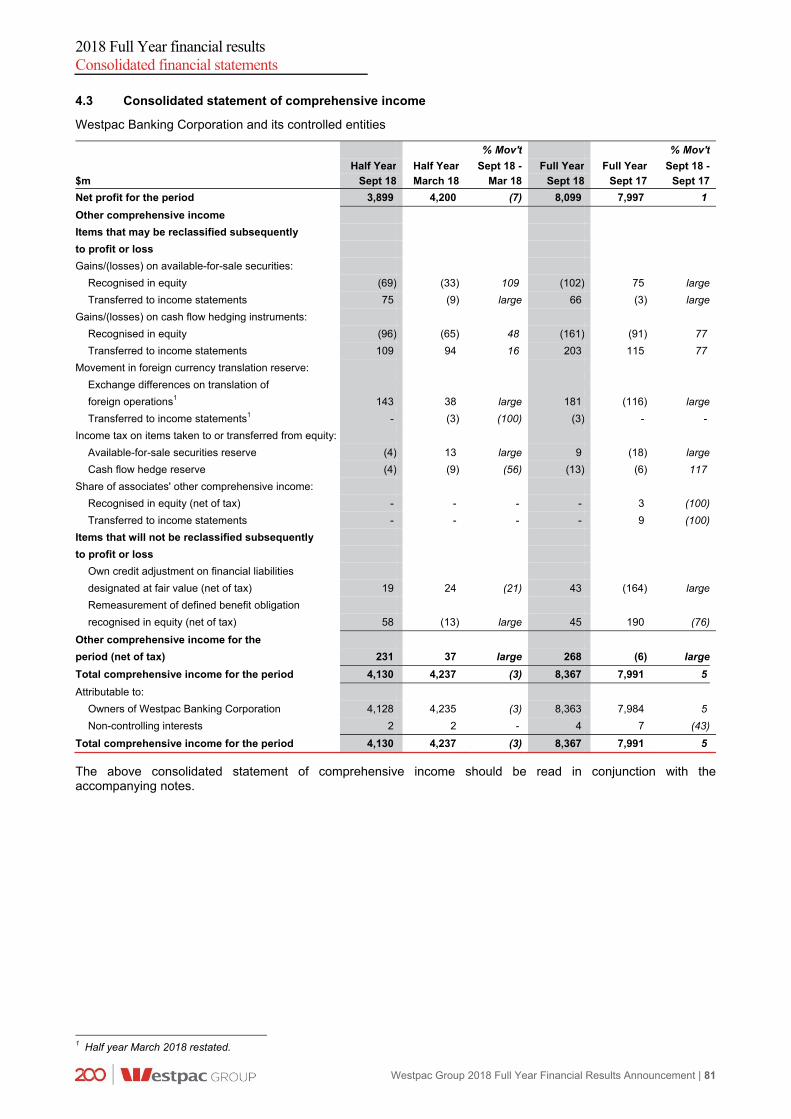
2018 Full Year financial results Consolidated financial statements
Westpac Group 2018 Full Year Financial Results Announcement | 81
4.3 Consolidated statement of comprehensive income
Westpac Banking Corporation and its controlled entities
% Mov't % Mov't
Half Year Half Year Sept 18 - Full Year Full Year Sept 18 -
$m Sept 18 March 18 Mar 18 Sept 18 Sept 17 Sept 17
Net profit for the period 3,899 4,200 (7) 8,099 7,997 1
Other comprehensive income
Items that may be reclassified subsequently
to profit or loss
Gains/(losses) on available-for-sale securities:
Recognised in equity (69) (33) 109 (102) 75 large
Transferred to income statements 75 (9) large 66 (3) large
Gains/(losses) on cash flow hedging instruments:
Recognised in equity (96) (65) 48 (161) (91) 77
Transferred to income statements 109 94 16 203 115 77
Movement in foreign currency translation reserve:
Exchange differences on translation of
foreign operations1 143 38 large 181 (116) large
Transferred to income statements1 - (3) (100) (3) - -
Income tax on items taken to or transferred from equity:
Available-for-sale securities reserve (4) 13 large 9 (18) large
Cash flow hedge reserve (4) (9) (56) (13) (6) 117
Share of associates' other comprehensive income:
Recognised in equity (net of tax) - - - - 3 (100)
Transferred to income statements - - - - 9 (100)
Items that will not be reclassified subsequently
to profit or loss
Own credit adjustment on financial liabilities
designated at fair value (net of tax) 19 24 (21) 43 (164) large
Remeasurement of defined benefit obligation
recognised in equity (net of tax) 58 (13) large 45 190 (76)
Other comprehensive income for the
period (net of tax) 231 37 large 268 (6) large
Total comprehensive income for the period 4,130 4,237 (3) 8,367 7,991 5
Attributable to:
Owners of Westpac Banking Corporation 4,128 4,235 (3) 8,363 7,984 5
Non-controlling interests 2 2 - 4 7 (43)
Total comprehensive income for the period 4,130 4,237 (3) 8,367 7,991 5
The above consolidated statement of comprehensive income should be read in conjunction with the accompanying notes.
1 Half year March 2018 restated.

2018 Full Year financial results Consolidated financial statements
82 | Westpac Group 2018 Full Year Financial Results Announcement
4.4 Consolidated balance sheet1
Westpac Banking Corporation and its controlled entities
As at As at As at % Mov't % Mov't
30 Sept 31 March 30 Sept Sept 18 - Sept 18 -
$m Note 2018 2018 2017 Mar 18 Sept 17
Assets
Cash and balances with central banks 26,431 21,580 18,397 22 44
Receivables due from other financial institutions 5,790 3,977 7,128 46 (19)
Trading securities and financial assets designated
at fair value 22,134 20,627 25,324 7 (13)
Derivative financial instruments 24,101 26,904 24,033 (10) -
Available-for-sale securities 61,119 64,857 60,710 (6) 1
Loans 9 709,690 701,393 684,919 1 4
Life insurance assets 9,450 10,481 10,643 (10) (11)
Regulatory deposits with central banks overseas 1,355 1,318 1,048 3 29
Investments in associates1 115 80 60 44 92
Property and equipment 1,329 1,328 1,487 - (11)
Deferred tax assets 1,180 1,120 1,112 5 6
Intangible assets 11,763 11,693 11,652 1 1
Other assets 5,135 6,497 5,362 (21) (4)
Total assets 879,592 871,855 851,875 1 3
Liabilities
Payables due to other financial institutions 18,137 19,073 21,907 (5) (17)
Deposits and other borrowings 12 559,285 547,736 533,591 2 5
Other financial liabilities at fair value through
income statement 4,297 5,590 4,056 (23) 6
Derivative financial instruments 24,407 24,066 25,375 1 (4)
Debt issues 172,596 174,138 168,356 (1) 3
Current tax liabilities 296 299 308 (1) (4)
Life insurance liabilities 7,597 8,763 9,019 (13) (16)
Provisions2 1,928 1,416 1,639 36 18
Deferred tax liabilities 18 17 10 6 80
Other liabilities2 9,193 9,759 8,606 (6) 7
Total liabilities excluding loan capital 797,754 790,857 772,867 1 3
Loan capital 17,265 18,333 17,666 (6) (2)
Total liabilities 815,019 809,190 790,533 1 3
Net assets 64,573 62,665 61,342 3 5
Shareholders’ equity
Share capital:
Ordinary share capital 15 36,054 35,168 34,889 3 3
Treasury shares and RSP treasury shares 15 (493) (565) (495) (13) -
Reserves 15 1,077 890 794 21 36
Retained profits 27,883 27,122 26,100 3 7
Total equity attributable to owners of
Westpac Banking Corporation 64,521 62,615 61,288 3 5
Non-controlling interests 52 50 54 4 (4)
Total shareholders' equity and non-
controlling interests 64,573 62,665 61,342 3 5
The above consolidated balance sheet should be read in conjunction with the accompanying notes.
1 For further detail refer to Note 35 of the financial statements contained within the 2018 Westpac Group Annual Report. 2 Comparatives have been revised to reclassify conduct related provisions (refer to Notes 28 and 29 of the financial statements
contained within the 2018 Westpac Group Annual Report).

2018 Full Year financial results Consolidated financial statements
Westpac Group 2018 Full Year Financial Results Announcement | 83
4.5 Consolidated statement of changes in equity
Westpac Banking Corporation and its controlled entities
Total equity Total
attributable shareholders'
to owners equity and
Share of Westpac Non- non-
Capital Retained Banking controlling controlling
$m (Note 15) Reserves profits Corporation interests interests Balance at 1 October 2016 33,014 727 24,379 58,120 61 58,181
Net profit for the year - - 7,990 7,990 7 7,997 Net other comprehensive income for the year - (32) 26 (6) - (6)
Total comprehensive income for the year - (32) 8,016 7,984 7 7,991
Transactions in capacity as equity holders Dividends on ordinary shares1 - - (6,291) (6,291) - (6,291) Dividend reinvestment plan 1,452 - - 1,452 - 1,452 Other equity movements Share-based payment arrangements - 98 - 98 - 98 Exercise of employee share options and rights 11 - - 11 - 11 Purchase of shares (net of issue costs) (43) - - (43) - (43) Net (acquisition)/disposal of treasury shares (40) - - (40) - (40) Other - 1 (4) (3) (14) (17)
Total contributions and distributions 1,380 99 (6,295) (4,816) (14) (4,830)
Balance at 30 September 2017 34,394 794 26,100 61,288 54 61,342
Net profit for the year - - 8,095 8,095 4 8,099 Net other comprehensive income for the year - 180 88 268 - 268
Total comprehensive income for the year - 180 8,183 8,363 4 8,367
Transactions in capacity as equity holders Dividends on ordinary shares1 - - (6,400) (6,400) - (6,400) Dividend reinvestment plan 631 - - 631 - 631 Conversion of Convertible Preference Shares 566 - - 566 - 566 Other equity movements Share-based payment arrangements - 103 - 103 - 103 Exercise of employee share options and rights 3 - - 3 - 3 Purchase of shares (net of issue costs) (35) - - (35) - (35) Net (acquisition)/disposal of treasury shares 2 - - 2 - 2 Other - - - - (6) (6)
Total contributions and distributions 1,167 103 (6,400) (5,130) (6) (5,136)
Balance at 30 September 2018 35,561 1,077 27,883 64,521 52 64,573
The above consolidated statement of changes in equity should be read in conjunction with the accompanying notes.7
1 2018 comprises 2018 interim dividend 94 cents per share ($3,213 million) and 2017 final dividend 94 cents per share ($3,187 million)
(2017: 2017 interim dividend 94 cents per share ($3,150 million) and 2016 final dividend 94 cents per share ($3,141 million)), all fully franked at 30%.

2018 Full Year financial results Consolidated financial statements
84 | Westpac Group 2018 Full Year Financial Results Announcement
4.5 Consolidated statement of changes in equity (continued)
Westpac Banking Corporation and its controlled entities
Total equity Total
attributable shareholders'
to owners equity and
Share of Westpac Non- non-
Capital Retained Banking controlling controlling
$m (Note 15) Reserves profits Corporation interests interests Balance at 1 October 2017 34,394 794 26,100 61,288 54 61,342
Net profit for the period - - 4,198 4,198 2 4,200 Net other comprehensive income for the period - 26 11 37 - 37
Total comprehensive income for the period - 26 4,209 4,235 2 4,237
Transactions in capacity as equity holders Dividends on ordinary shares1 - - (3,187) (3,187) - (3,187) Dividend reinvestment plan 310 - - 310 - 310 Other equity movements Share-based payment arrangements - 69 - 69 - 69 Exercise of employee share options and rights - - - - - - Purchase of shares (net of issue costs) (31) - - (31) - (31) Net (acquisition)/disposal of treasury shares (70) - - (70) - (70) Other - 1 - 1 (6) (5)
Total contributions and distributions 209 70 (3,187) (2,908) (6) (2,914)
Balance at 31 March 2018 34,603 890 27,122 62,615 50 62,665
Net profit for the period - - 3,897 3,897 2 3,899 Net other comprehensive income for the period - 154 77 231 - 231
Total comprehensive income for the period - 154 3,974 4,128 2 4,130
Transactions in capacity as equity holders Dividends on ordinary shares1 - - (3,213) (3,213) - (3,213) Dividend reinvestment plan 321 - - 321 - 321 Conversion of Convertible Preference Shares 566 - - 566 - 566 Other equity movements Share-based payment arrangements - 34 - 34 - 34 Exercise of employee share options and rights 3 - - 3 - 3 Purchase of shares (net of issue costs) (4) - - (4) - (4) Net (acquisition)/disposal of treasury shares 72 - - 72 - 72 Other - (1) - (1) - (1)
Total contributions and distributions 958 33 (3,213) (2,222) - (2,222)
Balance at 30 September 2018 35,561 1,077 27,883 64,521 52 64,573
The above consolidated statement of changes in equity should be read in conjunction with the accompanying notes.
1 Second Half 2018 reflects the 2018 interim dividend 94 cents per share ($3,213 million) and First Half 2018 reflects the 2017 final
dividend 94 cents per share ($3,187), all fully franked at 30%.

2018 Full Year financial results Consolidated financial statements
Westpac Group 2018 Full Year Financial Results Announcement | 85
4.6 Consolidated cash flow statement
Westpac Banking Corporation and its controlled entities
% Mov't % Mov't Half Year Half Year Sept 18 - Full Year Full Year Sept 18 - $m Note Sept 18 March 18 Mar 18 Sept 18 Sept 17 Sept 17 Cash flows from operating activities Interest received 16,641 15,998 4 32,639 31,133 5 Interest paid (7,969) (7,820) 2 (15,789) (15,415) 2 Dividends received excluding life business 8 1 large 9 27 (67) Other non-interest income received 2,196 2,901 (24) 5,097 5,064 1 Operating expenses paid (3,681) (4,310) (15) (7,991) (7,966) - Income tax paid excluding life business (1,792) (1,793) - (3,585) (3,388) 6 Life business:
Receipts from policyholders and customers 1,062 946 12 2,008 2,239 (10) Interest and other items of similar nature 2 15 (87) 17 24 (29) Dividends received 559 83 large 642 433 48 Payments to policyholders and suppliers (1,295) (794) 63 (2,089) (1,861) 12 Income tax paid (92) (51) 80 (143) (164) (13)
Cash flows from operating activities before changes in operating assets and liabilities 5,639 5,176 9 10,815 10,126 7 Net (increase)/decrease in:
Trading securities and financial assets designated at fair value (1,155) 4,982 large 3,827 (5,054) large Loans (9,976) (14,764) (32) (24,740) (26,815) (8) Receivables due from other financial institutions (1,567) 3,245 large 1,678 2,653 (37) Life insurance assets and liabilities (142) (88) 61 (230) 219 large Regulatory deposits with central banks overseas (53) (250) (79) (303) 308 large Derivative financial instruments 9,684 (1,100) large 8,584 (5,042) large Other assets 286 (126) large 160 200 (20)
Net increase/(decrease) in: Other financial liabilities at fair value through income statement (1,283) 1,526 large 243 (681) large Deposits and other borrowings 11,920 12,008 (1) 23,928 23,062 4 Payables due to other financial institutions (1,107) (2,965) (63) (4,072) 3,859 large Other liabilities (136) 48 large (88) (15) large
Net cash provided by/(used in) operating activities 16 12,110 7,692 57 19,802 2,820 large Cash flows from investing activities Proceeds from available-for-sale securities 12,383 11,495 8 23,878 25,717 (7) Purchase of available-for-sale securities (8,801) (15,575) (43) (24,376) (27,028) (10) Proceeds from disposal of controlled entities, net of cash disposed - 9 (100) 9 - - Proceeds from sale of associates - - - - 630 (100) Purchase of associates (17) (13) 31 (30) (52) (42) Proceeds from disposal of property and equipment 28 63 (56) 91 65 40 Purchase of property and equipment (215) (95) 126 (310) (264) 17 Purchase of intangible assets (493) (389) 27 (882) (766) 15 Net cash provided by/(used in) investing activities 2,885 (4,505) large (1,620) (1,698) (5) Cash flows from financing activities Issue of loan capital (net of issue costs) 724 1,618 (55) 2,342 4,437 (47) Redemption of loan capital (1,362) (1,025) 33 (2,387) (2,188) 9 Net increase/(decrease) in debt issues (7,366) 2,124 large (5,242) 3,249 large Proceeds from exercise of employee options 3 - - 3 11 (73) Purchase of shares on exercise of employee options and rights (4) (4) - (8) (17) (53) Shares purchased for delivery of employee share plan - (27) (100) (27) (27) - Purchase of RSP treasury shares (1) (70) (99) (71) (68) 4 Net sale/(purchase) of other treasury shares 73 - - 73 7 large Payment of dividends (2,892) (2,877) 1 (5,769) (4,839) 19 Payment of distributions to non-controlling interests - (6) (100) (6) (13) (54) Net cash provided by/(used in) financing activities (10,825) (267) large (11,092) 552 large Net increase/(decrease) in cash and cash equivalents 4,170 2,920 43 7,090 1,674 large Effect of exchange rate changes on cash and cash equivalents 681 263 159 944 (292) large Cash and cash equivalents as at the beginning of the period 21,580 18,397 17 18,397 17,015 8 Cash and cash equivalents as at the end of the period 26,431 21,580 22 26,431 18,397 44
The above consolidated cash flow statement should be read in conjunction with the accompanying notes.
Details of the reconciliation of net cash provided by/(used in) operating activities to net profit are provided in Note 16.

2018 Full Year financial results Notes to the consolidated financial statements
86 | Westpac Group 2018 Full Year Financial Results Announcement
4.7 Notes to the consolidated financial statements
Note 1. Basis of preparation
The accounting policies and methods of computation adopted in the financial year were in accordance with the requirements for an authorised deposit-taking institution under the Banking Act 1959 (as amended), Australian Accounting Standards (AAS) and Interpretations as issued by the Australian Accounting Standards Board and the Corporations Act 2001. Westpac’s financial statements also comply with International Financial Reporting Standards as issued by the International Accounting Standards Board. Where necessary, comparative figures have been adjusted to conform to changes in presentation in the current period. All amounts have been rounded to the nearest million dollars unless otherwise stated.

2018 Full Year financial results Notes to the consolidated financial statements
Westpac Group 2018 Full Year Financial Results Announcement | 87
Note 2. Segment reporting
Operating segments are presented on a basis consistent with information provided internally to Westpac's key decision makers and reflects the management of the business, rather than the legal structure of the Group.
Internally, Westpac uses 'cash earnings' in assessing the financial performance of its divisions. Management believes this allows the Group to:
more effectively assess current year performance against prior years;
compare performance across business divisions; and
compare performance across peer companies.
Cash earnings is viewed as a measure of the level of profit that is generated by ongoing operations and is therefore considered in assessing distributions, including dividends. Cash earnings is neither a measure of cash flow nor net profit determined on a cash accounting basis, as it includes both cash and non-cash adjustments to statutory net profit.
To determine cash earnings, three categories of adjustments are made to statutory results:
material items that key decision makers at the Westpac Group believe do not reflect ongoing operations;
items that are not considered when dividends are recommended, such as the amortisation of intangibles, impact of Treasury shares and economic hedging; and
accounting reclassifications between individual line items that do not impact statutory results.
Internal charges and transfer pricing adjustments have been reflected in the performance of each operating segment. Inter-segment pricing is determined on an arm's length basis.
Reportable operating segments
The operating segments are defined by the customers they service and the services they provide:
Consumer Bank (CB):
- responsible for sales and service of banking and financial products and services;
- customer base is consumer in Australia; and
- operates under the Westpac, St.George, BankSA, Bank of Melbourne and RAMS brands.
Business Bank (BB):
- responsible for sales and service of banking and financial products and services;
- customer base is SME and commercial business customers in Australia for facilities up to approximately $150 million; and
- operates under the Westpac, St.George, BankSA and Bank of Melbourne brands.
BT Financial Group (Australia) (BTFG):
- Westpac’s Australian wealth management and insurance division;
- services include the manufacturing and distribution of investment, superannuation and retirement products, wealth administration platforms, private wealth, margin lending and equities broking;
- BTFG’s insurance business covers the manufacturing and distribution of life, general and lenders mortgage insurance;
- in addition to the BT brand, BTFG operates a range of financial services brands along with the banking brands of Westpac, St.George, Bank of Melbourne and BankSA for Private Wealth and Insurance.
Westpac Institutional Bank (WIB):
- Westpac’s institutional financial services division delivering a broad range of financial products and services;
- services include transactional banking, financial and debt capital markets, specialised capital and alternative investment solutions;
- customer base includes commercial, corporate, institutional and government customers;
- customers are supported throughout Australia, as well as via branches and subsidiaries located in New Zealand, US, UK and Asia; and

2018 Full Year financial results Notes to the consolidated financial statements
88 | Westpac Group 2018 Full Year Financial Results Announcement
Note 2. Segment reporting (continued)
- also responsible for Westpac Pacific, providing a range of banking services in Fiji and Papua New Guinea.
Westpac New Zealand:
- responsible for sales and service of banking, wealth and insurance products to customers in New Zealand;
- customer base includes consumers, business and institutional customers; and
- operates under the Westpac brand for banking products, the Westpac Life brand for life insurance products and the BT brand for wealth products.
Group Businesses include:
- Treasury, which is responsible for the management of the Group’s balance sheet including wholesale funding, capital and management of liquidity. Treasury also manages the interest rate risk and foreign exchange risks inherent in the balance sheet, including managing the mismatch between Group assets and liabilities. Treasury’s earnings are primarily sourced from managing the Group’s balance sheet and interest rate risk (excluding Westpac New Zealand) within set risk limits;
- Group Technology1, which comprises functions for the Australian businesses, is responsible for technology strategy and architecture, infrastructure and operations, applications development and business integration;
- Core Support2, which comprises functions performed centrally, including Australian banking operations, property services, strategy, finance, risk, compliance, legal, human resources and customer and corporate relations; and
- Group Businesses also includes earnings on capital not allocated to divisions, accounting entries for certain intra-group transactions that facilitate the presentation of the performance of the Group’s operating segments, earnings from non-core asset sales, earnings and costs associated with the Group’s fintech investments and certain other head office items such as centrally held provisions.
Revisions to segment allocations
In 2018, Westpac implemented a number of changes to the presentation of its divisional financial information. These changes have no impact on the Group’s overall results or balance sheet but impact divisional results and balance sheets. Comparative divisional financial information has been restated for these changes.
The changes include updates to the methodologies to allocate certain costs, revenues and capital to the divisions. These changes can be summarised as:
1. Allocating additional capital from Group Businesses to operating divisions, following greater clarity from APRA on updates to its capital framework;
2. Updating the Group’s cost of funds transfer pricing methodology, including the allocation of revenue from balance sheet management activities;
3. Realigning divisional earnings and balance sheet disclosures for recent customer transfers; and
4. Refining expense allocations to improve the allocation of support costs to divisions.
1 Costs are fully allocated to other divisions in the Group. 2 Costs are partially allocated to other divisions in the Group, with costs attributed to enterprise activity retained in Group Businesses.

2018 Full Year financial results Notes to the consolidated financial statements
Westpac Group 2018 Full Year Financial Results Announcement | 89
Note 2. Segment reporting (continued)
The tables below present the segment results on a cash earnings basis for the Group:
Half Year Sept 18
Westpac
BT Financial Westpac New
Consumer Business Group Institutional Zealand Group
$m Bank Bank (Australia) Bank (A$) Businesses Group
Net interest income 3,708 2,044 293 741 877 375 8,038
Non-interest income 369 600 750 807 214 22 2,762
Net operating income before operating
expenses and impairment charges 4,077 2,644 1,043 1,548 1,091 397 10,800
Operating expenses (1,812) (946) (690) (771) (431) (282) (4,932)
Impairment (charges) / benefits (218) (154) (3) 21 22 15 (317)
Profit before income tax 2,047 1,544 350 798 682 130 5,551
Income tax expense (624) (465) (109) (261) (189) (87) (1,735)
Net profit attributable to non-controlling interests - - - (2) - - (2)
Cash earnings for the period 1,423 1,079 241 535 493 43 3,814
Net cash earnings adjustments - - (73) - 3 153 83
Net profit for the period attributable to
owners of Westpac Banking Corporation 1,423 1,079 168 535 496 196 3,897
Total assets 392,495 156,523 34,923 102,380 82,424 110,847 879,592
Total liabilities 212,472 114,137 42,500 126,620 72,078 247,212 815,019
Half Year March 18
Westpac
BT Financial Westpac New
Consumer Business Group Institutional Zealand Group
$m Bank Bank (Australia) Bank (A$) Businesses Group
Net interest income 4,040 2,021 285 675 843 437 8,301
Non-interest income 377 589 898 749 224 13 2,850
Net operating income before operating
expenses and impairment charges 4,417 2,610 1,183 1,424 1,067 450 11,151
Operating expenses (1,730) (930) (601) (675) (429) (289) (4,654)
Impairment (charges) / benefits (233) (137) (3) 17 (24) (13) (393)
Profit before income tax 2,454 1,543 579 766 614 148 6,104
Income tax expense (737) (463) (175) (212) (173) (91) (1,851)
Net profit attributable to non-controlling interests - - - (3) - 1 (2)
Cash earnings for the period 1,717 1,080 404 551 441 58 4,251
Net cash earnings adjustments (15) (2) - - 10 (46) (53)
Net profit for the period attributable to
owners of Westpac Banking Corporation 1,702 1,078 404 551 451 12 4,198
Total assets 385,959 154,969 35,806 104,766 84,285 106,070 871,855
Total liabilities 203,801 111,486 42,058 124,130 73,801 253,914 809,190

2018 Full Year financial results Notes to the consolidated financial statements
90 | Westpac Group 2018 Full Year Financial Results Announcement
Note 2. Segment reporting (continued)
Full Year Sept 18
Westpac
BT Financial Westpac New
Consumer Business Group Institutional Zealand Group
$m Bank Bank (Australia) Bank (A$) Businesses Group
Net interest income 7,748 4,065 578 1,416 1,720 812 16,339
Non-interest income 746 1,189 1,648 1,556 438 35 5,612
Net operating income before operating
expenses and impairment charges 8,494 5,254 2,226 2,972 2,158 847 21,951
Operating expenses (3,542) (1,876) (1,291) (1,446) (860) (571) (9,586)
Impairment (charges) / benefits (451) (291) (6) 38 (2) 2 (710)
Profit before income tax 4,501 3,087 929 1,564 1,296 278 11,655
Income tax expense (1,361) (928) (284) (473) (362) (178) (3,586)
Net profit attributable to non-controlling interests - - - (5) - 1 (4)
Cash earnings for the period 3,140 2,159 645 1,086 934 101 8,065
Net cash earnings adjustments (15) (2) (73) - 13 107 30
Net profit for the period attributable to
owners of Westpac Banking Corporation 3,125 2,157 572 1,086 947 208 8,095
Total assets 392,495 156,523 34,923 102,380 82,424 110,847 879,592
Total liabilities 212,472 114,137 42,500 126,620 72,078 247,212 815,019
Full Year Sept 17¹
Westpac
BT Financial Westpac New
Consumer Business Group Institutional Zealand Group
$m Bank Bank (Australia) Bank (A$) Businesses Group
Net interest income 7,638 3,885 511 1,328 1,629 713 15,704
Non-interest income 813 1,141 1,744 1,707 480 (33) 5,852
Net operating income before operating
expenses and impairment charges 8,451 5,026 2,255 3,035 2,109 680 21,556
Operating expenses (3,378) (1,818) (1,199) (1,351) (903) (456) (9,105)
Impairment (charges) / benefits (565) (343) (4) (56) 72 43 (853)
Profit before income tax 4,508 2,865 1,052 1,628 1,278 267 11,598
Income tax expense (1,353) (862) (316) (462) (361) (175) (3,529)
Net profit attributable to non-controlling interests - - - (7) - - (7)
Cash earnings for the period 3,155 2,003 736 1,159 917 92 8,062
Net cash earnings adjustments (116) (10) 160 - (14) (92) (72)
Net profit for the period attributable to
owners of Westpac Banking Corporation 3,039 1,993 896 1,159 903 - 7,990
Total assets 377,457 153,078 35,237 103,080 81,285 101,738 851,875
Total liabilities 202,689 111,385 41,431 118,875 71,432 244,721 790,533
1 Divisional comparatives have been restated.

2018 Full Year financial results Notes to the consolidated financial statements
Westpac Group 2018 Full Year Financial Results Announcement | 91
Note 3. Net interest income
% Mov't % Mov't
Half Year Half Year Sept 18 - Full Year Full Year Sept 18 -
$m Sept 18 March 18 Mar 18 Sept 18 Sept 17 Sept 17
Interest income
Cash and balances with central banks 185 140 32 325 241 35
Receivables due from other financial institutions 59 49 20 108 110 (2)
Net ineffectiveness on qualifying hedges (5) (13) (62) (18) (22) (18)
Trading securities and financial assets
designated at fair value 267 275 (3) 542 558 (3)
Available-for-sale securities 984 930 6 1,914 1,795 7
Loans 14,943 14,678 2 29,621 28,504 4
Regulatory deposits with central banks overseas 14 9 56 23 17 35
Other interest income 34 22 55 56 29 93
Total interest income 16,481 16,090 2 32,571 31,232 4
Interest expense
Payables due to other financial institutions (166) (153) 8 (319) (279) 14
Deposits and other borrowings (4,653) (4,368) 7 (9,021) (8,868) 2
Trading liabilities (385) (574) (33) (959) (2,065) (54)
Debt issues (2,392) (2,088) 15 (4,480) (3,585) 25
Loan capital (398) (376) 6 (774) (693) 12
Bank Levy (192) (186) 3 (378) (95) large
Other interest expense (68) (67) 1 (135) (131) 3
Total interest expense (8,254) (7,812) 6 (16,066) (15,716) 2
Total net interest income 8,227 8,278 (1) 16,505 15,516 6

2018 Full Year financial results Notes to the consolidated financial statements
92 | Westpac Group 2018 Full Year Financial Results Announcement
Note 4. Non-interest income
% Mov't % Mov't
Half Year Half Year Sept 18 - Full Year Full Year Sept 18 -
$m Note Sept 18 March 18 Mar 18 Sept 18 Sept 17 Sept 17
Fees and commissions
Facility fees 668 679 (2) 1,347 1,333 1
Transaction fees and commissions 552 553 - 1,105 1,193 (7)
Other non-risk fee income (18) 116 large 98 229 (57)
Total fees and commissions 1,202 1,348 (11) 2,550 2,755 (7)
Wealth management and insurance income
Life insurance and funds management
net operating income1 980 845 16 1,825 1,590 15
General insurance and lenders mortgage insurance
net operating income 130 106 23 236 210 12
Total wealth management and insurance income 1,110 951 17 2,061 1,800 15
Trading income 458 487 (6) 945 1,202 (21)
Other income
Dividends received from other entities 2 1 100 3 2 50
Net gain on disposal of associates2 - - - - 279 (100)
Net gain on disposal of assets 14 10 40 24 6 large
Net gain/(loss) on hedging overseas operations - - - - - -
Net gain/(loss) on derivatives held for
risk management purposes3 17 (9) large 8 52 (85)
Net gain/(loss) on financial instruments
designated at fair value 12 26 (54) 38 11 large
Net gain/(loss) on disposal of controlled entities 16 - (9) (100) (9) - -
Rental income on operating leases 47 60 (22) 107 143 (25)
Share of associates' net profit/(loss) (7) (3) 133 (10) 17 large
Other4 (102) 13 large (89) 19 large
Total other income (17) 89 large 72 529 (86)
Total non-interest income 2,753 2,875 (4) 5,628 6,286 (10)
1 Wealth management and insurance income includes policy holder tax recoveries. 2 On 26 May 2017, the Group sold 60 million Pendal Group Limited shares (formerly BT Investment Management Limited) (19% of Pendal’s shares on issue). 3 Income from derivatives held for risk management purposes reflects the impact of economic hedges of foreign currency capital and earnings. 4 Other includes $104 million of impairment on the remaining shareholdings of Pendal Group Limited in 2018.

2018 Full Year financial results Notes to the consolidated financial statements
Westpac Group 2018 Full Year Financial Results Announcement | 93
Note 5. Operating expenses
% Mov't % Mov't
Half Year Half Year Sept 18 - Full Year Full Year Sept 18 -
$m Sept 18 March 18 Mar 18 Sept 18 Sept 17 Sept 17
Staff expenses
Employee remuneration, entitlements and on-costs 2,173 2,119 3 4,292 4,133 4
Superannuation expense 189 197 (4) 386 380 2
Share-based payments 47 48 (2) 95 113 (16)
Restructuring costs 80 34 135 114 75 52
Total staff expenses 2,489 2,398 4 4,887 4,701 4
Occupancy expenses
Operating lease rentals 313 319 (2) 632 648 (2)
Depreciation of property and equipment 114 131 (13) 245 291 (16)
Other 85 71 20 156 134 16
Total occupancy expenses 512 521 (2) 1,033 1,073 (4)
Technology expenses
Amortisation and impairment of software assets 317 303 5 620 628 (1)
Depreciation and impairment of IT equipment 68 73 (7) 141 158 (11)
Technology services 380 341 11 721 639 13
Software maintenance and licenses 157 185 (15) 342 313 9
Telecommunications 107 102 5 209 190 10
Data processing 39 38 3 77 80 (4)
Total technology expenses 1,068 1,042 2 2,110 2,008 5
Other expenses
Professional and processing services1 439 385 14 824 755 9
Amortisation and impairment of intangible assets and
deferred expenditure 95 43 121 138 192 (28)
Postage and stationery 87 95 (8) 182 217 (16)
Advertising 80 93 (14) 173 155 12
Credit card loyalty programs 56 70 (20) 126 152 (17)
Non-lending losses 93 40 133 133 73 82
Other expenses 48 38 26 86 108 (20)
Total other expenses 898 764 18 1,662 1,652 1
Total operating expenses 4,967 4,725 5 9,692 9,434 3
1 Professional and processing services relates to:
- services provided by external suppliers including items such as cash handling and security services, marketing costs and research and recruitment fees (Full Year 2018: $271 million; Full Year 2017 $268 million);
- operations processing (Full Year 2018: $195 million; Full Year 2017 $184 million); - consultants (Full Year 2018: $151 million; Full Year 2017 $162 million); - credit assessment (Full Year 2018: $58 million; Full Year 2017 $53 million); - legal and audit fees (Full Year 2018: $111 million; Full Year 2017 $61 million); and - regulatory fees and share market related costs (Full Year 2018: $38 million; Full Year 2017 $27 million).

2018 Full Year financial results Notes to the consolidated financial statements
94 | Westpac Group 2018 Full Year Financial Results Announcement
Note 6. Income tax
The income tax expense is reconciled to the profit before income tax as follows:
% Mov't % Mov't
Half Year Half Year Sept 18 - Full Year Full Year Sept 18 -
$m Sept 18 March 18 Mar 18 Sept 18 Sept 17 Sept 17
Profit before income tax 5,696 6,035 (6) 11,731 11,515 2
Tax at the Australian company tax rate of 30% 1,708 1,811 (6) 3,519 3,455 2
The effect of amounts which are not
deductible/(assessable) in calculating
taxable income
Hybrid capital distributions 36 33 9 69 64 8
Life insurance:
Tax adjustment on policyholder earnings 16 8 100 24 8 200
Adjustment for life business tax rates (1) - - (1) (1) -
Dividend adjustments - (1) (100) (1) (3) (67)
Other non-assessable items (5) - - (5) (3) 67
Other non-deductible items 47 17 176 64 32 100
Adjustment for overseas tax rates (14) (14) - (28) (30) (7)
Income tax (over)/under provided in prior periods 7 2 large 9 4 125
Other items 3 (21) large (18) (8) 125
Total income tax expense 1,797 1,835 (2) 3,632 3,518 3
Effective income tax rate 31.55% 30.41% 114bps 30.96% 30.55% 41bps
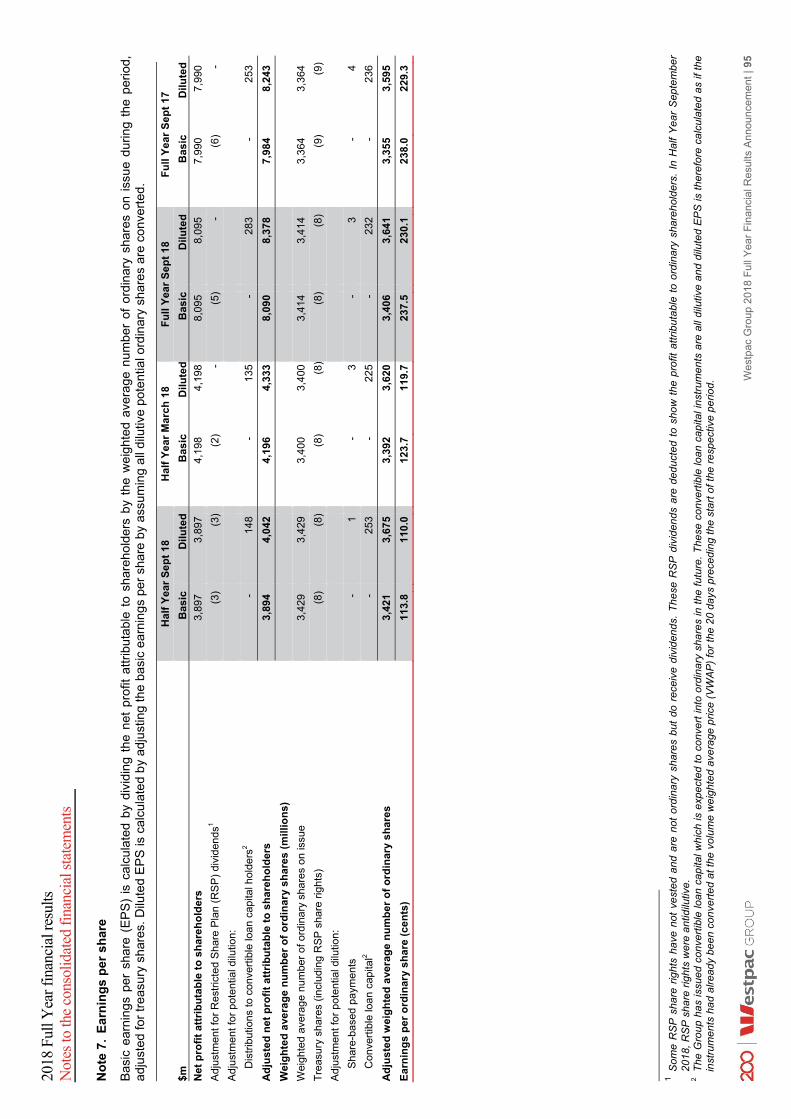
2018
Ful
l Yea
r fin
anci
al re
sults
N
otes
to th
e co
nsol
idat
ed fi
nanc
ial s
tate
men
ts
Wes
tpac
Gro
up 2
018
Ful
l Yea
r F
inan
cial
Res
ults
Ann
ounc
emen
t | 9
5
No
te 7
. E
arn
ing
s p
er s
har
e B
asic
ear
ning
s pe
r sh
are
(EP
S)
is c
alcu
late
d by
div
idin
g th
e ne
t pr
ofit
attr
ibut
able
to
shar
ehol
ders
by
the
wei
ghte
d av
era
ge n
um
ber
of o
rdin
ary
shar
es o
n is
sue
dur
ing
the
perio
d,
adju
sted
for
trea
sury
sha
res.
Dilu
ted
EP
S is
cal
cula
ted
by
adju
stin
g th
e b
asic
ear
ning
s pe
r sh
are
by a
ssum
ing
all d
ilutiv
e po
tent
ial o
rdin
ary
shar
es a
re c
onve
rted
.
H
alf
Yea
r S
ep
t 1
8 H
alf
Yea
r M
arc
h 1
8 F
ull
Yea
r S
ep
t 1
8 F
ull
Yea
r S
ep
t 1
7
$m
Bas
ic
Dilu
ted
B
asic
D
ilute
dB
asic
D
ilute
d
Bas
ic
Dilu
ted
Net
pro
fit
attr
ibu
tab
le t
o s
har
eh
old
ers
3,
897
3,
897
4,
198
4,
198
8,09
5
8,09
5
7,99
0
7,99
0
Adj
ustm
ent f
or R
estr
icte
d S
hare
Pla
n (R
SP
) di
vide
nds1
(3)
(3
)
(2)
- (5
)
-
(6)
-
Adj
ustm
ent f
or p
oten
tial d
ilutio
n:
Dis
trib
utio
ns to
con
vert
ible
loan
cap
ital h
olde
rs2
-
148
-
13
5 -
28
3
-
253
Ad
jus
ted
net
pro
fit
att
rib
uta
ble
to
sh
areh
old
ers
3,
894
4,
042
4,
196
4,
333
8,09
0
8,37
8
7,98
4
8,24
3
Wei
gh
ted
ave
rag
e n
um
ber
of
ord
inar
y s
har
es (
mill
ion
s)
Wei
ghte
d av
erag
e nu
mbe
r of
ord
inar
y sh
are
s on
issu
e 3,
429
3,
429
3,
400
3,
400
3,41
4
3,41
4
3,36
4
3,36
4
Tre
asur
y sh
ares
(in
clud
ing
RS
P s
hare
rig
hts)
(8
)
(8)
(8
) (8
)(8
)
(8)
(9
) (9
)
Adj
ustm
ent f
or p
oten
tial d
ilutio
n:
Sha
re-b
ased
pa
ymen
ts
-
1
-
3 -
3
-
4
Con
vert
ible
loan
cap
ital2
-
253
-
22
5 -
23
2
-
236
Ad
jus
ted
wei
gh
ted
ave
rag
e n
um
ber
of
ord
inar
y s
har
es
3,42
1
3,67
5
3,39
2
3,62
0 3,
406
3,
641
3,
355
3,
595
Ear
nin
gs
per
ord
inar
y s
har
e (c
en
ts)
113.
8
110.
0
123.
7
119.
7 23
7.5
23
0.1
23
8.0
22
9.3
1 S
ome
RS
P s
hare
rig
hts
have
not
ves
ted
and
are
not
ord
ina
ry s
hare
s bu
t do
rec
eive
div
iden
ds.
Th
ese
RS
P d
ivid
ends
are
ded
ucte
d to
sho
w t
he p
rofit
attr
ibut
able
to
ord
inar
y sh
areh
olde
rs.
In H
alf
Ye
ar S
epte
mb
er
2018
, RS
P s
hare
rig
hts
wer
e an
tidilu
tive.
2 T
he G
rou
p ha
s is
sued
con
vert
ible
loan
cap
ital w
hic
h is
exp
ecte
d to
con
vert
into
ord
inar
y sh
ares
in t
he f
utur
e. T
hese
con
vert
ible
loan
cap
ital i
nstr
umen
ts a
re a
ll di
lutiv
e an
d di
lute
d E
PS
is t
here
fore
cal
cula
ted
as if
the
in
stru
men
ts h
ad
alre
ady
been
con
vert
ed a
t the
vol
um
e w
eigh
ted
ave
rage
pric
e (V
WA
P)
for
the
20 d
ays
prec
edin
g th
e st
art o
f the
res
pect
ive
perio
d.
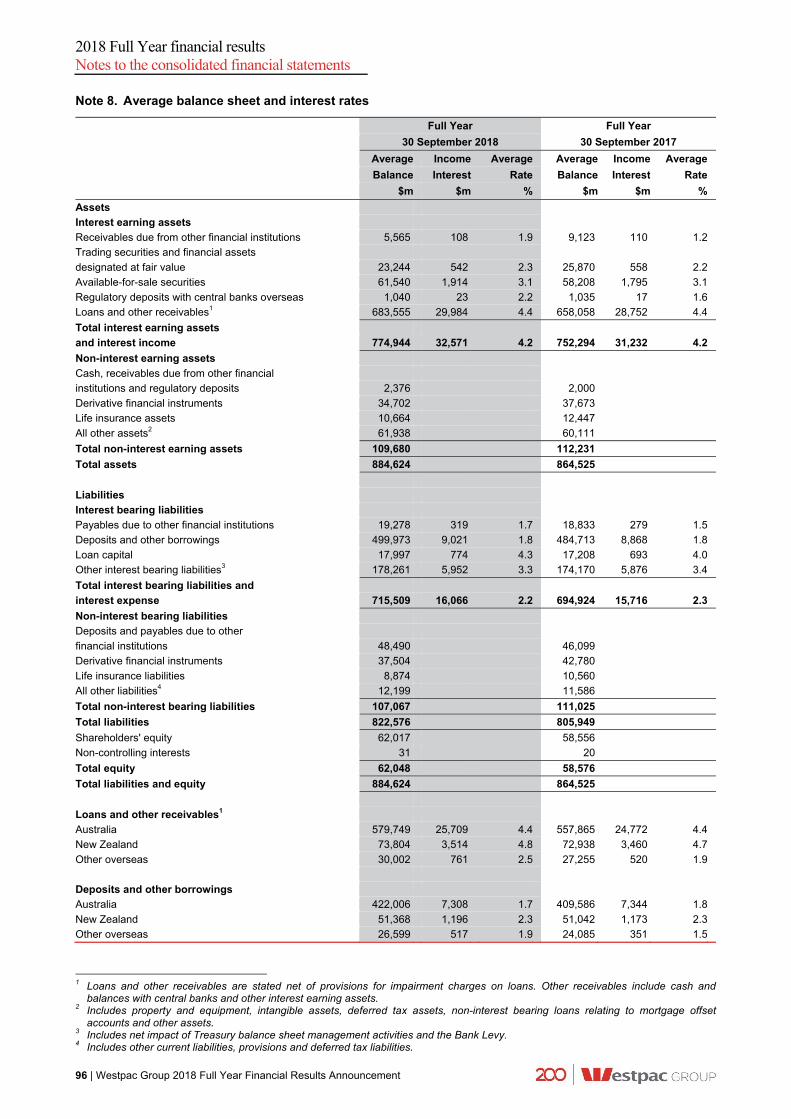
2018 Full Year financial results Notes to the consolidated financial statements
96 | Westpac Group 2018 Full Year Financial Results Announcement
Note 8. Average balance sheet and interest rates
Full Year Full Year
30 September 2018 30 September 2017
Average Income Average Average Income Average
Balance Interest Rate Balance Interest Rate
$m $m % $m $m %
Assets
Interest earning assets
Receivables due from other financial institutions 5,565 108 1.9 9,123 110 1.2
Trading securities and financial assets
designated at fair value 23,244 542 2.3 25,870 558 2.2
Available-for-sale securities 61,540 1,914 3.1 58,208 1,795 3.1
Regulatory deposits with central banks overseas 1,040 23 2.2 1,035 17 1.6
Loans and other receivables1 683,555 29,984 4.4 658,058 28,752 4.4
Total interest earning assets
and interest income 774,944 32,571 4.2 752,294 31,232 4.2
Non-interest earning assets
Cash, receivables due from other financial
institutions and regulatory deposits 2,376 2,000
Derivative financial instruments 34,702 37,673
Life insurance assets 10,664 12,447
All other assets2 61,938 60,111
Total non-interest earning assets 109,680 112,231
Total assets 884,624 864,525
Liabilities
Interest bearing liabilities
Payables due to other financial institutions 19,278 319 1.7 18,833 279 1.5
Deposits and other borrowings 499,973 9,021 1.8 484,713 8,868 1.8
Loan capital 17,997 774 4.3 17,208 693 4.0
Other interest bearing liabilities3 178,261 5,952 3.3 174,170 5,876 3.4
Total interest bearing liabilities and
interest expense 715,509 16,066 2.2 694,924 15,716 2.3
Non-interest bearing liabilities
Deposits and payables due to other
financial institutions 48,490 46,099
Derivative financial instruments 37,504 42,780
Life insurance liabilities 8,874 10,560
All other liabilities4 12,199 11,586
Total non-interest bearing liabilities 107,067 111,025
Total liabilities 822,576 805,949
Shareholders' equity 62,017 58,556
Non-controlling interests 31 20
Total equity 62,048 58,576
Total liabilities and equity 884,624 864,525
Loans and other receivables1
Australia 579,749 25,709 4.4 557,865 24,772 4.4
New Zealand 73,804 3,514 4.8 72,938 3,460 4.7
Other overseas 30,002 761 2.5 27,255 520 1.9
Deposits and other borrowings
Australia 422,006 7,308 1.7 409,586 7,344 1.8
New Zealand 51,368 1,196 2.3 51,042 1,173 2.3
Other overseas 26,599 517 1.9 24,085 351 1.5
1 Loans and other receivables are stated net of provisions for impairment charges on loans. Other receivables include cash and
balances with central banks and other interest earning assets. 2 Includes property and equipment, intangible assets, deferred tax assets, non-interest bearing loans relating to mortgage offset
accounts and other assets. 3 Includes net impact of Treasury balance sheet management activities and the Bank Levy. 4 Includes other current liabilities, provisions and deferred tax liabilities.

2018 Full Year financial results Notes to the consolidated financial statements
Westpac Group 2018 Full Year Financial Results Announcement | 97
Note 9. Loans
As at As at As at % Mov't % Mov't
30 Sept 31 March 30 Sept Sept 18 - Sept 18 -
$m Note 2018 2018 2017 Mar 18 Sept 17
Australia
Housing 444,741 437,239 427,167 2 4
Personal (loans and cards) 21,079 21,789 21,952 (3) (4)
Business 154,347 151,904 150,542 2 3
Margin lending 1,830 1,872 1,885 (2) (3)
Other 88 91 100 (3) (12)
Total Australia 622,085 612,895 601,646 1 3
New Zealand
Housing 44,772 44,974 43,198 - 4
Personal (loans and cards) 1,793 1,922 1,856 (7) (3)
Business 27,701 28,068 26,667 (1) 4
Other 76 76 85 - (11)
Total New Zealand 74,342 75,040 71,806 (1) 4
Other overseas
Trade finance 3,600 3,942 2,818 (9) 28
Other 12,477 12,429 11,515 - 8
Total other overseas 16,077 16,371 14,333 (2) 12
Total loans 712,504 704,306 687,785 1 4
Provisions for impairment charges on loans 10 (2,814) (2,913) (2,866) (3) (2)
Total net loans1,2 709,690 701,393 684,919 1 4
1 Total net loans include securitised loans of $7,135 million as at 30 September 2018 ($7,436 million as at 31 March 2018 and
$7,651 million as at 30 September 2017). The level of securitised loans excludes loans where Westpac is the holder of related debt securities.
2 Total net loans include assets pledged for the covered bond programs of $35,175 million as at 30 September 2018 ($34,106 million as at 31 March 2018 and $35,473 million as at 30 September 2017).

2018 Full Year financial results Notes to the consolidated financial statements
98 | Westpac Group 2018 Full Year Financial Results Announcement
Note 10. Provisions for impairment charges
Half Year Half Year Full Year Full Year
$m Sept 18 March 18 Sept 18 Sept 17
Individually assessed provisions Opening balance 471 480 480 869 Provisions raised 198 173 371 610 Write-backs (83) (67) (150) (288) Write-offs (165) (104) (269) (688) Interest adjustment (4) (7) (11) (16) Other adjustments 5 (4) 1 (7)
Closing balance 422 471 422 480
Collectively assessed provisions Opening balance 2,694 2,639 2,639 2,733 Provisions raised 281 387 668 699 Write-offs (428) (430) (858) (968) Interest adjustment 90 89 179 188
Other adjustments (6) 9 3 (13)
Closing balance 2,631 2,694 2,631 2,639
Total provisions for impairment charges on loans
and credit commitments 3,053 3,165 3,053 3,119
Less: provisions for credit commitments (239) (252) (239) (253)
Total provisions for impairment charges on loans 2,814 2,913 2,814 2,866
Half Year Half Year Full Year Full Year
$m Sept 18 March Sept 18 Sept 17
Reconciliation of impairment charges Individually assessed provisions raised 198 173 371 610 Write-backs (83) (67) (150) (288) Recoveries (79) (100) (179) (168) Collectively assessed provisions raised 281 387 668 699
Impairment charges 317 393 710 853

2018
Ful
l Yea
r fin
anci
al re
sults
N
otes
to th
e co
nsol
idat
ed fi
nanc
ial s
tate
men
ts
Wes
tpac
Gro
up 2
018
Ful
l Yea
r F
inan
cial
Res
ults
Ann
ounc
emen
t | 9
9
No
te 1
1. C
red
it q
ual
ity
Imp
aire
d a
sset
s
Au
str
alia
New
Zea
lan
d
O
ther
Ove
rsea
s
T
ota
l
As
at
A
s a
tA
s a
t
As
at
A
s a
tA
s a
t
As
at
A
s a
tA
s a
t
As
at
A
s a
tA
s a
t
30
Sep
t
31 M
arch
30 S
ept
30
Sep
t
31 M
arch
30 S
ept
30
Sep
t
31 M
arch
30 S
ept
30
Sep
t
31 M
arch
30 S
ept
$m
2018
20
1820
17
2018
20
1820
17
2018
20
1820
17
2018
20
1820
17
No
n-P
erfo
rmin
g lo
ans
:
Gro
ss a
mou
nt
882
92
3 97
5
124
18
4 15
2
13
13
15
1,01
9
1,12
0 1,
142
Impa
irmen
t pro
visi
ons1
(422
)
(444
)(4
60)
(3
0)
(54)
(41)
(6
)
(5)
(6)
(4
58)
(5
03)
(507
)
Net
46
0
479
515
94
130
111
7
8
9
561
61
7 63
5
Res
tru
ctu
red
loan
s:
Gro
ss a
mou
nt
9
11
12
14
16
15
3
2
-
26
29
27
Impa
irmen
t pro
visi
ons1
(1)
(5
)(7
)
(4)
(4
)(5
)
(1)
(1
)-
(6
)
(10)
(12)
Net
8
6
5
10
12
10
2
1 -
20
19
15
Ove
rdra
fts,
per
son
al l
oan
s a
nd
re
volv
ing
cred
it g
reat
er t
han
90
da
ys p
ast
du
e:
Gro
ss a
mou
nt
358
36
8 36
2
12
17
11
1
1 -
37
1
386
373
Impa
irmen
t pro
visi
ons2
(179
)
(172
)(1
87)
(9
)
(13)
(8)
(1
)
(1)
-
(189
)
(186
)(1
95)
Net
17
9
196
175
3
4
3
-
- -
18
2
200
178
To
tal
imp
aire
d a
sset
s:
Gro
ss a
mou
nt
1,24
9
1,30
2 1,
349
15
0
217
178
17
16
15
1,
416
1,
535
1,54
2
Impa
irmen
t pro
visi
ons1
(602
)
(621
)(6
54)
(4
3)
(71)
(54)
(8
)
(7)
(6)
(6
53)
(6
99)
(714
)
Net
64
7
681
695
10
7
146
124
9
9
9
763
83
6 82
8
1 I
nclu
des
indi
vidu
ally
ass
esse
d pr
ovis
ions
and
col
lect
ivel
y as
sess
ed p
rovi
sion
s on
impa
ired
loan
s.
2 Inc
lude
s co
llect
ivel
y as
sess
ed p
rovi
sion
s on
impa
ired
loan
s.

2018 Full Year financial results Notes to the consolidated financial statements
100 | Westpac Group 2018 Full Year Financial Results Announcement
Note 11. Credit quality (continued)
Movement in gross impaired loans1
As at As at As at % Mov't % Mov't
30 Sept 31 March 30 Sept Sept 18 - Sept 18 -
$m 2018 2018 2017 Mar 18 Sept 17
Opening balance 1,535 1,542 1,978 - (22)
New and increased - individually managed 450 471 440 (4) 2
Write-offs (593) (534) (924) 11 (36)
Returned to performing or repaid (393) (387) (471) 2 (17)
Portfolio managed - new/increased/returned/repaid 413 442 518 (7) (20)
Exchange rate and other adjustments 4 1 1 large large
Balance as at period end 1,416 1,535 1,542 (8) (8)
Items 90 days past due, or otherwise in default, and not impaired
As at As at As at % Mov't % Mov't
30 Sept 31 March 30 Sept Sept 18 - Sept 18 -
$m 2018 2018 2017 Mar 18 Sept 17
Australia
Housing products 3,023 2,860 2,672 6 13
Other products 838 736 650 14 29
Total Australia 3,861 3,596 3,322 7 16
New Zealand
Housing products 99 124 89 (20) 11
Other products 28 31 28 (10) -
Other overseas 29 18 19 61 53
Total overseas 156 173 136 (10) 15
Total 4,017 3,769 3,458 7 16
1 Movement represents a six month period.

2018 Full Year financial results Notes to the consolidated financial statements
Westpac Group 2018 Full Year Financial Results Announcement | 101
Note 12. Deposits and other borrowings
As at As at As at % Mov't % Mov't
30 Sept 31 March 30 Sept Sept 18 - Sept 18 -
$m 2018 2018 2017 Mar 18 Sept 17
Australia
Certificates of deposit 28,746 30,387 37,515 (5) (23)
Non-interest bearing, repayable at call 41,783 40,967 40,324 2 4
Other interest bearing at call 233,052 227,021 224,268 3 4
Other interest bearing term 171,832 161,864 156,249 6 10
Total Australia 475,413 460,239 458,356 3 4
New Zealand
Certificates of deposit 1,116 521 546 114 104
Non-interest bearing, repayable at call 5,406 5,510 4,853 (2) 11
Other interest bearing at call 21,368 22,685 21,273 (6) -
Other interest bearing term 29,897 29,661 27,620 1 8
Total New Zealand 57,787 58,377 54,292 (1) 6
Overseas
Certificates of deposit 11,672 14,765 8,860 (21) 32
Non-interest bearing, repayable at call 830 748 810 11 2
Other interest bearing at call 1,638 1,309 1,505 25 9
Other interest bearing term 11,945 12,298 9,768 (3) 22
Total overseas 26,085 29,120 20,943 (10) 25
Total deposits and other borrowings 559,285 547,736 533,591 2 5
Deposits and other borrowings at fair value 41,178 45,337 46,569 (9) (12)
Deposits and other borrowings at amortised cost 518,107 502,399 487,022 3 6
Total deposits and other borrowings 559,285 547,736 533,591 2 5

2018 Full Year financial results Notes to the consolidated financial statements
102 | Westpac Group 2018 Full Year Financial Results Announcement
Note 13. Fair values of financial assets and financial liabilities
Fair Valuation Control Framework
The Group uses a Fair Valuation Control Framework where the fair value is either determined or validated by a function independent of the transaction. This framework formalises the policies and procedures used to achieve compliance with relevant accounting, industry and regulatory standards. The framework includes specific controls relating to:
the revaluation of financial instruments;
independent price verification;
fair value adjustments; and
financial reporting.
A key element of the Framework is the Revaluation Committee, comprising senior valuation specialists from within the Group. The Revaluation Committee reviews the application of the agreed policies and procedures to assess that a fair value measurement basis has been applied.
The method of determining fair value differs depending on the information available.
Fair value hierarchy
A financial instrument’s categorisation within the valuation hierarchy is based on the lowest level input that is significant to the fair value measurement.
The Group categorises all fair value instruments according to the hierarchy described below.
Valuation techniques
The Group applies market accepted valuation techniques in determining the fair valuation of over the counter (OTC) derivatives. This includes credit valuation adjustments (CVA) and funding valuation adjustments (FVA), which incorporate credit risk and funding costs and benefits that arise in relation to uncollateralised derivative positions, respectively.
The specific valuation techniques, the observability of the inputs used in valuation models and the subsequent classification for each significant product category are outlined below:
Level 1 instruments
The fair value of financial instruments traded in active markets based on recent unadjusted quoted prices. These prices are based on actual arm’s length basis transactions.
The valuations of Level 1 instruments require little or no management judgement.
Instrument Balance sheet category Includes: Valuation
Exchange traded products
Derivatives Exchange traded interest rate futures and options and commodity, energy and carbon futures
All these instruments are traded in liquid, active markets where prices are readily observable. No modelling or assumptions are used in the valuation.
Foreign exchange products
Derivatives FX spot and futures contracts
Equity products
Derivatives
Trading securities and financial assets designated at fair value
Other financial liabilities at fair value through income statement
Listed equities and equity indices
Non-asset backed debt instruments
Trading securities and financial assets designated at fair value
Available-for-sale securities
Other financial liabilities at fair value through income statement
Australian and New Zealand Commonwealth government bonds
Life insurance assets and liabilities
Life insurance assets
Life insurance liabilities
Listed equities, exchange traded derivatives and short sale of listed equities within controlled managed investment schemes

2018 Full Year financial results Notes to the consolidated financial statements
Westpac Group 2018 Full Year Financial Results Announcement | 103
Note 13. Fair values of financial assets and financial liabilities (continued)
Level 2 instruments
The fair value for financial instruments that is not actively traded are determined using valuation techniques which maximise the use of observable market prices. Valuation techniques include:
the use of market standard discounting methodologies;
option pricing models; and
other valuation techniques widely used and accepted by market participants.
Instrument Balance sheet category Includes: Valuation
Interest rate products
Derivatives
Interest rate and inflation swaps, swaptions, caps, floors, collars and other non-vanilla interest rate derivatives
Industry standard valuation models are used to calculate the expected future value of payments by product, which is discounted back to a present value. The model’s interest rate inputs are benchmark interest rates and active broker quoted interest rates in the swap, bond and future markets. Interest rate volatilities are sourced from brokers and consensus data providers. If consensus prices are not available, these are classified as Level 3 instruments.
Foreign exchange products
Derivatives
FX swap, FX forward contracts, FX options and other non-vanilla FX derivatives
Derived from market observable inputs or consensus pricing providers using industry standard models.
Other credit products
Derivatives Single Name and Index credit default swaps (CDS)
Valued using an industry standard model that incorporates the credit spread as its principal input. Credit spreads are obtained from consensus data providers. If consensus prices are not available, these are classified as Level 3 instruments.
Commodity products
Derivatives Commodity, energy and carbon derivatives
Valued using industry standard models.
The models calculate the expected future value of deliveries and payments and discounts them back to a present value. The model inputs include forward curves, volatilities implied from market observable inputs, discount curves and underlying spot and futures prices. The significant inputs are market observable or available through a consensus data service. If consensus prices are not available, these are classified as Level 3 instruments.
Equity products Derivatives Exchange traded equity options, OTC equity options and equity warrants
Due to low liquidity exchange traded options are Level 2.
Valued using industry standard models based on observable parameters such as stock prices, dividends, volatilities and interest rates.
Asset backed debt instruments
Trading securities and financial assets designated at fair value Available-for-sale securities
Australian residential mortgage backed securities (RMBS) denominated in Australian dollar and other asset backed securities (ABS).
Valued using an industry approach to value floating rate debt with prepayment features. Australian RMBS are valued using prices sourced from a consensus data provider. If consensus prices are not available these are classified as Level 3 instruments.

2018 Full Year financial results Notes to the consolidated financial statements
104 | Westpac Group 2018 Full Year Financial Results Announcement
Note 13. Fair values of financial assets and financial liabilities (continued)
Level 2 instruments (continued)
Instrument Balance sheet category Includes: Valuation
Non-asset backed debt instruments
Trading securities and financial assets designated at fair value Available-for-sale securities Regulatory deposits with central banks overseas Other financial liabilities through income statement
State and other government bonds, corporate bonds and commercial paper Security repurchase agreements and reverse repurchase agreements over non-asset backed debt securities
Valued using observable market prices, which are sourced from consensus pricing services, broker quotes or inter-dealer prices.
Loans at fair value
Loans Fixed rate bills
Discounted cash flow approach, using a discount rate which reflects the terms of the instrument and the timing of cash flows, adjusted for creditworthiness based on market observable inputs.
Certificates of deposit
Deposits and other borrowings
Certificates of deposit Discounted cash flow using market rates offered for deposits of similar remaining maturities.
Debt issues at fair value
Debt issues Debt issues
Discounted cash flows, using a discount rate which reflects the terms of the instrument and the timing of cash flows adjusted for market observable changes in Westpac’s implied credit worthiness.
Life insurance assets and liabilities
Life insurance assets Life insurance liabilities
Corporate bonds, over the counter derivatives, units in unlisted unit trusts, life insurance contract liabilities, life investment contract liabilities and external liabilities of managed investment schemes controlled by statutory life funds.
Valued using observable market prices or other widely used and accepted valuation techniques utilising observable market input.
Level 3 instruments
Financial instruments valued where at least one input that could have a significant effect on the instrument’s valuation is not based on observable market data due to illiquidity or complexity of the product. These inputs are generally derived and extrapolated from other relevant market data and calibrated against current market trends and historical transactions.
These valuations are calculated using a high degree of management judgement.
Instrument Balance sheet category Includes: Valuation
Asset backed debt instruments
Trading securities and financial assets designated at fair value Available-for-sale securities
Collateralised loan obligations and offshore asset-backed debt instruments.
As prices for these securities are not available from a consensus provider these are revalued based on third party revaluations (lead manager or inter-dealer). Due to their illiquidity and/or complexity they are classified as Level 3 assets.
Non-asset backed debt instruments
Trading securities and financial assets designated at fair value
Available-for-sale securities
Government securities (predominantly PNG government bonds)
Government securities from illiquid markets are classified as Level 3. Fair value is monitored by reference to recent issuances.
Equity investments
Trading securities and financial assets designated at fair value Available-for-sale securities
Investments in unlisted funds, boutique investment management companies and strategic equity investments.
Valued using valuation techniques appropriate to the investment, including the use of recent arm’s length transactions where available, discounted cash flow approach, reference to the net assets of the entity or to the most recent fund unit pricing. Due to their illiquidity, complexity and/or use of unobservable inputs into valuation models, they are classified as Level 3 assets.
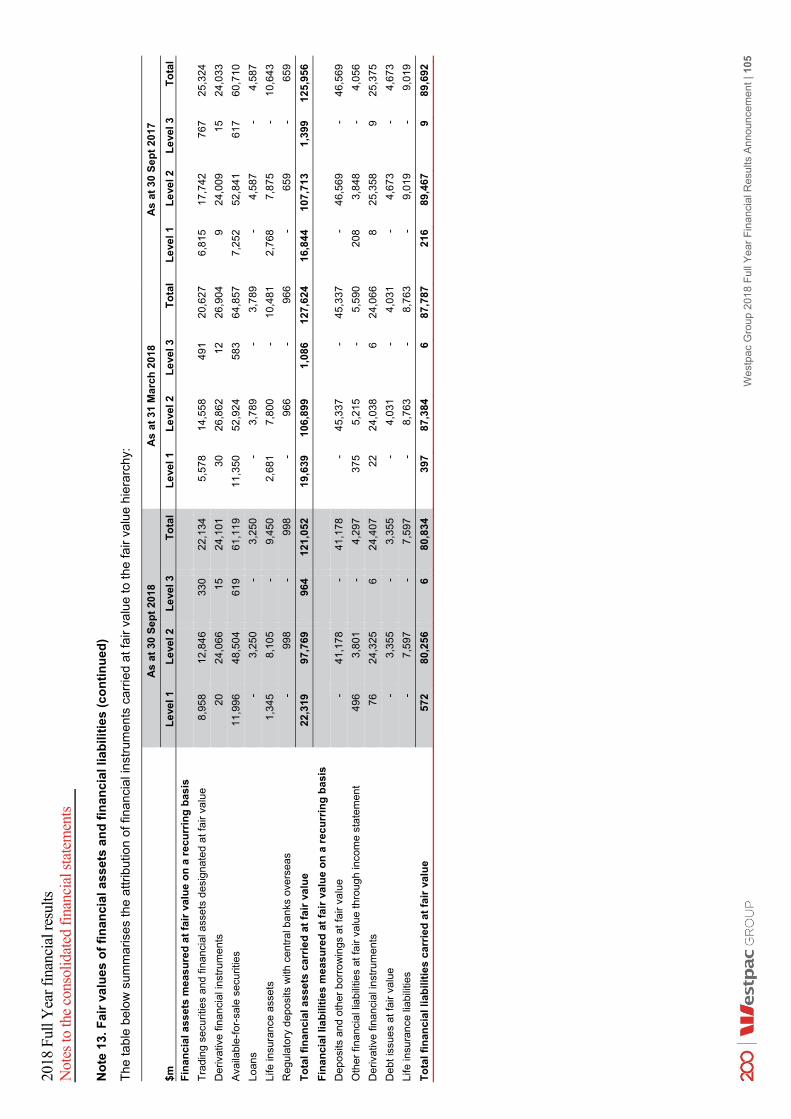
2018
Ful
l Yea
r fin
anci
al re
sults
N
otes
to th
e co
nsol
idat
ed fi
nanc
ial s
tate
men
ts
Wes
tpac
Gro
up 2
018
Ful
l Yea
r F
inan
cial
Res
ults
Ann
ounc
emen
t | 1
05
No
te 1
3. F
air
valu
es o
f fi
nan
cial
ass
ets
and
fin
anci
al li
abil
itie
s (c
on
tin
ued
) T
he ta
ble
belo
w s
umm
aris
es th
e at
trib
utio
n of
fina
ncia
l in
stru
men
ts c
arrie
d at
fair
valu
e to
the
fair
valu
e hi
erar
chy:
A
s a
t 30
Se
pt
2018
As
at
31 M
arch
201
8
As
at
30 S
ep
t 20
17
$m
Le
vel 1
L
eve
l 2
Le
vel 3
T
ota
l
Le
vel 1
Le
vel 2
Le
vel 3
To
tal
Le
vel 1
Le
vel 2
Le
vel 3
To
tal
Fin
an
cial
ass
ets
mea
su
red
at
fair
val
ue
on
a r
ecu
rrin
g b
asis
Tra
ding
sec
uriti
es
and
finan
cial
ass
ets
desi
gnat
ed a
t fai
r va
lue
8,95
8
12,8
46
33
0
22,1
34
5,
578
14,5
58
491
20,6
27
6,81
5 17
,742
76
7 25
,324
Der
ivat
ive
finan
cial
inst
rum
ents
20
24,0
66
15
24
,101
30
26,8
62
12
26,9
04
9 24
,009
15
24
,033
Ava
ilabl
e-fo
r-sa
le s
ecur
ities
11
,996
48,5
04
61
9
61,1
19
11
,350
52
,924
58
3 64
,857
7,
252
52,8
41
617
60,7
10
Loan
s -
3,
250
-
3,
250
-
3,78
9 -
3,78
9 -
4,58
7 -
4,58
7
Life
insu
ranc
e as
sets
1,
345
8,
105
-
9,
450
2,
681
7,80
0 -
10,4
81
2,76
8 7,
875
- 10
,643
Reg
ulat
ory
depo
sits
with
cen
tral
ban
ks o
vers
eas
-
998
-
99
8
- 96
6 -
966
- 65
9 -
659
To
tal
fin
anci
al a
sset
s ca
rrie
d a
t fa
ir v
alu
e
22,3
19
97
,769
964
12
1,05
2
19,6
39
106,
899
1,08
6 12
7,62
4 16
,844
10
7,71
3 1,
399
125,
956
Fin
an
cial
lia
bili
ties
mea
su
red
at
fair
val
ue
on
a r
ecu
rrin
g b
asis
Dep
osits
and
oth
er b
orro
win
gs a
t fa
ir va
lue
-
41,1
78
-
41
,178
- 45
,337
-
45,3
37
- 46
,569
-
46,5
69
Oth
er f
inan
cial
liab
ilitie
s at
fair
val
ue th
roug
h in
com
e st
atem
ent
496
3,
801
-
4,
297
37
5 5,
215
- 5,
590
208
3,84
8 -
4,05
6
Der
ivat
ive
finan
cial
inst
rum
ents
76
24,3
25
6
24
,407
22
24,0
38
6 24
,066
8
25,3
58
9 25
,375
Deb
t iss
ues
at fa
ir va
lue
-
3,35
5
-
3,35
5
- 4,
031
- 4,
031
- 4,
673
- 4,
673
Life
insu
ranc
e lia
bilit
ies
-
7,59
7
-
7,59
7
- 8,
763
- 8,
763
- 9,
019
- 9,
019
To
tal
fin
anci
al l
iab
iliti
es c
arri
ed a
t fa
ir v
alu
e
572
80
,256
6
80,8
34
39
7 87
,384
6
87,7
87
216
89,4
67
9 89
,692
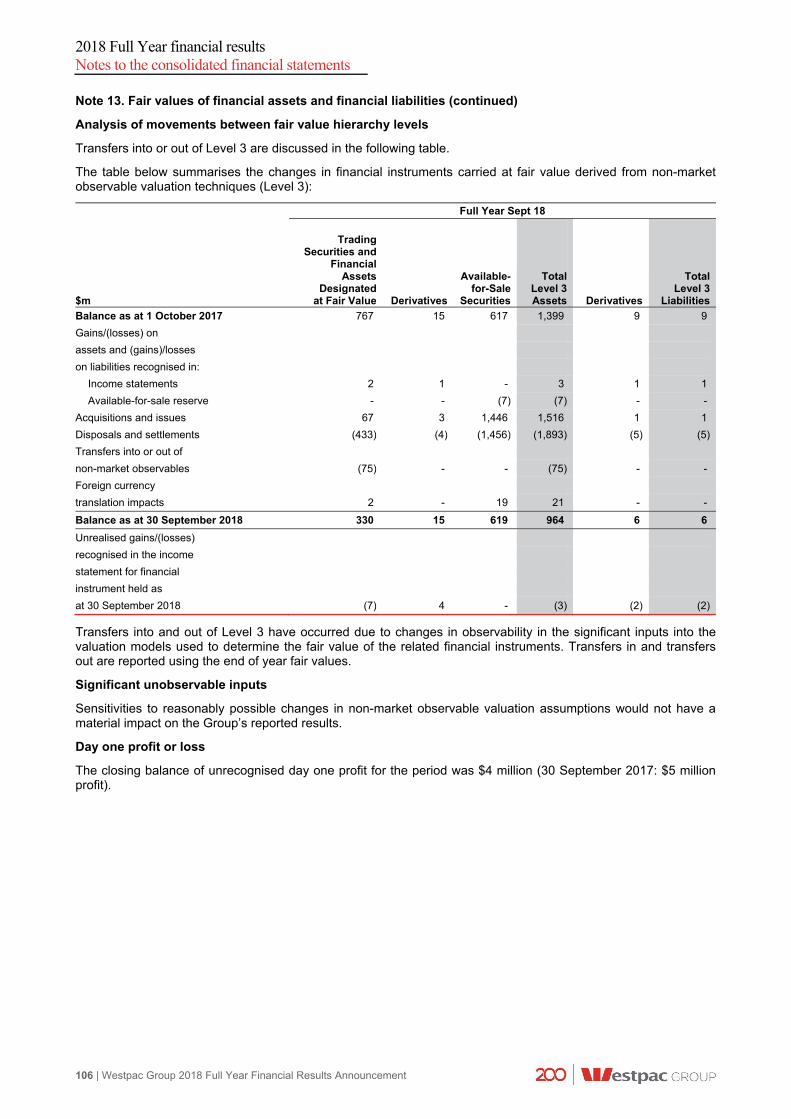
2018 Full Year financial results Notes to the consolidated financial statements
106 | Westpac Group 2018 Full Year Financial Results Announcement
Note 13. Fair values of financial assets and financial liabilities (continued)
Analysis of movements between fair value hierarchy levels
Transfers into or out of Level 3 are discussed in the following table.
The table below summarises the changes in financial instruments carried at fair value derived from non-market observable valuation techniques (Level 3):
Full Year Sept 18
$m
TradingSecurities and
FinancialAssets
Designatedat Fair Value Derivatives
Available-for-Sale
Securities
Total Level 3 Assets Derivatives
TotalLevel 3
Liabilities
Balance as at 1 October 2017 767 15 617 1,399 9 9
Gains/(losses) on
assets and (gains)/losses
on liabilities recognised in:
Income statements 2 1 - 3 1 1
Available-for-sale reserve - - (7) (7) - -
Acquisitions and issues 67 3 1,446 1,516 1 1
Disposals and settlements (433) (4) (1,456) (1,893) (5) (5)
Transfers into or out of
non-market observables (75) - - (75) - -
Foreign currency
translation impacts 2 - 19 21 - -
Balance as at 30 September 2018 330 15 619 964 6 6
Unrealised gains/(losses)
recognised in the income
statement for financial
instrument held as
at 30 September 2018 (7) 4 - (3) (2) (2)
Transfers into and out of Level 3 have occurred due to changes in observability in the significant inputs into the valuation models used to determine the fair value of the related financial instruments. Transfers in and transfers out are reported using the end of year fair values.
Significant unobservable inputs
Sensitivities to reasonably possible changes in non-market observable valuation assumptions would not have a material impact on the Group’s reported results.
Day one profit or loss
The closing balance of unrecognised day one profit for the period was $4 million (30 September 2017: $5 million profit).

2018 Full Year financial results Notes to the consolidated financial statements
Westpac Group 2018 Full Year Financial Results Announcement | 107
Note 13. Fair values of financial assets and financial liabilities (continued)
Financial instruments not measured at fair value
The following table summarises the estimated fair value of financial instruments not measured at fair value for the Group:
As at 30 Sept 2018 As at 31 March 2018 As at 30 Sept 2017
Carrying Fair Carrying Fair Carrying Fair
$m Amount Value Amount Value Amount Value
Financial assets not measured at fair value
Cash and balances with central banks 26,431 26,431 21,580 21,580 18,397 18,397
Receivables due from other financial institutions 5,790 5,790 3,977 3,977 7,128 7,128
Loans 706,440 706,742 697,604 697,905 680,332 680,568
Regulatory deposits with central banks overseas 357 357 352 352 389 389
Other financial assets 4,514 4,514 5,893 5,893 4,754 4,754
Total financial assets not measured at fair value 743,532 743,834 729,406 729,707 711,000 711,236
Financial liabilities not measured at fair value - -
Payables due to other financial institutions 18,137 18,137 19,073 19,073 21,907 21,907
Deposits and other borrowings 518,107 518,791 502,399 503,095 487,022 487,723
Debt issues1 169,241 170,060 170,107 171,221 163,683 165,151
Loan capital 17,265 17,438 18,333 18,571 17,666 18,087
Other financial liabilities 7,855 7,855 8,589 8,589 7,490 7,490
Total financial liabilities not measured at fair value 730,605 732,281 718,501 720,549 697,768 700,358
A detailed description of how fair value is derived for financial instruments not measured at fair value is disclosed in Note 23 of the Group’s annual financial statements for the year ended 30 September 2018.
1 The estimated fair value of debt issues includes the impact of changes in Westpac’s credit spreads since origination.

2018 Full Year financial results Notes to the consolidated financial statements
108 | Westpac Group 2018 Full Year Financial Results Announcement
Note 14. Contingent liabilities, contingent assets and credit commitments
Undrawn credit commitments
The Group enters into various arrangements with customers which are only recognised in the balance sheet when called upon. These arrangements include commitments to extend credit, bill endorsements, financial guarantees, standby letters of credit and underwriting facilities.
They expose the Group to liquidity risk when called upon and also to credit risk if the customer fails to repay the amounts owed at the due date. The maximum exposure to credit loss is the contractual or notional amount of the instruments disclosed below. Some of the arrangements can be cancelled by the Group at any time and a significant portion is expected to expire without being drawn. The actual required liquidity and credit risk exposure is therefore less than the amounts disclosed.
The Group uses the same credit policies when entering into these arrangements as it does for on-balance sheet instruments. Refer to Note 22 of the Group’s annual financial statements for the year ended 30 September 2018 for further details of liquidity risk and credit risk management.
Undrawn credit commitments excluding derivatives at 30 September are as follows:
As at As at As at % Mov't % Mov't
30 Sept 31 Mar 30 Sept Sept 18 - Sept 18 -
$m 2018 2018 2017 Mar 18 Sept 17
Undrawn credit commitments
Letters of credit and guarantees1 15,585 15,306 15,460 2 1
Commitments to extend credit2 174,658 176,258 178,443 (1) (2)
Other 154 249 648 (38) (76)
Total undrawn credit commitments 190,397 191,813 194,551 (1) (2)
2018 Up to Over 1 to Over 3 to Over $m 1 Year 3 Years 5 Years 5 Years Total Letters of credit and guarantees 8,983 2,717 890 2,995 15,585 Commitments to extend credit 50,292 49,320 14,637 60,409 174,658 Other - 74 25 55 154 Total undrawn credit commitments 59,275 52,111 15,552 63,459 190,397
Contingent assets
The credit commitments shown in the table above also constitute contingent assets. These commitments would be classified as loans in the balance sheet on the contingent event occurring.
Contingent liabilities
Contingent liabilities are possible obligations whose existence will be confirmed only by uncertain future events and present obligations where the transfer of economic resources is not probable or cannot be reliably measured. Contingent liabilities are not recognised on the balance sheet but are disclosed unless the outflow of economic resources is remote.
The Royal Commission and regulatory action
Globally, regulators and other bodies continue to progress various reviews involving the financial services sector. The nature of these reviews can be wide ranging and, in Australia, currently include investigations into potential misconduct in credit and financial services. For example, the Royal Commission into Misconduct in the Banking, Superannuation and Financial Services Industry (the Royal Commission) is currently investigating conduct, practices, behaviour or business activities by financial services entities including the Group that may amount to potential misconduct or that may fall below community standards and expectations. The Royal Commission may make findings that the Group (including persons or entities acting on its behalf) has engaged in misconduct including breaches of law or conduct that falls below community standards and expectations.
1 Letters of credit are undertakings to pay, against presentation documents, and obligation in the event of a default by a customer.
Guarantees are unconditional undertakings given to support the obligations of a customer to third parties. The Group may hold cash as collateral for certain guarantees issued.
2 Commitments to extend credit include all obligations on the part of the Group to provide credit facilities. As facilities may expire without being drawn upon, the notional amounts do not necessarily reflect future cash requirements. In addition to the commitments disclosed above, at 30 September 2018 the Group had offered $5.7 billion (31 March 2018: $4.6 billion, 30 September 2017 $5.5 billion) of facilities to customers, which had not yet been accepted.

2018 Full Year financial results Notes to the consolidated financial statements
Westpac Group 2018 Full Year Financial Results Announcement | 109
Note 14. Contingent liabilities, contingent assets and credit commitments (continued)
Any findings made by the Royal Commission as it progresses, may result in litigation (including class action proceedings against the Group), fines, penalties, revocation, suspension or variation of conditions of relevant regulatory licences or other enforcement or administrative action being taken by regulators or other parties.
Regulators such as ASIC, APRA, ACCC, AUSTRAC and the ATO are also currently conducting reviews and inquiries (some of which are industry-wide) that currently involve or may involve the Group in the future. These reviews are separately considering a range of matters, including matters such as consumer credit insurance, responsible lending (including in the context of reverse mortgages and interest only lending), anti-money laundering and counter-terrorism financing processes and procedures (including in relation to customer on-boarding and ongoing customer due diligence), financial adviser conduct (including compliance with the obligation to act in the client’s best interests), life insurance claims handling, and the pricing of residential mortgages.
The Group has recently self-reported to AUSTRAC a failure to report a large number of International Funds Transfer Instructions (IFTIs) (as required under Australia’s AML/CTF Act) in relation to one WIB product. These IFTIs relate to batch instructions received from 2009 until recently from a small number of correspondent banks for payments made predominantly to beneficiaries in Australia in Australian dollars. Through the product, Westpac facilitates payments on behalf of clients of certain of its correspondent banks. The majority of the payments are low value and made by Government pension funds and corporates. The Group is investigating and working with AUSTRAC to remediate the failure to report IFTIs. No provision has been raised for this matter including in relation to any potential regulatory action.
Westpac has received various notices and requests for information from the Royal Commission, as well as from regulators as part of both industry-wide and Westpac-specific reviews and inquiries.
These reviews and inquiries, which may be conducted by a regulator, and in some cases also an external third party assurance provider retained either by the regulator or by the Group (including where a matter has been self-identified by the Group), may result in litigation (including class action proceedings against the Group), fines, penalties, revocation, suspension or variation of conditions of relevant regulatory licences or other enforcement or administrative action being taken by regulators or other parties.
An assessment of the likely cost to the Group of these reviews and actions has been made on a case-by-case basis for the purpose of the financial statements but cannot always be reliably estimated. Where appropriate, specific provisions have been made (refer to Note 28 of the financial statements contained within the 2018 Westpac Group Annual Report).
Litigation
There are ongoing court proceedings, claims and possible claims for and against the Group. Contingent liabilities exist in respect of actual and potential claims and proceedings, including those listed below. An assessment of the Group's likely loss has been made on a case-by-case basis for the purpose of the financial statements but cannot always be reliably estimated. Where appropriate, specific provisions have been made. (refer to Note 28 of the financial statements contained within the 2018 Westpac Group Annual Report).
Following ASIC's investigations into the interbank short-term money market and its impact on the setting of the bank bill swap reference rate (BBSW), on 5 April 2016, ASIC commenced civil proceedings against Westpac in the Federal Court of Australia, alleging certain misconduct, including market manipulation and unconscionable conduct. The conduct that was the subject of the proceedings was alleged to have occurred between 6 April 2010 and 6 June 2012. ASIC sought declarations from the court that Westpac breached various provisions of the Corporations Act 2001 (Cth) and the Australian Securities and Investments Commission Act 2001 (Cth), pecuniary penalties of unspecified amounts and orders requiring Westpac to implement a comprehensive compliance program for persons involved in Westpac's trading in the relevant market. The proceedings were heard in late 2017. On 24 May 2018, Justice Beach found that Westpac had not engaged in market manipulation or misleading or deceptive conduct under the Corporations Act 2001 (Cth). His Honour also found that there was no 'trading practice' of manipulating the BBSW rate. However, the Court found that Westpac engaged in unconscionable conduct on 4 occasions and that Westpac breached its supervisory duty. Costs and penalties will be determined in the coming months. While we have provided for our best estimate of these amounts, there remains a risk that the final outcome may differ from this estimate;
In August 2016, a class action was filed in the United States District Court for the Southern District of New York against Westpac and a large number of Australian and international banks alleging misconduct in relation to BBSW. Those proceedings are at a very early stage and the level of damages sought has not been specified. Westpac is defending these proceedings. No provision has been recognised in relation to this matter;

2018 Full Year financial results Notes to the consolidated financial statements
110 | Westpac Group 2018 Full Year Financial Results Announcement
Note 14. Contingent liabilities, contingent assets and credit commitments (continued)
On 1 March 2017, ASIC commenced litigation in relation to certain Westpac home loans (including certain interest only loans) alleging contraventions of the National Consumer Credit Protection Act 2009 (Cth). On 4 September 2018, Westpac and ASIC agreed to settle the proceedings on the basis of a proposed $35 million penalty and declarations that Westpac contravened the National Consumer Credit Protection Act 2009 (Cth). The proposed settlement is subject to Court approval. A hearing on the proposed settlement was held on 24 October 2018 and judgement is reserved. While we have provided for our best estimate of these amounts, there remains a risk that the final outcome may differ from this estimate; and
On 22 December 2016, ASIC commenced Federal Court proceedings against BT Funds Management Limited and Westpac Securities Administration Limited in relation to a number of superannuation account consolidation campaigns conducted between 2013 and 2016. ASIC has alleged that in the course of some of these campaigns, customers were provided with personal advice in contravention of a number of Corporations Act 2001 (Cth) provisions. ASIC has selected 15 specific customers as the focus of their claim. The proceedings were heard in February 2018. Judgment is pending. No provision has been recognised in relation to this matter.
On 12 October 2017, a class action against Westpac and Westpac Life Insurance Services Limited (WLIS) was filed in the Federal Court of Australia. The class action was filed on behalf of customers who, since October 2011, obtained insurance issued by WLIS on the recommendation of certain financial advisers employed within the Westpac Group. The plaintiffs have alleged that aspects of the financial advice provided by those advisers breached fiduciary and statutory duties owed to the advisers' clients, including the duty to act in the best interests of the client and that WLIS was knowingly involved in those alleged breaches. Westpac and WLIS are defending the proceedings. These proceedings are currently stayed by order of the Court, pending the outcome of an appeal concerning a procedural issue unrelated to the substantive claims made in the class action. No provision has been recognised in relation to this matter.
Internal reviews and remediation
Westpac is currently undertaking a number of reviews to identify and resolve prior issues that have the potential to impact our customers and reputation. These reviews have identified, and may continue to identify, issues in respect of which we are, or will be, taking steps to put things right (including in relation to areas of industry focus such as compliance with responsible lending obligations and the way some product terms and conditions are operationalised) so that our customers are not at a disadvantage from certain past practices. By undertaking these reviews we can also improve our processes (including in relation to responsible lending controls and financial planning controls). An assessment of the Group’s likely loss has been made on a case-by-case basis for the purpose of the financial statements but cannot always be reliably estimated. Where appropriate, specific provisions have been made (refer to Note 28 of the financial statements contained within the 2018 Westpac Group Annual Report). Contingent liabilities may exist in respect of actual or potential claims, compensation payments and/or refunds identified as part of these reviews (including in relation to the reviews described below).
One of the reviews relates to ongoing advice services provided from 2008 by approximately 1,660 planners operating in aligned dealer groups who were at the time authorised representatives of the Group’s wholly owned subsidiaries Securitor Financial Group (Securitor) and Magnitude Group Pty Ltd (Magnitude). Securitor and Magnitude, as the AFSL licensees, retained a portion of the ongoing advice fees paid to those dealer groups by clients since 2008. Westpac is in the early stages of engaging each authorised representative to determine the agreements in place between those representatives and their clients, and the services provided. Given the early stage of the review, the time period under consideration and availability of records in relation to the relevant period, it is not practicable to provide an estimate of any potential remediation costs for circumstances where a client has paid ongoing service fees but those services have not been provided. No provision has been recognised in relation to this matter.
Following an error in the Group’s systems, certain customers with an interest only home loan did not have their loans automatically switched to principal and interest repayments at the end of the contracted interest only period. The Group is undertaking a program of work to remediate this issue for affected customers and is engaging with ASIC on potential remediation options. While we have provided for our best estimate of these amounts, there remains a risk that the final outcome may exceed this estimate.
Financial Claims Scheme
Under the Financial Claims Scheme (FCS) the Australian Government provides depositors a free guarantee of deposits in eligible ADIs up to and including $250,000. The FCS applies to an eligible ADI if APRA has applied for the winding up of the ADI and the responsible Australian Government minister has declared that the FCS applies to the ADI.
The Financial Claims Scheme (ADIs) Levy Act 2008 provides for the imposition of a levy to fund the excess of certain APRA FCS costs connected to an ADI. The levy would be imposed on liabilities of eligible ADIs to their depositors and cannot be more than 0.5% of the amount of those liabilities.

2018 Full Year financial results Notes to the consolidated financial statements
Westpac Group 2018 Full Year Financial Results Announcement | 111
Note 14. Contingent liabilities, contingent assets and credit commitments (continued)
Contingent tax risk
Tax and regulatory authorities are reviewing the taxation treatment of certain transactions (including both historical and present-day transactions) undertaken by the Group in the course of normal business activities and the claiming of tax incentives (including research and development tax incentives) and GST. The Group also responds to various notices and requests for information it receives from tax and regulatory authorities.
Risk reviews and audits are also being undertaken by revenue authorities in other jurisdictions, as part of normal revenue authority activity in those countries. These reviews, notices and requests may result in additional tax liabilities (including interest and penalties).
The Group has assessed these and other taxation claims arising in Australia and elsewhere, including seeking independent advice, and holds provisions.
Settlement risk
The Group is subject to a credit risk exposure in the event that another counterparty fails to settle for its payments clearing activities (including foreign exchange). The Group seeks to minimise credit risk arising from settlement risk in the payments system by aligning our processing method with the legal certainty of settlement in the relevant clearing mechanism.
Parent Entity guarantees and undertakings
The Parent Entity makes the following guarantees and undertakings to subsidiaries:
letters of comfort for certain subsidiaries which recognise that Westpac has a responsibility that those subsidiaries continue to meet their obligations; and
guarantees to certain wholly owned subsidiaries which are Australian financial services or credit licensees to comply with legislative requirements. Each guarantee is capped at $40 million per year and can only be utilised if the entity concerned becomes legally obliged to pay for a claim under the relevant licence. The Parent Entity has a right to recover any funds payable under the guarantees from the relevant subsidiary.

2018 Full Year financial results Notes to the consolidated financial statements
112 | Westpac Group 2018 Full Year Financial Results Announcement
Note 15. Shareholders’ equity
As at As at As at
30 Sept 31 March 30 Sept
$m 2018 2018 2017
Share capital
Ordinary share capital, fully paid 36,054 35,168 34,889
Treasury shares held for RSP1 (505) (504) (434)
Other treasury shares held2 12 (61) (61)
Total treasury shares held (493) (565) (495)
Total share capital 35,561 34,603 34,394
Non-controlling interests 52 50 54
Ordinary Shares
Westpac does not have authorised capital and the ordinary shares have no par value. Ordinary shares entitle the holder to participate in dividends and, in the event of Westpac winding up, to a share of the proceeds in proportion to the number of and amounts paid on the shares held.
Each ordinary share entitles the holder to one vote, either in person or by proxy, at a shareholder meeting.
Reconciliation of movement in number of ordinary shares
Consolidated
As at As at As at
30 Sept 2018 31 March 2018 30 Sept 2017
Opening balance 3,404,172,038 3,394,364,279 3,356,614,808
Dividend reinvestment plan3 11,434,908 9,807,759 37,749,471
Conversion of Westpac Convertible Preference Shares4 19,189,765 - -
Issued shares for the period 30,624,673 9,807,759 37,749,471
Closing balance 3,434,796,711 3,404,172,038 3,394,364,279
Ordinary shares purchased and sold on market
Full Year Sept Full Year Sept
2018 2018
Consolidated Number Average Price ($)
For share-based payment arrangements:
Employee share plan (ESP) 854,267 31.86
RSP5 2,291,897 31.32
Westpac Performance Plan (WPP) - share rights exercised 156,691 31.49
Westpac Long Term Incentive Plan (LTIP) - options exercised6 103,686 28.80
LTIP - share rights exercised 2,929 28.42
As treasury shares:
Treasury shares purchased (excluding RSP)7 93,052 28.97
Treasury shares purchased (2,715,836) 28.10
Net number of ordinary shares purchased/(sold) on market8 786,686
1 30 September 2018: 3,943,660 unvested shares held (31 March 2018: 3,991,446, 30 September 2017: 3,549,035). 2 30 September 2018: 2,029,795 shares held (31 March 2018: 4,652,579, 30 September 2017: 4,652,579). 3 The price per share for the issuance of shares in relation to the dividend re-investment plan for the 2018 interim dividend was $28.11,
2017 final dividend was $31.62 and 2017 interim dividend was $29.79. 4 The conversion price per share for the issuance of shares in relation to the conversion of Westpac Convertible Preference Shares was
$29.49. 5 Ordinary shares allocated to employees under the RSP are classified as treasury shares until the shares vest. 6 No WPP options were exercised during the period. The average exercise price per share received was $24.23 on the exercise of the
LTI options. 7 Treasury shares include ordinary shares held by statutory life funds and managed investment schemes and ordinary shares held by
Westpac for equity derivatives sold to customers. 8 The purchase of ordinary shares on market resulted in a tax benefit of $0.22 million being recognised as contributed equity.

2018 Full Year financial results Notes to the consolidated financial statements
Westpac Group 2018 Full Year Financial Results Announcement | 113
Note 15. Shareholders’ equity (continued)
Reconciliation of movement in reserves
As at As at As at
30 Sept 31 March 30 Sept
$m 2018 2018 2017
Available-for-sale securities reserve
Opening balance 35 64 131
Net gains/(losses) from changes in fair value (71) (33) (93)
Income tax effect 24 10 27
Transferred to income statements 75 (9) (2)
Income tax effect (28) 3 1
Exchange differences 2 - -
Closing balance 37 35 64
Share-based payment reserve
Opening balance 1,500 1,431 1,398
Share-based payment expense 34 69 33
Closing balance 1,534 1,500 1,431
Cash flow hedge reserve
Opening balance (134) (154) (201)
Net gains/(losses) from changes in fair value (96) (65) (20)
Income tax effect 28 19 6
Transferred to income statements 109 94 86
Income tax effect (32) (28) (25)
Closing balance (125) (134) (154)
Foreign currency translation reserve
Opening balance (494) (529) (451)
Exchange differences on translation of foreign operations
(net of associated hedges)1 143 38 (78)
Transferred to income statements1 - (3) -
Closing balance (351) (494) (529)
Other reserves
Opening balance (17) (18) (18)
Transactions with owners (1) 1 -
Closing balance (18) (17) (18)
Total reserves 1,077 890 794
1 Half year March 2018 restated.
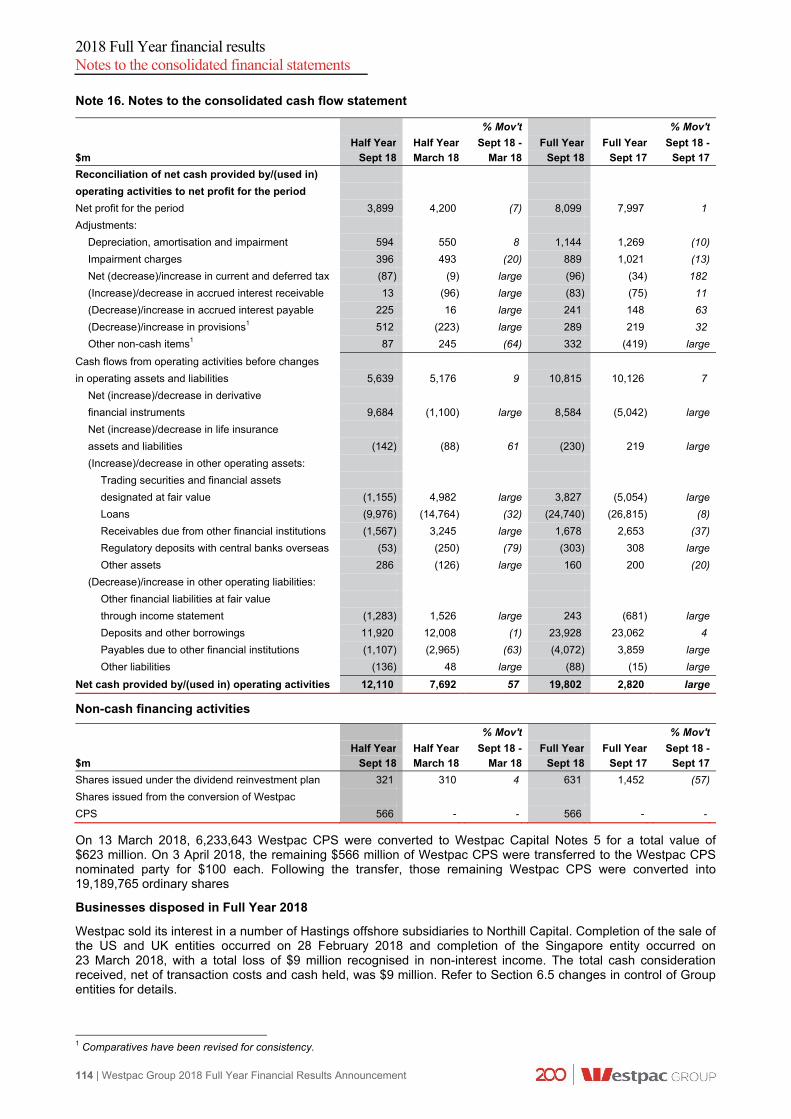
2018 Full Year financial results Notes to the consolidated financial statements
114 | Westpac Group 2018 Full Year Financial Results Announcement
Note 16. Notes to the consolidated cash flow statement
% Mov't % Mov't
Half Year Half Year Sept 18 - Full Year Full Year Sept 18 -
$m Sept 18 March 18 Mar 18 Sept 18 Sept 17 Sept 17
Reconciliation of net cash provided by/(used in)
operating activities to net profit for the period
Net profit for the period 3,899 4,200 (7) 8,099 7,997 1
Adjustments:
Depreciation, amortisation and impairment 594 550 8 1,144 1,269 (10)
Impairment charges 396 493 (20) 889 1,021 (13)
Net (decrease)/increase in current and deferred tax (87) (9) large (96) (34) 182
(Increase)/decrease in accrued interest receivable 13 (96) large (83) (75) 11
(Decrease)/increase in accrued interest payable 225 16 large 241 148 63
(Decrease)/increase in provisions1 512 (223) large 289 219 32
Other non-cash items1 87 245 (64) 332 (419) large
Cash flows from operating activities before changes
in operating assets and liabilities 5,639 5,176 9 10,815 10,126 7
Net (increase)/decrease in derivative
financial instruments 9,684 (1,100) large 8,584 (5,042) large
Net (increase)/decrease in life insurance
assets and liabilities (142) (88) 61 (230) 219 large
(Increase)/decrease in other operating assets:
Trading securities and financial assets
designated at fair value (1,155) 4,982 large 3,827 (5,054) large
Loans (9,976) (14,764) (32) (24,740) (26,815) (8)
Receivables due from other financial institutions (1,567) 3,245 large 1,678 2,653 (37)
Regulatory deposits with central banks overseas (53) (250) (79) (303) 308 large
Other assets 286 (126) large 160 200 (20)
(Decrease)/increase in other operating liabilities:
Other financial liabilities at fair value
through income statement (1,283) 1,526 large 243 (681) large
Deposits and other borrowings 11,920 12,008 (1) 23,928 23,062 4
Payables due to other financial institutions (1,107) (2,965) (63) (4,072) 3,859 large
Other liabilities (136) 48 large (88) (15) large
Net cash provided by/(used in) operating activities 12,110 7,692 57 19,802 2,820 large
Non-cash financing activities
% Mov't % Mov't
Half Year Half Year Sept 18 - Full Year Full Year Sept 18 -
$m Sept 18 March 18 Mar 18 Sept 18 Sept 17 Sept 17
Shares issued under the dividend reinvestment plan 321 310 4 631 1,452 (57)
Shares issued from the conversion of Westpac
CPS 566 - - 566 - -
On 13 March 2018, 6,233,643 Westpac CPS were converted to Westpac Capital Notes 5 for a total value of $623 million. On 3 April 2018, the remaining $566 million of Westpac CPS were transferred to the Westpac CPS nominated party for $100 each. Following the transfer, those remaining Westpac CPS were converted into 19,189,765 ordinary shares
Businesses disposed in Full Year 2018
Westpac sold its interest in a number of Hastings offshore subsidiaries to Northill Capital. Completion of the sale of the US and UK entities occurred on 28 February 2018 and completion of the Singapore entity occurred on 23 March 2018, with a total loss of $9 million recognised in non-interest income. The total cash consideration received, net of transaction costs and cash held, was $9 million. Refer to Section 6.5 changes in control of Group entities for details.
1 Comparatives have been revised for consistency.

2018 Full Year financial results Notes to the consolidated financial statements
Westpac Group 2018 Full Year Financial Results Announcement | 115
Restricted cash
The amount of cash and cash equivalents not available for use at 30 September 2018 was nil (31 March 2018: $40 million, 30 September 2017: $38 million) for the Group. Note 17. Subsequent events
No other matters have arisen since the year ended 30 September 2018 which is not otherwise dealt with in this Full Year financial results, that has significantly affected or may significantly affect the operations of the Group, the results of its operations or the state of affairs of the Group in subsequent periods.

2018 Full Year financial results Statutory statements
116 | Westpac Group 2018 Full Year Financial Results Announcement
4.8 Statement in relation to the audit of the financial statements.
PricewaterhouseCoopers has audited the financial statements contained within the Westpac 2018 financial report and has issued an unmodified audit report. A copy of their report is available with the Annual financial report. This full year results announcement has not been subject to audit by PricewaterhouseCoopers. The preceding financial information contained in Section 4 “Full Year 2018 reported financial information” includes financial information extracted from the audited financial statements together with financial information that has not been audited.
Dated at Sydney this 5th day of November 2018 for and on behalf of the Board.
Tim Hartin Company Secretary
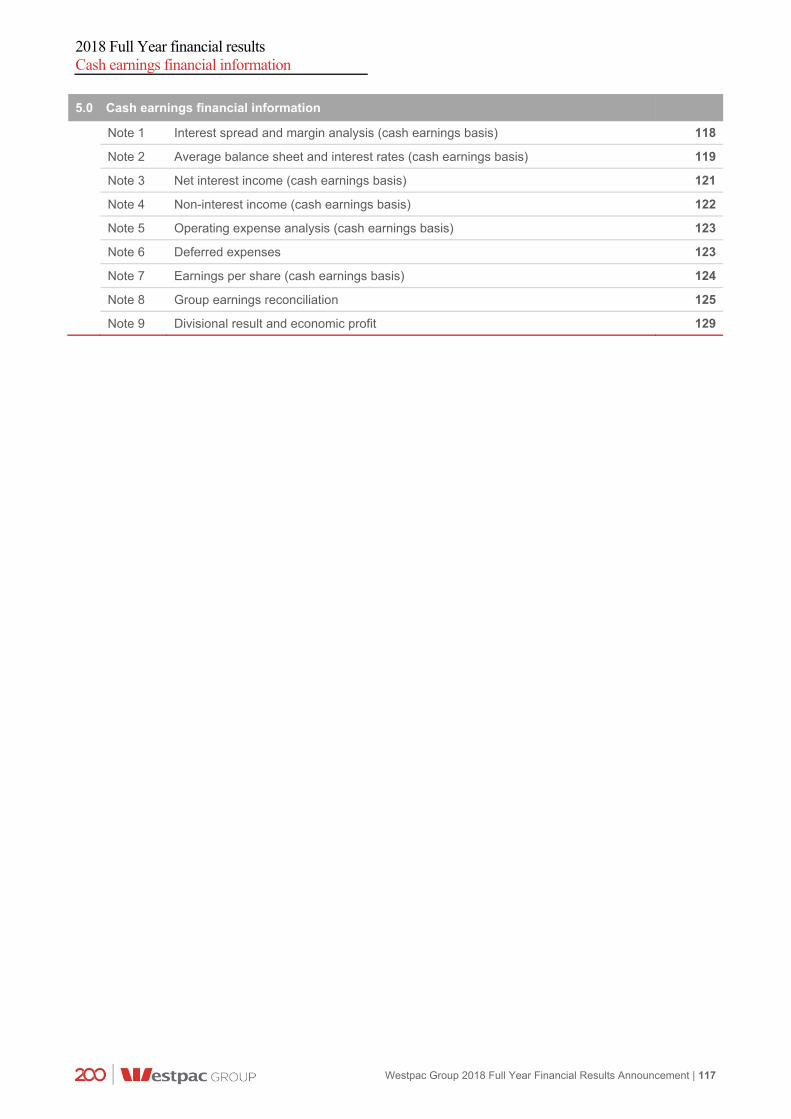
2018 Full Year financial results Cash earnings financial information
Westpac Group 2018 Full Year Financial Results Announcement | 117
5.0 Cash earnings financial information
Note 1 Interest spread and margin analysis (cash earnings basis) 118
Note 2 Average balance sheet and interest rates (cash earnings basis) 119
Note 3 Net interest income (cash earnings basis) 121
Note 4 Non-interest income (cash earnings basis) 122
Note 5 Operating expense analysis (cash earnings basis) 123
Note 6 Deferred expenses 123
Note 7 Earnings per share (cash earnings basis) 124
Note 8 Group earnings reconciliation 125
Note 9 Divisional result and economic profit 129
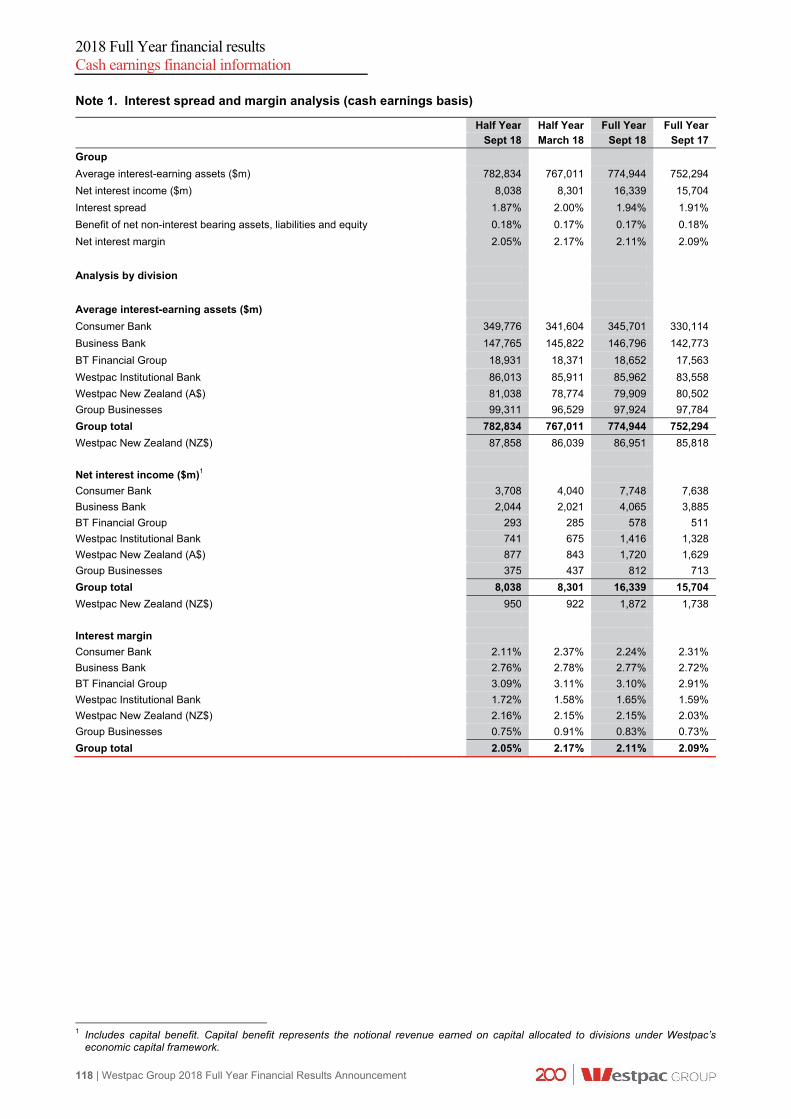
2018 Full Year financial results Cash earnings financial information
118 | Westpac Group 2018 Full Year Financial Results Announcement
Note 1. Interest spread and margin analysis (cash earnings basis)
Half Year Half Year Full Year Full Year
Sept 18 March 18 Sept 18 Sept 17
Group
Average interest-earning assets ($m) 782,834 767,011 774,944 752,294
Net interest income ($m) 8,038 8,301 16,339 15,704
Interest spread 1.87% 2.00% 1.94% 1.91%
Benefit of net non-interest bearing assets, liabilities and equity 0.18% 0.17% 0.17% 0.18%
Net interest margin 2.05% 2.17% 2.11% 2.09%
Analysis by division
Average interest-earning assets ($m)
Consumer Bank 349,776 341,604 345,701 330,114
Business Bank 147,765 145,822 146,796 142,773
BT Financial Group 18,931 18,371 18,652 17,563
Westpac Institutional Bank 86,013 85,911 85,962 83,558
Westpac New Zealand (A$) 81,038 78,774 79,909 80,502
Group Businesses 99,311 96,529 97,924 97,784
Group total 782,834 767,011 774,944 752,294
Westpac New Zealand (NZ$) 87,858 86,039 86,951 85,818
Net interest income ($m)1
Consumer Bank 3,708 4,040 7,748 7,638
Business Bank 2,044 2,021 4,065 3,885
BT Financial Group 293 285 578 511
Westpac Institutional Bank 741 675 1,416 1,328
Westpac New Zealand (A$) 877 843 1,720 1,629
Group Businesses 375 437 812 713
Group total 8,038 8,301 16,339 15,704
Westpac New Zealand (NZ$) 950 922 1,872 1,738
Interest margin
Consumer Bank 2.11% 2.37% 2.24% 2.31%
Business Bank 2.76% 2.78% 2.77% 2.72%
BT Financial Group 3.09% 3.11% 3.10% 2.91%
Westpac Institutional Bank 1.72% 1.58% 1.65% 1.59%
Westpac New Zealand (NZ$) 2.16% 2.15% 2.15% 2.03%
Group Businesses 0.75% 0.91% 0.83% 0.73%
Group total 2.05% 2.17% 2.11% 2.09%
1 Includes capital benefit. Capital benefit represents the notional revenue earned on capital allocated to divisions under Westpac’s
economic capital framework.

2018 Full Year financial results Cash earnings financial information
Westpac Group 2018 Full Year Financial Results Announcement | 119
Note 2. Average balance sheet and interest rates (cash earnings basis)
Half Year Half Year 30 September 2018 31 March 2018 Average Interest Average Average Interest Average
balance Rate balance Rate
$m $m % $m $m %
Assets
Interest earning assets
Receivables due from other financial institutions 5,198 59 2.3 5,934 49 1.7
Trading securities and other financial assets designated at fair value 22,631 267 2.4 23,860 275 2.3
Available-for-sale securities 62,054 984 3.2 61,023 930 3.1
Regulatory deposits with central banks overseas 1,122 14 2.5 958 9 1.9
Loans and other receivables1 691,829 15,162 4.4 675,236 14,840 4.4
Total interest earning assets
and interest income 782,834 16,486 4.2 767,011 16,103 4.2
Non-interest earning assets
Cash, receivables due from other financial
institutions and regulatory deposits 2,293 2,459
Derivative financial instruments 35,271 34,130
Life insurance assets 10,575 10,753
All other assets2 62,232 61,643
Total non-interest earning assets 110,371 108,985
Total assets 893,205 875,996
Liabilities
Interest bearing liabilities
Payables due to other financial institutions 18,987 166 1.7 19,571 153 1.6
Deposits and other borrowings 505,047 4,653 1.8 494,871 4,368 1.8
Loan capital 18,059 398 4.4 17,935 376 4.2
Other interest bearing liabilities3 180,112 3,231 3.6 176,399 2,905 3.3
Total interest bearing liabilities
and interest expense 722,205 8,448 2.3 708,776 7,802 2.2
Non-interest bearing liabilities
Deposits and payables due to other
financial institutions 48,999 47,978
Derivative financial instruments 38,089 36,916
Life insurance policy liabilities 8,736 9,013
All other liabilities4 12,150 12,248
Total non-interest bearing liabilities 107,974 106,155
Total liabilities 830,179 814,931
Shareholders' equity 62,978 61,051
Non-controlling interests 48 14
Total equity 63,026 61,065
Total liabilities and equity 893,205 875,996
Loans and other receivables1
Australia 585,112 12,953 4.4 574,357 12,779 4.5
New Zealand 74,796 1,774 4.7 72,807 1,736 4.8
Other overseas 31,921 435 2.7 28,072 325 2.3
Deposits and other borrowings
Australia 424,214 3,728 1.8 419,786 3,580 1.7
New Zealand 52,458 619 2.4 50,272 577 2.3
Other overseas 28,375 306 2.2 24,813 211 1.7
1 Loans and other receivables are stated net of provisions for impairment charges on loans. Other receivables include cash and
balances held with central banks and other interest earning assets. 2 Includes property and equipment, intangibles, deferred tax, non-interest bearing loans relating to mortgage offset accounts and other
assets. 3 Includes net impact of Treasury balance sheet management activities and the Bank Levy. 4 Includes other liabilities, provisions, current and deferred tax liabilities.
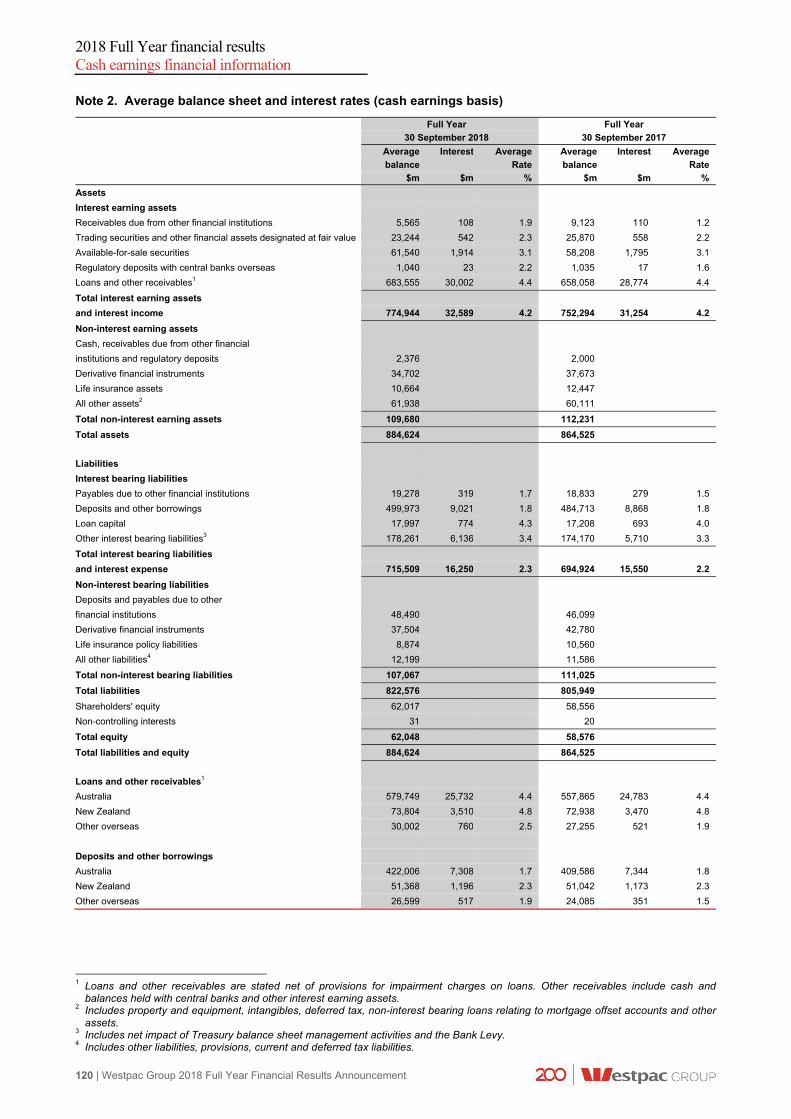
2018 Full Year financial results Cash earnings financial information
120 | Westpac Group 2018 Full Year Financial Results Announcement
Note 2. Average balance sheet and interest rates (cash earnings basis)
Full Year Full Year 30 September 2018 30 September 2017 Average Interest Average Average Interest Average
balance Rate balance Rate
$m $m % $m $m %
Assets
Interest earning assets
Receivables due from other financial institutions 5,565 108 1.9 9,123 110 1.2
Trading securities and other financial assets designated at fair value 23,244 542 2.3 25,870 558 2.2
Available-for-sale securities 61,540 1,914 3.1 58,208 1,795 3.1
Regulatory deposits with central banks overseas 1,040 23 2.2 1,035 17 1.6
Loans and other receivables1 683,555 30,002 4.4 658,058 28,774 4.4
Total interest earning assets
and interest income 774,944 32,589 4.2 752,294 31,254 4.2
Non-interest earning assets
Cash, receivables due from other financial
institutions and regulatory deposits 2,376 2,000
Derivative financial instruments 34,702 37,673
Life insurance assets 10,664 12,447
All other assets2 61,938 60,111
Total non-interest earning assets 109,680 112,231
Total assets 884,624 864,525
Liabilities
Interest bearing liabilities
Payables due to other financial institutions 19,278 319 1.7 18,833 279 1.5
Deposits and other borrowings 499,973 9,021 1.8 484,713 8,868 1.8
Loan capital 17,997 774 4.3 17,208 693 4.0
Other interest bearing liabilities3 178,261 6,136 3.4 174,170 5,710 3.3
Total interest bearing liabilities
and interest expense 715,509 16,250 2.3 694,924 15,550 2.2
Non-interest bearing liabilities
Deposits and payables due to other
financial institutions 48,490 46,099
Derivative financial instruments 37,504 42,780
Life insurance policy liabilities 8,874 10,560
All other liabilities4 12,199 11,586
Total non-interest bearing liabilities 107,067 111,025
Total liabilities 822,576 805,949
Shareholders' equity 62,017 58,556
Non-controlling interests 31 20
Total equity 62,048 58,576
Total liabilities and equity 884,624 864,525
Loans and other receivables1
Australia 579,749 25,732 4.4 557,865 24,783 4.4
New Zealand 73,804 3,510 4.8 72,938 3,470 4.8
Other overseas 30,002 760 2.5 27,255 521 1.9
Deposits and other borrowings
Australia 422,006 7,308 1.7 409,586 7,344 1.8
New Zealand 51,368 1,196 2.3 51,042 1,173 2.3
Other overseas 26,599 517 1.9 24,085 351 1.5
1 Loans and other receivables are stated net of provisions for impairment charges on loans. Other receivables include cash and
balances held with central banks and other interest earning assets. 2 Includes property and equipment, intangibles, deferred tax, non-interest bearing loans relating to mortgage offset accounts and other
assets. 3 Includes net impact of Treasury balance sheet management activities and the Bank Levy. 4 Includes other liabilities, provisions, current and deferred tax liabilities.

2018 Full Year financial results Cash earnings financial information
Westpac Group 2018 Full Year Financial Results Announcement | 121
Note 3. Net interest income (cash earnings basis)
% Mov't % Mov't
Half Year Half Year Sept 18 - Full Year Full Year Sept 18 -
$m Sept 18 March 18 Mar 18 Sept 18 Sept 17 Sept 17
Interest income
Cash and balances with central banks 185 140 32 325 241 35
Receivables due from other financial institutions 59 49 20 108 110 (2)
Net ineffectiveness of qualifying hedges - - - - - -
Trading securities and financial assets designated
at fair value 267 275 (3) 542 558 (3)
Available-for-sale securities 984 930 6 1,914 1,795 7
Loans 14,943 14,678 2 29,621 28,504 4
Regulatory deposits with central banks overseas 14 9 56 23 17 35
Other interest income 34 22 55 56 29 93
Total interest income 16,486 16,103 2 32,589 31,254 4
Interest expense
Payables due to other financial institutions (166) (153) 8 (319) (279) 14
Deposits and other borrowings (4,653) (4,368) 7 (9,021) (8,868) 2
Trading liabilities (579) (564) 3 (1,143) (1,898) (40)
Debt issues (2,392) (2,088) 15 (4,480) (3,585) 25
Loan capital (398) (376) 6 (774) (693) 12
Bank levy (192) (186) 3 (378) (95) large
Other interest expense (68) (67) 1 (135) (132) 2
Total interest expense (8,448) (7,802) 8 (16,250) (15,550) 5
Total net interest income 8,038 8,301 (3) 16,339 15,704 4

2018 Full Year financial results Cash earnings financial information
122 | Westpac Group 2018 Full Year Financial Results Announcement
Note 4. Non-interest income (cash earnings basis)
% Mov't % Mov't
Half Year Half Year Sept 18 - Full Year Full Year Sept 18 -
$m Sept 18 March 18 Mar 18 Sept 18 Sept 17 Sept 17
Fees and commissions
Facility fees 668 679 (2) 1,347 1,333 1
Transaction fees and commissions 552 553 - 1,105 1,193 (7)
Other non-risk fee income (18) 116 large 98 229 (57)
Total fees and commissions 1,202 1,348 (11) 2,550 2,755 (7)
Wealth management and insurance income
Life insurance and funds management
net operating income 958 823 16 1,781 1,600 11
General insurance and lenders mortgage insurance
net operating income 130 106 23 236 210 12
Total wealth management and insurance income 1,088 929 17 2,017 1,810 11
Trading income 419 507 (17) 926 1,217 (24)
Other income
Dividends received from other entities 2 1 100 3 2 50
Net gain on disposal of associates - - - - - -
Net gain on disposal of assets 14 10 40 24 6 large
Net gain/(loss) on hedging overseas operations - - - - - -
Net gain/(loss) on derivatives held for risk
management purposes1 18 14 29 32 (30) large
Net gain/(loss) on financial instruments designated
at fair value 12 26 (54) 38 11 large
Net gain/(loss) on disposal of controlled entities - (9) (100) (9) - -
Rental income on operating leases 12 14 (14) 26 32 (19)
Share of associates net profit (7) (3) 133 (10) 30 large
Other 2 13 (85) 15 19 (21)
Total other income 53 66 (20) 119 70 70
Total non-interest income 2,762 2,850 (3) 5,612 5,852 (4)
Wealth management and insurance income reconciliation
% Mov't % Mov't
Half Year Half Year Sept 18 - Full Year Full Year Sept 18 -
$m Sept 18 Mar 18 Mar 18 Sept 18 Sept 17 Sept 17
BTFG non-interest income 750 898 (16) 1,648 1,744 (6)
Net commission, premium, fee and banking income 86 (78) large 8 (147) large
BTFG wealth management and insurance income 836 820 2 1,656 1,597 4
NZ wealth management and insurance income 72 77 (6) 149 148 1
WIB wealth management income 180 32 large 212 93 128
CB and BB wealth management and insurance income - - - - (28) (100)
Total wealth management and insurance income 1,088 929 17 2,017 1,810 11
1 Net gain/(loss) on derivatives held for risk management purposes reflects the impact of economic hedges of foreign currency capital
and earnings.

2018 Full Year financial results Cash earnings financial information
Westpac Group 2018 Full Year Financial Results Announcement | 123
Note 5. Operating expenses (cash earnings basis)
% Mov't % Mov't
Half Year Half Year Sept 18 - Full Year Full Year Sept 18 -
$m Sept 18 March 18 Mar 18 Sept 18 Sept 17 Sept 17
Staff expenses
Employee remuneration, entitlements and on-costs 2,173 2,119 3 4,292 4,098 5
Superannuation expense 189 197 (4) 386 380 2
Share-based payments 47 48 (2) 95 113 (16)
Restructuring costs 80 34 135 114 75 52
Total staff expenses 2,489 2,398 4 4,887 4,666 5
Occupancy expenses
Operating lease rentals 313 319 (2) 632 649 (3)
Depreciation of property and equipment 79 85 (7) 164 179 (8)
Other 85 71 20 156 134 16
Total occupancy expenses 477 475 - 952 962 (1)
Technology expenses
Amortisation and impairment of software assets 317 303 5 620 628 (1)
Depreciation and impairment of IT equipment 68 73 (7) 141 158 (11)
Technology services 380 341 11 721 639 13
Software maintenance and licenses 157 185 (15) 342 313 9
Telecommunications 107 102 5 209 190 10
Data processing 39 38 3 77 80 (4)
Total technology expenses 1,068 1,042 2 2,110 2,008 5
Other expenses
Professional and processing services1 439 385 14 824 755 9
Amortisation and impairment of intangible assets 95 18 large 113 10 large
Postage and stationery 87 95 (8) 182 217 (16)
Advertising 80 93 (14) 173 155 12
Credit card loyalty programs 56 70 (20) 126 152 (17)
Non-lending losses 93 40 133 133 73 82
Other expenses 48 38 26 86 107 (20)
Total other expenses 898 739 22 1,637 1,469 11
Operating expenses 4,932 4,654 6 9,586 9,105 5
Note 6. Deferred expenses2
As at As at As at % Mov't % Mov't
30 Sept 31 March 30 Sept Spt 18 - Sept 18 -
$m 2018 2018 2017 Mar 18 Sept 17
Deferred acquisition costs 71 80 86 (11) (17)
Other deferred expenditure 29 30 28 (3) 4
1 Professional and processing services relates to:
- services provided by external suppliers including items such as cash handling and security services, marketing costs, and research and recruitment fees (Full Year 2018: $271 million; Full Year 2017: $268 million);
- operations processing (Full Year 2018: $195 million; Full Year 2017: $184 million); - consultants (Full Year 2018: $151 million; Full Year 2017: $162 million); - credit assessment (Full Year 2018: $58 million; Full Year 2017: $53 million); - legal and audit fees (Full Year 2018: $111 million; Full Year 2017: $61 million); - regulatory fees and share market related costs (Full Year 2018: $38 million; Full Year 2017: $27 million).
2 Deferred expenses principally relate to a small number of capitalised costs in the wealth business. It does not include insurance deferred acquisition costs (which are offset to revenue) or mortgage broker costs (which are offset to net interest income).

2018 Full Year financial results Cash earnings financial information
124 | Westpac Group 2018 Full Year Financial Results Announcement
Note 7. Earnings per share (cash earnings basis)
% Mov't % Mov't
Half Year Half Year Sept 18 - Full Year Full Year Sept 18 -
$m Sept 18 March 18 Mar 18 Sept 18 Sept 17 Sept 17
Cash earnings 3,814 4,251 (10) 8,065 8,062 -
Weighted average number of fully paid
ordinary shares (millions) 3,429 3,400 1 3,414 3,364 1
Cash earnings per ordinary share (cents) 111.2 125.0 (11) 236.2 239.7 (1)
Half Year Half Year Full Year Full Year Sept 18 March 18 Sept 18 Sept 17
Reconciliation of ordinary shares on issue before the effect of own shares held (millions) Opening balance 3,404 3,394 3,394 3,346 Number of shares issued under the Dividend Reinvestment Plan (DRP) 12 10 22 48 Number of shares issued as conversion of Westpac Convertible Preference Shares 19 - 19 -
Closing balance 3,435 3,404 3,435 3,394

2018
Ful
l Yea
r fin
anci
al re
sults
Cas
h ea
rnin
gs fi
nanc
ial i
nfor
mat
ion
Wes
tpac
Gro
up 2
018
Ful
l Yea
r F
inan
cial
Res
ults
Ann
ounc
emen
t | 1
25
No
te 8
. G
rou
p e
arn
ing
s re
con
cili
atio
n
Cas
h E
arn
ing
s ad
jus
tme
nts
Six
mo
nth
s to
30
Sep
tem
ber
20
18
Fai
r va
lue
A
mo
rtis
atio
n(g
ain
)/lo
ss
Ad
jus
tme
nt
Po
licyh
old
er
Rep
ort
edo
f in
tan
gib
leo
n e
co
no
mic
In
effe
ctiv
ere
late
d t
oT
reas
ury
Op
era
tin
gta
xC
ash
$m
resu
lts
asse
tsh
edg
es
hed
ges
Pen
dal
1sh
ares
leas
esre
cove
ries
earn
ing
sN
et in
tere
st in
com
e 8,
227
- (1
94)
5 -
- -
- 8,
038
Fee
s an
d co
mm
issi
on
1,20
2 -
-
- -
- -
- 1,
202
Wea
lth m
anag
em
ent
and
insu
ranc
e in
com
e
1,11
0 -
-
- -
2 -
(24)
1,08
8
Tra
ding
inco
me
45
8 -
(39)
-
- -
- -
419
Oth
er in
com
e
(17)
- 1
-
104
- (3
5)-
53
Non
-inte
rest
inco
me
2,75
3 -
(38)
-
104
2 (3
5)(2
4)2,
762
Net
ope
ratin
g in
com
e 10
,980
-
(232
) 5
104
2 (3
5)(2
4)10
,800
Sta
ff e
xpen
ses
(2,4
89)
- -
-
- -
- -
(2,4
89)
Occ
upan
cy e
xpen
ses
(512
)-
-
- -
- 35
-
(477
)
Tec
hnol
ogy
expe
nses
(1
,068
)-
-
- -
- -
- (1
,068
)
Oth
er e
xpen
ses
(898
)-
-
- -
- -
- (8
98)
Ope
ratin
g ex
pen
ses
(4,9
67)
- -
-
- -
35
- (4
,932
)
Co
re e
arn
ing
s
6,01
3 -
(232
) 5
104
2 -
(24)
5,86
8
Impa
irmen
t cha
rges
(3
17)
- -
-
- -
- -
(317
)
Op
era
tin
g p
rofi
t b
efo
re t
ax
5,69
6 -
(232
) 5
104
2 -
(24)
5,55
1
Inco
me
tax
exp
ens
e (1
,797
)-
69
(1)
(31)
1 -
24
(1,7
35)
Net
pro
fit
3,89
9 -
(163
) 4
73
3 -
- 3,
816
Net
pro
fit a
ttrib
utab
le to
non
-con
trol
ling
inte
rest
s (2
)-
-
- -
- -
- (2
)
NE
T P
RO
FIT
AT
TR
IBU
TA
BL
E T
O O
WN
ER
S O
F W
BC
3,
897
- (1
63)
4 73
3
- -
3,81
4
WB
C C
ash
Ear
nin
gs
ad
jus
tme
nts
:
Am
ortis
atio
n of
inta
ngib
le a
sset
s -
- -
-
- -
- -
-
Fai
r va
lue
(gai
n)/lo
ss o
n ec
onom
ic h
edge
s (1
63)
- 16
3
- -
- -
- -
Inef
fect
ive
hedg
es
4 -
-
(4)
- -
- -
-
Adj
ustm
ent r
elat
ed to
Pen
dal1
73
-
-
- (7
3)-
- -
-
Tre
asur
y sh
ares
3
- -
-
- (3
)-
- -
Cas
h e
arn
ing
s
3,81
4 -
-
- -
- -
- 3,
814
1 P
enda
l (pr
evio
usly
BT
IM)

2018
Ful
l Yea
r fin
anci
al re
sults
C
ash
earn
ings
fina
ncia
l inf
orm
atio
n 12
6 | W
estp
ac G
roup
201
8 F
ull Y
ear
Fin
anci
al R
esu
lts A
nnou
ncem
ent
No
te 8
. G
rou
p e
arn
ing
s re
con
cili
atio
n (
con
tin
ued
)
C
ash
Ear
nin
gs
adju
stm
en
ts
Six
mo
nth
s to
31
Mar
ch 2
018
F
air
valu
e
Am
ort
isat
ion
(gai
n)/
loss
Ad
jus
tme
nt
Po
licyh
old
er
R
epo
rted
of
inta
ng
ible
on
ec
on
om
icIn
effe
ctiv
ere
late
d t
o
Tre
asu
ryO
per
ati
ng
tax
Cas
h$m
re
sult
sas
sets
hed
ges
hed
ges
Pen
dal
1
shar
esle
ases
reco
veri
esea
rnin
gs
Net
inte
rest
inco
me
8,27
8 -
10
13
-
- -
- 8,
301
Fee
s an
d co
mm
issi
on
1,34
8 -
- -
-
- -
- 1,
348
Wea
lth m
anag
em
ent
and
insu
ranc
e in
com
e
951
- -
- -
(1
1)-
(11)
929
Tra
ding
inco
me
48
7 -
20
- -
-
- -
507
Oth
er in
com
e
89
- 23
-
-
- (4
6)-
66
Non
-inte
rest
inco
me
2,87
5 -
43
- -
(1
1)(4
6)(1
1)2,
850
Net
ope
ratin
g in
com
e 11
,153
-
53
13
-
(11)
(46)
(11)
11,1
51
Sta
ff e
xpen
ses
(2,3
98)
- -
- -
-
- -
(2,3
98)
Occ
upan
cy e
xpen
ses
(521
)-
- -
-
- 46
-
(475
)
Tec
hnol
ogy
expe
nses
(1
,042
)-
- -
-
- -
- (1
,042
)
Oth
er e
xpen
ses
(764
)25
-
- -
-
- -
(739
)
Ope
ratin
g ex
pen
ses
(4,7
25)
25
- -
-
- 46
-
(4,6
54)
Co
re e
arn
ing
s
6,42
8 25
53
13
-
(1
1)-
(11)
6,49
7
Impa
irmen
t cha
rges
(3
93)
- -
- -
-
- -
(393
)
Op
era
tin
g p
rofi
t b
efo
re t
ax
6,03
5 25
53
13
-
(1
1)-
(11)
6,10
4
Inco
me
tax
exp
ens
e (1
,835
)(8
)(1
6)(4
)-
1
- 11
(1
,851
)
Net
pro
fit
4,20
0 17
37
9
-
(10)
- -
4,25
3
Net
pro
fit a
ttrib
utab
le to
non
-con
trol
ling
inte
rest
s (2
)-
- -
-
- -
- (2
)
NE
T P
RO
FIT
AT
TR
IBU
TA
BL
E T
O O
WN
ER
S O
F W
BC
4,
198
17
37
9 -
(1
0)-
- 4,
251
WB
C C
ash
Ear
nin
gs
ad
jus
tme
nts
:
- -
- -
- -
Am
ortis
atio
n of
inta
ngib
le a
sset
s 17
(1
7)-
- -
-
- -
-
Fai
r va
lue
(gai
n)/lo
ss o
n ec
onom
ic h
edge
s 37
-
(37)
- -
-
- -
-
Inef
fect
ive
hedg
es
9 -
- (9
)-
-
- -
-
Adj
ustm
ent r
elat
ed to
Pen
dal1
-
- -
- -
-
- -
-
Tre
asur
y sh
ares
(1
0)-
- -
-
10
- -
-
Cas
h e
arn
ing
s
4,25
1 -
- -
-
- -
- 4,
251
1 P
enda
l (pr
evio
usly
BT
IM)

2018
Ful
l Yea
r fin
anci
al re
sults
Cas
h ea
rnin
gs fi
nanc
ial i
nfor
mat
ion
Wes
tpac
Gro
up 2
018
Ful
l Yea
r F
inan
cial
Res
ults
Ann
ounc
emen
t | 1
27
No
te 8
. G
rou
p e
arn
ing
s re
con
cili
atio
n (
con
tin
ued
)
C
ash
Ear
nin
gs
adju
stm
en
ts
Tw
elve
mo
nth
s to
30
Se
pte
mb
er
2018
F
air
valu
e
Am
ort
isat
ion
(gai
n)/
loss
Ad
jus
tme
nt
Po
licyh
old
er
R
epo
rted
of
inta
ng
ible
on
ec
on
om
icIn
effe
ctiv
ere
late
d t
o
Tre
asu
ryO
per
ati
ng
tax
Cas
h$m
re
sult
sas
sets
hed
ges
hed
ges
Pen
dal
1
shar
esle
ases
reco
veri
esea
rnin
gs
Net
inte
rest
inco
me
16,5
05
- (1
84)
18
-
- -
- 16
,339
Fee
s an
d co
mm
issi
on
2,55
0 -
- -
-
- -
- 2,
550
Wea
lth m
anag
em
ent
and
insu
ranc
e in
com
e
2,06
1 -
- -
-
(9)
- (3
5)2,
017
Tra
ding
inco
me
94
5 -
(19)
- -
-
- -
926
Oth
er in
com
e
72
- 24
-
104
-
(81)
- 11
9
Non
-inte
rest
inco
me
5,62
8 -
5 -
104
(9
)(8
1)(3
5)5,
612
Net
ope
ratin
g in
com
e 22
,133
-
(179
)18
10
4
(9)
(81)
(35)
21,9
51
Sta
ff e
xpen
ses
(4,8
87)
- -
- -
-
- -
(4,8
87)
Occ
upan
cy e
xpen
ses
(1,0
33)
- -
- -
-
81
- (9
52)
Tec
hnol
ogy
expe
nses
(2
,110
)-
- -
-
- -
- (2
,110
)
Oth
er e
xpen
ses
(1,6
62)
25
- -
-
- -
- (1
,637
)
Ope
ratin
g ex
pen
ses
(9,6
92)
25
- -
-
- 81
-
(9,5
86)
Co
re e
arn
ing
s
12,4
41
25
(179
)18
10
4
(9)
- (3
5)12
,365
Impa
irmen
t cha
rges
(7
10)
- -
- -
-
- -
(710
)
Op
era
tin
g p
rofi
t b
efo
re t
ax
11,7
31
25
(179
)18
10
4
(9)
- (3
5)11
,655
Inco
me
tax
exp
ens
e (3
,632
)(8
)53
(5
)(3
1)
2 -
35
(3,5
86)
Net
pro
fit
8,09
9 17
(1
26)
13
73
(7)
- -
8,06
9
Net
pro
fit a
ttrib
utab
le to
non
-con
trol
ling
inte
rest
s (4
)-
- -
-
- -
- (4
)
NE
T P
RO
FIT
AT
TR
IBU
TA
BL
E T
O O
WN
ER
S O
F W
BC
8,
095
17
(126
)13
73
(7
)-
- 8,
065
WB
C C
ash
Ear
nin
gs
ad
jus
tme
nts
:
Am
ortis
atio
n of
inta
ngib
le a
sset
s 17
(1
7)-
- -
-
- -
-
Fai
r va
lue
(gai
n)/lo
ss o
n ec
onom
ic h
edge
s (1
26)
- (1
26)
- -
-
- -
-
Inef
fect
ive
hedg
es
13
- -
(13)
-
- -
- -
Adj
ustm
ent r
elat
ed to
Pen
dal1
73
-
- -
(73)
-
- -
-
Tre
asur
y sh
ares
(7
)-
- -
-
7 -
- -
Cas
h e
arn
ing
s
8,06
5 -
- -
-
- -
- 8,
065
1 P
enda
l (pr
evio
usly
BT
IM).

2018
Ful
l Yea
r fin
anci
al re
sults
C
ash
earn
ings
fina
ncia
l inf
orm
atio
n 12
8 | W
estp
ac G
roup
201
8 F
ull Y
ear
Fin
anci
al R
esu
lts A
nnou
ncem
ent
No
te 8
. G
rou
p e
arn
ing
s re
con
cili
atio
n (
con
tin
ued
)
C
ash
Ear
nin
gs
adju
stm
en
ts
Tw
elve
mo
nth
s to
30
Se
pte
mb
er
2017
F
air
valu
e
Am
ort
isat
ion
(gai
n)/
loss
Ad
jus
tme
nt
Po
licyh
old
er
R
epo
rted
of
inta
ng
ible
on
ec
on
om
icIn
effe
ctiv
ere
late
d t
o
Tre
asu
ryO
per
ati
ng
tax
Cas
h$m
re
sult
sas
sets
hed
ges
hed
ges
Pen
dal
1
shar
esle
ases
reco
veri
esea
rnin
gs
Net
inte
rest
inco
me
15,5
16
- 16
6 22
-
- -
15,7
04
Fee
s an
d co
mm
issi
on
2,75
5 -
- -
-
- -
- 2,
755
Wea
lth m
anag
em
ent
and
insu
ranc
e in
com
e
1,80
0 -
- -
-
21
- (1
1)1,
810
Tra
ding
inco
me
1,
202
- 15
-
-
- -
- 1,
217
Oth
er in
com
e
529
13
(82)
- (2
79)
- (1
11)
- 70
Non
-inte
rest
inco
me
6,28
6 13
(6
7)-
(279
) 21
(1
11)
(11)
5,85
2
Net
ope
ratin
g in
com
e 21
,802
13
99
22
(2
79)
21
(111
)(1
1)21
,556
Sta
ff e
xpen
ses
(4,7
01)
- -
- 35
-
- -
(4,6
66)
Occ
upan
cy e
xpen
ses
(1,0
73)
- -
- -
-
111
- (9
62)
Tec
hnol
ogy
expe
nses
(2
,008
)-
- -
-
- -
- (2
,008
)
Oth
er e
xpen
ses
(1,6
52)
183
- -
-
- -
- (1
,469
)
Ope
ratin
g ex
pen
ses
(9,4
34)
183
- -
35
- 11
1 -
(9,1
05)
Co
re e
arn
ing
s
12,3
68
196
99
22
(244
) 21
-
(11)
12,4
51
Impa
irmen
t cha
rges
(8
53)
- -
- -
-
- -
(853
)
Op
era
tin
g p
rofi
t b
efo
re t
ax
11,5
15
196
99
22
(244
) 21
-
(11)
11,5
98
Inco
me
tax
exp
ens
e (3
,518
)(5
9)(3
0)(6
)73
-
- 11
(3
,529
)
Net
pro
fit
7,99
7 13
7 69
16
(1
71)
21
- -
8,06
9
Net
pro
fit a
ttrib
utab
le to
non
-con
trol
ling
inte
rest
s (7
)-
- -
-
- -
- (7
)
NE
T P
RO
FIT
AT
TR
IBU
TA
BL
E T
O O
WN
ER
S O
F W
BC
7,
990
137
69
16
(171
) 21
-
- 8,
062
WB
C C
ash
Ear
nin
gs
ad
jus
tme
nts
:
-
Am
ortis
atio
n of
inta
ngib
le a
sset
s 13
7 (1
37)
- -
-
- -
- -
Fai
r va
lue
(gai
n)/lo
ss o
n ec
onom
ic h
edge
s 69
-
(69)
- -
-
- -
-
Inef
fect
ive
hedg
es
16
- -
(16)
-
- -
- -
Adj
ustm
ent r
elat
ed to
Pen
dal1
(1
71)
- -
- 17
1
- -
- -
Tre
asur
y sh
ares
21
-
- -
-
(21)
- -
-
Cas
h e
arn
ing
s
8,06
2 -
- -
-
- -
- 8,
062
1 P
enda
l (pr
evio
usly
BT
IM)

2018 Full Year financial results Cash earnings financial information
Westpac Group 2018 Full Year Financial Results Announcement | 129
Note 9. Divisional result and economic profit
Group economic profit is defined as cash earnings plus a franking benefit equivalent of 70% of the value of Australian tax expense less a capital charge calculated at 11% of average ordinary equity.
Divisional economic profit is defined as cash earnings plus the franking benefit less a capital charge. The capital charge is calculated at 11% on allocated capital.
Economic profit is used as a key measure of financial performance because it focuses on shareholder value generated by requiring a return in excess of a risk-adjusted cost of capital.
BT Financial Westpac Six months to 30 September 2018 Consumer Business Group Institutional Westpac New $m Group Bank1 Bank1 (Australia)2 Bank Zealand3 Reported results 3,897 1,423 1,079 168 535 496 Cash earnings adjustments (83) - - 73 - (3) Cash earnings 3,814 1,423 1,079 241 535 493 Franking benefit 1,054 437 326 77 154 - Adjusted cash earnings 4,868 1,860 1,405 318 689 493 Average equity4 62,978 18,595 12,607 3,641 7,895 4,708 Capital charge (3,473) (1,025) (695) (201) (435) (260) Economic profit 1,395 835 710 117 254 233 Return on average equity
(including intangibles) 12.1% 12.7% 14.0% 8.4% 12.6% 18.9%
Six months to 31 March 2018 $m Reported results 4,198 1,702 1,078 404 551 451 Cash earnings adjustments 53 15 2 - - (10) Cash earnings 4,251 1,717 1,080 404 551 441 Franking benefit 1,147 516 324 122 123 - Adjusted cash earnings 5,398 2,233 1,404 526 674 441 Average equity4 61,051 17,626 12,527 3,545 8,196 4,614 Capital charge (3,349) (967) (687) (194) (450) (253) Economic profit 2,049 1,266 717 332 224 188 Return on average equity
(including intangibles) 14.0% 16.1% 14.1% 14.4% 12.6% 17.4% Twelve months to 30 September 2018 $m Reported results 8,095 3,125 2,157 572 1,086 947 Cash earnings adjustments (30) 15 2 73 - (13) Cash earnings 8,065 3,140 2,159 645 1,086 934 Franking benefit 2,201 953 650 199 277 - Adjusted cash earnings 10,266 4,093 2,809 844 1,363 934 Average equity4 62,017 18,112 12,567 3,593 8,045 4,661 Capital charge (6,822) (1,992) (1,382) (395) (885) (513) Economic profit 3,444 2,101 1,427 449 478 421 Return on average equity
(including intangibles) 13.0% 14.4% 14.1% 11.4% 12.6% 18.2% Twelve months to 30 September 2017 $m Reported results 7,990 3,039 1,993 896 1,159 903 Cash earnings adjustments 72 116 10 (160) - 14 Cash earnings 8,062 3,155 2,003 736 1,159 917 Franking benefit 2,153 946 603 221 277 - Adjusted cash earnings 10,215 4,101 2,606 957 1,436 917 Average equity4 58,556 15,281 11,875 3,562 8,809 4,611 Capital charge (6,441) (1,681) (1,306) (392) (969) (507) Economic profit 3,774 2,420 1,300 565 467 410 Return on average equity
(including intangibles) 13.8% 16.5% 13.6% 13.1% 12.3% 18.0%
1 Cash earnings adjustment relates to amortisation of intangible assets. 2 Cash earnings adjustment relates to amortisation of intangible assets and Pendal (BTIM). 3 In A$ equivalents. 4 For divisions average equity does not include intangible assets.

2018 Full Year financial results Other information
130 | Westpac Group 2018 Full Year Financial Results Announcement
6.0 Other information
6.1 Disclosure regarding forward-looking statements
This Full Year Financial Results Announcement contains statements that constitute ‘forward-looking statements’ within the meaning of Section 21E of the US Securities Exchange Act of 1934.
Forward-looking statements are statements about matters that are not historical facts. Forward-looking statements appear in a number of places in this Full Year Financial Results Announcement and include statements regarding Westpac’s intent, belief or current expectations with respect to its business and operations, market conditions, results of operations and financial condition, including, without limitation, future loan loss provisions and financial support to certain borrowers. Words such as ‘will’, ‘may’, ‘expect’, ‘intend’, ‘seek’, ‘would’, ‘should’, ‘could’, ‘continue’, ‘plan’, ‘estimate’, ‘anticipate’, ‘believe’, ‘probability’, ‘risk’, ‘aim’ or other similar words are used to identify forward-looking statements. These forward-looking statements reflect Westpac’s current views with respect to future events and are subject to change, certain risks, uncertainties and assumptions which are, in many instances, beyond Westpac’s control, and have been made based upon management’s expectations and beliefs concerning future developments and their potential effect upon Westpac. There can be no assurance that future developments will be in accordance with Westpac’s expectations or that the effect of future developments on Westpac will be those anticipated. Actual results could differ materially from those expected, depending on the outcome of various factors, including, but not limited to:
the effect of, and changes in, laws, regulations, taxation or accounting standards or practices and government policy, particularly changes to liquidity, leverage and capital requirements;
regulatory investigations and other actions, inquiries, litigation, fines, penalties, restrictions or other regulator imposed conditions, including as a result of our actual or alleged failure to comply with laws (such as financial crime laws), regulations or regulatory policy;
internal and external events which may adversely impact Westpac’s reputation;
information security breaches, including cyberattacks;
reliability and security of Westpac’s technology and risks associated with changes to technology systems;
the stability of Australian and international financial systems and disruptions to financial markets and any losses or business impacts Westpac or its customers or counterparties may experience as a result;
market volatility, including uncertain conditions in funding, equity and asset markets;
adverse asset, credit or capital market conditions;
an increase in defaults in credit exposures because of a deterioration in economic conditions;
the conduct, behaviour or practices of Westpac or its staff;
changes to Westpac’s credit ratings or the methodology used by credit rating agencies;
levels of inflation, interest rates, exchange rates and market and monetary fluctuations;
market liquidity and investor confidence;
changes in economic conditions, consumer spending, saving and borrowing habits in Australia, New Zealand and other countries in which Westpac or its customers or counterparties conduct their operations and Westpac’s ability to maintain or to increase market share, margins and fees, and control expenses;
the effects of competition, including from established providers of financial services and from non-financial services entities, in the geographic and business areas in which Westpac conducts its operations;
the timely development and acceptance of new products and services and the perceived overall value of these products and services by customers;
the effectiveness of Westpac’s risk management policies, including internal processes, systems and employees;
the incidence or severity of Westpac-insured events;
the occurrence of environmental change (including as a result of climate change) or external events in countries in which Westpac or its customers or counterparties conduct their operations;
changes to the value of Westpac’s intangible assets;
changes in political, social or economic conditions in any of the major markets in which Westpac or its customers or counterparties operate;
the success of strategic decisions involving diversification or innovation, in addition to business expansion activity, business acquisitions and the integration of new businesses; and
various other factors beyond Westpac’s control.

2018 Full Year financial results Other information
Westpac Group 2018 Full Year Financial Results Announcement | 131
6.1 Disclosure regarding forward-looking statements (continued)
The above list is not exhaustive. For certain other factors that may impact on forward-looking statements made by Westpac, refer to ‘Risk factors’ in the 2018 Westpac Group Annual Report. When relying on forward-looking statements to make decisions with respect to Westpac, investors and others should carefully consider the foregoing factors and other uncertainties and events.
Westpac is under no obligation to update any forward-looking statements contained in this Full Year Financial Results Announcement, whether as a result of new information, future events or otherwise, after the date of this Full Year Financial Results Announcement. 6.2 References to websites
Information contained in or accessible through the websites mentioned in this Full Year Financial Results Announcement does not form part of this Full Year Financial Results Announcement unless we specifically state that it is incorporated by reference and forms part of this Full Year Financial Results Announcement. All references in this Full Year Financial Results Announcement to websites are inactive textual references and are for information only. 6.3 Credit ratings1
Rating agency Long Term
Short. Term
Outlook
Fitch Ratings AA- F1+ Stable
Moody’s Investor Services Aa3 P-1 Stable
S&P Global Ratings AA- A-1+ Negative
6.4 Dividend reinvestment plan
Westpac operates a DRP that is available to holders of fully paid ordinary shares who are resident in, and whose address on the register of shareholders is in, Australia or New Zealand. As noted in Section 2.5, the Directors have made certain determinations in relation to the calculation of the market price which will apply to the DRP for the 2018 Full Year dividend only.
Shareholders who wish to commence participation in the DRP, or to vary their current participation election, must do so by 5.00pm (AEST) on 15 November 2018.
Shareholders can provide these instructions by:
For shareholders with holdings that have a market value of less than $50,000 (for a single holding) or less than $1,000,000 (per shareholding held within a Link Market Services portfolio), logging into the Westpac share registrar’s website at www.linkmarketservices.com.au and electing the DRP or amending their existing instructions online; or
Completing and returning a DRP Application or Variation form to Westpac’s share registry. Registry contact details are listed in Section 6.6.
6.5 Changes in control of Group entities
During the twelve months ended 30 September 2018 the following controlled entities were acquired, formed, reinstated or incorporated:
Crusade ABS Series 2017-1P Trust (formed 17 October 2017);
Crusade ABS Series 2018-1P (formed 14 August 2018);
Reinventure Special Purpose Investment Unit Trust (formed 26 April 2018);
Reinventure Fund III I.L.P (formed 3 August 2018); and
St.George Commercial Credit Corporation Limited (reinstated 13 July 2018).
1 As at 30 September 2018.

2018 Full Year financial results Other information
132 | Westpac Group 2018 Full Year Financial Results Announcement
During the twelve months ended 30 September 2018 the following controlled entities ceased to be controlled:
A.G.C. (Pacific) Limited (removed 26 April 2018);
Westpac Cook Cove Trust I (terminated 19 October 2017);
Westpac Cook Cove Trust II (terminated 19 October 2017);
Westpac Capital Holdings Inc (dissolved 21 November 2017);
Westpac Delta LLC (dissolved 21 November 2017);
Westpac Equity Pty Limited (deregistered 27 September 2018);
Westpac Funds Financing Holdco Pty Limited (deregistered 28 January 2018);
Westpac Funds Financing Pty Limited (deregistered 28 January 2018);
Crusade ABS Series 2013-1 Trust (terminated 1 July 2018);
Crusade Euro Trust No. 1E of 2007 (terminated 31 January 2018);
Crusade Global Trust No. 1 of 2007 (terminated 31 January 2018);
Crusade CP No. 1 Pty Ltd (deregistered 12 February 2018);
Hastings Funds Management (UK) Limited (sold 28 February 2018);
Hastings Infrastructure 1 Limited (sold 28 February 2018);
Hastings Infrastructure 2 Limited (sold 28 February 2018);
Infrastructure GP LLP (sold 28 February 2018);
Europe Infrastructure Debt L.P. (sold 28 February 2018);
Infrastructure GP 2 LLP (sold 28 February 2018);
Core Infrastructure Income Feeder 1 L.P. (sold 28 February 2018);
Core Infrastructure Income Feeder 2 L.P. (sold 28 February 2018);
Core Infrastructure Income Master L.P. (sold 28 February 2018);
Hastings Funds Management (USA) Inc (sold 28 February 2018);
Hastings Advisors LLC (sold 28 February 2018);
Hastings Investments GP LLC (sold 28 February 2018);
Hastings Investment Capital LP (sold 28 February 2018);
Hastings Korea Company Limited (sold 13 March 2018);
Hastings Funds Management Asia Pte Limited (sold 23 March 2018);
Hastings Forestry Investments Limited (removed 2 August 2018);
Hastings Forests Australia Pty Limited (deregistered 1 August 2018);
Hastings Private Equity Fund IIA Pty Limited (deregistered 13 September 2018); and
Hitton Pty Limited (deregistered 27 September 2018).

2018 Full Year financial results Other information
Westpac Group 2018 Full Year Financial Results Announcement | 133
6.6 Financial calendar and Share Registry details
Westpac shares are listed on the securities exchanges in Australia (ASX) and New Zealand (NZX) and as American Depository Receipts in New York. Westpac Capital Notes, Westpac Capital Notes 2, Westpac Capital Notes 3, Westpac Capital Notes 4 and Westpac Capital Notes 5 are listed on the ASX. Westpac NZD Subordinated Notes are listed on the NZX.
Important dates to note are set out below, subject to change. Payment of any distribution, dividend or interest payment is subject to the relevant payment conditions and the key dates for each payment will be confirmed to the ASX for securities listed on the ASX.
Westpac Ordinary Shares (ASX code: WBC, NZX code: WBC, NYSE code: WBK)
New York ex-dividend date for final dividend 9 November 2018 Ex-dividend date for final dividend 13 November 2018
New York record date for final dividend 13 November 2018
Record date for final dividend 14 November 2018
Annual General Meeting 12 December 2018
Final dividend payable 20 December 2018
Financial Half Year end 31 March 2019
Interim results and dividend announcement 6 May 2019
New York ex-dividend date for interim dividend 15 May 2019
Ex-dividend date for interim dividend 16 May 2019
New York record date for interim dividend 16 May 2019
Record date for interim dividend 17 May 2019
Interim dividend payable 3 July 2019
Financial Year end 30 September 2019
Final results and dividend announcement 4 November 2019
New York ex-dividend date for final dividend 8 November 2019
Ex-dividend date for final dividend 12 November 2019
New York record date for final dividend 12 November 2019
Record date for final dividend 13 November 2019
Annual General Meeting 12 December 20191
Final dividend payable 20 December 2019
Westpac Capital Notes (ASX code: WBCPD)
Ex-date for quarterly distribution 29 November 2018 Record date for quarterly distribution 30 November 2018
Payment date for quarterly distribution 10 December 20182
Ex-date for quarterly distribution 27 February 2019
Record date for quarterly distribution 28 February 2019
Payment date for quarterly distribution 8 March 2019
Ex-date for quarterly distribution 30 May 2019
Record date for quarterly distribution 31 May 2019
Payment date for quarterly distribution 11 June 20192
Ex-date for quarterly distribution 29 August 2019
Record date for quarterly distribution 30 August 20193
Payment date for quarterly distribution 9 September 20192
Ex-date for quarterly distribution 28 November 2019
Record date for quarterly distribution 29 November 20193
Payment date for quarterly distribution 9 December 20192
1 Details regarding the location of the meeting and the business to be dealt with will be contained in a Notice of Meeting sent to
shareholders in the November before the meeting. 2 Adjusted to next business day as payment date falls on a non-ASX business day. 3 Adjusted to immediately preceding business day as record date falls on a non-ASX business day.

2018 Full Year financial results Other information
134 | Westpac Group 2018 Full Year Financial Results Announcement
Westpac Capital Notes 2 (ASX code: WBCPE)
Ex-date for quarterly distribution 13 December 2018 Record date for quarterly distribution 14 December 20182
Payment date for quarterly distribution 24 December 20181
Ex-date for quarterly distribution 14 March 2019
Record date for quarterly distribution 15 March 2019
Payment date for quarterly distribution 25 March 20191
Ex-date for quarterly distribution 13 June 2019
Record date for quarterly distribution 14 June 20192
Payment date for quarterly distribution 24 June 20191
Ex-date for quarterly distribution 12 September 2019
Record date for quarterly distribution 13 September 20192
Payment date for quarterly distribution 23 September 2019
Ex-date for quarterly distribution 12 December 2019
Record date for quarterly distribution 13 December 20192
Payment date for quarterly distribution 23 December 2019
Westpac Capital Notes 3 (ASX code: WBCPF)
Ex-date for quarterly distribution 13 December 2018 Record date for quarterly distribution 14 December 2018
Payment date for quarterly distribution 24 December 20181
Ex-date for quarterly distribution 13 March 2019
Record date for quarterly distribution 14 March 2019
Payment date for quarterly distribution 22 March 2019
Ex-date for quarterly distribution 13 June 2019
Record date for quarterly distribution 14 June 2019
Payment date for quarterly distribution 24 June 20191
Ex-date for quarterly distribution 12 September 2019
Record date for quarterly distribution 13 September 20192
Payment date for quarterly distribution 23 September 20191
Ex-date for quarterly distribution 12 December 2019
Record date for quarterly distribution 13 December 20192
Payment date for quarterly distribution 23 December 20191
1 Adjusted to next business day as payment date falls on a non-ASX business day. 2 Adjusted to immediately preceding business day as record date falls on a non-ASX business day.

2018 Full Year financial results Other information
Westpac Group 2018 Full Year Financial Results Announcement | 135
Westpac Capital Notes 4 (ASX code: WBCPG)
Ex-date for quarterly distribution 20 December 2018 Record date for quarterly distribution 21 December 20182
Payment date for quarterly distribution 31 December 20181
Ex-date for quarterly distribution 21 March 2019
Record date for quarterly distribution 22 March 2019
Payment date for quarterly distribution 1 April 20191
Ex-date for quarterly distribution 20 June 2019
Record date for quarterly distribution 21 June 20192
Payment date for quarterly distribution 1 July 20191
Ex-date for quarterly distribution 19 September 2019
Record date for quarterly distribution 20 September 20192
Payment date for quarterly distribution 30 September 2019
Ex-date for quarterly distribution 19 December 2019
Record date for quarterly distribution 20 December 20192
Payment date for quarterly distribution 30 December 2019
Westpac Capital Notes 5 (ASX code: WBCPH)
Ex-date for quarterly distribution 13 December 2018 Record date for quarterly distribution 14 December 2018
Payment date for quarterly distribution 24 December 20181
Ex-date for quarterly distribution 13 March 2019
Record date for quarterly distribution 14 March 2019
Payment date for quarterly distribution 22 March 2019
Ex-date for quarterly distribution 13 June 2019
Record date for quarterly distribution 14 June 2019
Payment date for quarterly distribution 24 June 20191
Ex-date for quarterly distribution 12 September 2019
Record date for quarterly distribution 13 September 20192
Payment date for quarterly distribution 23 September 20191
Ex-date for quarterly distribution 12 December 2019
Record date for quarterly distribution 13 December 20192
Payment date for quarterly distribution 23 December 20191
1 Adjusted to next business day as payment date falls on a non-ASX business day. 2 Adjusted to immediately preceding business day as record date falls on a non-ASX business day.

2018 Full Year financial results Other information
136 | Westpac Group 2018 Full Year Financial Results Announcement
Westpac NZD Subordinated Notes 11 (ASX code: WBC010)
Ex-date for quarterly interest payment 20 November 2018 Record date for quarterly interest payment 21 November 2018
Payment date for quarterly interest payment 3 December 20181
Ex-date for quarterly interest payment 18 February 2019
Record date for quarterly interest payment 19 February 2019
Payment date for quarterly interest payment 1 March 2019
Ex-date for quarterly interest payment 21 May 2019
Record date for quarterly interest payment 22 May 2019
Payment date for quarterly interest payment 4 June 20191
Ex-date for quarterly interest payment 21 August 2019
Record date for quarterly interest payment 22 August 2019
Payment date for quarterly interest payment 2 September 20191
Ex-date for quarterly interest payment 20 November 2019
Record date for quarterly interest payment 21 November 2019
Payment date for quarterly interest payment 2 December 20191
1 Adjusted to next business day as payment date does not fall on a day on which banks are open for general business in Wellington
and Auckland, New Zealand and Sydney, Australia.

2018 Full Year financial results Other information
Westpac Group 2018 Full Year Financial Results Announcement | 137
Registered Office
Level 18 275 Kent Street Sydney NSW 2000 Australia Telephone: +61 2 9155 7713 Facsimile: +61 2 8253 4128 International: +61 2 9155 7700 Website: www.westpac.com.au/westpacgroup Share Registries
Australia
New Zealand
Ordinary shares on the main register, Westpac Capital Notes, Westpac Capital Notes 2, Westpac Capital Notes 3, Westpac Capital Notes 4 and Westpac Capital Notes 5
Ordinary shares on the New Zealand branch register and Westpac NZD Subordinated Notes
Link Market Services Limited Link Market Services Limited Level 12, 680 George Street Level 11, Deloitte Centre, 80 Queen Street Sydney NSW 2000 Australia Auckland 1010 New Zealand Postal Address: Locked Bag A6015, Sydney South NSW 1235, Australia
Postal Address: P.O. Box 91976, Auckland 1142, New Zealand
Website: www.linkmarketservices.com.au Email: [email protected]
Website: www.linkmarketservices.co.nz Email: [email protected]
Telephone: 1800 804 255 (toll free in Australia) International: +61 1800 804 255 Facsimile: +61 2 9287 0303
Telephone: 0800 002 727 (toll free in New Zealand) International: +64 9 375 5998 Facsimile: +64 9 375 5990
New York
For further information contact:
Depositary in USA for American Depositary Shares BNY Mellon Shareholder Services PO Box 505000 Louisville, KY 40233-5000, USA Website: www-us.computershare.com/investor Email: [email protected] Telephone: +1 888 269 2377 (toll free in USA) International: +1 201 680 6825
Media: David Lording, Group Head of Media Relations, +61 2 8219 8512
Analysts and Investors: Andrew Bowden, Head of Investor Relations +61 2 8253 4008

2018 Full Year financial results Other information
138 | Westpac Group 2018 Full Year Financial Results Announcement
6.7 Exchange rates
6.7.1 Exchange rates against A$
Twelve months to/as at 30 September 2018 30 September 2017 Currency Average Spot Average Spot US$ 0.7607 0.7218 0.7620 0.7844 GBP 0.5654 0.5521 0.6016 0.5846 NZ$ 1.0884 1.0920 1.0665 1.0867
Six months to/as at 30 September 2018 31 March 2018 30 September 2017
Currency Average Spot Average Spot Average Spot
US$ 0.7439 0.7218 0.7776 0.7670 0.7702 0.7844
GBP 0.5586 0.5521 0.5722 0.5447 0.5954 0.5846
NZ$ 1.0842 1.0920 1.0926 1.0652 1.0731 1.0867
6.7.2 Westpac New Zealand division performance (A$ Equivalent to Section 3.5)
Results have been translated into Australian dollars (A$) at the average exchange rates for each reporting period, Second Half 2018: $1.0842 (First Half 2018: $1.0926; Second Half 2017: $1.0731). Unless otherwise stated, assets and liabilities have been translated at spot rates as at the end of the reporting period.
% Mov't % Mov't
Half Year Half Year Sept 18 - Full Year Full Year Sept 18 -
$m Sept 18 March 18 Mar 18 Sept 18 Sept 17 Sept 17
Net interest income 877 843 4 1,720 1,629 6
Non-interest income 214 224 (4) 438 480 (9)
Net operating income 1,091 1,067 2 2,158 2,109 2
Operating expenses (431) (429) - (860) (903) (5)
Core earnings 660 638 3 1,298 1,206 8
Impairment (charges)/benefits 22 (24) large (2) 72 large
Operating profit before tax 682 614 11 1,296 1,278 1
Tax and non-controlling interests (189) (173) 9 (362) (361) -
Cash earnings 493 441 12 934 917 2
Economic profit 233 188 24 421 410 3
Expense to income ratio1 39.56% 40.14% (58bps) 39.85% 42.77% (292bps)
Net interest margin1 2.16% 2.15% 1bps 2.15% 2.03% 12bps
As at As at % Mov't As at As at % Mov't
30 Sept 30 March Sept 18 - 30 Sept 30 Sept Sept 18 -
$bn 2018 2018 Mar 18 2018 2017 Sept 17
Deposits2 56.7 57.9 (2) 56.7 53.7 6
Net loans 73.6 74.3 (1) 73.6 71.1 4
Deposit to loan ratio1 76.99% 77.88% (89bps) 76.99% 75.55% 144bps
Total assets 82.4 84.3 (2) 82.4 81.3 1
TCE 102.5 104.9 (2) 102.5 100.1 2
Third party liquid assets 6.9 8.1 (15) 6.9 8.0 (14)
Average interest-earning assets3 81.0 78.8 3 79.9 80.5 (1)
Total funds 9.8 9.7 1 9.8 9.3 5
1 Ratios calculated using NZ$. 2 Deposits refer to total customer deposits. 3 Averages are based on a six month period for the halves and a twelve month period for the full year and are converted at average
rates.

2018 Full Year financial results Other information
Westpac Group 2018 Full Year Financial Results Announcement | 139
6.7.3 Impact of exchange rate movements on Group results
Half Year Sept 18 vs Full Year Sept 18 vs
Half Year March 18 Full Year Sept 17
Cash Cash
earnings FX impact Growth earnings FX impact Growth
$m growth $m ex-FX growth $m ex-FX
Net interest income (3%) 12 (3%) 4% (36) 4%
Non-interest income (3%) 5 (3%) (4%) 50 (5%)
Net operating income (3%) 17 (3%) 2% 14 2%
Operating expenses 6% (6) 6% 5% 14 5%
Core earnings (10%) 11 (10%) (1%) 28 (1%)
Impairment charges (19%) - (19%) (17%) - (17%)
Operating profit before income tax (9%) 11 (9%) - 28 -
Income tax expense (6%) (4) (6%) 2% (10) 1%
Net profit (10%) 7 (10%) - 18 -
Net profit attributable to non-controlling interests - - - (43%) - (43%)
Cash earnings (10%) 7 (10%) - 18 -
6.7.4 Exchange rate risk on future NZ$ earnings
Westpac’s policy in relation to the hedging of the future earnings of the Group’s New Zealand division is to manage the economic risk for volatility of the NZ$ against A$. Westpac manages these flows over a time horizon under which up to 100% of the expected earnings for the following twelve months and 100% of the expected earnings for the subsequent twelve months can be hedged. As at 30 September 2018, Westpac has hedges in place for forecasts up to December 2018 with an average rate of $1.07.

2018 Full Year financial results Glossary
140 | Westpac Group 2018 Full Year Financial Results Announcement
7.0 Glossary
Shareholder value
Average ordinary equity
Average total equity less average non-controlling interests.
Average tangible ordinary equity
Average ordinary equity less average goodwill and other intangible assets (excluding capitalised software).
Cash earnings per ordinary share
Cash earnings divided by the weighted average ordinary shares (cash earnings basis).
Cash ROE Cash earnings divided by average ordinary equity.
Cash earnings to average tangible equity (ROTE)
Cash earnings divided by average tangible ordinary equity.
Dividend payout ratio – cash earnings
Ordinary dividend paid/declared calculated on issued shares divided by cash earnings.
Dividend payout ratio – net profit
Ordinary dividend paid/declared calculated on issued shares (net of Treasury shares) divided by the net profit attributable to owners of WBC.
Earnings per ordinary share
Net profit attributable to the owners of WBC divided by the weighted average ordinary shares (reported).
Economic profit – Divisions
Cash earnings less a capital charge calculated at 11% of allocated capital plus 70% of the value of Australian tax expense.
Economic profit – Group
Cash earnings less a capital charge calculated at 11% of average ordinary equity plus a value on franking credits calculated as 70% of the Group’s Australian tax expense.
Fully franked dividends per ordinary shares (cents)
Dividends paid out of retained profits which carry a credit for Australian company income tax paid by Westpac.
Net tangible assets per ordinary share
Net tangible assets (total equity less goodwill and other intangible assets less minority interests) divided by the number of ordinary shares on issue (reported).
Return on equity (ROE)
Net profit attributable to the owners of WBC divided by average ordinary equity.
Weighted average ordinary shares (cash earnings)
Weighted average number of fully paid ordinary shares listed on the ASX for the relevant period.
Weighted average ordinary shares (reported)
Weighted average number of fully paid ordinary shares listed on the ASX for the relevant period less Westpac shares held by the Group (‘Treasury shares’).
Productivity and efficiency
Expense to income ratio
Operating expenses divided by net operating income.
Full-time equivalent employees (FTE)
A calculation based on the number of hours worked by full and part-time employees as part of their normal duties. For example, the full-time equivalent of one FTE is 76 hours paid work per fortnight.
Revenue per FTE Total operating income divided by the average number of FTE for the period.
Business performance
Average interest-earning assets
The average balance of assets held by the Group that generate interest income. Where possible, daily balances are used to calculate the average balance for the period.
Average interest-bearing liabilities
The average balance of liabilities owed by the Group that incur an interest expense. Where possible, daily balances are used to calculate the average balance for the period.
Divisional margin Net interest income (including capital benefit) for a division as a percentage of the average interest earning assets for that division.
Net interest margin Calculated by dividing net interest income by average interest-earning assets.
Interest spread The difference between the average yield on all interest-earning assets and the average rate paid on interest bearing liabilities.
Capital adequacy
Common equity tier 1 capital ratio
Total common equity capital divided by risk weighted assets, as defined by APRA.
Credit risk weighted assets (Credit RWA)
Credit risk weighted assets represent risk weighted assets (on-balance sheet and off-balance sheet) that relate to credit exposures and therefore exclude market risk, operational risk, interest rate risk in the banking book and other assets.
Internationally comparable capital ratios
Internationally comparable regulatory capital ratios are Westpac’s estimated ratios after adjusting the capital ratios determined under APRA Basel III regulations for various items. Analysis aligns with the APRA study titled “International capital comparison study” dated 13 July 2015.

2018 Full Year financial results Glossary
Westpac Group 2018 Full Year Financial Results Announcement | 141
Capital adequacy (cont’d)
Risk weighted assets (RWA)
Assets (both on and off-balance sheet) are risk weighted according to each asset’s inherent potential for default and what the likely losses would be in case of default. In the case of non-asset backed risks (ie. market and operational risk), RWA is determined by multiplying the capital requirements for those risks by 12.5.
Tier 1 capital ratio Total Tier 1 capital divided by risk weighted assets, as defined by APRA.
Total regulatory capital ratio
Total regulatory capital divided by risk weighted assets, as defined by APRA.
APRA leverage ratio Tier 1 capital divided by ‘exposure measure’ and expressed as a percentage. ‘Exposure measure’ is the sum of on-balance sheet exposures, derivative exposures, securities financing transaction exposures and other off-balance sheet exposures.
Funding and liquidity
Committed Liquidity Facility (CLF)
The RBA makes available to Australian Authorised Deposit-taking Institutions a CLF that, subject to qualifying conditions, can be accessed to meet LCR requirements under APS210 Liquidity.
Deposit to loan ratio Customer deposits divided by total loans.
High Quality Liquid Assets (HQLA)
Assets which meet APRA’s criteria for inclusion as HQLA in the numerator of the LCR.
Liquidity Coverage Ratio (LCR)
An APRA requirement to maintain an adequate level of unencumbered high quality liquid assets, to meet liquidity needs for a 30 calendar day period under an APRA-defined severe stress scenario. Absent a situation of financial stress, the value of the LCR must not be less than 100%, effective 1 January 2015. LCR is calculated as the percentage ratio of stock of HQLA and CLF over the total net cash out-flows in a modelled 30 day defined stressed scenario.
Net Stable Funding Ratio (NSFR)
The NSFR is defined as the ratio of the amount of available stable funding (ASF) to the amount of required stable funding (RSF) defined by APRA. The amount of ASF is the portion of an ADI’s capital and liabilities expected to be a reliable source of funds over a one year time horizon. The amount of RSF is a function of the liquidity characteristics and residual maturities of an ADI’s assets and off-balance sheet activities. ADI’s must maintain an NSFR of at least 100%.
Third party liquid assets
HQLA and non LCR qualifying liquid assets, but excludes internally securitised assets that are eligible for a repurchase agreement with the RBA and RBNZ.
Total liquid assets Third party liquid assets and internally securitised assets that are eligible for a repurchase agreement with a central bank.
Asset quality
90 days past due and not impaired
Includes facilities where:
contractual payments of interest and / or principal are 90 or more calendar days overdue, including overdrafts or other revolving facilities that remain continuously outside approved limits by material amounts for 90 or more calendar days (including accounts for customers who have been granted hardship assistance); or
an order has been sought for the customer’s bankruptcy or similar legal action has been instituted which may avoid or delay repayment of its credit obligations; and
the estimated net realisable value of assets / security to which Westpac has recourse is sufficient to cover repayment of all principal and interest, or where there are otherwise reasonable grounds to expect payment in full and interest is being taken to profit on an accrual basis.
These facilities, while in default, are not treated as impaired for accounting purposes.
Collectively assessed provisions (CAPs)
Loans not found to be individually impaired or significant will be collectively assessed in pools of similar assets with similar risk characteristics. The size of the provision is an estimate of the losses already incurred and will be estimated on the basis of historical loss experience for assets with credit characteristics similar to those in the collective pool. The historical loss experience will be adjusted based on current observable data. Included in the collectively assessed provision is an economic overlay provision which is calculated based on changes that occurred in sectors of the economy or in the economy as a whole.
Impaired assets Includes exposures that have deteriorated to the point where full collection of interest and principal is in doubt, based on an assessment of the customer’s outlook, cash flow, and the net realisation of value of assets to which recourse is held:
facilities 90 days or more past due, and full recovery is in doubt: exposures where contractual payments are 90 or more days in arrears and the net realisable value of assets to which recourse is held may not be sufficient to allow full collection of interest and principal, including overdrafts or other revolving facilities that remain continuously outside approved limits by material amounts for 90 or more calendar days;
non-accrual assets: exposures with individually assessed impairment provisions held against them, excluding restructured loans;
restructured assets: exposures where the original contractual terms have been formally modified to provide for concessions of interest or principal for reasons related to the financial difficulties of the customer;
other assets acquired through security enforcement (includes other real estate owned): includes the value of any other assets acquired as full or partial settlement of outstanding obligations through the enforcement of security arrangements; and
any other assets where the full collection of interest and principal is in doubt.

2018 Full Year financial results Glossary
142 | Westpac Group 2018 Full Year Financial Results Announcement
Asset quality (cont’d)
Individually assessed provisions (IAPs)
Provisions raised for losses that have already been incurred on loans that are known to be impaired and are assessed on an individual basis. The estimated losses on these impaired loans is based on expected future cash flows discounted to their present value and, as this discount unwinds, interest will be recognised in the income statement.
Stressed assets Watchlist and substandard, 90 days past due and not impaired and impaired assets.
Total committed exposure (TCE)
Represents the sum of the committed portion of direct lending (including funds placement overall and deposits placed), contingent and pre-settlement risk plus the committed portion of secondary market trading and underwriting risk.
Watchlist and substandard
Loan facilities where customers are experiencing operating weakness and financial difficulty but are not expected to incur loss of interest or principal.
Other
Credit Value Adjustment (CVA)
CVA adjusts the fair value of over-the-counter derivatives for credit risk. CVA is employed on the majority of derivative positions and reflects the market view of the counterparty credit risk. A Debit Valuation Adjustment (DVA) is employed to adjust for our own credit risk.
Divisional results Divisional results are presented on a management reporting basis. Internal charges and transfer pricing adjustments are included in the performance of each division reflecting the management structure rather than the legal entity (these results cannot be compared to results for individual legal entities). Where management reporting structures or accounting classifications have changed, financial results for comparative periods have been revised and may differ from results previously reported. Overhead costs are allocated to revenue generating divisions.
The Group’s internal transfer pricing frameworks facilitate risk transfer, profitability measurement, capital allocation and divisional alignment, tailored to the jurisdictions in which the Group operates. Transfer pricing allows the Group to measure the relative contribution of products and divisions to the Group’s interest margin and other dimensions of performance. Key components of the Group’s transfer pricing frameworks are funds transfer pricing for interest rate and liquidity risk and allocation of basis and contingent liquidity costs, including capital allocation.
First Half 2018 Six months ended 31 March 2018.
Full Year 2018 Twelve months ended 30 September 2018.
Full Year 2017 Twelve months ended 30 September 2017.
Net Promoter Score (NPS)
Net Promoter Score measures the net likelihood of recommendation to others of the customer’s main financial institution for retail or business banking. Net Promoter ScoreSM is a trademark of Bain & Co Inc., Satmetrix Systems, Inc., and Mr Frederick Reichheld.
For retail banking, using a scale of 1 to 10 (1 means ‘extremely unlikely’ and 10 means ‘extremely likely’), the 1-6 raters (detractors) are deducted from the 9-10 raters (promoters); and
For business banking, using a scale of 0 to 10 (0 means ‘extremely unlikely’ and 10 means ‘extremely likely’), the 0-6 raters (detractors) are deducted from the 9-10 raters (promoters).
Prior corresponding period
Refers to the six months ended 30 September 2017.
Prior half / Prior period
Refers to the six months ended 31 March 2018.
Run-off Scheduled and unscheduled repayments and debt repayments (from, for example, property sales and external refinancing), net of redraws.
Second Half 2018 Six months ended 30 September 2018.
Women in Leadership
Women in Leadership refers to the proportion of women (permanent and maximum term) in leadership roles across the Group. It includes the CEO, Group Executive, General Managers, senior leaders with significant influence on business outcomes (direct reports to General Managers and their direct reports), large (3+) team people leaders three levels below General Manager, and Bank and Assistant Bank Managers.