2018 free state economic small business development
TRANSCRIPT

VOTE NO. 3
ANNUAL REPORT2017/18 FINANCIAL YEAR
DEPARTMENT OF ECONOMIC, SMALL BUSINESS DEVELOPMENT, TOURISM AND ENVIRONMENTAL AFFAIRS
FREE STATE PROVINCE
Free State Departm
ent of Economic, Sm
all Business Developm
ent, Tourism and Environm
ental Aff
airs Annual Report 2017/ 2018
Free State Department of Economic, Small Business Development, Tourism and
Environmental Affairs Annual Report 2017/ 2018
Physical: 113 St Andrew Street, Bloemfontein, 9300
Postal: P.O. Box X20801, Bloemfontein, 9300
Tel: (051) 400 9542Email: [email protected]
Website: www.detea.fs.gov.za
PR305/2018ISBN: 978-0-621-46603-4

1
VOTE NO. 3
ANNUAL REPORT2017/18 FINANCIAL YEAR

2
Contents
PART A: GENERAL INFORMATION 4
1. DEPARTMENT GENERAL INFORMATION 5
2. LIST OF ABBREVIATIONS/ACRONYMS 6
3. FOREWORD BY THE MEC 8
4. REPORT OF THE ACCOUNTING OFFICER 10
5. STATEMENT OF RESPONSIBILITY AND CONFIRMATION OF ACCURACY FOR THE ANNUAL REPORT 15
6. STRATEGIC OVERVIEW 16
6.1. Vision 16
6.2. Mission 16
6.3. Values 16
7. LEGISLATIVE AND OTHER MANDATES 16
8. ORGANISATIONAL STRUCTURE 20
9. ENTITIES REPORTING TO THE MEC 21
PART B: PERFORMANCE INFORMATION 22
1. AUDITOR GENERAL’S REPORT: PREDETERMINED OBJECTIVES 23
2. OVERVIEW OF DEPARTMENTAL PERFORMANCE 23
2.1 Service Delivery Environment 23
2.2 Service Delivery Improvement Plan 36
2.3 Organisational environment 38
2.4 Key policy developments and legislative changes 40
3. STRATEGIC OUTCOME ORIENTED GOALS 41
4. PERFORMANCE INFORMATION BY PROGRAMME 43
4.1 Programme 1: Administration 43
4.2 Programme 2: Environmental Affairs 564.3 Programme 3: Economic and Small Business Development 63
4.4 Programme 4: Tourism Development 69

3
5. TRANSFER PAYMENTS 74
5.1. Transfer payments to public entities 74
5.2. Transfer payments to all organisations other than public entities 75
6. CONDITIONAL GRANTS 76
6.1. Conditional grants and earmarked funds paid 76
6.2. Conditional grants and earmarked funds received 77
7. DONOR FUNDS 78
7.1. Donor Funds Received 78
8. CAPITAL INVESTMENT 78
8.1. Capital investment, maintenance and asset management plan 78
PART C: GOVERNANCE 81
1. INTRODUCTION 82
2. RISK MANAGEMENT 82
3. FRAUD AND CORRUPTION 82
4. MINIMISING CONFLICT OF INTEREST 83
5. CODE OF CONDUCT 83
6. HEALTH SAFETY AND ENVIRONMENTAL ISSUES 84
7. PORTFOLIO COMMITTEES 86
8. SCOPA RESOLUTIONS 86
9. PRIOR MODIFICATIONS TO AUDIT REPORTS 87
10. INTERNAL CONTROL UNIT 87
11. INTERNAL AUDIT AND AUDIT COMMITTEES 88
12. AUDIT COMMITTEE REPORT 89
PART D: HUMAN RESOURCE MANAGEMENT 92
1. INTRODUCTION 93
2. OVERVIEW OF HUMAN RESOURCES 93
3. HUMAN RESOURCES OVERSIGHT STATISTICS 97
PART E: FINANCIAL INFORMATION 129
1. REPORT OF THE AUDITOR GENERAL 130
2. ANNUAL FINANCIAL STATEMENTS 140

4
PART A: GENERAL INFORMATION
PART A: GENERAL INFORMATION

5
1. DEPARTMENT GENERAL INFORMATION
PHYSICAL ADDRESS: 113 St Andrews Street
Bloemfontein
9300
POSTAL ADDRESS: Private Bag X20801
Bloemfontein
9300
TELEPHONE NUMBER/S: 051 400 9542
EMAIL ADDRESS: [email protected]
WEBSITE ADDRESS : www.detea.fs.gov.za

6
2. LIST OF ABBREVIATIONS/ACRONYMS
Acronyms Description
AIDS AcquiredImmuneDeficiencySyndrome
AMKPI Asset Management Key Performance Indicator
APP Annual Performance Plan
AQMP Air Quality Management Plan
BAS Basic Accounting System
BBBEE Broad Based Black Economic Empowerment
CCCU Central Communication Coordinating Unit
DCC Departmental Consultative Committee
DESTEA Department of Economic, Small Business Development, Tourism and Environmental Affairs
DM District Municipality
DMP Demand Management Plan
EIA Environmental Impact Assessment
EIP Environmental Implementation Plan
EHWP Employee Health and Wellness Programme
EMC Environmental Management Committee
EPWP Expanded Public Works Programme
ETEYA Emerging Tourism Entrepreneur of the Year Awards
EXCO Executive Council
FDC Free State Development Corporation
FS Free State
FSGDS Free State Growth and Development Strategy
GDP Gross Domestic Product
GIAMA Government Immovable Asset Management Act
HIV HumanImmuneDeficiencyVirus
HOD Head of Department
HR Human Resource
ICT Information Communication Technology

7
IDP Integrated Development Plan
IEMFFS Integrated Environmental Management Framework of Free State
ITC Information Technology and Communication
IWMP Integrated Waste Management Plan
LED Local Economic Development
MEC Member of the Executive Council
MSP Master Systems Plan
MTSF Medium-Term Strategic Framework
MTEF Medium-Term Expenditure Framework
NEMA National Environmental Management Act
NSSD National Strategy on Sustainable Development
PA Protected Area
PP Procurement Plan
PMDS Performance Management Development System
PFMA Public Finance Management Act
PGDS Provincial Growth and Development Strategy
PMG Pay Master General
PSBAC Provincial Small Business Advisory Council
RIDS Regional Industrial Development Strategy
SDIP Service Delivery Improvement Plan
SITA State Information Technology Agency
SMME Small, Medium and Micro Enterprise
SMS Senior Management Services
SRI Social Responsibility Initiatives
Stats SA Statistics South Africa
DTI Department of Trade and Industry
UAMP User Asset Management Plan
VCCT VoluntaryandConfidentialCounsellingandTesting
WIS Waste Information System
LOGIS Logistics Information System
CSD Central Supplier Database

8
3. FOREWORD BY THE MEC
During its 54th National Conference in December 2017, the ruling Party, the ANC, resolved to have met under the theme of “Remember Tambo: Towards Unity, Renewal and Radical Socio-economic Transformation”. The ANC further emphasized that the purpose of the Conference was “to remind ourselvesofComradeOR’slegacyofselflessservicetohispeopleandourdutytoemulatehiminworking for the unity and renewal of our organization”.
The above has also been our driving force as the Department, consorting to the ANC mandate of a united and committed organization to the people’s interests as a best vehicle to bring about fundamental and radical socio-economic transformation of society to create a better life for all South Africans. In executing its Political, Policy and Administrative mandate, the Department has continued in 2017/2018 to deal with the triple challenges that are affecting the lives of Free State Citizens, which are Poverty, Inequality and Unemployment. It is our Vision that by 2020 we should be able to realise a transformed economy and a prosperous society that is living in harmony with its natural resources. When we presented our 2017/2018 Annual Performance Plan, we set ourselves some key milestones that we had to pursue to achieve our mandate and these were:
• Provisionofleadershipforeffectivesocio-economicdevelopment.
• Creationofefficientandeffectivefinancialmanagementsystemforsustainability.
• BuildaresponsiveHumanResourceattributedthatisresponsivetoservicedemands.
• Implicationsofintegratedeconomicdevelopmentforradicaltransformation
• Inculcateaccountableenvironmentalmanagementforsustainabledevelopment&inclusive economic growth.
• FosterTourismsectortransformationanddevelopmentforimprovedmarketshare
• Businessprocessoptimisationforbetterprogrammeperformanceandco-operation.
These were the principles from which the Department operated and yielded positive results in variousrespect.Inthepastfinancialyear,1150directandindirectjobswerecreatedthroughvariousinitiatives aimed at developing and supporting SMMEs in the province. Opportunities have been createdthroughprojectssuchas:
• GreenestandCleanestMunicipalityCompetition

9
• UpgradingofResortsandReserves.
• MECsRoadshows.
• InvestSAOne-Stop-Shop
• BlackIndustrialistSupportProgramme
• Maluti-A-PhofungSpecialEconomicZone(MAP-SEZ)
• SMMEFunding
• TabalazaPitchingProgramme
• Economicrevitalizationoftownships
• FlowerFestival
The Department`s intention with these initiatives was to create favourable conditions for businesses to thrive, changing the lives of the people for the better; supporting the statement by the former State President Nelson Mandela when he said, “Let there be work, bread, water and salt for all”.
The Department needs to further enhance and strengthen its efforts to realise its contribution towards RadicalSocio-economicTransformation.ThefiguresreleasedbyStatsSAforemploymentinQuarter1 of 2018/2019 serve as a wake-up call for the Department to intensify its efforts in transforming theeconomy,tourismandenvironmentintheFreeState.StatsSAhasindicatedthatfiveprovinceswhich are the Free State, Gauteng, Western Cape, North West and Mpumalanga experienced quarter-to-quarter(Q1:2018toQ2:2018)increasesintheofficialrateofunemployment.TheFreeState recorded an increase of 1.6 percentage points in the unemployment rate in Q2:2018 compared to Q1:2018. The above statistics are a clarion call that economic development and tourism must be abletostimulatejobcreationintheProvince.
The world is now investing in tourism for economic development and Free State is no different. We are realizing the potential of the tourism industry in changing the lives of ordinary people. More and morepeopleareencouragedtoventureintotheTourismIndustrybyexposingthemtoprojectsandprogrammes like Medical Tourism, Lilizela Tourism Awards, Flower Festival and many others.
Keepingtheenvironmentclean,healthyandsafeisalsoourpriorityinthisfinancialyear.EnvironmentalManagement, especially transformation in the wild life economy is necessary to ensure participation of previously disadvantaged communities and mainstream economy.
_________________
Ms. L.P. Mahasa
MEC: Department of Economic, Small Business Development, Tourism and
Environmental Affairs
31 May 2018

10
4. REPORT OF THE ACCOUNTING OFFICER
• Overviewoftheoperationsofthedepartment:
The main focus and mandate of the Department of Economic, Small Business Development, Tourism and Environmental Affairs is to champion economic activities in the Free State in order to ensure that the government programmes make a difference in the lives of our People. Our programmes for the period under review are motivated by the principles of the National Development Plan, the Free State Growth and Development Strategy, the State of the Nation Address, the State of the Province Address and the department’s Budget Vote.
The report contained in this document will outline the operation of the department which focus primarily on:
1. Radical Socio – Economic Transformation
2. Foreign Direct Investment
3. Business Regulation
4. Tourism Development
5. Environmental Management and
6. Effective Governance
The accomplishment of our programme of action primarily depends on co-ordination and alliance with other stakeholders like: National Departments and Provincial Departments, State owned agencies, Municipalities, Institutions of Higher Learning and other associations.
In our effort to improve service delivery to the People of the Free State, focus was placed onadministrativeandfiscaldisciplinewhichincludefillingofcriticalvacantfundedpositionsin the department.

11
• Overviewofthefinancialresultsofthedepartment:
o Departmental receipts
Departmental receipts
2016/2017 2017//2018Estimate Actual
Amount Collected
(Over)/UnderCollection
Estimate Actual
Amount Collected
(Over)/Under
Collection
R’000 R’000 R’000 R’000 R’000 R’000Sale of goods and services other than capital assets
25 268 10,428 14 839 21 374 12,218 9 156
Fines, penalties and forfeits
711 30 681 134 393 (259)
Interest, dividends and rent on land
12 28 (15) 12 28 (16)
Financial transactions in assets and liabilities
164 850 (687) 794 1,169 (375)
Total 26 155 11.336 14 818 22 314 13.808 8 506
- The Department submits an annual application for revenue tariffs to the Provincial Treasury after consultation with various managers in the resorts, game reserves and the compliance and law enforcement units. Factors that are taken into consideration include, but are not limited to, the current condition of the resorts and the prices charged in the private sector, as well as any planned renovations for these facilities.
• Salesofgoodsandservices
The Department was unable to collect all the revenue estimated even though the annual gameauctiontookplace.Revenuefromthisactivityisdeemedtobeamajorsourceofincome for the Department and formed 92% of total revenue in 2017/18, because it also includes the sale of game as butchery meat during the culling process.
The Phillip Sanders facility still needs a lot of repairs and maintenance to be fully operational so that the Department can fully derive revenue from the resort.
• Fines,PenaltiesandForfeits
TheDepartmentwasunabletorecoverrevenueformthefineswhichwereissuedasaresultofSection24GoftheNationalEnvironmentalManagementAct(NEMA)becausecompanies that were issued with these penalties have made representations to the Department for leniency through the approach process and the cases have not been finalized.

12
• FinancialTransactionsinAssetsandLiabilities
Revenue was raised through the recovery of debts on salaries overpayment, claims from other Departments and telecommunications recovery of overspending. The Department is rolling out the speed points throughout the reserves and resorts so that tourists’ payments can be electronically processed to deal with the risk of theft.
o ProgrammeExpenditure
Programme Name
2016/2017 2017/2018Final
AppropriationActual
Expenditure
(Over)/Under
Expenditure
Final Appropriation
Actual
Expenditure
(Over)/UnderExpenditure
R’000 R’000 R’000 R’000 R’000 R’000
Administration 136,439 134,744 1,695 141,099 141,056 43
Environmental Affairs
146,442 139,488 6,954 136,691 137,858
(1,167)
Economic Development
114,378 113,353 1,025 218,167 201,075 17,092
Tourism 77,737 75,491 2,246 9,191 8,937 254
TOTAL 474,996 463,076 11,920 505,148 488,296 16,222
o Virements/roll overs
Therearenorolloversrequestsforthecurrentfinancialyear.
Virements
Programme Amount (R’000)
Administration 1 100Economic Development 2 982Environmental Affairs (3942)
Tourism (140)Total 0

13
• Adescriptionofthereasonsforunauthorised,fruitlessandwastefulexpenditureand the amounts involved as well as steps taken to address and prevent arecurrence:
o The Department incurred unauthorized expenditure on compensation of employees due to provintial budget allocation reductions - year.
• Futureplansofthedepartment:
o Future plans of the Department are to upgrade and market the reserves and resorts in ordertoderivemaximumrevenueforthecontributionintotheProvincialfiscus.
• PublicPrivatePartnerships
o None
• Discontinuedactivities/activitiestobediscontinued
o None
• Neworproposedactivities
o None
• Supplychainmanagement
o There were no unsolicited bid proposals concluded for the year under review. SCM processesandsystemsareinplacetoprevent(and/ordetect)irregularexpenditure.
o The Departmental Supply Chain Management Policy has been reviewed and includes new Regulations
o Lack of automated systems.
• GiftsandDonationsreceivedinkindfromnon-relatedparties
o None
• ExemptionsanddeviationsreceivedfromtheNationalTreasury
o None

14
• Appreciation
o I thank the Executive Council of the Province led by the Honorable Premier for their leadership, the MEC for strategic guidance and support, Senior Management of the Department, and staff in general for their support and dedication to serve.
_______________________
DrMNokwequ
ActingAccountingOfficer
Department of Department of Economic, Small Business Development, Tourism and Environmental Affairs
Date: 31 May 2018

15
5. STATEMENT OF RESPONSIBILITY AND CONFIRMATION OF ACCURACY FOR THE ANNUAL REPORT
Tothebestofmyknowledgeandbelief,Iconfirmthefollowing:
All information and amounts disclosed throughout the annual report are consistent.
The annual report is complete, accurate and is free from any omissions.
The annual report has been prepared in accordance with the guidelines on the annual report as issued by National Treasury.
TheAnnualFinancialStatements(PartE)havebeenpreparedinaccordancewiththemodifiedcashstandardandtherelevant frameworksandguidelines issuedbythe National Treasury.
TheAccounting Officer is responsible for the preparation of the annual financialstatementsandforthejudgementsmadeinthisinformation.
TheAccountingOfficer isresponsible forestablishing,and implementingasystemof internal control that has been designed to provide reasonable assurance as to the integrity and reliability of the performance information, the human resources informationandtheannualfinancialstatements.
The external auditors are engaged to express an independent opinion on the annual financialstatements.
In my opinion, the annual report fairly reflects the operations, the performanceinformation, the human resources information and the financial affairs of thedepartmentforthefinancialyearended31March2018.
Yours faithfully
___________________
DrMNokwequ
Acting:AccountingOfficer
Date 31 May 2018

16
6. STRATEGIC OVERVIEW
6.1 Vision
“A transformed economy and a prosperous society that is living in harmony with its natural resources”.
6.2 Mission
“To be a leading and developmental institution, that drives economic transformation, environmental sustainability, system change and adaptation to the ever-changing dynamicsforthebenefitoftheFreeState.”
6.3 Values
• TeamWork• Integrity• Accountability
• Passion
7. LEGISLATIVE AND OTHER MANDATES
7.1 CONSTITUTIONAL MANDATE
The DESTEA’s constitutional mandates have been derived from Schedules 4 and 5 of the Constitution of the Republic of South Africa, which requires the Department to oversee and administer the following:
1. Trade and investment promotion.2. Tourism development3. Casinos, racing, gambling and wagering4. Consumer protection 5. Environment and nature conservation6. Promotion of industrialization7. Public entity overnight8. Administration of Liquor licences and control of undertakings that sell liquor to the public9. Small business development

17
Furthermore, the Department’s constitutional mandate is derived from Section 24 of the Constitution, which emphasises that, everyone has the right:
a. to an environment that is not harmful to their health or well-being; and
b. tohavetheenvironmentprotected,forthebenefitofpresentandfuturegenerations,through reasonable legislative and other measures that:
i. prevent pollution and ecological degradation;
ii. promote conservation; and
iii. secure ecologically sustainable development and use of natural resources while promotingjustifiableeconomicandsocialdevelopment.
7.2. LEGISLATIVE MANDATE
The table below indicates core legislative mandates that are applicable to departmental programmesandobjectives.
ProgrammeNameandCoreFunction:
LegalMandate Implications
Economic Development: SMME Development
•NationalSmallBusinessAct,1996(ActNo.102of1996)andAmendments
•BusinessAct1991,(ActNo.71of1991)
Promotepolicyobjectives,facilitatestrategy implementation and align programmes to encourage SMME development in the Province.
•BroadBasedBlackEconomicEmpowermentAct,2003(ActNo.53of2003)
Promoting Broad Based Economic Empowerment in the Province.
Economic Development: Gambling&BettingAdministration
•FreeStateGamblingandLiquorAct
The Act replaces Free State Gambling andRacingAct,1996(ActNo.6of1996)
Economic Development: Consumer Protection
•FreeStateConsumerAffairs(UnfairBusinessPractices)Act,1998(ActNo.14of1998)
•ConsumerProtectionActNo68of2008
Investigation, control and prohibition of unfair business practices. Referral of matters in terms of the National Consumer Affairs Act.
Economic Development: ComplianceMonitoring
•CreditAgreementAct1980,(ActNo.75of1980)
Business compliance monitoring and redress.

18
ProgrammeNameandCoreFunction:
LegalMandate Implications
Economic Development: LiquorAdministration
•LiquorAct1989,(ActNo.270f1989)
•NationalLiquorAct,2003(ActNo.59of2003)
Regulating the micro-manufacturing, retailing and distribution of liquor in the Province.
Economic Development: Trade Inspection
•TradeMetrologyAct,1973(ActNo.77of1973)
•CreditAgreementAct,1980(ActNo.75of1980)
Ensure compliance with trade metrology and credit agreement regulations.
Environmental Affairs: ProtectedAreasManagement
•NationalEnvironmentalManagementAct,1998(ActNo.107of1998)andAmendments
Coordination of the implementation, regulation and administration of all mandates entrusted to other sub-programmes and ensure monitoring thereof.
•EnvironmentalConservationAct,1989(ActNo.7of1989)
•FreeStateNatureConservationOrdinance,1969(OrdinanceNo.8of1969)
Promoting conservation in the Province.
•EnvironmentalManagement:BiodiversityAct,2004(ActNo.10of2004)
Ensuring Biodiversity protection in the Province.
•NationalEnvironmentalManagement: Protected Areas Act, 2003(ActNo.57of2003)
Providinganefficientframeworkforthe management of protected areas.
•NationalHeritageRecoursesAct,1999(ActNo.25of1999)
•WorldHeritageConservationAct,1999(ActNo.49of1999)
Ensuring the protection and effective management of National Heritage and World Heritage Sites.
•GameTheftAct,1991(ActNo.105of1991)
Providing a framework for the implications of game theft.
•NationalWaterAct,1998(ActNo.36of1998)
Providing a regulating framework on water usage in the Province.
•NationalEnvironmentalManagement: Waste Act, 2008 (ActNo.59of2008)
Ensuring effective waste management in the Province.
•NationalEnvironmentalManagement: Air Quality Act, 2005 (ActNo.39of2005)
Ensuring the prevention of air pollution in the Province.
•VeldtandForestFireAct,1998(ActNo.101of1998)
Provide a regulatory framework for the prevention and combat of veldt and forestfires.
•ConservationofAgriculturalResourcesAct,1983(ActNo.43of1983)
Ensuring the conservation of vital agricultural resources in the Province.
•AnimalProtectionAct,1962(ActNo.71of1962)
•SpatialPlanningandLandManagement Act No. 16 of 2013 (SPLUMA)
Ensuring the protection of various animal species in the Province
To improve spatial planning and land management practises.

19
ProgrammeNameandCoreFunction:
LegalMandate Implications
Tourism •TourismActNo.3of2014
•FreeStateTourismAuthorityAct,2005(ActNo.3of2005)
•TourismsecondamendmentActNo.70 of 2000
To make provision for the promotion of tourism in the Republic; and further to regulate and rationalize the tourism industry
Provide legal and operational framework for tourism promotion and development in the Province.
Act provides for training and registration of tourist guides; and make provision for a code of conduct and ethics for tourist guides.

20
8. ORGANISATIONAL STRUCTURE
Annual Report for 2017/18 Financial YearVote 3: Department of Economic, Small Business Development,
Tourism and Environmental AffairsFree State Province
20
8. ORGANISATIONAL STRUCTURE
8.
OR
GA
NIS
ATI
ON
AL
STR
UC
TUR
E
ME
C:
DE
ST
EA
:
Ms L
.P M
ah
asa
HO
D:
DE
ST
EA
Actin
g:
Dr
M N
okw
eq
u
Off
ice
of
the
HO
D
Bo
ard
of
En
titie
s
MIN
ME
C,
FO
HO
D,
Clu
ste
rs
Dir
ecto
rate
: In
tern
al A
ud
it
Dir
ecto
rate
: R
isk M
an
ag
em
en
t,
Fra
ud
an
d A
nti-C
orr
up
tio
n
Su
b-D
ire
cto
rate
: In
tern
al C
on
tro
l
Bra
nch
: E
co
no
mic
Develo
pm
ent
Bra
nch
: E
nvir
on
me
nt
an
d C
on
se
rva
tio
n
Chie
f D
irecto
rate
:
Corp
ora
te S
erv
ices
Chie
f D
irecto
rate
: S
trate
gic
Pla
nn
ing
an
d R
ese
arc
h
Chie
f D
irecto
rate
: C
hie
f
Fin
an
cia
l O
ffic
er
APPR
OVE
DORG
ANISAT
IONALSTR
UCTU
RE:D
ESTEA
Officeofthe
MEC

21
9. ENTITIES REPORTING TO THE MEC
The table below indicates the entities that report to the MEC:
Name of entity LegislativeMandate Financial Relationship
Nature of Operations
Free State Development Corporation
Free State Development Corporation Amendment Act 4 of 2010
Transfer Payment
•Financeandadvanceeconomicgrowthanddevelopment, Black Economic Empowerment and SMME development and growth.
•PromoteinvestmentandtradewithintheProvinceand to identify, analyse, publicize and market investment and trade opportunities in the provincial economy
Free State Gambling,Liquorand Tourism Authority
Free State Gambling, Liquor Act 6 of 2010 and Tourism Authority Act 4 of 2011
Transfer Payment
•Regulate the gambling and racing activities in the Province on behalf of the Provincial Department.
•Reduce socio-economic and other costs of alcohol abuse. Regulate the micro-manufacturing and retail sale of liquor or methylated spirits.
•Promote tourism and increase market share in the tourism industry and to coordinate marketing activities of all role players.
•Marketmajorsporteventsfortourismpromotion.

22
PART B: PERFORMANCE INFORMATION
PART B: PERFORMANCE INFORMATION

23
1. AUDITOR GENERAL’S REPORT: PREDETERMINED OBJECTIVES
The AGSA currently performs certain audit procedures on the performance information to provide reasonable assurance in the form of an audit conclusion. The audit conclusion on theperformanceagainstpredeterminedobjectivesisincludedinthereporttomanagement,withmaterialfindingsbeingreportedundertheReportonauditoftheannualperformancereport section of the auditor’s report.
Refer to page 148-150 of the Report of the Auditor General, published as Part E: Financial Information.
2. OVERVIEW OF DEPARTMENTAL PERFORMANCE
2.1 Service Delivery Environment
Population
It is important to consider population statistics when developing and implementing policy in the province. These statistics are important when analysing the provincial economy, as the population growth both directly and indirectly affects employment and unemployment, as well as other economic variables such as economic growth and per capita income.
StatisticsSA,accordingtotheCommunitySurvey(CS), 2016 in this regard indicates that theFreeStateProvincehasthesecondsmallestshare(5%)oftheSouthAfricanpopulation.Provinces with the highest population density, as table 1 indicates, areGauteng (24%),KwaZulu-Natal(20%)andEasternCape(13%).
Table 1: Distribution of land area and population of South Africa by province
Province Squarekm DistributionofLand area in %
Total Population Census 2011
Total Population CS 2016
Distributionofpopulation in %
Western Cape 129 462 11% 5 822 734 6 279 730 11.3%Eastern Cape 168 966 14% 6 562 053 6 996 976 12.6%Northern Cape 372 889 30% 1 145 861 1 193 780 2.1%Free State 129 825 11% 2 745 590 2 834 714 5.1%KwaZulu-Natal 94 361 8% 10 267 300 11 065 240 19.9%North West 104 882 9% 3 509 953 3 748 435 6.7%Gauteng 18 178 1% 12 272 263 13 399 724 24.1%Mpumalanga 76 495 6% 4 039 939 4 335 964 7.8%Limpopo 125 755 10% 5 404 868 5 799 090 10.4%South Africa 1 220 813 51 770 560 55 653 654

24
The population in Free State province according to table 1, has increasedover the fiveyearperiodfrom2745590in2011to2834714in2016.Femalesrepresentthemajorityofthepopulationin2016withatotalof1454749(51.3%)followedbymaleswithatotalof1379965(48.7%).
In 2016, the female to male ratio of the province’s population was 96.6 males to every 100females.Thisfigureissimilartothenationalmaletofemaleratioforthesameperiod.With regards to the province’s race demographics, the Free State Province’s population consistedof87.83%African(2.51million),8.54%White(244000),3.28%Coloured(93800)and0.35%Asian(9980)people.
Most of the Free State’s population, in 2016, resides, as per table 2, in Thabo Mofutsanyana (779600)followedbyMangaungMetro(759693),Lejweleputswa(649964)andFezileDabi(494777).Xharieprecordedthelowestpopulationof150681.
Table 2: Population per Metropolitan and District Municipality 2016
Province, District, Local Municipality
Community Survey 2016
Youth Proportion
Personsaged20years+whohavecompletedgrade
12Total population
Male Female Total
Free State 1 379 965 1 454 749 2 834 714 37.4 706 722Xhariep 73 927 76 754 150 681 38.3 29 090Lejweleputswa 324 998 324 966 649 964 37.0 157 183ThaboMofutsanyane
366 168 413 432 779 600 39.8 172 983
FezileDabi 245 985 248 792 494 777 36.4 127 045
Mangaung 368 887 390 806 759 693 35.6 220 420
It is important to note that the highest proportion of youth population, according to Community Survey2016 resided inThaboMofutsanyaneDistrictMunicipality (39.8).XhariepDistrictMunicipality which recorded the lowest population accommodates the second highest proportionofyouth(38.3)intheprovince.
It is thus clear that programmes or initiatives with the focus on youth be embarked upon especially in those regions with the highest proportion of the youth population.
As per table 3 below, the population in the Free State increased by 5.72 percentage points from2006to2016.Mangaung,FezileDabiaswellasLejweleputswaincreasedinpopulationover the ten year period. In contrast, Thabo Mofutsanyane and Xhariep recorded decreases in their population sizes.

25
Table 3: % Change in population between 2006 and 2016
Province, District Municipality 2016Free State 5.72%Xhariep -8.96%Lejweleputswa 2.09%ThaboMofutsanyane -2.49%FezileDabi 10.66%Mangaung 17.11%
Population Projections
Based on the present age-gender structure and the present fertility, mortality and migration rates,FreeState’spopulationisprojectedtogrowatanaverageannualrateof0.7%from2.86 million in 2016 to 2.97 million in 2021.
Table 4: Population projections - Free State and National Total, 2016-2021
Free State National Total Free State as % of national2016 2,860,000 55,700,000 5.1%2017 2,880,000 56,500,000 5.1%2018 2,900,000 57,400,000 5.1%2019 2,930,000 58,100,000 5.0%2020 2,950,000 58,900,000 5.0%2021 2,970,000 56,600,000 5.0%AverageAnnualgrowth20162021 0.72% 1.37%
The average annual growth rate in the population over the forecast period for South Africa is 1.37%whichishigherthanthatofFreeState’sgrowthrate,projectedat0.72%.

26
GlobalandDomesticEconomicEnvironment
According to the IMF’s estimates, the global economic output for 2017 has grown by 3.7% which is 0.5 percentage point higher than in 2016. The unexpected growth was predominantly noticeable in Europe and Asia which exceeded the forecast as predicted in June 2017 by 0.1percentagepoint.Theglobalgrowthfor2018and2019isprojectedtoriseupto3.9%.The Southern African Development Community real GDP grew by 1.4 percentage points from 2015 to 2016. The Sub-Saharan Africa is estimated to have grown by 2.4% in 2017 compared to the 1.3% in 2016. The region’s largest economies, Nigeria, South Africa and Angola, made the largest contribution towards the recovery as a result of improvement in commodity prices, favourable global financial conditions and slowing inflation whichassisted to lift household demand. South Africa came out of its recession due to strong growth in the agricultural sector and the manufacturing sector recovery; hence, the economy is expected to grow by 1.1% in 2018. In general, growth was weaker because the region is still experiencing negative per capita income growth, weak investment and a decline in productivity.However,regionalgrowthisprojectedtoriseto3.2%in2018andtoanaverageof 3.6% in 2019.
South Africa and Free State Economy
SouthAfrica’sgrossdomesticproduct(GDP)increasedby3.1percentagepointsinthefinalquarter of 2017. The largest positive contributor to growth in GDP in the fourth quarter was theagriculture, forestryandfishing industry,which increasedby37.5percentagepoints,contributing 0.8 of a percentage point to GDP growth. The trade, catering and accommodation industry increased by 4.8 per cent and contributed 0.6 of a percentage point to GDP growth.
The Free State economy is mainly reliant on the tertiary sector. The community services sector, is the largest contributor in terms of gross value added (GVA)within FreeStateProvince accounting for R 49.9 billion at current prices or 25.1% of the total GVA in the province’seconomy.ThesectorthatcontributesthesecondmosttotheGVAisthefinancesector at 17.0% or R 33.8 billion, followed by the trade sector with 13.9% or R27.6 billion. The sector that contributes the least to the economy of the province is the construction sector with a contribution of R 4.83 billion or 2.44% of the total GVA. The remaining sectors’ contributionswere recorded as follows,manufacturing (R 23 billion or 11.6%), transport(R20.8billionor10.5%),mining(R19.7billionor9.9%),agriculture(R9.5billionor4.8%)andelectricityR9.4billionor4.7%).

27
The greatest contributor to the Free State economy in 2016 is the Mangaung Metropolitan Municipality with a share of 40.55% or R 90.6 billion, increasing from R 37.2 billion in 2006. The region with the lowest contributor to the Free State economy in 2016 is the Xhariep DistrictMunicipality (DM)withashareofR7.56billion,an increase fromR3.29billion in2006. TheGrossDomesticProduct (GDP)permetropolitananddistrictmunicipalities inthe Free State for the period of 2006 to 2016 indicates that the highest average annual economic growth is Mangaung with an average of 2.92%. The Xhariep with the second highest average annual growth rate of 1.90%, followed by Thabo Mofutsanyane with an average of 1.56%, Fezile Dabi DM with an average annual growth of 1.27%. The lowest averageannualgrowth rate isLejweleputswaDMwithagrowth rateof -1.21%between2006 and 2016.
FreeStateLabourMarket
South Africa’s official unemployment rate decreased by 1.0 percentage point betweenOctober and December of 2017 compared the same period 2017. The largest declines in theunemploymentratewererecordedinNorthernCape(2.8percentagepoints),WesternCape(2.4percentagepoints)aswellastheNorthWestprovinces(2.3percentagepoints).Between October 2017 and December of 2017, the number of discouraged work-seekers grewby103000(or4.2percent)to2.5millionpersons.
Table 5: Summary of labour market measures at a glance, Q4: 2017

28
The Free State province experienced an increase in unemployment from the third Quarter to the fourth Quarter of 2017. During Quarter 4, unemployment in the province was recorded as32.6%asillustratedbelow.Theofficialunemploymentrateincreasedby0.8percentagepointsandtheunofficialunemploymentrateincreasedby0.5percentagepoints.
Table 6: Free State Unemployment from Q4: 2016 to Q4: 2017
Officialunemploymentrate ExpandedunemploymentrateOct-Dec2016 Jul-
Sep 2017
Oct-Dec 2017
Qtr-to-qtrchange
Year-on-yearchange
Oct-Dec2016
Jul-Sep 2017
Oct-Dec2017
Qtr-to-qtrchange
Year-on-yearchange
Per cent Percentagepoints Per cent Percentagepoints34,7 31,8 32,6 0,8 -2,1 40,9 38,5 39,0 0,5 -1,9
It is however encouraging that the unemployment rate year-on-year represents a decline of 2.1 percentage points in Q4: 2017 compared to Q4: 2016. The province thus lost 16 000 jobsbetweenQ3:2017andQ4:2017.AnnuallywhencomparingQ4:2016andQ4:2017theprovincewassuccessfulincreating48000jobs.
The size of the province’s labour force decreased by 0.8 percentage points quarter on quarter and the number of discouraged workers increased by 10,3 percentage points during the same period. The province’s priority sector’s recorded both increases and declines in employmentduringthefinalquarterof2017.Bothagricultureandmanufacturingexperiencedan increase in employment, with increases of 3.0 and 0.9 percentage points respectively. In contrast, the mining and transport sectors experienced declines in employment, recording decreases of 6.5 and 22.8 percentage point quarter on quarter respectively.
With regards to the Free State’s priority sectors, both Agriculture and Manufacturing employed morepeopleinthefourthquarterof2017(2000and1000respectively).Incontrast,MiningandTransportshedjobsduringthesameperiod(1000and12000respectively).Thisisshown in the table below.
Table 7: Free State Employment per industry from Q3:2016 to 2017
Oct-Dec 2016
Jan-Mar2017
Apr-Jun 2017
Jul-Sep2017
Oct-Dec 2017
Qtr-to-qtrchange
Year-on-yearchange
Qtr-to-qtrchange
Year-on-yearchange
Thousand Per centAgriculture 65 70 80 75 77 2 13 3,0 19,7
Mining 17 17 15 17 16 -1 -1 -6,5 -5,8 Manufacturing 59 68 69 55 55 1 -4 0,9 -6,1 Transport 36 43 44 51 39 -12 3 -22,8 8,1

29
Tourism
Free State Tourism
Globally,tourismisoneofthelargesteconomicsectors,creatingjobs,drivingglobalexportsand generating prosperity worldwide. Research indicates that for every 30 new tourists to adestination,onenewjobiscreated.Thesectorisreportedlyestimatedtoemployalmosttwice as many women as other sectors worldwide. In 2016, the sector grew by 3.1% globally. This continuous growth outpaced that of global GDP by 0.6%. Not only has the sector outperformed economy wide growth for the 6th consecutive years, Travel and Tourism wasalsostrongeringrowththanthefinancialandbusinessservices,manufacturing,publicservices, retail and distribution, and the transport sector.
The Free State provincial government also recognises the role that tourism can play as a driverofeconomicgrowthandjobcreationfortheprovince.Oneofmainreasonsforthisisthe sector’s ability to lend itself to other economic sectors through its broad value chain. The sector is interlinked with other priority sectors including agriculture and manufacturing, thus possessing a multiplier effect on economic growth and development.
The Free State aims to grow its tourism sector to turn what has been called a ‘hidden treasure of South Africa’ into a popular and repeat destination for thousands of domestic and international tourists. The province certainly has the assets that make this goal achievable. Some of these assets include the following designated tourist routes, namely:
•CheetahRoute–ThisroutetakesyouthroughtheMangaungMetropolitanMunicipality–the cultural and political heart of the Free State.
•EagleRoute–SharingthesouthernborderwithLesotho,thisrouterunsfromFicksburgto Harrismith in the Thabo Mofutsanyana District through some of the most picturesque landscape in the country.
•LionRoute–Providesatasteofeverythingthatistypically“FreeState”–fromculturetonature to history exploring attractions in the Fezile Dabi District.
• Flamingo Route – This route runs through the Lejweleputswa District, an importantagricultural and gold-producing area.
•SpringbokRoute-ConnectstheFreeStatewiththeNorthernCapeandwindsthroughthe scenic farmlands and nature reserves of the Xhariep District.
Data shows that, when compared to other provinces in South Africa, the Free State province is currently not achieving its tourism goals given its attractive tourism resource base and offerings. Tourism, one of the province’s priority sectors, thus requires urgent intervention from both the private and public sectors to positively change the economic contribution of tourism in line with other South African provinces, such as Gauteng and Limpopo.

30
Table8:Provinceofdestinationbyexpenditureonmostrecentdayandovernighttrips,January–December(concluded),2016(R’000)
Province of desti-nation
Accommodation Food and beverages
Domestic transport
Recreation and culture
Shopping Other Total
Overnight trips
Western Cape 1 142 727 1 219 252 1 744 393 84 011 1 289 768 188 913 5 669 064 Eastern Cape 251 577 636 539 1 599 544 36 696 1 852 170 159 547 4 536 073 Northern Cape 28 789 107 316 246 848 13 576 221 371 17 019 634 919 Free State 111 259 246 341 402 129 21 384 466 794 67 519 1 315 426 KwaZulu-Natal 1 455 274 822 558 1 699 338 96 945 1 834 846 181 127 6 090 088 North West 270 571 323 878 578 378 33 373 512 057 74 792 1 793 049 Gauteng 378 700 694 407 1 707 143 88 987 1 426 649 219 876 4 515 763 Mpumalanga 560 844 955 437 956 824 26 937 771 744 58 135 3 329 920 Limpopo 186 587 625 943 1 369 954 27 147 1 472 912 141 602 3 824 145 Unspecified 924 636 664 967 1 395 107 249 743 927 757 82 178 4 244 388 Total overnight trips spending
5 310 963 6 296 639 11 699 659 678 797 10 776 068 1 190 708 35 952 834
The table above shows the total expenditure for the year 2016 per province on overnight trips and indicates that annually R5 310 963 000 was spent on accommodation nationally. On average, guest spending on overnight accommodation was recorded as R323.43 per guest for the Free State province. Total spending on accommodation annually for overnight trips in the Free State province stood at R111 259 000 for the period. Although this amount represents a large percentage of tourist expenditure in the province, the total amount generatedprovinciallyforaccommodationissignificantlylowerthanwhathasbeenrecordedin the other provinces.
Domestic tourism plays a critical role in the tourism sector as it generates more than half theinternaltourismrevenue,accordingtoareportreleasedbySouthAfricaTourism(SAT).Although domestic tourism declined in 2016 in Free State province, table 2 below, with 0.7% compared to 2015, total domestic expenditure increased in the same period by 12.3% when compared to 2015. Additionally, this indicated an improvement comparing the 5% growth recorded in 2015 with the 3.7% growth in 2014.
Table9:FreeStateDomesticPicture2013-2016
Free State 2013 Free State 2014 Free State 2015 Free State 2016Size 878 000 1 043 000 1 200 000 1 140 000Growth(%) 3.4% 3.7% 5% 4.3%Direct Spend 712 535 000 1 124 933 000 1 046 634 000 1 210 253 000AverageStay(nights) 4.2 4.7 3.8 4.4
Bednights 3 725 000 4 858 000 3 431 000 4 981 000

31
An upward growth trend in foreign tourism, as indicated in the table 10 below, was recorded in the province from 8.9% in 2013 to 12.2% in 2016 which is very encouraging.
Table10:FreeStateForeignPicture2013/2016
Free State 2013 Free State 2014 Free State 2015 Free State 2016Size 796 706 960 147 947 861 1 223 631Growth(%) 8.9% 10.1% 10.6% 12.2%Direct Spend R1 949 995 677 R1 206 003 374 R1 320 771 995 R1 148 063 103AverageStay(nights) 10.0 9.6 9.7 7.8Bednights 7 698 163 8 910 529 8 824 031 9 176 032
ThetablebelowreflectstheTotalSpendingofNationalinrelationtothatoftheFreeStateProvince.
Table11:TotalTourismSpending–FreeStateandNationalTotal,2007-2017(Rbillions,currentprices)
Free State National Total2007 5.4 138.72008 5.9 152.52009 5.9 153.42010 6.3 167.22011 6.6 174.6
2012 7.7 199.92013 8.7 218.32014 10.0 240.72015 10.6 249.72016 11.7 265.82017 12.8 281.4AverageAnnualgrowth20072017 8.99% 7.33%
Free State Province had a total tourism spending of R 12.8 billion in 2017 with an average annual growth rate of 9.0%since2007 (R5.42billion).Basedon the current economicperformance,itisprojectedthattheGVAfortourismwillcontinuetoincreaseoverthenext5 year period.
This, without doubt, indicates that the tourism sector is resilient and bodes well for the future economic growth of the province.

32
Environment
The regulatory environment practiced by the Department requires of us to not only promote environmental policies, but ensure environmental compliance measures to protect the environment for current and future generations. Key amongst these measures is compliance to the following:
• TheNationalEnvironmentalManagementAct, 107of1998with itsSEMA’s (SpecificEnvironmentalManagementActs)
•Chapter5onEnvironmentinrelationtotheNationalDevelopmentPlan
•Outcome10DeliveryAgreement
•EXCOResolutionsonEnvironmentProjectsandProgrammes
•SOPAandDepartmentalBudgetVoteSpeechInjunctions
The need for socio-economic radical transformation has brought in a new era within the space of environment. The paradigm shift calls for the environmental pristine environment shouldalsobeusedtoanimpetusforeconomicdevelopmentandjobcreation.ItisinthiscontextthatthedepartmentalEnvironmentalManagementCommittee(EMC)hastoassessand recommend for approval all Environmental ImpactAssessments (EIA’s) in line withthese policy imperatives and societal change to offset the past legacy imbalances.
The call is not only to protect our pristine environment and biological diversity, but to utilise the recently approved Biodiversity Economy Strategy in transforming and empowering the fullparticipationofpreviouslydisadvantagedindividualsineconomicbeneficiationprocessessuch as the Wildlife Economy, Waste Economy and Game Industry Transformation. Development Initiatives has resulted in the department introducing the e-Permit System to facilitateefficiency inBiodiversityPermitsapplicationprocesswithinashorterturnaroundperiod. The effects of climate change resulting in drought and poor rainfalls demands of the department to respond to these challenges. We have recently completed the Free State Province Climate Change Vulnerability Assessment Strategy in this regard, with policies that will be directed to all key sectors within the province. All of the above should be done within the regulatory function and coordination processes provided by the State of Environment OutlookReport including theEnvironmental ImplementationPlan (EIP) in relation to theenvironment sector coordination.
The foundation to achieve these programmes is embedded in our Environmental Education and Awareness Programs focusing on all communities, learners and other interested and affected parties. This is in line with Section 24 of the RSA Constitution.
GlobalChangehasresulted innewtechnicalfields liketheGreenEconomyandClimateChange. The department is well poised in responding to these new challenges with programs andprojectsaccommodatedinourAnnualPerformancePlan.

33
Protected Areas in the Free State Province include:
1. Caledon Nature Reserve
2. Erfenis Dam Nature Reserve
3. Gariep Dam Nature Reserve
4. Kalkfontein Dam Nature Reserve
5. Maria Moroka Game Reserve
6. Sandveld Nature Reserve
7. Seekoeivlei Nature Reserve
8. Soetdoring Reserve
9. Sterkfontein Dam Reserve
10. Tussen die Riviere Reserve
11. Willem Pretorius Game Reserve
12. Karee Nature Reserve
13. Wuras Dam Nature Reserve
14. Ficksburg Nature Reserve
15. Koppies Dam Nature Reserve
16. Rustfontein Dam Nature Reserve
17.Inclusiveof16MunicipalOwnedProtectedAreasand1(one)Stewardshipsiteis(SneeuwbergProtectedEnvironment)declaredprivatelyownedProtectedAreasin 2018.
Various factors have influenced land use patterns in the Free State Province, themostimportant of which are soil type, rainfall distribution, mineral deposits, transport routes and political background. Of the total FS surface area, agriculture accounts for 90% of land use, 7% is used for settlements, 1.6% is set aside for formal conservation, while mining activity occupiesapproximately0.4%oftheProvince.BiodiversityisdefinedintheBiodiversityAct(ActNo.10of2004)as“thevariabilityamonglivingorganismsfromallsources,includingterrestrial, marine and other aquatic ecosystems and the ecological complexes of which they are part and also includes diversity within species, between species and of ecosystems”. Only about 3.4% of the land surface of the FS was formally conserved. The Vredefort Dome and Maluti-Drakensberg Transfrontier Conservation Area are World Heritage sites.

34
A wide range of wetland types occur in the Free State, which contribute towards the overall biological diversity of the Province with Seekoeivlei Nature Reserve a Ramsar site of international importance. Climate change is expected to bring considerable warming and drying to much of this already semi-arid region, with greater frequency and intensity of extremeweathereventssuchasheatwaves,floodinganddrought.ThreebiomesoccurwithintheFreeState,namelytheGrassland(72%oftheProvince),NamaKaroo(22%),andSavannah(6%).Thethreekey,inter-relatedthreatstobiodiversityandecosystemhealtharehabitat destruction, invasive alien species and climate change. About 34% of the grassland biome in the Free State has been irreversibly transformed through development, such as urban settlements, mining, agriculture and industrial facilities.
The average rainfall in South Africa is about 450 mm per annum, which is well below the worldaverageof860mmperannum.IntermsoftheUnitedNationsdefinition,SouthAfricais a water stressed country, bordering on water scarcity. As a result, sound management of thisvaluableresourceisessentialtoensureoptimumsocialandeconomicbenefittofurtherthe aims and aspirations of all the people.
The Free State Province is bordered in the north and northwest by the Vaal River, in the south by the Orange/Gariep River and in the east by the Caledon/Mohokare River. Numerous majortributaries,theWilge,Liebenbergsvlei,Renoster,Vals,Sand,Vet,ModderandRietRivers divide the Province into eleven secondary drainage regions. Two primary catchment areas(anareaoflandfromwhichanyrainfallwilldrainintothewatercourse)arelocatedinthe Free State, namely the Vaal River catchment and the Orange River catchment. Surface water resources are well developed through the construction of several large dams. The water supply is augmented by various transfer schemes that import water from other water managementareas(WMA),aswellasfromtheKingdomofLesotho.Futurewatersupplywill depend on increased water transfers. Groundwater is currently used for rural domestic supplies, stock watering and water supply to several towns, where surface water supply is inadequateorbulkwatersupplyisnotfinanciallyfeasible.Groundwateriswellutilisedforwater supply in the Middle Vaal, Lower Vaal and Upper Orange WMAs and is the only water resource available in many areas.
Deteriorating water quality is impacting on the quantity of water available for the different uses. Keyissuesofconcernincludethepoorqualityeffluentdischargedfrommunicipalsewagetreatment works due to overloading and/or poor operations and maintenance, polluted storm water run-off, high salinity pollution due to mining activities, as well as elevated salinity and nutrient pollution from poor farming practices. As a consequence of increased pollution levels, river health has deteriorated, resulting in loss of river functions and services, as well as the sustainability of the river ecosystem. Many wetlands of the Free State have also been directly and/or indirectly impacted upon by a variety of different land uses and from chemical and biological pollutants.
Ambient air quality is impacted by human activities. Coal and wood is still often used as a fuel for cooking and heating in lower income communities, which generates emissions that are harmful to health and quality of life. Parameters are monitored continuously and reported to the national DEA and DESTEA on a monthly basis. Methane, a greenhouse gas, is emitted frommining ventilation shafts.Waste incineratorshavebeen identifiedas theprinciplesourceofdioxinsandfurans(PersistentOrganicPollutants(POPs).OthersourcesofPOPsincludeobsoletepesticides,whichhavenotbeenquantifiedintheFreeState.

35
Policy Environment
The mandate of the Department emanates from national and provincial policies as well as legislative frameworks, as described in our 2015 – 2020 Strategic Plan. In addition to the policies and legislation mention in the Strategic Plan of the Department, the Presidency has developedaNationalDevelopmentPlan(NDP)Vision2030.Thisplan,whichmapsoutthedirection South Africa should take to achieve Vision 2030, was considered when developing the 2017/18 Annual Performance Plan. The main themes emphasised by the NDP includes:
•Economyandemployment
•Economicinfrastructure
•Transitioningtoalowcarboneconomy
•Inclusiveruraleconomy
•PositioningSouthAfricaintheworld
•Humansettlement
•Promotinghealthand
•Socialprotection
TheMediumTermStrategicFramework(MTSF),theNinePointPlanofGovernment,theProvincial Growth and Development Strategy and the Provincial Programme of Action has also been encapsulated in the content of this plan.
Demand for services
The demand for environmental services is largely driven by the legislative mandate of the department to protect and sustain the natural resources of the province. The services provided by the department in this regard therefore focusses in the main on the enforcement of environmental legislation, the management of bio-diversity and climate change, as well as environmental awareness and education.
The demand for economic related services is attributable to both push and pull factors. The macro-economic policies of government has resulted in the rendering of certain services in ordertoachievethevariouspolicyobjectives,suchastourismandindustrialdevelopment.On the other hand, the current low GDP and GVA levels in the province, coupled with significantlyhighlevelsofunemploymenthasnecessitatedthedeliveryofcertainservices,such as SMME support, mining town support and township revitalization.

36
2.2 Service Delivery Improvement Plan
The department has completed a service delivery improvement plan. The tables below highlight the service delivery plan and the achievements to date.
Main services and standards
Main services Beneficiaries Current/actual standard of service
Desired stan-dard of service
Actual achievement
Enterprise support and development
Enterprises in the Free State
150 120 649
Batho Pele arrangements with beneficiaries (Consultation access etc.)
Current/actualarrangements Desiredarrangements Actual achievements
Consultation
Roadshows were conducted in Fezile Dabi and Thabo Mofutsanyana District Municipalities.
Conduct stakeholder engagements in all Districts and the Metro.
All Districts and the Metro conducted stakeholder engagements /
Roadshows.
MEC roadshows were held in 25 municipalities.
Courtesy
Regular Update on received applications for Assessments by BATC
Regular update on requests received.
Applicants were regularly informed about the status of their applications.
AccessService Centers established in all districts except Xhariep.Service Centers struggling with tools of trade to reach outlying towns.
Increase outreach to outlying towns by the Service Centers andHeadOfficebyemployingmore personnel and providing tools of trade.
Small Business and Economic Development hired almost 25 personnel and all Service Centers had middle managers to lead them.
InformationBrochures and pamphlets on enterprise support and development distributed to Service Centers and Municipalities.Information sessions conducted.
Hold Information Sessions / Roadshows.Increase media coverage of enterprise support and development of DESTEA.
All Service Centers held numerous information sessions including Head Office.MEC led numerous information sessions with Municipalities.525mediaappearances(bothinprintandelectronic).Regular updates on Social Media: Tweeter and Facebook.
Openness and Transparency Enterprise Support and Development reports submitted Quarterly and Annually.
Submission of quarterly reports and annual report.
Quarterly and annual reports submitted.
Redress

37
Current/actualarrangements Desiredarrangements Actual achievements
No clear guidelines / mechanisms to ensure redress
Feedback on unsuccessful applications to be provided.
Refer some applications to relevant departments or DFIs.
Inter-Departmental BATC sessions has enhanced referrals.Tabalaza provides an easy channeling of innovative ideas to funding institutions.
Value for MoneySupported and developed businesses to show growth through increased produc-tionand/orjobscreated.
30 enterprises to be supported and developed in 2017/18
Six enterprises that were funded and of the R6, 7million in funding by Department, R28, 7 million funding byDFIswasunlocked.1000jobopportunities were created.
Human Resource
The unit had vacant post for 2016/17. Theplanwastofillallcriticalpost before the end of the financial2017/18
8 Trade advisors, 1 Director and 1 Deputy Director for Thaba Mofutsanyane Service Centre were appointed.
Service delivery information tool
Current/actual information tools Desired information tools Actual achievements125 Information Sessions
125 Training Sessions
To have Roadshows, Forums, Summits, Business Regulation Workshops and Red Tape Reduction Meetings.
14 X Roadshows; 8 X Economic Forums; 2 X Summits; 2 X Business Regulation Workshops and 4 X Red Tape Reduction Meetings.
Complaints mechanism
Current/actual complaints mecha-nism
Desired complaints mechanism
Actual achievements
Service Charter Provision Service Charter Provision
Complaints and. Compliments Box at all service points.
Complaints Mechanism for each service point.
Service Charter Posters with complaints mechanismdisplayedatHeadOfficeand Service Centres.
Complaints and Compliments box placed at all Service Centres.
Developed template for complaints mechanism for each service centre

38
2.3Organisationalenvironment
Programmestructure
There were no changes in the programme structure of the Department, which is illustrated in the table below:
Programme Subprogramme1. Administration 1.1 OfficeoftheMEC
1.2 Management Services1.3 Financial Management 1.4 Corporate Services
2. Environmental Affairs 1.5 Environmental Policy, Planning and Coordination1.6 Compliance and Enforcement1.7 Environmental Quality Management1.8 Biodiversity Management 1.9 Environmental Empowerment Services
3. Economic and Small Business Development
1.10 Integrated Economic Development1.11 Economic Research and Planning1.12 Small Business Development
4. Tourism 1.13 Tourism Planning1.14 Tourism Growth and Development1.15 Tourism Sector Transformation

39
Personnel
As at 31 March 2018, the Department had a workforce of 692, this is inclusive of 675 permanent employees and 17 contract workers. In addition to the above, the department had 2 categories of employment contracts namely; Interns and Security Learners. During 2017/18financialyear,theDepartmenthad9graduateinternsand19SecurityLearners.Of the 9 Interns, 7 were recruited in the department and the 2 remaining Interns were unsuccessful. All the 19 Security Learners were recruited in the department with effect from 01 April 2018. The current vacancy rate is standing at 41,34%. The highest percentage of vacancy rate is as a result of unfunded vacancies in terms of the actual structure as thedepartment recentlyfinalised implementationof itsapprovedstructure.However, thedepartment has undertaken the process to abolish unfunded vacancies on Persal and after the exercise, 877 posts instead of 1674 will be implemented on Persal. This will translate to185poststhathavebeenprioritisedforfillingovertheMTEFperiod(2018-2020)andthevacancy rate will decrease to 21.1% as on 01 April 2018.
Theageprofileofthedepartmentisnotofamajorconcernintermsofcriticaloccupation,however, measures needs to be put in place in order to address anticipated retirement in some programmes such as Environmental Branchwhere it will be losingmajority of itsemployees.Ofthe692employees,190(27.5%)arebetweentheagesof18and35years(youth),87(12.6%)arebetweentheagesof36and39,198(28.6%)arebetweentheagesof40and49,181(26.15%)arebetweentheagesof50and59,36(5.2%)arebetweentheagesof60and65.Onehundredandnine(109)oftheseemployeeswillberetiringinthenext5-10yearsthroughnormaland/orcompulsoryretirement.Ofthisnumber,86(78.9)arefromEnvironmentalManagementBranch,15(13.76%) fromAdministrationand8 (1.1%)are from Economic Development.
During2017/18financialyear,thedepartmentadvertised100postsandallthepostswerefilled.Partofthe93poststhatcouldnotbefilledduringthe2016/17financialyearwerealsofilledfromApril2018,whichhasseenthedepartmentfilling149postsduringthisfinancialyear.Twenty-six(26)ofthesepostscanbeclassifiedasfollows:SMS(5),MMS(8)andJuniorManagement(13).Sixty-fivepercent(65%)of the149postswerefilledbywomenand60%atSMSlevel.There were 25 employees who were promoted, 34 contract workers were permanently appointed (excludingtheSecurityLearners).
The total number of employees who left the department is 92 which translates into 13.3% of the totalworkforce.Thefigureishigherthanthenationalbenchmarkof8%.Itcanalsobeindicatedthatthefigurehasgoneupascomparedtolastyearwherethedepartmentwasstandingat7.6%.Themajorityofemployeeswholeft thedepartmentareduetoexpiryofcontracts.Ofthe68,fourteen(14)officialsresigned,twentysix(26)officialsweretransferred,thirty-four(34)officialswere appointed on contract and contract appointments were terminated due to permanent appointmentinthedepartment,five(5)officialsleftthedepartmentduetoearlyretirement,two(2)officialsleftduetoill-healthretirement,seven(7)officialleftduetonormalretirementandfour(4)officialsservicesgotterminatedduetodeath.Thesignificanthighnumberofattritionisnotofaconcern due to the fact that the employees whose contract expired were permanently appointed. The other contributing factor to the highest number of attrition rate was transfers which were due totheapplicationofsection14(4)ofthePublicServiceAct.

40
Thirty-four (34) grievanceswere lodged and 23misconduct caseswere reported during the2017/18financialyear.Ofthe34grievanceslodged,27wereresolvedwithin30days,7wereresolvedoutsidetheprescribedtime-frames.Two(2)misconductcaseswerefinalisedwithin90days, 1 outside the prescribed time-frames and 20 are outstanding. The factors which contributed tothemisconductcasesnotfinalisedwithin90dayswereasfollows:
•Non-availabilityofpresidingofficersorallegedoffenders;
•Postponementofdisciplinaryhearings;
•Longinvestigationsduetonon-availabilityofexternalpeopletobeinterviewed.
•Veracityofdocumentsneededbyoffendersthroughpointsinlimine,whichdelaysprocess.
2.4Keypolicydevelopmentsandlegislativechanges
Therewerenomajorchangestopoliciesandlegislation,duringtheperiodunderreview,whichhadamajorimpactonoperations.
The Department continued with implementation of the following:
1. All environmental policies and legislation.
2. Trade related policies.
3. Economic development policies, including SMMEs and cooperatives development. Consumer protection and business regulations policies and legislation.
4. Tourism related policies.
The Small Business Development Unit of the department was established during 2014/15, in response to the establishment of the SBD National Ministry, and relevant pronouncements made by the Executive of the Province.

41
The table below explains the various areas contained in the NDP, MTSF and FSGDS to which the Department contributed during the past year:
NDP MTSF FSGDSChapter 3: Economy and employment Outcome 4: Decent employment
through inclusive growthDriver 3: Expand and diversify man-ufacturing opportunities
Chapter 5: Environmental sustainability Outcome6:Anefficient, competitiveand responsive infrastructure net-work(SIP’sandSEZ’s)
Driver 5: Harness and increase tourism potential and opportunities
Chapter 13: Building a capable and devel-opmental state
Outcome 10: Protect and enhance our environmental assets and nation-al resources
Driver 12: Integrate environmental concerns into growth and development planning
Chapter 14: Fighting Corruption Outcome 12: An efficient, effectiveand developmental orientated public service
Driver 15: Foster good governance to create a conducive climate for growth and development
3. STRATEGIC OUTCOME ORIENTED GOALS
InorderfortheDepartmenttofulfilitsmandate,ithassetthefollowingstrategicgoals:
StrategicGoal1 Provisionofleadershipforeffectivesocio-economicdevelopment
Goal statement To substantially improve socio-economic development through astute leadership in the form of strategic direction, monitoring and accountability.
StrategicGoal2 Creationofefficientandeffectivefinancialmanagementsystemforsustainability
Goal Statement Toensurethatappropriatemethodologies,guidelinesandprocessesforfinancialmanagementisapplied,inanefficientandaccountablemanner.
StrategicGoal3 Buildaresponsivehumanresourceattributethatisresponsivetoservicedemands
Goal Statement To ensure that organizational human resources are skilled, equipped, healthy and motivated in order to meet the service delivery demands placed on the department.
StrategicGoal4 Integratedeconomicdevelopmentforradicaltransformation
Goal StatementTo ensure that economic development is planned and executed in an integrated manner, addressingtheissuesofpoverty,jobcreationandinequality,whilstpromotingacultureofriskavoidance, awareness and adaptation.
StrategicGoal5 Inculcateaccountableenvironmentalmanagement forsustainabledevelopmentandinclusiveeconomicgrowth
Goal StatementTo ensure, transparent, accountable and democratic environmental management systems and processes, which will support sustainable development and inclusive economic growth in the province.
StrategicGoal6 Fostertourismsectortransformationanddevelopmentforimprovedmarketshare
Goal Statement To ensure transformation in the tourism sector, in order to promote equity, investment, and growth in both domestic and international tourism.

42
StrategicGoal7 Business process optimization for better programme performance & co-operation
Goal StatementTo ensure optimal organizational performance and service delivery through managing and optimizing internal business processes, with emphasis on internal resource optimization, processre-designforefficiency,technologyadaptationandstrengthenedaccountability.
Progress made towards the achievement of these goals is explained elsewhere in Part B of this report.
TheDepartmentcontributedsignificantly tothefollowingOutcomes,ashighlighted inthetable below:
NDP MTSF Highlights*Chapter 3: Economy and employment
Outcome 4: Decent employment through inclusive growth
•ContinuoussupporttonewandexistingSMME’s
•Continuoussupporttoexistingandnewcooperatives
•TradeandinvestmentpromotionviaFreeStateDevelopment Corporation
•EducationandsupporttoclientonConsumerRights
•Continuoustourismpromotionandmarketing
•FreeStateSmallbusinessdatabasedeveloped.
•ProvincialEconomicDevelopmentforumlaunched.
• Free State Provincial Economic Development Strate-Framework developed
Chapter 5: Environmental sustainability
Outcome 10: Protect and enhance our environmental assets and national resources
•Expansionoflandunderconservation
•Wetlandconservation
•Upgradeofcertainresortsandreserves
•Continuesenforcementofenvironmentallegislation
•WildlifeAuctionConducted
•Promotionofwasterecycling
•HostCOP21stakeholders’workshoponClimateChange.*Details of achievements are explained elsewhere in Part B of this report.

43
4. PERFORMANCE INFORMATION BY PROGRAMME
4.1Programme1:AdministrationTo provide leadership and strategic management in accordance with Policy and Legislation and to provide appropriate support service to other programmes.
Sub-Programmes:
Programme SubProgrammeAdministration 1. Management Services
2. Financial Management
3. Corporate Services
This programme contributed to the following priorities:
• NDP:
o Chapter 13: Building a capable and developmental state
o Chapter 14: Fighting Corruption
• MTSF:
o Outcome12:Anefficient,effectiveanddevelopmentalorientatedpublicservice
• FSGDS:
o Driver 15: Foster good governance to create a conducive climate for
growth and development

44
ManagementServices
StrategicObjectivesSub-ProgrammeManagementServices
Strategicobjectives
Performance Indicator
Actual Achievement 2016/2017
Planned Target2017/2018
Actual Achievement2017/2018
Deviation from plannedtarget2017/2018
Comments on deviations
Internal Audit
1.1 Accelerate implementation &enforceaccountability.
Ensure overall corporate compliance.
Number of internal audit plans developed
1 1 1 0 -
1.2 Number of internal audit charters developed
1 1 1 0 -
1.3 Number of audit committee charters developed
1 1 1 0 -
1.4 Number of internal audits performed.
- 12 20 +8 Due to in-year amendments of the Audit Plan.
RiskManagement1.5 Strengthen risk
®ulatorycompliance.
Number of reviews conducted on risk registers
- 1 1 0 -
1.6 Number of monitoring and review of new risks
- 4 0 -4 Late approval of Strategic and operational registers.
1.7 Number of invitations issued
- 4 2 -2 RMC Meetings not be convened.
1.8 Number of RMC reports
- 4 2 -2 RMC meetings could not be conducted in time due logistical reasons.
1.9 Number of AC meetings attended
- 4 2 -2 Unavailability of CRO.

45
StrategicObjectivesSub-ProgrammeManagementServices
Strategicobjectives
Performance Indicator
Actual Achievement 2016/2017
Planned Target2017/2018
Actual Achievement2017/2018
Deviation from plannedtarget2017/2018
Comments on deviations
StrategicPlanning,MonitoringandEvaluation
1.10 Ensure overall corporate compliance
Number of plans facilitated and submitted to Treasury.
1 1 1 0 -
1.11 Number of an annual reports submitted.
1 1 1 0 -
1.12 Number of service delivery planning documents developed
4 5 5 0 -
1.13 Number of FSDM reports compiled
- 16 16 0 -
1.14 Number of MPAT Self-Assess-ments facilitated
1 1 1 0 -
1.15 Number ofprojectsassessed.
- 12 13 +1 Additional request was received from SBD.
1.16 Number of unit asset, SCM and financialreportscompiled.
36 36 36 0 -

46
StrategicObjectivesSub-ProgrammeManagementServices
Strategicobjectives
Performance Indicator
Actual Achievement 2016/2017
Planned Target2017/2018
Actual Achievement2017/2018
Deviation from plannedtarget2017/2018
Comments on deviations
SecurityServicesandAnti-Corruption
1.17 Ensure effective corporate compliance
Number of security-awareness sessions conducted
4 4 3 -1 Loss of documentation due to movement of the department to new building.
1.18 Number of monitoring reports on security related matters.
8 4 2 -2 Loss of documentation due to movement of the department to new building.
1.19 Number of awareness cam-paigns on Fraud and Anti-Corrup-tion conducted.
- 2 2 0 -
1.20 Number of reports on Fraud and Corruption cases investigated
- 2 1 -1 Demand driven
1.21 Number of reportsonZ204forms submitted to SSA.
- 2 1 -1 Loss of documentation due to movement of the department to new building.
1.22 Number of training sessions conducted
- 2 1 -1 Loss of documentation due to movement of the department to new building.
1.23 Number of SOPs implemented
- 1 0 -1 Due diligence on the SOP could not be completed in time.
1.24 Number of departmental events supported by security services
- 4 9 +5 Demand Driven

47
StrategicObjectivesSub-ProgrammeManagementServices
Strategicobjectives
Performance Indicator
Actual Achievement 2016/2017
Planned Target2017/2018
Actual Achievement2017/2018
Deviation from plannedtarget2017/2018
Comments on deviations
Communication
1.25 Improve corporate communication and coordination
Number of platforms identifiedandused
- 4 3 -1 Appointed service provider failed to deliver.
1.26 Number of engagements with strategic partners
- 4 0 -4 No engagement requests were received.
1.27 Number of implementation plans developed
- 12 12 0 -
1.28 Number of approved Communication Strategies
- 1 1 0 -
1.29 Number of media interviews conducted
- 12 154 +142 Due to MEC Roadshows
1.30 Number of media statements issued
- 4 6 +2 Due to MEC Roadshows
1.31 Number of campaigns
- 4 5 +1 Due to MEC Roadshows
1.32 Number of publications produced.
- 4 4 0 -
1.33 Number of promotions
- 4 4 0 -
1.34 Number ofprofiledprogrammes.
- 4 4 0 -
1.35 Number of media appearances
- 200 546 +346 Due to MEC Roadshows
1.36 Number of successful projectscommunicated
- 2 2 0 -
1.37 Number of events coordinated.
- 2 2 0 -

48
StrategicObjectivesSub-ProgrammeManagementServices
Strategicobjectives
Performance Indicator
Actual Achievement 2016/2017
Planned Target2017/2018
Actual Achievement2017/2018
Deviation from plannedtarget2017/2018
Comments on deviations
InformationTechnologyandKnowledgeManagement
1.38 Implement appropriate technology
Strengthen access to services/programs
Fosterlearning&innovation
Develop business capabilities
Number of e-Government initiatives implemented
0 2 2 0 -
1.39 Number of department-wide business process mapping.
- 1 0 -1 No responses to request for proposals received by SCM.
1.40 Number of implemented ICT solutions.
- 2 2 0 -
1.41 Number of monitoring reports compiled for ICT services, usage of IT resources and ICT security risks.
4 4 4 0 -

49
StrategicObjectivesSub-ProgrammeManagementServices
Strategicobjectives
Performance Indicator
Actual Achievement 2016/2017
Planned Target2017/2018
Actual Achievement2017/2018
Deviation from plannedtarget2017/2018
Comments on deviations
LegalServices1.42 Consistent quality
service provisionNumber of departmental legislation drafted.
1 1 1 0 -
1.43 Number of contracts drafted and vetted.
- 4 16 +12 Demand driven.
1.44 Number of workshops on the Implementation of PAIA and PAJA.
2 1 1 0 -
1.45 Number of SOPs on misconduct processes &grievanceprocedure and legal services reviewed.
- 3 3 0 -
1.46 Number of awareness sessions conducted on SPO’s.
- 1 1 0 -
1.47 Number of awareness conducted to promote Sound Labour Peace.
- 1 1 0 -
1.48 Number of publication of PAIA Manual on DESTEA database
- 1 1 0 -
1.49 Number .of reports on compliance with PAIA and PAJA
- 1 1 0 -
1.50 Number reports on grievances finalised
- 12 12 0 -
1.51 Number of reports on misconduct cases reported andfinalised
- 12 12 0 -
1.52 Number of reports onconflictsanddisputes resolved
- 4 4 0 -

50
Strategiestoovercomeareasofunderperformance:
•ImproveICTprojectmanagement.
•CurborreduceareasofunderperformanceinSecurityServices,Anti-Fraudand Corruption Unit:
4.1.3. FinancialManagement
StrategicObjectivesSub-ProgrammeManagementServices
Strategicobjectives
Performance Indicator
Actual Achievement 2016/2017
Planned Target2017/2018
Actual Achievement2017/2018
Deviation from planned target2017/2018
Comments on deviations
ManagementAccounting
1.1 Effectivefinancialmanagement
Improve expenditure management
Number of credible budget statement submitted to treasury on time.
1 1 1 0 -
1.2 Number of credible adjustmentbudgetsubmitted to Treasury on time.
1 1 1 0 -
1.3 Number of in-year monitoring reports submitted to treasury on time.
12 12 12 0 -
FinancialAccounting1.4 Improve revenue
collection&manage growth.
Financial stewardship
Improvefinancialsustainability
Number annual financialstatementcompiled according to prescripts.
1 1 1 0 -
1.5 Number Quarterly interim statements compiled according to prescripts.
3 3 3 0 -

51
StrategicObjectivesSub-ProgrammeManagementServices
Strategicobjectives
Performance Indicator
Actual Achievement 2016/2017
Planned Target2017/2018
Actual Achievement2017/2018
Deviation from planned target2017/2018
Comments on deviations
SupplyChainManagement
1.6 Implement cost efficiencies
Percentage of payments made to creditors within 30 days from receipt of an invoice.
100 100% 100% 0 -
1.7 Number of days to conclude quotes/bids
•TransversalContracts:
•Pricequotations(<30000)
•Pricequotation(30000-500000)
•Bid/Tenders
2
4
10
60
2
4
10
60
2
4
10
0
0
0
0
-60
No tenders were issued in the financialyear under review.
1.8 Annual procurement plan(PP)developed.
1 1 1 0 -
1.9 Number of expenditure analysis reports done.
•Catering.
•Stationery.
•Laboursavingdevices.
•Targetedprocure-mentspend(70%).
•Cell-phones
•Travellingagency
•TransportandShuttle service
•EventManagement
128 32 32 0 -
1.10 Number of inventory count reports
2 4 0 -4 A decision was taken that DESTEA would not keep inventory.

52
StrategicObjectivesSub-ProgrammeManagementServices
Strategicobjectives
Performance Indicator
Actual Achievement 2016/2017
Planned Target2017/2018
Actual Achievement2017/2018
Deviation from planned target2017/2018
Comments on deviations
FleetandAssetManagement1.11 Improve
record asset management.
Increase asset utilization
Implement proper inventory turnover.
Number of stocktaking reports.
2 1 1 0 -
1.12 Number of disposal reports.
- 4 4 0 -
1.13 Number of facilities management plans (U-AMP)developed.
1 1 1 0 -
1.14 Number of all movables assets verificationreportsdeveloped.
- 4 4 0 -
Strategiestoovercomeareasofunderperformance:
•Developanactionplantoimproveareasofunderperformance.

53
4.1.4. Corporate Services
StrategicObjectivesSub-ProgrammeManagementServices
Strategicobjectives
Performance Indicator
Actual Achievement 2016/2017
Planned Target2017/2018
Actual Achievement2017/2018
Deviation from plannedtarget2017/2018
Comments on devia-tions
Corporate Services1.1 effective corporate
Foster a high performance culture
Optimize staff productivity
Number of HIV Counselling and Testing (HCT)conducted.
2 2 2 0 -
1.2 Number of Health Risk Assessments (HRA)conducted.
- 2 2 0 -
1.3 Number of gender Equality Strategic Framework Plan submitted.
- 1 1 0 -
1.4 Number of Job Access Strategic Framework Plan submitted.
- 1 1 0 -
1.5 Number of Youth Development Plans submitted to the Department of the Premier.
- 1 1 0 -
1.6 Number of Gender Equality Strategic Framework Report submitted.
- 1 1 0 -

54
1.7
Ensuring effective corporate compliance
Foster a high perfomance culture
Optimize staff productivity
Ensuring effective corporate compliance
Recruit and develop workforce
Continuous improvement process
Enhance change management practises&trainingclimate
Clarify roles and responsibilities
Number of Job Access Strategic Framework Report submitted to DPSA
- 1 1 0 -
1.8 Number of Youth Development Reports submitted to the Presidency
- 4 4 0 -
1.9 Number of organisational structure updated
- 1 1 0 -
1.10 Number of bi-annual health and safety inspections conducted
- 2 2 0 -
1.11 Number of business processes to be mapped
- 5 5 0 -
1.12 Number of approved organisational structure captured on PERSAL
- 1 1 0 -
1.13 Number of SOP's developed
- 5 5 0 -
1.14 Number of workshops on diversity management
- 2 3 +1 Based on the previous session, a need was identifiedtodo another workshop
1.15 Number of workshops on change management
- 1 1 0 -
1.16 Numberofjobdescriptions reviewed
- 50 50 0 -

55
Strategiestoovercomeareasofunderperformance:
•Noneastherewerenoareasofunderperformance.
Changes to planned targets
Indicator Original2017/18 Target
Adjusted 2017/18Target
Quarter 1 Target
Quarter 2 Target
Quarter 3 Target
Quarter 4 Target
Reason for Amendment
Number of workshops on change management
4 1 - - - 1 Reprioritization of funds after 2017/18 AdjustmentBudget Allocation.
Linkingperformancewithbudgets
Sub-programme expenditure
ProgrammeName
ADMINISTRATION
2016/2017 2017/2018Final
AppropriationActual
Expenditure(Over)/ Under Expenditure
Final Appropriation
Actual Expenditure
(Over)/UnderEx-penditure
R’000 R’000 R’000 R’000 R’000 R’000SubProgram
OfficeoftheMEC 8,097 7,936 161 11,579 10,067 1,512
Management Services
25,690 25,333 357 26,972 27,424 (452)
Financial Management
62,924 62,648 276 66,369 70,482 (4,113)
Corporate Services 39,728 38,827 901 36,179 33,083 3,096
TOTAL 136,439 134,744 1,695 141,099 141,056 43

56
4.2Programme2:EnvironmentalAffairsandConservation
To implement and monitor legislation and policies in the areas of Air Quality, Biodiversity, Climate Change, Compliance Monitoring, Environmental Impact, Protected Areas, Pollution Control, Protected Areas and Waste Management.
Sub-Programmes:
Programme SubProgrammeEnvironmental Affairs and Conservation 1. Environmental Policy Planning and
Coordination
2. Compliance and Enforcement
3. Environmental Quality Management
4. Biodiversity Management
5. Environmental Empowerment Services
This programme contributed to the following priorities:
•NDP:
o Chapter 5: Environmental Sustainability
•MTSF:
o Outcome 10: Protect and enhance our environmental assets and national resources
•FSGDS:
o Driver 12: Integrate environmental concerns into growth and development planning.

57
4.2.1. EnvironmentalPolicyPlanningandCoordination
StrategicObjectivesEnvironmentalPolicyPlanningandCoordination
Strategicobjectives
Performance Indicator
Actual Achievement 2016/2017
Planned Target2017/2018
Actual Achievement2017/2018
Deviation from planned target2017/2018
Comments on deviations
1.1 Regulatory environment enforcement
Number of intergovernmental sector tools reviewed.
2 2 2 0 -
1.2 Number of legislative tools developed.
- 2 2 0 -
1.3 Number of environmental researchprojectscompleted.
5 5 17 +12 Additional interns were allocated to DESTEA by FSTDI.
1.4 Number of functional environmental information management systems(EIMS).
1 1 2 +1 GIS SPISYS system was utilized in addition to the ArcGIS system.
1.5 Number of IDPs reviewed for environmental content as per requirements (DA/3.5)
23 23 23 0 -
1.6 Submission of EIP reports.
1 1 1 0 -
1.7 Number of climate change sector policy interventions held.
- 2 2 0 -
1.8 Number of road shows conducted at municipal level relating to climate change.
7 5 5 0 -

58
4.2.2. Compliance and Enforcement
StrategicObjectivesCompliance and Enforcement
Strategicobjectives
Performance Indi-cator
Actual Achievement 2016/2017
Planned Target2017/2018
Actual Achievement2017/2018
Deviation from planned target2017/2018
Comments on deviations
1.1 Regulatory environment enforcement
Number of completed green issue criminal investigations handed to the NPA for prosecution.
- 45 26 -19 Demand driven
1.2 Number of completed brown issue criminal investigations handed to the NPA for prosecution
- 3 3 0 -
1.3 Number of administrative enforcement actions taken for non-compliance with environmental legislation.
7 10 12 +2 Demand driven
1.4 Number of compliance inspections conducted for green issues.
1275 270 800 +530 Demand driven
1.5 Number of compliance inspections conducted for brown issues.
- 80 87 +7 Demand driven
1.6 Number of permits issued within legislated time-frames.
5049 4500 4200 -300 No opportunity to demonstrate as DESTEA did not receive 4500 applications.
1.7 Number of Admission of Guilt Fines issued Biodiversity related transgressions
23 32 6 -26 Demand driven

59
4.2.3. EnvironmentalQualityManagement
StrategicObjectivesEnvironmentalQualityManagement
Strategic objectives
Performance Indicator
Actual Achievement 2016/2017
Planned Target2017/2018
Actual Achievement2017/2018
Deviation from plannedtarget2017/2018
Comments on deviations
1.1 Regulatory environment enforcement
Number of facilities trained on the Waste Information System.
6 6 16 +10 Needs for more training wereidentifiedthrough Waste Management Forum discussions.
1.2 Percentage of waste licenses applications finalisedwithinlegislated time-frames.
80% 80% 100% +20% EMC sitting weekly instead of fortnightly, which allowed faster response times.
1.3 Number of waste pickers supported.
101 150 203 +53 Additional training requests from waste reclaimers were received and addressed through a partnership with PETCO.
1.4 Number of Waste Management OfficersForummeetings held
- 4 4 0 -
1.5 Percentage of EIA applications finalizedwithinlegislated time-frames.
68% 60% 62% +2% Due to improved internal processes and procedures.
1.6 Number of Air QualityOfficersForum meetings held.
- 4 4 0 -
1.7 Number of S24G applications finalized.
- 2 2 0 -
1.8 Number of waste landfillsitesenvironmentally audited
- 2 6 +4 As an outcome of the DESTEA MEC roadshows.
1.9 Number of cleaning campaigns conducted.
- 12 12 0 -

60
4.2.4. BiodiversityManagement
StrategicObjectivesBiodiversityManagement
Strategicobjectives
Performance Indicator
Actual Achievement 2016/2017
Planned Target2017/2018
Actual Achievement2017/2018
Deviation from plannedtarget2017/2018
Comments on deviations
1.1 Regulatory environment enforcement
Number of new black game farmers registered in the DESTEA Game Farming Programme.
4 8 8 0 -
1.2 Number of new stewardships sites assisted to increase land under conservation through the implementation of the Biodiversity Stewardship Programme(BSP).
1 1 1 0 -
1.3 Percentage of area of state managed protected areas as-sess with a METT score above 67%.
96% 70% 100% +30% Improvement in management systems without additional costs to the organisation.
1.4 Number of hectares in the conservation estate.
920483 5000 5486 +486 Demand driven
1.5 Number of black game farmers supported through the donation of 1121 animals of various species.
- 29 0 -29 Due diligence process took longer than expected.
1.6 Provincial biodiversity plan developed and reviewed.
- 1 1 0 -
1.7 Number of new Black Game Ranchers established.
- 8 51 +43 Demand driven
1.8 Number of mentorship sessions for black game farmers.
- 48 50 +2 Demand driven
1.9 Number of biodiversity economy initiatives implemented.
- 2 3 +1 More human resources

61
4.2.4. BiodiversityManagement
StrategicObjectivesBiodiversityManagement
Strategicobjectives
Performance Indicator
Actual Achievement 2016/2017
Planned Target2017/2018
Actual Achievement2017/2018
Deviation from plannedtarget2017/2018
Comments on deviations
1.1 Regulatory environment enforcement
Number of new black game farmers registered in the DESTEA Game Farming Programme.
4 8 8 0 -
1.2 Number of new stewardships sites assisted to increase land under conservation through the implementation of the Biodiversity Stewardship Programme(BSP).
1 1 1 0 -
1.3 Percentage of area of state managed protected areas as-sess with a METT score above 67%.
96% 70% 100% +30% Improvement in management systems without additional costs to the organisation.
1.4 Number of hectares in the conservation estate.
920483 5000 5486 +486 Demand driven
1.5 Number of black game farmers supported through the donation of 1121 animals of various species.
- 29 0 -29 Due diligence process took longer than expected.
1.6 Provincial biodiversity plan developed and reviewed.
- 1 1 0 -
1.7 Number of new Black Game Ranchers established.
- 8 51 +43 Demand driven
1.8 Number of mentorship sessions for black game farmers.
- 48 50 +2 Demand driven
1.9 Number of biodiversity economy initiatives implemented.
- 2 3 +1 More human resources
4.2.5. EnvironmentalEmpowermentServices
StrategicObjectivesEnvironmentEmpowermentServices
Strategicobjectives
Performance Indica-tor
Actual Achievement 2016/2017
Planned Target2017/2018
Actual Achievement2017/2018
Deviation from planned target2017/2018
Comments on deviations
1.1 Regulatory environment enforcement
Number of conservan-cies supported.
11 8 16 +8 Demand driven
1.2 Number of community members’ workshopped on environmental management.
1276 380 717 +337 Demand driven
1.3 Number of registered schools for participation in an environmental programme.
148 200 256 +56 Demand driven
1.4 Number of environmental awareness activities conducted (Community).
94 14 69 +55 Demand driven
1.5 Number of environmental capacity building activities conducted through workshops and informal training conducted.
30 28 38 +10 Demand driven
1.6 Number of quality environmental education resource materials developed.
1 1 3 +2 Due to partnerships with WESSA and Enviro-Quiz stakeholders
1.7 Number of environmental calendar days celebrated.
5 4 6 +2 Innovative means of celebrating calendar days
1.8 Number of Greenest and Cleanest Municipality Competitions facilitated.
1 1 3 +2 Optimisation Waste Manage-ment Forum and Air Quality man-agement Forum in increasing competitions.
1.9 Number of work opportunities created through environmental programmes(EPWP)
264 300 1253 +953 Additional fund-ing received from DEA and DESTEA funds.
1.10 Number of rivers cleaned
- 2 2 0 -
1.11 Number of towns cleaned
- 9 12 +3 Additional towns were requested by Municipalities.

62
Strategiestoovercomeareasofunderperformance:
• UtilizeexpertizeofDEAinrelationtoaspectsofenvironmentalsustainabilityand sustainable development;
• EnterintosupportprogrammeswithCUTandUNEP,includingotherindustrystake holders.
Changes to planned targets
Indicator Original2017/18 Target
Adjusted 2017/18 Target
Quarter 1 Target
Quarter 2 Target
Quarter 3 Target
Quarter 4 Target
Reason for Amendment
Number of climate change alignment policies developed.
2 0 - - - - Reprioritization of funds after 2017/18 AdjustmentBudgetAllocation.
Number of completed brown issue criminal investigations handed to the NPA for prosecution.
30 3 - - - 3 Reprioritization of funds after 2017/18 AdjustmentBudgetAllocation.
Percentage of complete EIA applications finalizedwithinlegislated time-frames.
98% 60% 60% 60% 60% 60% Reprioritization of funds after 2017/18 AdjustmentBudgetAllocation.
Number of marketing sessions for resorts conducted
4 0 - - - - Reprioritization of funds after 2017/18 AdjustmentBudgetAllocation.
Number of black game farmers supported through the donation of 1121 animals of various species
4 29 - - - 29 Reprioritization of funds after 2017/18 AdjustmentBudgetAllocation.
Number of seedlings cultivated at the Karee Nursery.
3000 0 - - - - Function has been transferred to DARD.
Number of trees planted
1000 0 - - - - Function has been transferred to DARD.

63
Linking performance with budgets
2016/2017 2017/2018Sub-ProgrammeName
Final Appropriation
ActualExpenditure
(Over)/Under Expenditure
Final Appropriation
ActualExpenditure
(Over)/Under Expenditure
R’000 R’000 R’000 R’000 R’000 R’000Environmental Policy, Planning and Coordination
7,209 7,718 (509) 9,017 7,190 1,827
Compliance and Enforcement
13,170 10,996 2174 14,434 15,609 (1,175)
Environmental Quality Management
11,244 7,447 3797 22,558 23,655 (1,097)
Biodiversity Management
99,343 105,177 (5834) 78,943 80,503 (1,560)
Environmental Empowerment Services
15,476 8,150 7326 11,739 10,901 838
Total 146,442 139,488 6954 136,691 137,858 (1,167)
4.3Programme3:EconomicandSmallBusinessDevelopment
To enhance economic development, small business develop growth in the province throughfinancialandnon-financialsupportprogrammes.
Sub-Programmes:
Programme SubProgrammeEconomic Development 1. Integrated Economic Development
2. Economic Research and Planning
3. Small Business Development
This programme contributed to the following priorities:
•NDP:
o Chapter 3: Economy and employment
•MTSF:
o Outcome 4: Decent employment through inclusive growth
o Outcome6:Anefficient,competitiveandresponsiveinfrastructurenetwork

64
•FSGDS:
o Driver 3: Expand and diversify manufacturing opportunities
o Driver 11: Ensure social development and social security
4.3.1 IntergratedEconomicDevelopment
StrategicObjectivesIntegratedEconomicDevelopment
Strategicobjectives
Performance Indicator
Actual Achievement 2016/2017
Planned Target
2017/2018
Actual Achievement
2017/2018
Deviation from planned target
2017/2018
Comments on deviations
1.1 Strengthen &coordinateeconomic development.
Optimize investments.
Economic growth.
Strength strategic partnership
Number of initiatives introduced to attract investment.
- 1 1 0 -
1.2 Number of enterprises assisted with access to markets.
92 30 31 +1 DESTEA partnered with FDC and private sector.
1.3 Number of forums facilitated (cumulative)
- 1 1 0 -
1.4 Number of business supported in critical sectors
- 3 3 0 -
1.5 Numberofprojectssupported that qualify for co-funding arrangement with Developmental Funding Institutions (DFI)
- 4 12 +8 Additional funding approvals by FDC, NEF, IDC.
1.6 Number of outward and inward missions attended.
- 4 8 +4 As requested by theOfficeofthePremier.
1.7 Number of partnerships established with private sector to create relevant skills
- 2 2 0 -
1.8 Number of municipalities in which Black Business Chambers were established
- 1 1 0 -
1.9 Number of new jobopportunitiesfacilitated, with emphasis on the agro-processing sector
- 5 6 +1 Additional appointment was done during planting season which required additional labour.

65
•FSGDS:
o Driver 3: Expand and diversify manufacturing opportunities
o Driver 11: Ensure social development and social security
4.3.1 IntergratedEconomicDevelopment
StrategicObjectivesIntegratedEconomicDevelopment
Strategicobjectives
Performance Indicator
Actual Achievement 2016/2017
Planned Target
2017/2018
Actual Achievement
2017/2018
Deviation from planned target
2017/2018
Comments on deviations
1.1 Strengthen &coordinateeconomic development.
Optimize investments.
Economic growth.
Strength strategic partnership
Number of initiatives introduced to attract investment.
- 1 1 0 -
1.2 Number of enterprises assisted with access to markets.
92 30 31 +1 DESTEA partnered with FDC and private sector.
1.3 Number of forums facilitated (cumulative)
- 1 1 0 -
1.4 Number of business supported in critical sectors
- 3 3 0 -
1.5 Numberofprojectssupported that qualify for co-funding arrangement with Developmental Funding Institutions (DFI)
- 4 12 +8 Additional funding approvals by FDC, NEF, IDC.
1.6 Number of outward and inward missions attended.
- 4 8 +4 As requested by theOfficeofthePremier.
1.7 Number of partnerships established with private sector to create relevant skills
- 2 2 0 -
1.8 Number of municipalities in which Black Business Chambers were established
- 1 1 0 -
1.9 Number of new jobopportunitiesfacilitated, with emphasis on the agro-processing sector
- 5 6 +1 Additional appointment was done during planting season which required additional labour.
4.3.2 EconomicPlanning
StrategicObjectivesIntegratedEconomicDevelopment
Strategicobjectives
Performance Indicator
Actual Achievement 2016/2017
Planned Target
2017/2018
Actual Achieve-ment
2017/2018
Deviation from planned target
2017/2018
Comments on deviations
1.1 Exploit opportunity in critical sectors
Number of lists of Investment opportunities in5(five)priority sectors developed
- 1 1 0 -
1.2 Number of work-shops on priority sectors for district municipalities conducted
- 5 5 0 -
1.3 Promote capital investmenet
Number of lists of annual capital investment targets developed
- 1 1 0 -
1.4 ImproveR&D NumberofR&Dprojectsinitiated
- 3 4 +1 Additional capacity was received through CUT.
1.5 Economic growth Number of lists of economic growth targets developed
- 1 1 0 -
1.6 Customer satisfaction
100% of disputes resolved in 90 days
48% 100% 77% -23% Complexity of cases, extended mediations, unavailability of defending lawyers.
1.7 Promote collaborations and partnership
Number of partnerships and networks estab-lished
- 1 1 0 -
1.8 Consistant quality service provision
Number of SOPs developed
- 1 1 0 -
1.9 Job creation Number of lists of possible high impactprojectsidentified
- 1 1 0 -
1.10 Number of LED plans aligned to PEDS
- 21 21 0 -
1.11 Improve revenue collection and manage growth
Number of comparative studies on revenue collection conducted
- 1 1 0 -

66
1.12 Number of Reserves/Resorts Viability recommendation reports submitted
- 1 1 0 -
1.13 Improve prosperity Number of consumer awareness campaigns conducted
66 36 44 +8 Due to MEC’s Roadshows
1.14 Strengthen&co-ordinate economic development
Number of Provincial Economic Development Forums convened
- 4 4 0 -
1.15 Accelerate implementation and enforce accountability
Number of workshop on PEDS held
- 1 2 +1 Received additional request from the DTI to have a Provincial BIS and PEDS working session.
1.16 Improve FS Brand image
Number of World Consumer Rights Day Commemorations held
- 1 1 0 -
4.3.3. Small Business Development
StrategicObjectives
Small Business DevelopmentStrategicobjectives
Performance Indicator
Actual Achievement 2016/2017
Planned Target2017/2018
Actual Achievement2017/2018
Deviation from planned target2017/2018
Comments on deviations
1.1 Promote entrepreneurial culture
Number of economic development roadshows conducted
- 4 15 +11 Due to MEC Roadshows
1.2 Strengthen&co-ordinate economic development
Number of economic development strategies developed
- 1 0 -1 Delay in due diligence to approve.
1.3 Strengthen strategic partnership
Number of strategic MoUs/SLAs signed
- 5 3 -2 Delay in due diligence to approve.

67
StrategicObjectives
Small Business DevelopmentStrategicobjectives
Performance Indicator
Actual Achievement 2016/2017
Planned Target2017/2018
Actual Achievement2017/2018
Deviation from planned target2017/2018
Comments on deviations
1.4 Increase market share
Job creation.
Fostermergers&acquisition
Be industry thought leader.
Promote entrepreneurial culture
Number of surveys conducted
- 4 7 +3 Due to the success of strategic partnerships with Municipalities and private sector
1.5 Number of SMMEs linked to big business
- 40 17 -23 Applications did not comply with BATC criteria.
1.6 Number of provincial incubators initiated
- 1 0 -1 Due to administrative delays by role-players.
1.7 Number of sector forums held
- 8 6 -2 The two forums were not held due to the International Cooperative Day preparation and hosting. Instead the task team meetings were held.
1.8 Number of enterprises developed and supported
- 12 649 +637 Due to the success of strategic partnerships with Municipalities and private sector.
1.9 Number of BBBEE workshops held
5 4 4 0 -
1.10 Number of motor mechanics and panel beaters trained
- 25 0 -25 Service provider could not provide the training before the end of the financialyear.

68
Strategiestoovercomeareasofunderperformance:
Wehaveidentifiedalackofresourcesasakeycontributortounderperformanceinsomeindicators. The strategy to turn around the situation includes ensuring that we realign the structure so it can function optimally to achieve the results in an environment where there are constrained resources. To this end, we have appointed managers for the Fezile Dabi andThaboMofutsanyana Service Centres in the current financial year; this will ensurethat there is oversight and that service delivery is enhanced. Furthermore, the department hasadoptedtheuseof theBalancedScoreCard(BSC)asatool tomonitorandensureimplementation of activities and indicators as contained in the APP.
Changestoplannedtargets
Indicator Original2017/18 Target
Adjusted 2017/18 Target
Quarter 1Target
Quarter 2Target
Quarter 3Target
Quarter 4Target
Reason for Amendment
Number of business supported in critical sectors
3 2 - - - 2 Reprioritization of funds after2017/18AdjustmentBudget Allocation.
Number of projectssupportedthat qualify for co-funding -arrangement with Developmental Funding Institutions (DFI).
4 3 - - - 3 Reprioritization of funds after2017/18AdjustmentBudget Allocation.
NumberofR&Dprojectsinitiated
4 3 - 1 1 1 Reprioritization of funds after2017/18AdjustmentBudget Allocation.
Number of SOPs developed
3 1 1 - - - Reprioritization of funds after2017/18AdjustmentBudget Allocation.
Number of Provincial Job Summits convened
1 0 - - - - Reprioritization of funds after2017/18AdjustmentBudget Allocation.
Number of provincial incubators initiated
2 1 - - - 1 Reprioritization of funds after2017/18AdjustmentBudget Allocation.
Number of Business Hubs established
2 0 - - - - Reprioritization of funds after2017/18AdjustmentBudget Allocation.
Number of SMME Forums established at provincial and district levels
6 0 - - - - Reprioritization of funds after2017/18AdjustmentBudget Allocation.

69
Linking performance with budgets
2016/2017 2017/2018Sub-ProgrammeName
Final Appropriation
ActualExpenditure
(Over)/Under Expenditure
Final Appropriation
ActualExpenditure
(Over)/Under
ExpenditureR’000 R’000 R’000 R’000 R’000 R’000
Integrated Economic Development
24,256 23,103 1,153 44,947 32,750 12,197
Economic Research and Planning
70,357 68,370 1,987 135,505 139,428 (3,923)
Small Business Development
19,765 21,880 (2,115) 37,715 28,897 8,818
Total 114,378 113,353 1,025 218,167 201,075 17,092
4.4. Programme4:Tourism
To ensure adequate planning, growth, development and transformation in the Tourism Industry.
Sub-programmes:
Programme SubProgrammeTourism 1. Tourism Planning
2. Tourism Growth and Development
3. Transformation of Tourism Sector
This programme contributed to the following priorities:
•NDP:
o Chapter 3: Economy and employment
•MTSF:
o Outcome 4: Decent employment through inclusive growth
•FSGDS:
o Driver 5: Harness and increase tourism potential and opportunities

70
4.4.1. TourismPlanning
StrategicObjectivesTourismPlanning
Strategicobjec-tives
Performance Indicator
Actual Achievement 2016/2017
Planned Target2017/2018
Actual Achieve-ment2017/2018
Deviation from planned target2017/2018
Comments on deviations
1.1 Promote collaborations &partnership.
Strengthen strategic partnerships
Improve FS brand image
Increase market share Customer satisfaction
Improve prosperity and Optimise investments
Online reservation system to be implemented.
- 1 0 -1 Lack of suitable service providers
1.2 Alignment of tourism development plans with municipalities.
- 1 1 0 -
1.3 Number of initiatives facilitated for regional integration.
- 6 6 0 -
1.4 Number of Policy Development initiative for the provincial tourism sector
- 1 0 -1 The Policy could not be developed due to the delay by NDT with the reviewed of the National Tourism Sector Strategy which was supposed to inform the Provincial Policy.
1.5 Number of tourism development research reports compiled.
- 2 1 -1 The research topics have been submitted to CUT, however only one student was able to do the research.
1.6 Number of tourism specifictrainingprovided.
- 3 1 -2 The Service Provider could not facilitate the training within the last quarter of the financial,asa result the training was cancelled.

71
4.4.2. TourismGrowthandDevelopment
StrategicObjectivesTourismGrowthandDevelopment
Strategicobjectives Performance Indicator
Actual Achievement 2016/2017
Planned Target2017/2018
Actual Achievement2017/2018
Deviation from planned target2017/2018
Comments on deviations
1.1 Increase market share
Improve prosperity
Strengthen strategic partnerships
Customer satisfaction
Improve FS brand image
Improve prosperity
Optimise investments &improve prosperity
Number of Township/Kasie tourism campaigns for township development facilitated.
- 2 2 0 -
1.2 Number of stakeholder engagements.
- 4 4 0 -
1.3 Number of linkages established with private sector for tourism development.
- 2 1 -1 Due to a delay in concluding due diligence processes.
1.4 Number of feedback reports on tourism customer survey questionnaire.
- 2 2 0 -
1.5 Number of Social Tourism initiatives facilitated at DESTEA Resorts and government-owned attractions
- 4 3 -1 Due to ad-ministrative delays by Mangaung Metro, the event could not take place.
1.6 Number of workshops conducted for tourism awareness.
- 3 3 0 -
1.7 Number of DFI initiatives supported
4 4 0 -4 MOU’s between NDT and DFI’s were completed late in the financialyear.

72
4.4.3. Transformation of Tourism Sector
StrategicObjectivesTransformation of Tourism Sector
Strategicobjectives Performance Indicator
Actual Achievement 2016/2017
Planned Target2017/2018
Actual Achieve-ment2017/2018
Deviation from plannedtarget2017/2018
Comments on deviations
1.1 Exploit opportunities in critical sectors
Increase market share
Promote capital investment
ImproveR&D
Number of “A day in the life of a tourism enterprise” programmes conducted.
- 4 4 0 -
1.2 Number of enterprise improvement plans developed.
- 4 4 0 -
1.3 Tourism Careers Expo facilitated
1 1 1 0 -
1.4 Tourism Awards facilitated.
- 1 1 0 -
Strategiestoovercomeareasofunderperformance:
A Plan with timeframes to achieve crafting of policies will be put in place and the APP will be revised in the event that there is no funding for implementation thereof and/or when approval is taking longer to be granted due to various reasons such as public consultation.

73
Changes to planned targets
In Programme 4 there were no in-year changes to planned targets and indicators for the period under review. The department implemented its 2017/18 APP as tabled in legislature.
Linking performance with budgets
2016/2017 2017/2018Sub-ProgrammeName
Final Appropriation
ActualExpenditure
(Over)/Under Expenditure
Final Appropriation
ActualExpendi-ture
(Over)/Under Expenditure
R’000 R’000 R’000 R’000 R’000 R’000
Tourism Planning 77,237 75,491 1,746 6,031 5,102 929 Tourism Growth and Development
250 - 250 1,070 3,150 (2,080)
Transformation of Tourism Sector
250 - 250 2,090 685 1,405
Total 77,737 75,491 2246 9,191 8,937 254

74
5. TRANSFER PAYMENTS
5.1Transferpaymentstopublicentities
As part of the departmental transfer process, the three entities of the department provided assurancesthattheyimplementeffective,efficientandtransparentfinancialmanagementandinternal controls systems, as required by the PFMA and Treasury Regulations.
NameofPublicEntity
Servicesrenderedbythepublicentity
Amount trans-ferred to the publicentity(R’000)
Amount spent bythepublicentity (R’000)
Achievementsofthepublicentity
Free State Development Corporation
•InvestmentFacilitationand Management
•SMMEFinancing,Development and Support
•PropertyManagement-industrial, commercial and residential rental
32 260 9 465 104 SMMEs provided with promotional and/or export training programmes.
2businessventures(newandexpansion)committedwith investments above R10million.
26 SMMEs with investment commitment below R10million.
48 SMME’s were assisted with bridging loans.
61FDCcustomers(rentalandloans)assumedtobeinfinancialdistresswithpay-ment/ debt resolution plans.
33 existing and new SMMEs financiallyassisted.
75% occupancy rate of commercial and industrial properties.
•82%occupancyrateofrental property.

75
Free State Gambling, Liquor and Tourism Authority
To promote legally compliant, responsible, sustainable and transformed gaming and liquor industries through effective licensing, regulating and reporting on the activities of the industries, and to position the Free State Province as a tourist destination of choice.
R112 725 R112 725 •Successfulincorporationof the Free State Tourism Authority into the Free state Gambling and Liquor authority which is now called the Free State Gambling Liquor and Tourism Authority.
•Thecompletionandimplementation of the Data base management system(DBMS)whichwill capacitate the Authority to expedite the processing of applications to enhance revenue collection.
•TheSecondRouteOperator has been licensed and is set to roll out 1000 machines in the Province and 36 sites has already been approved by the board.
•SecondeditionoftheFree state Madeira Flower festival was a huge success that has further entrenched social cohesion and encouraged the previously disadvantaged toventureintoflowerfarming.
•PowerBoathasseenanew intake of young trainees pilots who will be trained at the level of international standards.
Total R144 985 R122 190
5.2Transferpaymentstoallorganisationsotherthanpublicentities
Name of transferee
Type of organisation
Purpose for whichthefundswere
used
Did the dept. complywiths38 (1) (j) of the
PFMA
Amount trans-ferred
(R’000)
Amount spent bytheentity
(R’000)
Reasons for the funds unspentbythe entity
Free State Black Business Chamber
Business Chamber
Radical Economic Transforma-tion
Yes R5 000 R5 000 N/A - All funds were spent.
Thetablebelowreflectsthetransferpaymentswhichwerebudgetedforintheperiod1April2017 to 31 March 2018, but no transfer payments were made.

76
Name of transferee
Purposeforwhichthefundsweretobeused
Amountbudgetedfor
(R’000)
Amount transferred
(R’000)
Reasonswhyfundswerenottransferred
None - - - -
6. CONDITIONAL GRANTS
6.1Conditionalgrantsandearmarkedfundspaid
GrantsandEarmarkedFunds CurrentBudget(R’000) TotalExpenditure(R’000)Conditional Grant Epwp Intergrated Grant For Prov 2,000 1,820
Total Conditional Grant 2,000 1,820EarmarkedFundsFlower Festival-Fsta 12,000 12,000
Global Trade Bridge 2,000 1,400
Tourism Promotion 4,000 4,000
Infrastructure Enhancement Alloc 13,709 13,090
RadicalEconomicTransformation(DEP) 15,000 11,572
RadicalEconomicTransformation(FDC) 15,000 15,000
MalutiSez(FDC) 4,000 4,000
Ngo Adoption 610 0
Waste Management 1,600 2,065
Es Fsgla 1,000 1,000
Smme Incubator Programme 3,590 3,404
Smme Equipment Support 1,305 1,509
Risk Sharing And Black Industrialist 7,000 7,000
Textile Fashion Support 500 419
Youth Trade Fair 281 105
Training And Roadshows In Townships 2,000 1,215
Total 83,595 77,779

77
6.2Conditionalgrantsandearmarkedfundsreceived
The table below details the conditional grants and ear marked funds received during for the period 1 April 2017 to 31 March 2018.
Conditional Grant EPWP:
Department who transferred the grant National Department of Public Works
Purpose of the grant
To alleviate unemployment, delivery goods and services labour-intensively and to provide work experience and training.
Expected outputs of the grantJob creation
Actual outputs achieved1253
AmountperamendedDORA(R’000)2000
Amountreceived(R’000)2000
Reasons if amount as per DORA was not receivedNone
Amountspentbythedepartment(R’000)1820
Reasons for the funds unspent by the entityThisisduetounpaidleaveforbeneficiariesabsentfromwork.
Reasons for deviations on performancen/a
Measures taken to improve performancen/a
Monitoring mechanism by the receiving departmentTreasury Infrastructure Review Model.

78
7. DONOR FUNDS
7.1 Donor Funds Receivedn/a
8. CAPITAL INVESTMENT
8.2Capitalinvestment,maintenanceandassetmanagementplan8.1.1.AssetManagementPlan
Bytheendofthefinancialyear2017/2018,thefollowingprocesseshadbeenfinalised:
•Stocktakingformachineryandequipment
•Thebarcodingofassetsandupdatingoftheroomassetslists
•Reconciliationsoftheassetssystems
•Ensuringthatallthesupportingdocumentationforassetstransactionsareinplace.
8.1.2. Infrastructure Projects
2016/2017 2017/2018Infrastructure projects Final
AppropriationActual
Expenditure
(Over)/Under Expenditure
Final Appropriation
Actual
Expenditure
(Over)/Under Expenditure
R’000 R’000 R’000 R’000 R’000 R’000
New and replacement assets
- - - 250 604 (354)
Existing infrastructure assets
- - - - - -
- Upgrades and additions
18 175 13 027 5 147 3 455 3 045 410
- Rehabilitation, renovations and refurbishments
- - - - - -
- Maintenance and repairs
2 274 2 232 42 9 519 9 441 78
Infrastructure transfer
- - - - - -
- Current - - - - - -- Capital - - - - - -
Total 20 449 15 259 5 189 13 224 13 090 134

79
8.1.3.Planstoclosedownordown-gradeanycurrentfacility
There are no plans to close down or down-grade any of the current facilities. The department wants to renovate facilities so that they can be up-graded and be in a position where we can compete with private resorts and reserves.
8.1.4.Progressmadeonthemaintenanceofinfrastructure
8.1.4.1. General maintenance
There are no plans to close down or down-grade any of the current facilities. The department wants to renovate facilities so that they can be up-graded and be in a position where we can compete with private resorts and reserves.
8.1.4.2. Major maintenance projects
Thefollowingmajormaintenanceprojectsarereceivingattention:
•UpgradingoffenceatSandveld
8.1.5.Detailsonhowassetholdinghaschangedduringtheperiodunderreview(incl.Informationondisposals,scrappingandlosses)
Departmentalassetholding
The following changes in the departmental asset holding were observed:
The losses for the department for the period under review have been estimated at R40 000 and in all instances cases were opened with the SAPS.

80
Disposals
Revenue collected for disposing scrapped assets:
•R8290forthewholeDepartment
8.1.6. Current status of capital assets
The current state of departmental capital assets in terms of percentages is as follows:
•Good: 35%
•Fair: 60%
•Bad: 5%

81
PART C: GOVERNANCEPART C: GOVERNANCE

82
1. INTRODUCTIONThe Department constantly strives to improve its internal processes to ensure effectivenessandefficiencyofbusinessprocesses.Measureshavebeenputinplacetopopulariseandaddressissuessuchastheconflictofinterest,codeofconductandthe health safety environment. Below is an account of processes followed to address these issues.
2. RISK MANAGEMENTDirector Risk Management unit was seconded to Department of Health and has return to the department on the 1st March 2018. Risk Management unit was not fully effective due to absence of leadership. Since the cancellation of secondment Risk Management unit has reviewed all its relevant policies.
RiskManagementCommitteewasalsonot fully functionduring thefinancialyear,however member has been appointed and the position for the chairpersons will be advertisedduring thenewfinancialyear.Theoutgoingchairperson’scontractwasrenew and expired 31 March 2018.
The Risk Management meeting was convened where Risk Management related polices were reviewed for 2018/19.
3. FRAUD AND CORRUPTION •Thedepartment’sfraudpreventionplanandtheprogressmadeinimplementingthe
fraud prevention plan:
o Training and Awareness
o RiskIdentificationandAssessment
o Internal control and compliance
•Mechanismsinplacetoreportfraudandcorruptionandhowtheseoperate.eg:Whistleblowing-Theneedforofficialstomakeconfidentialdisclosureaboutsuspectfraudand corruption:
o Whistle Blowing Implementation Plan
o Anti-Corruption hotline
o Anti-Corruption Unit

83
•Howthesecasesarereportedandwhatactionistaken?
o HoD
o Anti-Corruption Hotline
o Public Service Commission
o Anti-Corruption Unit
o Pre-investigation
o Investigation
4. MINIMISING CONFLICT OF INTEREST AllofficialsinFinanceandSCMhavesignedthedisclosureformsanddeclaredtheirinterest.Monitoringisdoneduringthefinancialyear.
5. CODE OF CONDUCTThe Code of Conduct is an instrument that is used in the Public Service to promote and maintain a high standard of professional ethics and good governance. It serves as a guideline to all public servants in various categories, levels and controls the relations in various ways, namely:
a) The relationship with the legislature and the executive;
b) The relationship between the department and the public;
c) The relationship between the employees at different levels;
d) The performance of duties; and
e) Personal conduct and private interest.
The implementation of the code ensures that there is uniformity in the Public Service with regard to service delivery. It also improves loyalty and brings control, compliance as well as prevention of corruption.
Each employee in the department has been given a copy of Public Service Code of Conduct Manual and all newly appointed employees are given a copy of the code on the day they assume duty. The code was also thoroughly explained to the newly appointed employees during their induction. Furthermore, workshops on the Code of Conduct are always conducted biannually.

84
The Code of Conduct outlines the procedure to be followed in case of any breach of any conditions of the Code of Conduct. All instances of non-compliance with the Code of Conduct are, therefore, treated seriously by the department and, depending on the nature of misconduct, the necessary disciplinary action are taken against the perpetrators.
6. HEALTH SAFETY AND ENVIRONMENTAL ISSUES According to the Occupational Health and Safety Act no 181 of 1993, Occupational health and Safety aims “to provide for the health and safety of persons at work and for the health and safety of persons in connection with the use of plant and machinery; the protection of persons other than persons at work against hazards to health and safety arising out of or in connection with the activities of persons at work; to establish an advisory council for occupational health and safety; and to provide for matters connected therewith”.
Thefollowingaresomeoftheexamplesofrisks/hazardsthathavebeenidentifiedand addressed through this Act:
•Chemicalhazardse.g.exposuretohighorlowtemperature,highlevelofnoise,such hazard can affect your concentration or lead to a possibility to accidents.
• Physical hazards e.g.Gases, dust, high level of industrial chemicals that canpoison your body, affect lungs and the ability to breath.
•Biologicalhazardse.g.organismscanbepassedfromonepersontotheotheroranimaltoaperson(peopleworkinginabattoirswithanimalsetc.
• Mechanical hazards e.g. moving parts or energy sources a broad range ofmachineryandequipmentarehighsourceofdanger(cancausecuts,crushinjuries,amputationsandfractures).
•Ergonomichazardse.g.workingincramppositionsorspaces,poorlighting,poorseating,orstandingforlongperiod(exposuretoeyestrain,backache,wriststrainand sore shoulders.
•Behaviouralhazardse.g.non-compliancewithstandards,lackofskills,newtasks.
Employers are therefore expected to provide and maintain, as far as is reasonably possible, a working environment that is safe and without risk to the health of the employees.ThedepartmenthasestablishedanoccupationalHealthandSafety(OHS)Committee to oversee health and safety matters in the department. The members of the committee comprises of the following members:

85
Nameofofficial Designation Role WorkStation1.Ms LGB Molefe Deputy Director:EHWP Chairperson HeadOffice2.Ms T. Morabe Senior OHS Practitioner Secretary HeadOffice3. Mr S. Makhubu Reserve Assistant Member Seekoeivlei4.Mr T.D. Telane Resort Assistant Member Sterkfontein Dam5. MsT. Monareng Admin Member Qwa-Qwa Service Center6.Mr T. Sebati Reserve Assistant Member TDR7.Mr M. Jacobs Resort Assistant Member Gariep Dam8. Mr Charles Tau Reserve Assistant
Member Kalkfontein9.Mr M. Booi Reserve Assistant Member Rustfontein Dam10.Ms M.Molefe Reserve Assistant Member Karee Nursery11.Mr S. Stok Reserve Assistant Member Maria Moroka12.Mr R.J. Lesupi Reserve Assistant Member Bathurst Reserve13.Ms M. Mathopa Cleaner Member Thaba-Nchu Service Center14.Mr M. Motaung Reserve Assistant Member Caledon15. Ms B. Matlakala Resort Assistant Member Soetdoring16. Mr P.S. Mokhele Reserve Assistant Member Sandveld17.Mr S. Choloto Reserve Assistant Member Parys Service Center18. Mr S. Yekwa Reserve Assistant Member Koppies19.Mr A. Mahlomola Resort Assistant Member Willem Pretorius20.Mr T. Seisho Resort Assistant Member Erfenis21.Mr M. Lecholo Game Capture Member Bathurst22.Mr V. van Rooyen Handyman Member Construction&Maintenance23. Mr S. Ncaba Member Parys Service Centre24.MsN.Dlali(notreplaced) Resigned Member Consumer Affairs25.Mr M. Mahlasela Assistant Director Member Labour Relations26.Ms R. Namola Personal Assistant Member Conservation27.Ms R Khumalo Member HOD’soffice28.Ms M. Mbuthile DisabilityOfficer Member GenderYouth&Disability29.Ms P. Nyokong Member SBD30.Ms M. Nyawo Cleaner Member Auxiliary Services31. Ms L. Tsotetsi Member Finance32.Ms N. Khomo Officer Member Environment33. Mr M. Tollie Officer Member Asset Management34.Ms M. Maloisane SecurityOfficer Member Security Services35. Mr Seekane General Foreman Member Koppies Dam Reserve
The members of the Committee were trained on Occupational Health and Safety (OHS)Act and FirstAid Level 1 and 2.Themain responsibility of the Committeemembers is to conduct health and safety inspections at their respective workplaces. Theirfindingsare reported to theEmployeeHealthandWellnessunitwho in turnsubmit a report with recommendations to the Head of Department.

86
Healthhazardsthathavebeenidentifiedandnottimeouslyattendedto,haveanegativeimpact on the health and morale of the departmental employees. In order to minimise the risks, a certain amount of the allocated budget has been set aside to correct the identifiedhazards.Healththreateninghazardsareprioritisedinaccordancewiththeavailable budget.
7. PORTFOLIO COMMITTEES
A Portfolio Committee Meeting took place on the following dates:
•18thOctober2017for1stquarternon-financialperformanceinformation.
•16thNovember2017for2ndquarternon-financialperformanceinformation.
•16thMay2018for3rdand4thquarternon-financialperformanceinformation.
The Portfolio Committee raised the following issues during the year under review:
•Transformationofthegameindustry
•Environmentalcompliance
•Smallbusinessdevelopment
•Environmentalimpactassessmentauthorization
8. PROPAC RESOLUTIONS
Resolution No. Subject Details ResponsebytheDepartment
Status of Resolve
1
AccountingOfficermust a)Implementmeasuresto ensure that the Supply Chain Management toolkit that was rolled out by Provincial Treasury during the2015/16financialyearis used to its full potential in order to curb non-compliance with Supply Chain practices that results in Irregular expenditure or non-compliance with laws and regulations; and
To ensure that officialsaretrainedon the SCM toolkit and used to its full potential.
Completed 100%
b)Ensurestaffisnominatedfor training presented by Provincial Treasury
To ensure that officialsaretrainedon the SCM toolkit and used to its full potential.
Completed 100%

87
Resolution No. Subject Details ResponsebytheDepartment
Status of Resolve
2
AccountingOfficermustensure that Written responses provided to the Committee is submitted within the timeframe indicated by the committee; and
The department has accepted Auditor General opinion therefore the Annual Report will be tabled
The Department confirmsandwillensurethat written responses will be submitted within the required timeframes to the Committee.
100%
3
Written responses receive the necessary priority and attention to ensure that it is factually correct and complete.
The department has accepted Auditor General opinion therefore the Annual Report will be tabled
The Department confirmsthatinfuture,written responses receive the necessary priority and attention to ensure that it is factually correct and complete.
100%
AccountingOfficermust Respond to the PSC within the timeframes required by the PSC
Ensure that the Department responds to the Public Service Commission (PSC)withinthetimeframes required
There is currently no investigations by PSC that required responses. The Department will ensure that it responds to all the future investigations of the PSC within the timeframes required.
90%
9. PRIOR MODIFICATIONS TO AUDIT REPORTS
Natureofqualification,disclaimer,adverseopinionandmattersofnon-compliance
Financialyearinwhichitfirstarose
Progressmadeinclearing/resolvingthematter
Qualifiedauditopinion 2016/17 •Irregular expenditure investigated
•Misclassificationscorrected
•Expenditurereclassified
10. INTERNAL CONTROL UNIT
Internal Control functions are performed in individual sections of the Financial Management Chief Directorate. For the Financial Accounting directorate the Internal Control function is performedintermsoftheverificationandsafekeepingoffinancialtransactiondocumentation,andensuringtheavailabilityofcredibleandverifiablesupportingdocumentationforinternaland external audit purposes.

88
11. INTERNAL AUDIT AND AUDIT COMMITTEES
Keyactivitiesandobjectivesofinternalaudit
Internal audit unit is independent of management and reports administratively to the AccountingOfficerandfunctionallytotheAuditCommittee.Athreeyearriskbasedrollingstrategic and annual plans were prepared by the Internal Audit Directorate and approved by the Audit Committee. The Audit Committee is of the opinion that the control environment needs improvement to provide reasonable assurance that risks are appropriately managed and that applicable legislation is adhered to. Management has implemented corrective actions were possible to ensure controls are in place and operating as intended.
Summaryofauditworkdone
Internalaudithascompleted20auditsfor2017/18financialyearduetoanincreaseinthestaff complement of the unit.
The following internal audit work was completed during the year under review:
•2016/17DraftAnnualFinancialStatements
•2017/18InterimFinancialStatements
•2017/2018AnnualPerformancePlan
•2017/18QuarterlyTargets
•Recruitment
•FollowupauditonFleetManagement
•FollowupauditonAssetManagement
•FollowupauditonServiceCentres
•MPAT
•RiskManagement
•FollowupauditonRevenueManagement
•PayrollManagement
•ContractManagement
•Transferstopublicandprivateentities
•LeaveManagement
89
The following were areas of concern:
•Investigationonirregularexpenditure
•Incorrectevidenceonreportedquarterlytargetsachieved.
•Nonimplementationofinternalcontrols.
Management is currently working towards resolving the above areas of concern.
Key activities of the audit committee
The Audit Committee’s scope of work is determined by the requirements of Treasury Regulation3.1.10.Accordingly,and in linewith this section, theCommittee’sobjectiveswas to assess and advise, among other things, on the following matters:
•Effectivenessofinternalcontrolsystem
•Activitiesandeffectivenessactivitiesoftheinternalauditfunction,includingitsannualworkprogramme,coordinationwiththeexternalauditors,thereportsofsignificantinvestigationsandtheresponsesofmanagementtospecificrecommendations;
•RiskareasoftheDepartment’soperationsascoveredinthescopeofinternalandexternalaudits;
•Adequacy,reliabilityandaccuracyofthefinancial informationprovidedtoManagementand other users of such information; and
•Anyaccountingandauditingconcernsidentifiedasaresultofinternalandexternalaudits;
•TheDepartment’scompliancewithlegalandregulatoryprovisions.

90
12. AUDIT COMMITTEE REPORT
AuditCommitteeMembersandAttendence
The Audit Committee consists of the following members listed hereunder and met 5 times as per its approved terms of reference.
Names Qualifications Internal or External
If Internal, position in the depart-ment
Date appointed
Date resigned
No of meetingsattended
W Rooifontein
(Chairperson)
B Comm (Honours)
External Director 1 July 2017 None 05
H Mohane MSc (AgriculturalEconomics)
Mcom(Eco-nomics)
External Managing Director
1 July 2017 None 05
NB Dyeyi B Proc External Magistrate 1 July 2017 None 05
AUDIT COMMITTEE REPORT
Wearepleasedtopresentourreportforthefinancialyearended31March2018.
AuditCommitteeResponsibility
The Committee reports that it has operated and performed its oversight responsibilities independently andobjectivelyincompliancewithsection38(1)(a)ofthePFMAandTreasuryRegulations3.1.TheAudit Committee has adopted appropriate formal terms of reference in its Audit Committee Charter. The Committee has also regulated its affairs in compliance with the Charter and has discharged its responsibilities as contained therein. The Audit Committee is an advisory Committee of the Departmentoperatingwithanindependentandobjectiveoverviewrole.
The Effectiveness of Internal Control
The system of internal control applied by the Department over risk management is effective, efficientandtransparent.However,deficiencieswerenotedincontrolsincertainareasasreportedby the Internal Auditors.

91
Although issues raised by the Auditor-General involving internal controls were responded to, management still need to ensure the elimination of these matters, paying particular attention to those raised repeatedly inpreviousfinancialperiods,andtheAuditCommitteehasreviewedthemanagementCommentssinthisregards and made recommendations to further improve management control mechanisms.
From the various reports of the Internal Auditors it was noted that no further matters were reported thatindicatesmaterialdeficienciesinthesystemofinternalcontroloranydeviations.Accordingly,wecanreportthatthesystemofinternalcontrolfortheperiodunderreviewwasefficientandeffective.
In-YearManagementandMonthly/QuarterlyReport
Quarterly financial as well as non- financial reports were discussed at quarterly meetings andsubmitted to Provincial Treasury as required by the PFMA. These reports were reviewed by the Audit Committee and recommendations were implemented to improve the usefulness of the reports.
Evaluation of Financial Statements
We reviewed and discussed the following
•Thedraftannualfinancialstatementsandinformationonthepredeterminedobjectivestobe included in the in the Annual report and
•Compliancewithlegalandregulatoryprovisionsand have made certain recommendations.
Auditor General’s Report
TheAudit Committee has discussed theAuditor General’s (AG’s) report. TheAudit CommitteeconcursandacceptsAG’sconclusionsandtheannualfinancialstatementsandisoftheopinionthatthefinancialstatementsmustbereadtogetherwiththereportoftheAG.
_________________
Mr W Rooifontein
Chairperson of the Audit Committee
Department of Economic, Small Business Development, Tourism and Environmental Affairs

92
PART D: HUMAN RESOURCE MANAGEMENT
PART D: HUMAN RESOURCE MANAGEMENT

93
1. INTRODUCTION
The information contained in this part of the annual report has been prescribed by the Minister for the Public Service and Administration for all departments in the public service.
2. OVERVIEW OF HUMAN RESOURCES
Provide Commentsary on the following:
Organisationalstructure
The Department of Economic, Small Business Development of Tourism and Environment Affairs reviewed its organisational structure in an effort to have a lean and mean structure. Before embarking on that process, the current organisational structure consisted of about 1674. About 295 posts were abolished and the proposed organizational structure will consist of 1379 posts. The proposed organizational structurehasbeingsubmittedtotheOfficeofthePremierandtotheDepartmentofPublic Service and Administration to indicate if they concur with the Department.
Thefollowingpostswerejobevaluatedduringthe2017/2018financialyear:
POST JE OUTCOME
Deputy Director: Development and Funding 11
Deputy Director: OD 11
Deputy Director: Consumer Investigations 11
Assistant Director: OD 9
Assistant Director: Tourism Support Programmes 9
Assistant Director: Consumer Investigation 9
Organisational Development Practitioner 7
TourismOfficer:TourismStrategyDevelopment 7
TourismOfficer:TourismPolicyCompliance 7
TourismOfficer:RuralTourismandProductDevelopment 7
TourismOfficer:TourismSupportProgrammes 7

94
TourismOfficer:TourismPolicyResearch&Development(bench-mark3posts) 7
AssistantDirector:Development&Funding 10
AssistantDirector:TourismPolicyMonitoring&Evaluation 9
Assistant Director: Tourism Policy and Strategy Development 9
AssistantDirector:TourismPolicyMonitoring&Evaluation 9
Eco-TourismClerk/ProtectedAreasClerk(Reserves/Resorts) 5
ReserveAssistant/ResortAssistant(Reserves/Resorts/Nursery) 3
Game Capturer 5
Culling Assistant 5
PermitOfficer:PermitOffice 7
•Thestatusofhumanresourcesinthedepartment.
As at 31 March 2018, the Department had a workforce of 692, this was inclusive of 675 permanent employees and 17 contract workers. In addition to the above, the department had 2 categories of employment contracts namely; Interns and Security Learners. The Department had 9 graduate interns and 19 Security Learners. Of the 9 Interns, 7 were recruited permanently in the department and the 2 remaining Interns were unsuccessful. All the 19 Security Learners were recruited permanently in the department with effect from 01 April 2018. The highest percentage of vacancy rate is as a result of unfunded vacancies in terms of the actual structure as the department recentlyfinalised leftof itsapprovedstructureonpersal.However, thedepartmenthas undertaken the process to abolish unfunded vacancies on Persal and after this exercise, 877 posts instead of 1674 will be left on Persal. This will translate to 185 poststhathavebeenprioritisedforfillingovertheMTEFperiod(2018-2020)andthevacancy rate will decrease to 21.1% as on 01 April 2018. As of 31 March 2018, one department vacancy rate was standing at 41,34%.
TheageprofileoftheDepartmentisnotofamajorconcernintermsofcriticaloccupation,however, measures needs to be put in place in order to address anticipated retirement inprogrammessuchasEnvironmentalBranchwere itwillbe losingmajorityof itsemployees.Of the692employees,190 (27.5%)arebetween theagesof18and35years(youth),87(12.6%)arebetweentheagesof36and39,198(28.6%)arebetweentheagesof40and49,181(26.15%)arebetweentheagesof50and59,36(5.2%)arebetweentheagesof60and65.Onehundredandnine(109)oftheseemployees will be retiring in the next 5-10 years through normal and/or compulsory retirement.Ofthisnumber,86(78.9%)arefromEnvironmentalManagementBranch,15(13.76%)fromAdministrationand8(1.1%)arefromEconomicDevelopment.Four(4)oftheseemployeesareonsmsandmmslevels.

95
•Humanresourceprioritiesfortheyearunderreviewandtheimpactofthese.
With the introduction of Balance Score Card, re-engineering process of the structure aswellastherelocationtonewofficeswhereinemployeesareoccupyingopenplanthanclosedoffices,thisresultedinmassivechangewithinthedepartment.As a result of these changes, the department deemed it necessary to train its employeesonchangemanagementinordertobeabletoadaptandadjustwiththe new changes.
As an ongoing process to capacitate and develop its employees, the department rolled out 14 training programmes. The training provided were able to equip employees with knowledge and skills thereby enhancing productivity in terms of service delivery. Furthermore, 30 employee were awarded part-time bursaries to studyoveraperiodoftimeinordertoincreaseapoolofqualifiedemployeesinthe department for employability.
In fillingof fundedposts, thedepartmentwasable to reduce its vacancy rateeven though it’s still at its highest. More people were employed within different units which assisted in increasing service delivery. However, more still needs to be done as the vacancy rate is still above the norm, which is 10% as per MPAT requirement.
In achieving the set employment equity target, one of the commitment made by the Honourable MEC, Dr Benny Malakoane in his 2017/18 budget vote was that the department will improve on its employment equity within the department by employment of people from designated groups. For the year under review, of the149postsfilled,26of thesepostswereonSMS(5),MMS(8)andJuniorManagement(13).Sixtyfivepercent(65%)ofthesepostsarefilledbywomenand 60% at SMS level. As at 31 March 2018, the department made progress in terms of these targets as follows: 88% for blacks, 42.48% for women, and 1.44% (ascomparedto1.15%forthe2016/17financialyearforpeoplewithdisabilities.There was progress for women at SMS level from 33.33% to 40.62% which is about 7.29% increase. The department is still experiencing challenges in terms of employment of persons with disabilities but has come up with strategies to improvethesituationinthenewfinancialyearwhenpostsareadvertised.Thedepartment lost 2 employees with disabilities as a result of ill-health retirement and transfer of function.
•Workforceplanningandkeystrategiestoattractandrecruitaskilledandcapableworkforce.
In attracting skilled and capable workforce, SMS member undergo technical exercise during the interviews where after they undergo competency assessment toidentifypotentialorgapsinacandidate.Identifiedgapsarethenincludedinthe SMS member’s Performance Development Plan to address these gaps.

96
•Employeeperformancemanagement
Fortheperiodof2017/18,majorityofemployeeshaveenteredintoperformanceagreement.Ofthe32SMSmembersthatwereinservice,31(96.9%)enteredinto performance agreement by the 31 May 2017. The reason for non-submission of one SMS member was due to the fact that he was on suspension. Currently, the department has a backlog in terms of payment of SMS outcome for the 3 pastfinancialyears.Paymentforthe2016/17forbothSMSandemployeesonsalary levels 2-12 were only approved for payment in May 2018.
From 2018/19 performance cycle, the Department of Public Service and Administration (DPSA) has introduced new directives with regard to theimplementation of the Performance Management and Development System (PMDS)foralllevelswithinthePublicServicewithaviewofimprovingefficiencyin the implementation of the new system. Trainings on the new system was provided but more workshops will be rolled out to ensure that all employees are able to implement these new directives.
•EmployeeHealthandWellnessProgrammes(EHWP)
The department have since implemented the EHWP to ensure the health and wellbeing of employees. Through this Programme, HIV Testing Services, Health Risk Assessments and different educational awareness campaigns were conducted that include commemorating different health calendar days. Affected employees were supported and infected employees were referred to different healthinstitutionsforenrolmentintheDiseaseManagementProgramme(DMP).Employees and their families were provided with counselling. Furthermore, The Occupational Health and Safety inspections were conducted to ensure the minimisation and where possible, the elimination of health hazards. Again, the EHWP also implemented the Sports and Recreation Activities. Employees were encouraged to participate in different sporting codes during wellness days.InterdepartmentalSportingtournamentsalsomarkedthefinancialyearitlobbied interest of employees with regard to sports and recreation. The EHWP also established relationships with different stakeholders to form a positive partnership that brought services to the employees.
•Highlights/achievementsandchallengesfacedbythedepartment,aswellasfuturehumanresourceplans/goals:
o Highlight/achievements:
• Thedepartmentwasable tofill149ofadvertisedpostsduring the2017/18financialyear.
•AppointmentoftheDeputyDirector:EHWPaswellasDeputyDirector:Labour

97
Relations was an achievement for these components as these posts have been vacate for more than 5 years.
•SportsandRecreationactivitiesmadeanimpactinencouragingthephysicalexcercises. Interdepartmental games were held, and the relationships were established between the KwaZulu-Natal Economic Development, Tourismand Environmental Affairs, North West Department of Environmental Affairs and the Northern Cape Department of Economic Development, Tourism and Environmental Affairs.
• The departmental choir took part in the provincial interdepartmental choircompetition and was appraised with a piano.
•HostingofLongServiceAwardsceremonyonthe26September2017wherein77 long serving employees were recognised.
o Challengesfacedbythedepartment:
• The delay in appointing the service provider to render a comprehensiveEmployee Health and Wellness Programme hampers service delivery. Services that are needed include amongst others, a multilingual councelling service that is accessible to employees and their families on 24 hours basis.
• Limitedavailability ofGG transport compromiseseffective servicedelivery,especially for SHWP employers.
•MedicalSurveillanceservicesarealsonotavailabletoensureproperplacementand wellbeing of employees.
•DelayinrespondingtoinjuryondutycasesbyDepartmentofLabourwhichcompromises the services provided to employees as it affects the payment of service providers.
•Difficultyinrecruitingpeoplelivingwithdisabilities.
3. HUMAN RESOURCES OVERSIGHT STATISTICS
3.1. Personnelrelatedexpenditure
Thefollowingtablessummarisesthefinalauditedpersonnelrelatedexpenditurebyprogramme and by salary bands. In particular, it provides an indication of the following:
•amountspentonpersonnel
•amountspentonsalaries,overtime,homeowner’sallowancesand medical aid.

98
Table 3.1.1 Personnel expenditure by programme for the period 1 April 2017 and 31 March 2018
Programme TotalEx-penditure
(R’000)
Personnel Expenditure
(R’000)
TrainingExpenditure
(R’000)
Professional and Special
Services Expenditure
(R’000)
Personnel Expenditure
as a % of total expenditure
Averagepersonnel cost per
employee (R’000)
Administration 141,056 80 558 1 855 - 57 369.53
Environmental Affairs
137,858 103 226 348 - 75 284.37
Economic Development
201,075 43 662 329 - 22 459.6
Tourism 8,937 7 803 - - 87 487.69
TOTAL 488,926 235,249 2,532 - 48 339.96
Table 3.1.2 Personnel costs by salary band for the period 1 April 2017 and 31 March 2018
Salaryband PersonnelExpendi-ture (R’000)
% of total personnel cost
No. of employees Averagepersonnelcost per employee
Contract(Levels1-2) 240 0.10 1 2 400.00Contract(Levels13-16)
3286 1.30 4 821.50
Contract(Levels3-5) 2335 0.90 7 333.57Contract(Levels6-8) 1648 0.70 6 274.67Contract(Levels9-12) 1099 0.40 3 366.33Contract Other 1583 0.60 21 75.38Highly skilled production(Levels6-8)
61 842 24.70 179 3421.34
Highly skilled supervision(Levels9-12)
69 324 27.90 120 577.70
Lowerskilled(Levels1-2)
11 544 4.60 47 245.62
Senior management (Levels13-16)
31 256 12.60 28 1 116.29
Skilled(Levels3-5) 54 536 22.00 302 180.50Other 6 747 3.00 17 396.88Total 235 249 91.8 693 339.46

99
Table 3.1.3 Salaries, Overtime, Home Owners Allowance and Medical Aid by programme for the period 1 April 2017 and 31 March 2018
Programme Salaries Overtime HomeOwnersAllowance
Medical Aid
Amount (R’000
Salaries as a % of personnel costs
Amount (R’000)
Overtime as a % of personnel costs
Amount (R’000)
HOA as a % of personnel costs
Amount (R’000)
Medical aid as a % of per-sonnel costs
ADMINISTRATION 73 421 91.00 1 063 1.20 2 480 2.80 4 094 4.70ECONOMIC DE-VELOPMENT
39 276 90.00 43 0.10 1 124 2.60 1 345 3.10
ENVIRONMENTAL AFFAIRS
81 628 79.00 1 779 1.60 4 214 3.80 7 392 6.70
TOURISM 7 037 90.00 0 0.00 196 2.40 357 4.10TOTAL 201 363 86.00 2 885 0.73 8 014 2.9 13 188 4.65
Table 3.1.4 Salaries, Overtime, Home Owners Allowance and Medical Aid by salary band for the period 1 April 2017 and 31 March 2018
Salaryband Salaries Overtime HomeOwnersAllow-ance
Medical Aid
Amount (R’000
Salaries as a % of personnel costs
Amount (R’000)
Overtime as a % of personnel costs
Amount (R’000)
HOA as a % of person-nel costs
Amount (R’000)
Medical aid as a % of personnel costs
Contract (Levels1-2) 240 100.00 0 0.00 0.00 0.00 0 0.00
Contract (Levels3-5) 2 307 98.80 27 1.20 0.00 0.00 0 0.00
Contract (Levels6-8) 1 643 99.60 0 0.00 1.00 0.10 0 0.00
Contract (Levels9-12) 998 88.20 0 0.00 0.00 0.00 0.00 0.00
Contract(Lev-els>=13) 2 985 86.40 0 0.00 23.00 0.70 0.00 0.00
Contract Other 1 553 97.30 30 1.90 0.00 0.00 0.00 0.00
Lower skilled (Levels1-2) 8 160 68.10 149 1.20 976.00 8.10 1 237 10.30
Skilled(Levels3-5) 39 385 70.80 1 128 2.00 3 327 6.00 5 864 10.50
Highly skilled production (Levels6-8) 48 415 77.60 884 1.40 2 020 3.20 3 871 6.20
Highly skilled supervision (Levels9-12) 58 392 80.90 668 0.90 1 238 1.70 2 075 2.90
Senior management (Levels>=13) 27 881 83.30 0 0.00 429.00 1.30 117 0.30
Periodical Remuneration 8 620 81.70 0.00 0.00 0.00 0.00 0.00 0.00
TOTAL 201 363 86.00 2 885 0.73 8 014 2.9 13 188 4.65

100
The following tables summarise the number of posts on the establishment, the number of employees, the vacancy rate, and whether there are any staff that are additional to the establishment.
This information is presented in terms of three key variables:
•programme
•salaryband
•criticaloccupations
Table 3.2.1 Employment and vacancies by programme as on 31 March 2018
Programme Numberofpostson approved establishment
Numberofpostsfilled
Vacancy Rate Numberofemployeesadditional to the establishment
Administration 463 218 85,71 2Environmental Affairs
901 363 59,71 0
Economic Development
265 95 64,15 0
Tourism 45 16 64,44 0Total 1674 692 58,66 2
Table 3.2.2 Employment and vacancies by salary band as on 31 March 2018
Salaryband Numberofpostsonapprovedestab-lishment
Numberofpostsfilled
Vacancy Rate Numberofemployeesadditional to the establishment
Lowerskilled(1-2) 42 36 85,71 0Skilled(3-5) 714 260 36,41 0Highly skilled production(6-8)
422 168 39,81 0
Highly skilled supervision(9-12)
451 98 21,73 1
Senior management (13-16)
45 29 35,56 1
Total 1674 692 41,34 2

101
Table 3.2.3 Employment and vacancies by critical occupations as on 31 March 2018
Critical occupation Numberofpostsonapprovedestab-lishment
Numberofpostsfilled
Vacancy Rate Numberofemployeesadditional to the establishment
Top Management (15-16)
3 3 0 0
Senior Management (13-14)
42 29 31 1
Middle Management &Professionals(11-12)
126 42 66,66 1
Junior Management &Supervisors(8-10)
351 117 66,66 0
AdministrativeOfficeWorkers&related(5-7)
555 255 54.05 0
Elementary&SemiSkilled(1-4)
597 246 58,86 0
Total 1674 692 58,66 2
3.2 FillingofSMSPosts
The tables in this section provide information on employment and vacancies as it relates to members of the Senior Management Service by salary level. It also provides information on advertisingandfillingofSMSposts,reasonsfornotcomplyingwithprescribedtimeframesand disciplinary steps taken.
Table 3.3.1 SMS post information as on 31 March 2018
SMS Level Totalnumberof funded SMS
posts
Totalnumberof SMS posts
filled
% of SMS postsfilled
Totalnumberof SMS posts
vacant
% of SMS posts vacant
Director-General/ Head of Department
1 1 100 0 0
Salary Level 16 0 0 0% 0 0Salary Level 15 2 1 50 1 50Salary Level 14 9 5 55.5 4 44.4Salary Level 13 33 24 72.7 9 27Total 45 33 78.82 14 30.4

102
Table 3.3.2 SMS post information as on 30 September 2017
SMS Level Totalnumberof funded SMS
posts
Totalnumberof SMS posts
filled
% of SMS postsfilled
Totalnumberof SMS posts
vacant
% of SMS posts vacant
Director-General/ Head of Department
1 1 100 0 0
Salary Level 16 0 0 0% 0 0Salary Level 15 2 1 50 1 50Salary Level 14 9 5 55.5 2 44.4Salary Level 13 33 20 60,6 13 39Total 45 28 62,22 16 36.36
Table 3.3.3 Advertising and filling of SMS posts for the period 1 April 2017 and 31 March 2018
SMS Level
Advertising FillingofPostsNumberofvacanciesper level advertised in 6monthsofbecoming
vacant
Numberofvacanciesperlevelfilledin6monthsof
becomingvacant
Numberofvacanciesperlevelnotfilledin6monthsbutfilledin12
monthsDirector-General/ Head of Department
1 0 1
Salary Level 16 0 0 0Salary Level 15 1 1 0Salary Level 14 0 0 0Salary Level 13 0 0 0Total 2 1 1
Table 3.3.4 Reasons for not having complied with the filling of funded vacant SMS - Advertised within 6 months and filled within 12 months after becoming vacant for the period 1 April 2017 and 31 March 2018
Reasons for vacancies not advertised within twelve months Delay in getting approval for opening of Persal appointment function, as a result, recruitment process could notbefinalised
Reasons for vacancies not filled within six months Delay in getting approval for opening of Persal appointment function, as a result, recruitment process could notbefinalised
Notes
•IntermsofthePublicServiceRegulationsChapter1,PartVIIC.1A.3,departmentsmust indicategoodcauseorreasonfornothavingcompliedwiththefillingofSMSposts within the prescribed timeframes.

103
Table 3.3.5 Disciplinary steps taken for not complying with the prescribed timeframes for filling SMS posts within 12 months for the period 1 April 2017 and 31 March 2018
Reasons for vacancies not advertised within six months
None, as the process is outside departmental control
Reasons for vacancies not filled within six monthsNone, as the process is outside departmental control
•IntermsofthePublicServiceRegulationsChapter1,PartVIIC.1A.2,departmentsmust indicate good cause or reason for not having complied with the filling ofSMS posts within the prescribed timeframes. In the event of non-compliance with this regulation, the relevant executive authority or head of department must take appropriatedisciplinarystepsintermsofsection16A(1)or(2)ofthePublicServiceAct.
3.3 JobEvaluation
Within a nationally determined framework, executing authorities may evaluate or re-evaluateanyjobinhisorherorganisation.IntermsoftheRegulationsallvacanciesonsalarylevels9andhighermustbeevaluatedbeforetheyarefilled.Thefollowingtable summarises the number of jobs that were evaluated during the year underreview. The table also provides statistics on the number of posts that were upgraded or downgraded.
Table 3.4.1 Job Evaluation by Salary band for the period 1 April 2017 and 31 March 2018
Salary band
Numberofposts on
approved es-tablishment
NumberofJobsEvaluated
% of posts evaluated bysalarybands
PostsUpgraded PostsdowngradedNumber % of posts
evaluatedNumber % of posts
evaluated
Lower Skilled (Levels1-2)
42 0 0 0 0 0 0
Skilled (Levels3-5)
714 4 0,56 0 0 0 0
Highly skilled production (Levels6-8)
422 7 1.65 0 0 0 0
Highly skilled supervision
(Levels9-12)
451 9 1.99 0 0 0 0

104
Senior Manage-ment Service Band A
33 0 0 0 0 0 0
Senior Manage-ment Service Band B
9 0 0 0 0 0 0
Senior Manage-ment Service Band C
2 0 0 0 0 0 0
Senior Manage-ment Service Band D
1 0 0 0 0 0 0
Total 1674 20 1,19 0 0 0 0
The following table provides a summary of the number of employees whose positions were upgraded due to their post being upgraded. The number of employees might differ from the number of posts upgraded since not all employees are automatically absorbed into the new posts and some of the posts upgraded could also be vacant.
Table 3.4.2 Profile of employees whose positions were upgraded due to their posts being upgraded for the period 1 April 2017 and 31 March 2018
Gender African Asian Coloured White TotalFemale 25 0 3 0 28
Male 61 0 1 4 66Total 86 0 4 4 94
Employees with a disability -
The following table summarises the number of cases where remuneration bands exceeded thegradedeterminedbyjobevaluation.Reasonsforthedeviationareprovidedineachcase.
Table 3.4.3 Employees with salary levels higher than those determined by job evaluation by occupation for the period 1 April 2017 and 31 March 2018
Occupation Numberofemploy-ees
Jobevaluationlevel
Remuneration level Reason for deviation
Deputy Director: Salaries
1 11 13 Retention of employee’s salary
Deputy Director: Asset and Disposal
1 11 12 Retention in terms of Public Service Regulations
Assistant Director: Youth Development
1 10 12 Retention of employee’s salary

105
PMDS Practitioner 2 7 8 Transfer with the retention ofsalary(benchmarkofpreviouspost)
System Analyst 1 8 9 Retention in terms of Public Service Regulations
ASD:LejweleputswaService Centre
1 9 12 Transfer with the retention of salary
Property Admin Officer
1 7 8 Transfer with the retention of salary
Deputy Director: Tourism Product Development
1 11 13 Transfer with the retention of salary
Trade Advisor: LejweleputswaService Centre
1 7 12 Transfer with the retention of salary
Labour Relations Officer
2 7 8 Lowering of salary level as a result of benchmark
Trade Advisor: BBBE
1 7 8 Transfer with the retention of salary
Accounting Clerk 5 5 6 Lowering of salary level as a result of benchmark
Assistant Director: Physical&Information Security
1 9 12 Transfer with the retention of salary
Totalnumberofemployeeswhosesalariesexceededtheleveldeterminedbyjobevaluation
19
Percentageoftotalemployed 2.7%
Thefollowingtablesummarisesthebeneficiariesoftheaboveintermsofrace,gender,and disability.
Table 3.4.4 Profile of employees who have salary levels higher than those determined by job evaluation for the period 1 April 2017 and 31 March 2018
Gender African Asian Coloured White TotalFemale 10 0 0 0 10Male 9 0 0 0 9Total 19 0 0 0 19
EmployeeswithadisabilityEmployeeswithadisability
1 0 0 0 1
Notes
•Iftherewerenocaseswherethesalarylevelswerehigherthanthosedeterminedbyjob
evaluation, keep the heading and replace the table with the following:
Total number of Employees whose salaries exceeded the gradesdeterminebyjobevaluation
19

106
3.5 EmploymentChanges
This section provides information on changes in employment over the financialyear.Turnoverratesprovideanindicationoftrendsintheemploymentprofileofthedepartment. The following tables provide a summary of turnover rates by salary band andcriticaloccupations(seedefinitioninnotesbelow).
Table 3.5.1 Annual turnover rates by salary band for the period 1 April 2017 and 31 March 2018
Salary Band Numberofemployees at beginningof
period-April2017
Appointments and transfers into the
department
Terminations and transfers out of the department
Turnover rate
Lowerskilled(Levels1-2) 234 24 9 3.8Skilled(Levels3-5) 96 51 25 26Highly skilled production (Levels6-8)
211 42 15 14.2
Highly skilled supervision (Levels9-12)
36 25 6 35.2
Senior Management Service Bands A
23 4 2 17
Senior Management Service Bands B
5 1 1 40
Senior Management Service Bands C
2 2 0 0
Senior Management Service Bands D
1 0 1 100
Contracts 34 0 34 100
Total 642 149 92 14.3

107
Table 3.5.2 Annual turnover rates by critical occupation for the period 1 April 2017 and 31 March 2018
Critical Occupation Numberofemployees at beginningofperiod-April 2017
Appointments and transfers into the department
Terminations and transfers out of the department
Turnover rate
Top Management (15-16)
3 2 1 33
Senior Management (13-14)
27 5 2 7.4
Middle Management &Professionals(11-12)
35 7 1 2.9
Junior Management &Supervisors(8-10)
110 18 13 11.8
AdministrativeOfficeWorkers&related(5-7)
186 42 22 11.8
Elementary&SemiSkilled(1-4)
281 75 53 18.7
TOTAL 642 149 92 14.3
Thetablebelowidentifiesthemajorreasonswhystaffleftthedepartment.
Table 3.5.3 Reasons why staff left the department for the period 1 April 2017 and 31 March 2018
Termination Type Number %ofTotalResignationsDeath 4 4.4Resignation 14 15.2Expiry of contract 34 37Dismissal – operational changes 0 0Dismissal – misconduct 0 0Dismissal–inefficiency 0 0Discharged due to ill-health 2 2.2Retirement 12 13Transfer to other Public Service Departments
26 28.3
Other 0 0Total 0 0Totalnumberofemployeeswholeft as a % of total employment
92 100

108
Table 3.5.4 Promotions by critical occupation for the period 1 April 2017 and 31 March 2018
Occupation Employees 1 April 2017
Promotions to another salary
level
Salary level promotions as a % ofemployeesby
occupation
Progressionstoanother notch withinasalary
level
Notch progressionasa% of employees byoccupation
Top Management (15-16)
3 2 66 0 0
Senior Management (13-14)
27 2 7.4 0 0
Middle Management&Professionals (11-12)
35 3 8.6 0 0
Junior Management &Supervisors(8-10)
110 9 8.2 0 0
Administrative OfficeWorkers&related(5-7)
186 5 2.7 0 0
Elementary&Semi Skilled (1-4)
281 4 1.4 0 0
TOTAL 642 25 3.9 0 0
Table 3.5.5 Promotions by salary band for the period 1 April 2017 and 31 March 2018
Salary Band Employees 1 April 2017
Promotions to another salary
level
Salarybandspromotions as a % ofemployeesby
salary level
Progressionstoanother notch withinasalary
level
Notchprogressionas a % of
employeesbysalarybands
Lowerskilled(Levels1-2)
207 0 0 0 0
Skilled(Lev-els3-5)
96 7 7.3 0 0
Highly skilled production (Levels6-8)
211 2 0.9 0 0
Highly skilled supervision (Levels9-12)
98 12 12 0 0
Senior Management (Level13-16)
30 4 13 0 0
Total 642 25 3.9 0 0

109
3.6 EmploymentEquity
Table 3.6.1 Total number of employees (including employees with disabilities) in each of the following occupational categories as on 31 March 2018
Occupational category
Male Female Total
African Coloured Indian White African Coloured Indian WhiteLegislators, senior officialsandmanagers
36 2 0 7 27 1 1 0 74
Profession-als
1 0 0 4 3 0 0 1 9
Technicians and associ-ate profes-sionals
37 4 0 29 40 0 0 7 117
Clerks 116 4 0 6 119 1 0 8 254Service and sales work-ers
0 0 0 0 0 0 0 0 0
Skilled agriculture andfisheryworkers
0 0 0 0 0 0 0 0 0
Craft and re-lated trades workers
0 0 0 0 0 0 0 0 0
Plant and machine operators and assem-blers
0 0 0 0 0 0 0 0 0
Elementary occupa-tions
148 6 0 1 79 4 0 0 238
Total 338 16 0 47 268 6 1 16 692Employees withdis-abilities
7 0 0 1 2 0 0 0 10

110
Table 3.6.2 Total number of employees (including employees with disabilities) in each of the following occupational bands as on 31 March 2018
Occupational Band
Male Female
African Coloured Indian White African Coloured Indian White TotalTop Management
6 0 0 0 1 0 1 0 8
Senior Management
11 0 0 2 11 0 0 0 24
Professionally qualifiedandexperienced specialists and mid-management
18 2 0 5 15 1 0 1 42
Skilled technical and academically qualifiedworkers,juniormanagement, supervisors, foreman and superintendents
39 4 0 33 42 0 0 8 126
Semi-skilled and discretionary decision making
116 4 0 6 119 1 0 8 254
Unskilled and defineddecisionmaking
148 6 0 1 83 4 0 0 238
Total 338 16 0 47 271 6 1 17 692Employees withdisabilities
7 0 0 1 2 0 0 0 10

111
Table 3.6.3 Recruitment for the period 1 April 2016 and 31 March 2018
Occupational Band
Male Female
African Coloured Indian White African Coloured Indian White TotalTop Management 2 0 0 0 0 0 1 0 3Senior Management
3 0 0 0 2 0 0 0 4
Professionally qualifiedandexperienced specialists and mid-management
2 0 0 0 4 1 0 0 7
Skilled technical and academically qualifiedworkers,juniormanagement, supervisors, foreman and superintendents
8 0 0 1 8 0 0 0 17
Semi-skilled and discretionary decision making
18 2 0 0 29 0 0 0 49
Unskilled and defineddecisionmaking
39 2 0 0 28 0 0 0 69
Total 67 4 0 1 67 1 1 0 149Employeeswithdisabilities
1 0 0 1 0 0 0 0 2
Table 3.6.4 Promotions for the period 1 April 2017 and 31 March 2018
Occupational Band Male FemaleAfrican Coloured Indian White African Coloured Indian White Total
Top Management 1 0 0 0 0 0 1 0 2
Senior Management 1 0 0 0 1 0 0 0 2Professionally qualifiedandexperienced specialists and mid-management
2 0 0 0 1 0 0 0 3
Skilled technical and academically qualifiedworkers,juniormanagement,supervisors, foreman and superintendents
4 0 0 1 4 0 0 0 9
Semi-skilled and discretionary decision making
4 0 0 0 1 0 0 0 5
Unskilledanddefineddecision making
2 0 0 0 2 0 0 0 4

112
Occupational Band Male FemaleAfrican Coloured Indian White African Coloured Indian White Total
Total 14 0 0 1 8 0 0 0 25Employees with disabilities
0 0 0 1 0 0 0 0 1
Table 3.6.5 Terminations for the period 1 April 2017 and 31 March 2018
Occupational Band
Male Female
African Coloured Indian White African Coloured Indian White TotalTop Management 1 0 0 0 0 0 0 0 2Senior Management 1 0 0 0 0 0 0 0 1Professionally qualifiedandexperienced specialists and mid-management
0 0 0 0 1 0 0 0 1
Skilled technical and academically qualifiedworkers,juniormanagement,supervisors, foreman and superintendents
3 0 0 1 5 0 0 0 9
Semi-skilled and discretionary decision making
10 0 0 1 9 1 0 1 22
Unskilled and defineddecisionmaking
21 0 0 1 12 0 0 0 34
Total 36 0 3 27 1 0 66EmployeeswithDisabilities
0 0 0 0 1 0 0 0 1
Table 3.6.6 Disciplinary action for the period 1 April 2017 and 31 March 2018
Disciplinary action
Male Female TotalAfrican Coloured Indian White African Coloured Indian White
Written warning
0 0 0 0 0 0 0 0 0
Final Written warning
1 0 0 1 0 0 0 0 2

113
Table 3.6.7 Skills development for the period 1 April 2017 to 31 March 2018
Occupational category
Male FemaleAfrican Coloured Indian White African Coloured Indian White Total
Legislators, senior officialsandmanagers
36 2 0 7 27 1 1 0 74
Professionals 1 0 0 4 3 0 0 1 9Technicians and associate professionals
37 4 0 29 40 0 0 7 117
Clerks 121 4 0 6 123 1 0 8 263Service and sales workers 0 0 0 0 0 0 0 0 0
Skilled agriculture andfisheryworkers 0 0 0 0 0 0 0 0 0
Craft and related trades workers 0 0 0 0 0 0 0 0 0
Plant and machine operators and assemblers
0 0 0 0 0 0 0 0 0
Elementary occupations 148 6 0 1 79 4 0 0 238
Total 156 6 0 12 149 1 0 0 618Employeeswithdisabilities
0 0 0 0 0 0 0 0 0
3.7 SigningofPerformanceAgreementsbySMSMembers
AllmembersoftheSMSmustconcludeandsignperformanceagreementswithinspecifictimeframes. Information regarding the signing of performance agreements by SMS members, the reasons for not complying within the prescribed timeframes and disciplinary steps taken is presented here.
Table 3.7.1 Signing of Performance Agreements by SMS members as on 31 May 2018
SMS Level Totalnumberoffunded SMS posts
TotalnumberofSMSmembers
Totalnumberofsignedperformance
agreements
Signedperformanceagreementsas%oftotalnumberofSMSmembers
Director-General/ Head of Depart-ment
1 1 1 100
Salary Level 16 1 1 1 100Salary Level 15 2 1 1 50Salary Level 14 7 5 5 100Salary Level 13 28 24 23 95.8Total 38 32 31 96.9

114
Table 3.7.2 Reasons for not having concluded Performance agreements for all SMS members as on 31 March 2018
Reasons One SMS member was on suspension
Table 3.7.3 Disciplinary steps taken against SMS members for not having concluded Performance agreements as on 31 March 2018
Reasons One SMS member was on suspension
3.8 PerformanceRewards
To encourage good performance, the department has granted the following performance rewards during the year under review. The information is presented in terms of race, gender, disability,salarybandsandcriticaloccupations(seedefinitioninnotesbelow).
Table 3.8.1 Performance Rewards by race, gender and disability for the period 1 April 2017 and 31 March 2018
Race and Gender
BeneficiaryProfile CostNumberofben-
eficiariesNumberofemployees
% of total withingroup
Cost (R’000) Averagecostperemployee
African 0 0 0 0 0 Male 0 0 0 0 0 Female 0 0 0 0 0Asian 0 0 0 0 0 Male 0 0 0 0 0 Female 0 0 0 0 0Coloured 0 0 0 0 0 Male 0 0 0 0 0 Female 0 0 0 0 0White 0 0 0 0 0 Male 0 0 0 0 0 Female 0 0 0 0 0Total 0 0 0 0 0

115
Table 3.8.2 Performance Rewards by salary band for personnel below Senior Management Service for the period 1 April 2017 to 31 March 2018
Salaryband
BeneficiaryProfile Cost Total cost as a % of the total
personnel expenditure
Numberofbeneficiaries
Numberofemployees
% of total withinsalary
bands
Total Cost (R’000)
Averagecostper employee
Lower Skilled (Levels1-2)
0 0 0 0 0 0
Skilled(level3-5)
0 0 0 0 0 0
Highly skilled production (level6-8)
0 0 0 0 0 0
Highly skilled supervision (level9-12)
0 0 0 0 0 0
Total 0 0 0 0 0 0
Table 3.8.3 Performance Rewards by critical occupation for the period 1 April 2017 to 31 March 2018
Critical occupation
BeneficiaryProfile CostNumberofbeneficiaries
Numberofem-ployees
%oftotalwithinoccupation
Total Cost (R’000)
Averagecostperemployee
Legislators, senior officialsandmanagers
0 0 0 0 0
Technicians and associate professionals
0 0 0 0 0
AdministrativeOfficeWorkers
0 0 0 0 0
Elementary occupations 0 0 0 0 0Total 0 0 0 0 0

116
Table 3.8.4 Performance related rewards (cash bonus), by salary band for Senior Management Service for the period 1 April 2017 to 31 March 2018
Salaryband
BeneficiaryProfile Cost Total cost as a % of the total personnelexpen-diture
Numberofben-eficiaries
Numberofemployees
% of total withinsalary
bands
Total Cost (R’000)
Averagecost per
employee
Band A 0 0 0 0 0 0Band B 0 0 0 0 0 0Band C 0 0 0 0 0 0Band D 0 0 0 0 0 0Total 0 0 0 0 0 0
3.9 The tables below summarise the employment of foreign nationals in the department in termsofsalarybandandmajoroccupation.
Table 3.9.1 Foreign workers by salary band for the period 1 April 2017 and 31 March 2018
Salary Band 01 April 2016 31 March 2017 ChangeNumber % of total Number % of total Number %Change
Lower skilled 0 0 0 0 0 0Highly skilled production (Lev.6-8)
0 0 0 0 0 0
Highly skilled supervision (Lev.9-12)
0 0 0 0 0 0
Contract(level9-12) 0 0 0 0 0 0Contract(level13-16) 0 0 0 0 0 0Total 0 0 0 0 0 0
Table 3.9.2 Foreign workers by major occupation for the period 1 April 2017 and 31 March 2018
Major occupation 01 April 2017 31 March 2018 ChangeNumber % of total Number % of total Number %Change
None
3.10. Leave utilisation
ThePublicServiceCommissionidentifiedtheneedforcarefulmonitoringofsickleavewithinthe public service. The following tables provide an indication of the use of sick leave and disability leave. In both cases, the estimated cost of the leave is also provided.

117
Table 3.10.1 Sick leave for the period 1 January 2017 to 31 December 2017
Salary Band Total days %DayswithMedicalcertifi-
cation
NumberofEmployees usingsick
leave
% of total employees usingsick
leave
Averagedaysper employee days/numberof
employees
Estimated Cost (R’000)
Lower Skills (Level1-2)
403 26.40 41 100 10 152
Skilled(levels3-5)
1291 43.68 185 58.9 7 698
Highly skilled production (levels6-8)
693 9.43 100 54.6 12.9 670
Highly skilled supervision (levels9-12)
534 12.24 73 59.8 7.3 105
Top and Senior management (levels13-16)
84 77.85 13 40.6 15.5 348
Total 3005 33.92 419 60.5 52.7 1973
Table 3.10.2 Disability leave (temporary and permanent) for the period 1 January 2017 to 31 December 2017
Salary Band Total days %DayswithMedicalcertifi-
cation
NumberofEmployees usingsick
leave
% of total employees usingsick
leave
Averagedays per employee
Estimated Cost
(R’000)
Lower skilled (Levels1-2)
48 100 3 7.3 16 18
Skilled(Levels3-5)
53 100 7 1.9 13 27
Highly skilled production (Levels6-8)
129 100 4 2.1 3 117
Highly skilled supervision (Levels9-12)
14 100 1 0.8 7 21
Senior management (Levels13-16)
0 100 0 0 0 0
Total 244 100 15 2.1 6 183

118
The table below summarises the utilisation of annual leave. The wage agreement concluded with trade unions in the PSCBC in 2000 requires management of annual leave to prevent high levels of accrued leave being paid at the time of termination of service.
Table 3.10.3 Annual Leave for the period 1 January 2017 to 31 December 2017
Salaryband Totaldaystaken NumberofEmployeesus-ingannualleave
Averageperemployee
Lowerskilled(Levels1-2)
1 331 64 20.8
SkilledLevels3-5) 6 609 269 24.6Highly skilled production(Levels6-8)
3 425 151 22.7
Highly skilled supervision(Levels9-12)
2 461 108 22.8
Senior management (Levels13-16)
510 25 20.4
Total 14 336 617 23.3
Table 3.10.4 Capped leave for the period 1 January 2017 to 31 December 2017
Salaryband Total days of cappedleavetaken
NumberofEm-ployeesusingcapped leave
Averagenumberofdaystakenper
employee
Averagecappedleave per employee as on 31 March 2017
Lowerskilled(Levels1-2) 4.98 1 4.9 18.5SkilledLevels3-5) 26 5 5.2 23.4Highly skilled production (Levels6-8)
5 1 5 29.2
Highly skilled supervision(Levels9-12)
1 1 1 50.3
Senior management (Levels13-16)
0 0 0 32.3
Total 36.98 8 16.1 29.6
The following table summarise payments made to employees as a result of leave that was not taken.

119
Table 3.10.5 Leave pay-outs for the period 1 April 2017 and 31 March 2018
Reason Total amount (R’000) Numberofemployees Averageperemployee(R’000)
Leave pay-out for 2014/15 due to non-utilisation of leave for the previous cycle
235 8 29
Capped leave pay-outs on termination of service for 2016/17
96 9 11
Current leave pay-out on termination of service for 2016/17
490 21 23
Total 821 38 21
3.11. HIV/AIDS&HealthPromotionProgrammes
Table 3.11.1 Steps taken to reduce the risk of occupational exposure
Units/categories of employees identified to be at highriskofcontractingHIV&relateddiseases(ifany)
Keystepstakentoreducetherisk
1. Game Capture Education and awareness sessions
First Aid training
Condom distribution and demonstration
Providing PPE
Counselling and emotional support2. Cleaners Education and awareness sessions
First Aid training
Provide PPE
Condom distribution and demonstration
Counselling and emotional support3. Employees residing at Resorts and Reserves Education and awareness session
First Aid training
Provide PPE
Condom distribution and demonstration
Counselling and emotional support4. Contraction and Maintenance Team Education and awareness sessions
First Aid training
Provide PPE
Condom distribution and demonstration
Counselling and emotional support

120
5. EPWP Contractors Education and awareness sessions
Provide PPE
First Aid training
Condom distribution and demonstration
Counselling and emotional support6. Learnerships Education and awareness sessions
First Aid training
Provide PPE
Condom distribution and demonstration
Counselling and emotional support
Table 3.11.2 Details of Health Promotion and HIV/AIDS Programmes (tick the applicable boxes and provide the required information)
Question Yes No Details, if yes1. Has the department designated a member of the SMS to implement the provisions contained in Part VI E of Chapter 1 of the Public Service Regulations, 2001? If so, provideher/his name and position.
Yes Acting Director: OHRD
2. Does the department have a dedi-cated unit or has it designated spe-cific staff members to promote thehealth and well-being of your em-ployees?Ifso,indicatethenumberof employees who are involved in this task and the annual budget that is available for this purpose.
Yes Five employees are appointed for the task
Allocated budget wasR1.1m
3. Has the department introduced an Employee Assistance or Health Promotion Programme for your em-ployees?Ifso,indicatethekeyele-ments/services of this Programme.
Yes The EHWP implements the four pillars that includes Health and Productivity, HIV/AIDS Management, Wellness Management and Occupational Health and Safety.
4. Has the department established (a)committee(s)ascontemplatedinPartVIE.5 (e)ofChapter1of thePublicServiceRegulations,2001?Ifso, please provide the names of the members of the committee and the stakeholder(s)thattheyrepresent.
Yes The EHWP committee was appointed
5. Has the department reviewed its employment policies and practices to ensure that these do not unfairly discriminate against employees on thebasisof theirHIVstatus?Ifso,list the employment policies/prac-tices so reviewed.
Yes HIV Policies are in place, EE Act is also implemented

121
Question Yes No Details, if yes6. Has the department introduced measures to protect HIV-positive employees or those perceived to be HIV-positive from discrimination? Ifso, list the key elements of these measures.
Yes Policies are in place and are implement-ed. Information sessions are conducted to educate employees
7. Does the department encour-age its employees to undergo Vol-untary Counselling and Testing? Ifso, list the results that you have you achieved.
Yes HTS and HRA campaigns are conducted every six months. The services are brought to the workplace to ensure accessibility to services
8. Has the department developed measures/indicators to monitor &evaluate the impact of its health pro-motionprogramme?Ifso,listthesemeasures/indicators.
Yes DPSA monitors the EHW Programme
Question Yes No Details, if yes1. Has the department designated a member of the SMS to implement the provisions contained in Part VI E of Chapter 1 of the Public Service Regulations, 2001? If so, provideher/his name and position.
Yes Acting Director: OHRD
2. Does the department have a dedi-cated unit or has it designated spe-cific staff members to promote thehealth and well-being of your em-ployees?Ifso,indicatethenumberof employees who are involved in this task and the annual budget that is available for this purpose.
Yes Five employees are appointed for the task
Allocated budget wasR1.1m
3. Has the department introduced an Employee Assistance or Health Promotion Programme for your em-ployees?Ifso,indicatethekeyele-ments/services of this Programme.
Yes The EHWP implements the four pillars that includes Health and Productivity, HIV/AIDS Management, Wellness Management and Occupational Health and Safety.
4. Has the department established (a)committee(s)ascontemplatedinPartVIE.5 (e)ofChapter1of thePublicServiceRegulations,2001?Ifso, please provide the names of the members of the committee and the stakeholder(s)thattheyrepresent.
Yes The EHWP committee was appointed
5. Has the department reviewed its employment policies and practices to ensure that these do not unfairly discriminate against employees on thebasisof theirHIVstatus?Ifso,list the employment policies/prac-tices so reviewed.
Yes HIV Policies are in place, EE Act is also implemented

122
Question Yes No Details, if yes6. Has the department introduced measures to protect HIV-positive employees or those perceived to be HIV-positive from discrimination? Ifso, list the key elements of these measures.
Yes Policies are in place and are implemented. Information sessions are conducted to educate employees
7. Does the department encour-age its employees to undergo Vol-untary Counselling and Testing? Ifso, list the results that you have you achieved.
Yes HTS and HRA campaigns are conducted every six months. The services are brought to the workplace to ensure accessibility to services
8. Has the department developed measures/indicators to monitor &evaluate the impact of its health pro-motionprogramme?Ifso,listthesemeasures/indicators.
Yes DPSA monitors the EHW Programme
3.12 LabourRelations
Table 3.12.1 Collective agreements for the period 1 April 2017 and 31 March 2018
Subjectmatter DateNone
Notes
•Iftherewerenoagreements,keeptheheadingandreplacethetablewiththefollowing:
TotalnumberofCollectiveagreements 0
The following table summarises the outcome of disciplinary hearings conducted within the department for the year under review.
Table 3.12.2 Misconduct and disciplinary hearings finalised for the period 1 April 2017 and 31 March 2018
Outcomes of disciplinary hearings Number % of totalCorrectional counselling 0 0Verbal warning 0 0Written warning 0 0Final written warning 1 50Suspended without pay 1 50Fine 0 0

123
Demotion 0 0
Dismissal 0 0Not guilty 0 0Case withdrawn 0 0Total 2 100
Table 3.12.3 Types of misconduct addressed at disciplinary hearings for the period 1 April 2017 and 31 March 2018
Type of misconduct Number % of totalTheft - -Performing remunerative work 1 4.5Insubordination 20 91Absenteeism 1 4.5TOTAL 22 100
Table 3.12.3.1 Total misconduct cases for the period 1 April 2017 - 31 March 2018
Type of misconduct Numberofcasesoutstanding01
April 2017
Numberofcases added in
2017/18
Numberofcasesfinalisedin
2017/18
NumberofCasesoutstanding31
March 2018Performing remunerative work
1 0 1 0
Insubordination 6 3 1 8Absenteeism 0 1 0 1Fraud 10 0 0 10
TOTAL 17 4 2 19
Table 3.12.4 Grievances lodged for the period 1 April 2017 and 31 March 2018
Grievances Number % of TotalNumber of grievances resolved 34 100Number of grievances not resolved 0 0Totalnumberofgrievanceslodged 34 100
Table 3.12.5 Disputes logged with Councils for the period 1 April 2017 and 31 March 2018
Disputes Number % of TotalNumber of disputes upheld 4 17.4Number of disputes dismissed 19 82.6Totalnumberofdisputeslodged 23 100

124
Table 3.12.6 Strike actions for the period 1 April 2017 and 31 March 2018
Totalnumberofpersonsworkingdayslost 0Totalcostsworkingdayslost 0Amountrecoveredasaresultofnoworknopay(R’000) 0
Table 3.12.7 Precautionary suspensions for the period 1 April 2017 and 31 March 2018
Number of people suspended 8Numberofpeoplewho’ssuspensionexceeded30days 7Averagenumberofdayssuspended 400Cost of suspension(R’000) 4 870

125
3.13 Skillsdevelopment
This section highlights the efforts of the department with regard to skills development.
Table 3.13.1 Training needs identified for the period 1 April 2017 and 31 March 2018
Occupational category
Gender Numberofemployees as at 1 April
2017
TrainingneedsidentifiedatstartofthereportingperiodLearnerships Skills
Programmes&othershort
courses
Other forms oftraining
Total
Legislators, senior officialsandmanagers
Female 44 0 4 0 4Male 79 0 0 0 0
Professionals Female 1 0 0 0 0Male 4 0 0 0 0
Technicians and associate professionals
Female 4 0 1 0 1Male 4 0 0 0 0
Clerks Female 125 0 5 0 5Male 100 0 0 0 0
Service and sales workers
Female 0 0 0 0 0Male 0 0 0 0 0
Skilled agriculture andfisheryworkers
Female 0 0 0 0 0Male 0 0 0 0 0
Craft and related trades workers
Female 0 0 0 0 0Male 0 0 0 0 0
Plant and machine operators and assemblers
Female 0 0 0 0 0Male 0 0 0 0 0
Elementary occupations
Female 87 0 8 0 8Male 194 0 0 0 0
Sub Total Female 261 0 18 0 18Male 381 0 0 0 0
Total 642 0 18 0 18

126
Table 3.13.2 Training provided for the period 1 April 2017 and 31 March 2018
Occupational category
Gender Numberofemployees as at 1 April
2017
TrainingprovidedwithinthereportingperiodLearnerships SkillsProgrammes&
other short coursesOther forms of
trainingTotal
Legislators, senior officialsandmanagers
Female 44 0 3 0 3Male 79 0 0 0 0
Professionals Female 1 0 0 0 0Male 4 0 0 0 0
Technicians and associate professionals
Female 4 0 1 0 1Male 4 0 0 0 0
Clerks Female 125 0 7 0 7Male 100 0 0 0 0
Service and sales workers
Female 0 0 0 0 0Male 0 0 0 0 0
Skilled agriculture andfisheryworkers
Female 0 0 0 0 0Male 0 0 0 0 0
Craft and related trades workers
Female 0 0 0 0 0Male 0 0 0 0 0
Plant and machine operators and assemblers
Female 0 0 0 0 0Male 0 0 0 0 0
Elementary occupations
Female 87 0 6 0 6Male 194 0 0 0 0
Sub Total Female 261 0 0 0 0Male 381 0 0 0 0
Total 642 0 17 0 17
3.14 Injury on duty
Thefollowingtablesprovidebasicinformationoninjuryonduty.
Table 3.14.1 Injury on duty for the period 1 April 2017 and 31 March 2018
Natureofinjuryonduty Number % of totalRequired basic medical attention only 25 3.6Temporary Total Disablement 1 0.14Permanent Disablement 0 0Fatal 0 0Total 26 3.76

127
3.15 Utilisation of Consultants
The following tables relates information on the utilisation of consultants in the department. In terms ofthePublicServiceRegulations“consultant’meansanaturalorjuristicpersonorapartnershipwhoorwhichprovidesintermsofaspecificcontractonanadhocbasisanyofthefollowingprofessional services to a department against remuneration received from any source:
(a) The rendering of expert advice;
(b) Thedraftingofproposalsfortheexecutionofspecifictasks;and
(c) Theexecutionofaspecifictaskwhichisofatechnicalorintellectualnature,but excludes an employee of a department.
- TheDepartmentdidnotappointconsultantsfortheperiodunderreview.
Table 3.15.1 Report on consultant appointments using appropriated funds for the period 1 April 2017 and 31 March 2018
Project title Totalnumberofconsultantsthatworkedonproject
Duration(workdays)
Contract value inRand
None N/A N/A N/A
Totalnumberofprojects
Total individual consultants Total duration
Workdays
Total contract value in Rand
None N/A N/A N/A
Table 3.15.2 Analysis of consultant appointments using appropriated funds, in terms of Historically Disadvantaged Individuals (HDIs) for the period 1 April 2017 and 31 March 2018
Project title PercentageownershipbyHDIgroups
PercentagemanagementbyHDI
groups
NumberofconsultantsfromHDIgroupsthatwork
on the projectNone N/A N/A N/A

128
Table 3.15.3 Report on consultant appointments using Donor funds for the period 1 April 2017 and 31 March 2018
Project title TotalNumberofconsultantsthatworkedonproject
Duration(Workdays)
Donor and contract value in Rand
None N/A N/A N/A
Totalnumberofprojects
Total individual consultants Total durationWorkdays
Total contract value in Rand
None N/A N/A N/A
Table 3.15.4 Analysis of consultant appointments using Donor funds, in terms of Historically Disadvantaged Individuals (HDIs) for the period 1 April 2017 and 31 March 2018
Project title PercentageownershipbyHDIgroups
PercentagemanagementbyHDI
groups
NumberofconsultantsfromHDIgroupsthatworkonthe
projectN/A
3.16 SeverancePackages
Table 3.16.1 Granting of employee initiated severance packages for the period 1 April 2017 and 31 March 2018
Salaryband Numberofapplications received
Numberofapplications referred
to the MPSA
Numberofapplications
supportedbyMPSA
Numberofpackages
approvedbydepartment
Lowerskilled(Levels1-2)
0 0 0 0
SkilledLevels3-5) 0 0 0 0Highly skilled production(Levels6-8)
0 0 0 0
Highly skilled supervision(Levels9-12)
0 0 0 0
Senior management (Levels13-16)
0 0 0 0
Total 0 0 0 0

129
PART E: FINANCIAL INFORMATION

130
Reportoftheauditor-generaltotheFreeStateLegislatureonVoteno.3: Department of Economic, Small Business Development, Tourism and Environmental Affairs
Report on the audit of the financial statements
Qualifiedopinion
1. IhaveauditedthefinancialstatementsoftheDepartmentofEconomic,SmallBusinessDevelopment, Tourism and Environmental Affairs set out on pages 140 to 223, which comprise theappropriationstatement,thestatementoffinancialpositionasat31March2018,thestatementoffinancialperformance,statementofchangesinnetassetsandcashflowstatementfortheyearthenended,aswellasthenotestothefinancialstatements,includingasummaryofsignificantaccountingpolicies.
2. Inmyopinion,exceptforthepossibleeffectsofthemattersdescribedinthebasisforqualifiedopinionsectionofthisauditor’sreport,thefinancialstatementspresentfairly,inallmaterialrespects,thefinancialpositionoftheDepartmentofEconomic,SmallBusinessDevelopment,TourismandEnvironmentalAffairsasat31March2018,anditsfinancialperformanceandcashflowsfortheyearthenendedinaccordancewiththeModifiedCashStandard(MCS)prescribed by the National Treasury and the requirements of the Public Finance Management ActofSouthAfrica,1999(ActNo.1of1999)(PFMA)andtheDivisionofRevenueActofSouthAfrica,2017(ActNo.3of2017)(Dora).
Basisforqualifiedopinion
Goods and services
3. Iwasunabletoobtainsufficientappropriateauditevidenceforexpenditurerelatingtogoodsandservices.Thiswasduetotheunavailabilityofsupportingdocumentationtoconfirmthatthe goods and services for the national tourism career expo incurred in the current year and the micro-enterprises support programme incurred in the prior year had actually been received andcorrectlyaccountedfor.Iwasunabletoconfirmtheexpenditurebyalternativemeans.Consequently,IwasunabletodeterminewhetheranyadjustmentwasnecessarytogoodsandservicesstatedatR115289000(2017:R99610000)innote5tothefinancialstatements.
Operatingleasecommitments
4. The department did not disclose operating lease commitments in accordance with chapter 13, Leases, in the MCS. This was due to incorrect tariffs applied per vehicle by the lessor, Fleet Management Trading Entity, in the calculation of the lease commitments. The department alsodidnotconfirmthetariffswereinlinewiththeapprovedfeestructureandservicelevelagreement with the lessor. I was unable to determine the full extent of the overstatement ofoperatingleasecommitmentsdisclosedinnote22tothefinancialstatementsasitwasimpracticable to do so.

131
Contextfortheopinion
5. IconductedmyauditinaccordancewiththeInternationalStandardsonAuditing(ISAs).My responsibilities under those standards are further described in the auditor-general’s responsibilitiesfortheauditofthefinancialstatementssectionofthisauditor’sreport.
6. I am independent of the department in accordance with the International Ethics Standards Board for Accountants’ Code of ethics for professional accountants(IESBAcode)andtheethicalrequirementsthatarerelevanttomyauditinSouthAfrica.Ihavefulfilledmyotherethical responsibilities in accordance with these requirements and the IESBA code.
7. IbelievethattheauditevidenceIhaveobtainedissufficientandappropriatetoprovideabasisformyqualifiedopinion.
Materialuncertaintyrelatingtogoingconcern
8. Idrawattentiontothematterbelow.Myopinionisnotmodifiedinrespectofthismatter.
9. Note19tothefinancialstatementsindicatesthatthedepartmenthadsignificantcommitmentsof R24 282 000 and outstanding accruals of R5 522 000 as per note 20.1 as at 31 March 2018. As stated in note 19, these events or conditions, indicate that a material uncertainty exists that maycastsignificantdoubtonthedepartment’sabilitytocontinueasagoingconcern.
Emphasis of matters
10. Idrawattentiontothemattersbelow.Myopinionisnotmodifiedinrespectofthesematters.
Irregularexpenditure
11. Asdisclosedinnote24tothefinancialstatements,irregularexpenditureofR20958000(2017:R8303000)wasincurredduetonon-compliancewithsupplychainmanagement(SCM)requirements.Inaddition,thefullextentofirregularexpenditureisstillintheprocessofbeing determined.
Material impairments
12. Asdisclosedinnote23.2tothefinancialstatements,aprovisionforimpairmentof R10863000(2017:R7609000)hasbeenmadewithregardtoaccrueddepartmentalrevenueas a result of possible non-recovery of rental income from a debtor.
Uncertaintyregardingfutureoutcomesoflitigation
13. Asdisclosedinnote18tothefinancialstatements,thedepartmentisthedefendantinvariousclaims against the department. The department is opposing these claims. The ultimate outcome of the matter could not be determined and no provision for any liability that may result wasmadeinthefinancialstatements

132
Restatementofcorrespondingfigures
14. Asdisclosedinnote30tothefinancialstatements,thecorrespondingfiguresfor31March2017wererestatedasaresultofanerrorinthefinancialstatementsofthedepartmentat,andfor the year ended, 31 March 2018.
Other matters
15. Idrawattentiontothemattersbelow.Myopinionisnotmodifiedinrespectofthesematters.
Unaudited supplementary schedules
16. Thesupplementaryinformationsetoutonpages224to231doesnotformpartofthefinancialstatements and is presented as additional information. I have not audited these schedules and, accordingly, I do not express an opinion on thereon.
Service delivery
Small, micro and medium enterprises (SMME) support
17. The department has implemented the following programmes to support small business development,butthefullbenefittothebeneficiarieshasnotyetrealised.
18. The development of the Mangaung SMME hub will accommodate 35 SMMEs without paying rent for three years. The department had incurred expenditure of R3 million through the Free State Development Corporation as at 31 March 2018. The hub was not yet operational at year-end.
19. The department transferred a total of R22 million to the Free State Development Corporation during 2017-18 for SMME support through loans and grants. As at 31 March 2018, R14 million of the amount transferred had not been spent.
Infrastructure development
20. TheprojectfortheupgradeofthetrainbushcamptoprovideaccommodationfacilitiesattheSoetdoeringresort,commencedin2014atabudgetedcostofR30million.Theprojectshouldhave been completed within 20 months but was still in the practical completion stage at the date of this report. Due to budgetary constraints and the need to redirect funds, the scope of workwassignificantlyreduced.Thereductionsincostsshouldhaveresultedinsignificantsavings.TheactualcumulativecostsontheprojectamountedtoR29110574at31March2018,eventhoughthescopeofworkwassignificantlyreduced.However,itwasnotpracticaltodetermineiftheanticipatedsavingswouldberealisedasthefinalpaymentcertificatewaspending from the principal agent. Furthermore, the department has subsequently abandoned an educational hall where construction has not been completed. This hall was not part of the initialprojectplan.Thiscouldresultinlossestothedepartment.
133
Responsibilitiesofaccountingofficerforthefinancialstatements
21. Theaccountingofficerisresponsibleforthepreparationandfairpresentationofthefinancialstatements in accordance with the MCS and the requirements of the PFMA and Dora, and forsuchinternalcontrolastheaccountingofficerdeterminesisnecessarytoenablethepreparationoffinancialstatementsthatarefreefrommaterialmisstatement,whetherduetofraud or error.
22. Inpreparingthefinancialstatements,theaccountingofficerisresponsibleforassessingtheDepartment of Economic, Small Business Development, Tourism and Environmental Affairs’ ability to continue as a going concern, disclosing, as applicable, matters relating to going concern and using the going concern basis of accounting unless there is an intention to liquidate the department or to cease operations, or there is no realistic alternative but to do so.
Auditor-general’sresponsibilitiesfortheauditofthefinancialstatements
23. Myobjectivesaretoobtainreasonableassuranceaboutwhetherthefinancialstatementsasa whole are free from material misstatement, whether due to fraud or error, and to issue an auditor’s report that includes my opinion. Reasonable assurance is a high level of assurance, but is not a guarantee that an audit conducted in accordance with the ISAs will always detect a material misstatement when it exists. Misstatements can arise from fraud or error and are considered material if, individually or in aggregate, they could reasonably be expected to influencetheeconomicdecisionsofuserstakenonthebasisofthesefinancialstatements.
24. Afurtherdescriptionofmyresponsibilitiesfortheauditofthefinancialstatementsisincludedinthe annexure to this auditor’s report.
Report on the audit of the annual performance report
Introduction and scope
25. InaccordancewiththePublicAuditActofSouthAfrica,2004(ActNo.25of2004)(PAA)andthegeneralnoticeissuedintermsthereof,Ihavearesponsibilitytoreportmaterialfindingsonthereportedperformanceinformationagainstpredeterminedobjectivesforselectedprogrammes presented in the annual performance report. I performed procedures to identify findingsbutnottogatherevidencetoexpressassurance.
26. My procedures address the reported performance information, which must be based on the approved performance planning documents of the department. I have not evaluated the completeness and appropriateness of the performance indicators/ measures included in the planning documents. My procedures also did not extend to any disclosures or assertions relating to planned performance strategies and information in respect of future periods that maybeincludedaspartofthereportedperformanceinformation.Accordingly,myfindingsdonot extend to these matters.

134
27. I evaluated the usefulness and reliability of the reported performance information in accordance with the criteria developed from the performance management and reporting framework,asdefinedinthegeneralnotice,forthefollowingselectedprogrammespresentedin the annual performance report of the department for the year ended 31 March 2018:
Programmes Pages in the annual perfor-mance report
Programme 2 – environmental affairs 56 – 63
Programme 3 – economic and small business development 63 – 69
28. I performed procedures to determine whether the reported performance information was properly presented and whether performance was consistent with the approved performance planning documents. I performed further procedures to determine whether the indicators and related targets were measurable and relevant, and assessed the reliability of the reported performance information to determine whether it was valid, accurate and complete.
29. Thematerialfindingsinrespectoftheusefulnessandreliabilityoftheselectedprogrammesare as follows:
Programme2–environmentalaffairs
Number of completed green issues criminal investigations handed to the national prosecuting authority(NPA)forprosecution
30. Iwasunabletoobtainsufficientappropriateauditevidenceforthereportedachievementofthe target number of completed green issues criminal investigations handed to the NPA for prosecution. This was due to limitations placed on the scope of my work as I was unable to distinguish the different categories of investigations included in the report from the NPA. I was unabletoconfirmthereportedachievementbyalternativemeans.Consequently,Iwasunabletodeterminewhetheranyadjustmentswererequiredtotheperformanceachievementof26asreported in the annual performance report.
Various indicators
31. The department did not have an adequate record-keeping system to enable reliable reporting ontheachievementoftheindicatorslistedbelow.Asaresult,Iwasunabletoobtainsufficientappropriate audit evidence in some instances, while in other cases the supporting evidence provided did not agree to the reported achievements. Based on the supporting evidence that was provided, the achievement of these indicators was different to the reported achievement in theannualperformancereport.Iwasalsounabletofurtherconfirmthereportedachievementsby alternative means. Consequently, I was unable to determine whether any further adjustmentswererequiredtothereportedachievementsoftheindicatorslistedbelow:

135
Indicator Reported achievement
Number of compliance inspections conducted for green issues 800
Number of environmental awareness activities conducted (community) 69
Number of environmental capacity building activities conducted through workshops and informal training conducted
38
Programme3–economicandsmallbusinessdevelopment
Various indicators
32. The department did not have an adequate record-keeping system to enable reliable reporting onachievementoftheindicatorslistedbelow.Asaresult,Iwasunabletoobtainsufficientappropriate audit evidence in some instances, while in other cases the supporting evidence provided did not agree to the reported achievements. Based on the supporting evidence that was provided, the achievement of these indicators was different to the reported achievement in theannualperformancereport.Iwasalsounabletofurtherconfirmthereportedachievementsby alternative means. Consequently, I was unable to determine whether any further adjustmentswererequiredtothereportedachievementsoftheindicatorslistedbelow:
Indicator Reported achievement
Audited value
Number of enterprises assisted with access to markets 31 24
Number of enterprises developed and supported 649 745
Other matters
33. I draw attention to the matters below.
Achievementofplannedtargets
34. Refer to the annual performance report on pages 43 to 73 for information on the achievement of planned targets for the year and explanations provided for the under and over achievement ofasignificantnumberoftargets.Thisinformationshouldbeconsideredinthecontextofthematerialfindingsonthereliabilityofthereportedperformanceinformationinparagraphs30to32 of this report.
Adjustment of material misstatements
35. Iidentifiedmaterialmisstatementsintheannualperformancereportsubmittedforauditing.These material misstatements were on the reported performance information of programme 2: environmental affairs and programme 3: economic and small business development. As management subsequently corrected only some of the misstatements, I raised material findingsonthereliabilityofthereportedperformanceinformation.Thosethatwerenotcorrected are reported above.

136
Report on the audit of compliance with legislation
Introduction and scope36. In accordance with the PAA and the general notice issued in terms thereof, I have a
responsibilitytoreportmaterialfindingsonthecomplianceofthedepartmentwithspecificmattersinkeylegislation.Iperformedprocedurestoidentifyfindingsbutnottogatherevidenceto express assurance.
37. Thematerialfindingsoncompliancewithspecificmattersinkeylegislationsareasfollows:
Annualfinancialstatements
38. Thefinancialstatementssubmittedforauditingwerenotpreparedinaccordancewiththeprescribedfinancialreportingframeworkandsupportedbyfullandproperrecordsasrequiredbysection40(1)(a)and(b)ofthePFMA.Materialmisstatementsofexpenditure,payablesanddisclosurenoteswereidentifiedbytheauditorsinthesubmittedfinancialstatementswerecorrected, but the uncorrected material misstatements and supporting records that could not beprovidedresultedinthefinancialstatementsreceivingaqualifiedopinion.
Strategicplanningandperformancemanagement
39. Specificinformationsystemswerenotestablishedtoenablethemonitoringofprogressmadetowardsachievingtargets,coreobjectivesandservicedeliveryasrequiredbypublicserviceregulation25(1)(e)(i)and(iii).
Expendituremanagement
40. Effective and appropriate steps were not taken to prevent irregular expenditure, as required bysection38(1)(c)(ii)ofthePFMAandtreasuryregulation9.1.1.Thevalue,asdisclosedinnote24tothefinancialstatements,isnotcompleteasmanagementwasstillintheprocessofquantifyingthefullextentoftheirregularexpenditure.Themajorityoftheirregularexpendituredisclosedinthefinancialstatementswascausedbynon-compliancewithSCMrequirements.
Procurementandcontractmanagement
41. Some of the goods and services with a transaction value below R500 000 were procured without obtaining the required price quotations, as required by treasury regulation 16A6.1. Similar non-compliance was also reported in the prior year.
42. Invitations for competitive bidding were not advertised for a required minimum period, as requiredbytreasuryregulations16A6.3(c).
Consequencemanagement
43. Iwasunabletoobtainsufficientappropriateauditevidencethatdisciplinarystepsweretakenagainstofficialswhohadincurredirregularexpenditureasrequiredbysection38(1)(h)(iii)ofthe PFMA. This was due to proper and complete records that were not maintained as evidence to support the investigations into irregular expenditure.

137
Other information
44. Theaccountingofficerisresponsiblefortheotherinformation.Theotherinformationcomprisesthe information included in the annual report. The other information does not include the financialstatements,theauditor’sreportandthoseselectedprogrammespresentedintheannualperformancereportthathavebeenspecificallyreportedinthisauditor’sreport.
45. Myopiniononthefinancialstatementsandfindingsonthereportedperformanceinformationand compliance with legislation do not cover the other information and I do not express an audit opinion or any form of assurance conclusion thereon.
46. In connection with my audit, my responsibility is to read the other information and, in doing so, considerwhethertheotherinformationismateriallyinconsistentwiththefinancialstatementsand the selected programmes presented in the annual performance report, or my knowledge obtained in the audit, or otherwise appears to be materially misstated.
47. I did not receive the other information prior to the date of this auditor’s report. After I receive and read this information, and if I conclude that there is a material misstatement, I am required to communicate the matter to those charged with governance and request that the other information be corrected. If the other information is not corrected, I may have to retract this auditor’s report and re-issue an amended report as appropriate. However, if it is corrected this will not be necessary.
Internal control deficiencies
48. Iconsideredinternalcontrolrelevanttomyauditofthefinancialstatements,reportedperformanceinformationandcompliancewithapplicablelegislation;however,myobjectivewas not to express any form of assurance on it. The matters reported below are limited to thesignificantinternalcontroldeficienciesthatresultedinthebasisforthequalifiedopinion,thefindingsontheannualperformancereportandthefindingsoncompliancewithlegislationincluded in this report.
49. The leadership of the department did not implement adequate oversight over the implementation of internal controls and action plans to address material misstatements reportedintheprioryear.Thisresultedinsimilarfindingsbeingreportedinthecurrentyear.Thiswasmainlyduetoslowresponsebyleadershipasdeficienciesinthedesignandimplementationofactionsplanswerenottimelyidentifiedandaddressed.Furthermore,thedepartment has seen a high turnover in senior managerial positions.
50. The department changed premises during the period under review. However, the new premises did not have access to the transversal information systems of BAS, Persal and Logis and internet connections for an extended period of time. Daily and monthly disciplines involving transversal systems could not be performed. In addition, key communications that required internet connections could not be performed.
51. Senior management did not provide adequate supervisory and monitoring controls over financialandperformancereportingandcompliancewithlegislation.Thiswasmainlyduetoalackofconsequencesasnoactionistakenfornon-complianceandincorrectfinancialandperformance reporting. In addition, management applied an incorrect interpretation of the accountingstandardstorecordexpenditureforSMMEsupportdespitesimilarfindingsraisedin the prior year.

138
52. Management did not implement appropriate risk management strategies to identify, prevent and mitigate current and emerging risks faced by the department. This was mainly due to slow responsebymanagementasmajorriskshavenotbeenmitigated.
Other reports
53. I draw attention to the following engagements conducted by various parties that had, or could have,animpactonthemattersreportedinthedepartment’sfinancialstatements,reportedperformance information, compliance with applicable legislation and other related matters. Thesereportsdidnotformpartofmyopiniononthefinancialstatementsormyfindingsonthereported performance information or compliance with legislation.
54. Management was conducting an investigation of possible abuse of travel and subsistence claims by departmental staff. The investigation started in 2015 and was ongoing at the reporting date.
Bloemfontein
31 July 2018

139
Annexure – Auditor-general’s responsibility for the audit1. AspartofanauditinaccordancewiththeISAs,Iexerciseprofessionaljudgementand
maintainprofessionalscepticismthroughoutmyauditofthefinancialstatements,andtheprocedures performed on reported performance information for selected programmes and on thedepartment’scompliancewithrespecttotheselectedsubjectmatters.
Financial statements2. Inadditiontomyresponsibilityfortheauditofthefinancialstatementsasdescribedinthis
auditor’s report, I also:
• identifyandassesstherisksofmaterialmisstatementofthefinancialstatementswhetherdue to fraud or error, design and perform audit procedures responsive to those risks, and obtainauditevidencethatissufficientandappropriatetoprovideabasisformyopinion.The risk of not detecting a material misstatement resulting from fraud is higher than for one resulting from error, as fraud may involve collusion, forgery, intentional omissions, misrepresentations, or the override of internal control
• obtainanunderstandingofinternalcontrolrelevanttotheauditinordertodesignauditprocedures that are appropriate in the circumstances, but not for the purpose of expressing an opinion on the effectiveness of the department’s internal control
• evaluatetheappropriatenessofaccountingpoliciesusedandthereasonablenessofaccountingestimatesandrelateddisclosuresmadebytheaccountingofficer
• concludeontheappropriatenessoftheaccountingofficer’suseofthegoingconcernbasisofaccountinginthepreparationofthefinancialstatements.Ialsoconclude,basedon the audit evidence obtained, whether a material uncertainty exists related to events or conditionsthatmaycastsignificantdoubtontheDepartmentofEconomic,SmallBusinessDevelopment, Tourism and Environmental Affairs’ ability to continue as a going concern. If I conclude that a material uncertainty exists, I am required to draw attention in my auditor’s reporttotherelateddisclosuresinthefinancialstatementsaboutthematerialuncertaintyor,ifsuchdisclosuresareinadequate,tomodifytheopiniononthefinancialstatements.My conclusions are based on the information available to me at the date of this auditor’s report. However, future events or conditions may cause a department to cease continuing as a going concern
• evaluatetheoverallpresentation,structureandcontentofthefinancialstatements,includingthedisclosures,andwhetherthefinancialstatementsrepresenttheunderlyingtransactions and events in a manner that achieves fair presentation
Communicationwiththosechargedwithgovernance3. Icommunicatewiththeaccountingofficerregarding,amongothermatters,theplannedscope
andtimingoftheauditandsignificantauditfindings,includinganysignificantdeficienciesininternal control that I identify during my audit.
4. IalsoconfirmtotheaccountingofficerthatIhavecompliedwithrelevantethicalrequirementsregarding independence, and communicate all relationships and other matters that may reasonably be thought to have a bearing on my independence and, where applicable, related safeguards.

140
ANNUAL FINANCIAL STATEMENTSFOR DEPARTMENT OF ECONOMIC,SMALL BUSINESS DEVELOPMENT,TOURISM AND ENVIRONMENTAFFAIRS
For the year ended31 March 2018

141
DEPARTMENT OF ECONOMIC, SMALL BUSINESS DEVELOPMENT, TOURISM AND
ENVIRONMENTAL AFFAIRS
VOTE 3
ANNUAL FINANCIAL STATEMENTS
for the year ended 31 March 2018
- 2 -
Table of Contents
Appropriation Statement 142
Notes to the Appropriation Statement 174
Statement of Financial Performance 176
Statement of Financial Position 177
Statement of Changes in Net Assets 178
Cash Flow Statement 179
Notes to the Annual Financial Statements (including Accounting policies) 180
Annexures 224

142
DE
PA
RT
ME
NT
OF
EC
ON
OM
IC,
SM
AL
L B
US
INE
SS
DE
VE
LO
PM
EN
T,
TO
UR
ISM
AN
D E
NV
IRO
NM
EN
TA
L A
FF
AIR
S
VO
TE
3
AP
PR
OP
RIA
TIO
N S
TA
TE
ME
NT
for
the
ye
ar
en
de
d 3
1 M
arc
h 2
01
8
3
Ap
pro
pri
ati
on
per
pro
gra
mm
e
20
17
/18
20
16/1
7
Ad
jus
ted
Ap
pro
pri
ati
on
Sh
ifti
ng
of
Fu
nd
s
Vir
em
en
t F
inal
Ap
pro
pri
ati
on
Ac
tua
l
Ex
pe
nd
itu
re
Va
ria
nc
e
Ex
pe
nd
itu
re
as
% o
f
fin
al
ap
pro
pri
ati
on
Fin
al
Ap
pro
pri
ati
on
Ac
tual
Ex
pe
nd
itu
re
R
'00
0
R'0
00
R
'00
0
R'0
00
R
'00
0
R'0
00
%
R'0
00
R'0
00
Pro
gra
mm
e
1.
AD
MIN
IST
RA
TIO
N
13
9 9
99
- 1
10
0
14
1 0
99
14
1 0
56
43
10
0.0
%
136
43
9
13
4 7
44
2.
EN
VIR
ON
ME
NT
AL
AF
FA
IRS
14
0 6
33
- (3
94
2)
13
6 6
91
13
7 8
58
(1 1
67
) 1
0.9
%
146
44
2
13
9 4
88
3.
EC
ON
OM
IC
D
EV
EL
OP
ME
NT
21
5 1
85
- 2
98
2
21
8 1
67
20
1 0
75
17
092
92
.2%
114
37
8
11
3 3
53
4.
TO
UR
ISM
9
33
1
- (1
40
) 9
19
1
8 9
37
25
4
97
.2%
77
737
75
491
TO
TA
L
50
5 1
48
- -
50
5 1
48
48
8 9
26
16
222
96
.8%
4
74
99
6
46
3 0
76
2
017
/18
20
16
/17
F
ina
l
Ap
pro
pri
ati
on
R’0
00
Ac
tua
l
Ex
pe
nd
itu
re
R’0
00
Fin
al
Ap
pro
pri
ati
on
R’0
00
Ac
tua
l
Ex
pen
dit
ure
R’0
00
TO
TA
L (
bro
ug
ht
forw
ard
)
Re
co
nc
ilia
tio
n w
ith
sta
tem
en
t o
f fi
nan
cia
l p
erf
orm
an
ce
Ac
tua
l a
mo
un
ts p
er
sta
tem
en
t o
f fi
nan
cia
l p
erf
orm
an
ce
(to
tal
reve
nu
e)
505
14
8
4
74
99
6
AD
D
Aid
assis
tan
ce
5
1
4
03
Ac
tua
l am
ou
nts
p
er
sta
tem
en
t o
f fi
na
nc
ial
pe
rfo
rma
nc
e
(to
tal
ex
pe
nd
itu
re)
4
88
97
7
4
63
47
9

143
DE
PA
RT
ME
NT
OF
EC
ON
OM
IC,
SM
AL
L B
US
INE
SS
DE
VE
LO
PM
EN
T,
TO
UR
ISM
AN
D E
NV
IRO
NM
EN
TA
L A
FF
AIR
S
VO
TE
3
AP
PR
OP
RIA
TIO
N S
TA
TE
ME
NT
for
the
ye
ar
en
de
d 3
1 M
arc
h 2
01
8
4
Ap
pro
pri
ati
on
pe
r e
co
no
mic
cla
ssif
icati
on
201
7/1
8
201
6/1
7
A
dju
ste
d
Ap
pro
pri
ati
on
S
hif
tin
g o
f F
un
ds
Vir
em
en
t F
ina
l A
pp
rop
ria
tio
n
Ac
tua
l E
xp
en
dit
ure
V
ari
an
ce
Ex
pe
nd
itu
re
as
% o
f fi
na
l a
pp
rop
ria
tio
n
Fin
al
Ap
pro
pri
ati
on
A
ctu
al
exp
en
dit
ure
R
'00
0
R'0
00
R
'00
0
R'0
00
R
'00
0
R'0
00
%
R
'00
0
R'0
00
Cu
rre
nt
pa
ym
en
ts
347
435
3
147
(5 1
00)
345
482
350
538
(5
056
) 10
1.5%
32
3 43
4
318
540
Co
mp
en
sa
tio
n o
f e
mp
loye
es
232
665
(2
00)
- 23
2 46
5
235
249
(2
787
) 10
1.2%
2
19 7
57
218
930
S
ala
rie
s a
nd
wag
es
212
048
(1
00)
- 21
1 94
8
201
362
10
586
95
.0%
1
91 7
91
187
937
S
ocia
l co
ntr
ibu
tio
ns
2
0 61
7
(100
) -
20 5
17
3
3 88
7
(13
373)
16
5.2%
27
966
30
993
Go
od
s a
nd
se
rvic
es
11
4 77
0
3 34
7 (5
100
) 11
3,01
7
11
5 28
9
(2 2
69)
102.
0%
103
677
9
9 61
0
Ad
min
istr
ative
fe
es
4
57
(213
) (1
0)
234
2
82
(48)
12
0.5%
409
342
Ad
ve
rtis
ing
3 88
1
847
603
5 33
1
5
376
(4
5)
100.
8%
4
501
4
004
M
ino
r a
sse
ts
2
714
(8
66)
(150
) 1
698
7
49
914
45.0
%
1 28
7
3
11
Au
dit c
osts
: E
xtern
al
4
300
1
631
465
6 39
6
6
467
(3
6)
100.
6%
5 20
3
5 14
6
Bu
rsa
rie
s: E
mp
loye
es
4
05
32
- 43
7
410
27
93
.8%
127
211
C
ate
rin
g:
De
pa
rtm
en
tal
activitie
s
4 10
5
1 25
8 (6
0)
5 30
3
5 0
14
289
94.6
%
3 57
4
2 60
3
Co
mm
un
ica
tio
n (
G&
S)
4 39
4
155
- 4
549
4
263
28
6 93
.7%
4
435
5
513
C
om
pu
ter
se
rvic
es
2 99
7
(770
) -
2 22
7
1
340
88
7 60
.2%
2
066
1
575
C
on
su
ltan
ts:
Busin
ess a
nd
a
dvis
ory
se
rvic
es
1
6 39
1
(6 9
18)
(3 7
03)
5 77
0
5 5
33
237
95.9
%
12 1
85
1
1 81
1
Le
ga
l se
rvic
es
680
(2
50)
(15)
41
5
333
82
80
.2%
484
484
Co
ntr
acto
rs
7 6
65
2 47
1 (4
0)
10 0
96
8 1
29
1 96
7 80
.5%
8
161
6
232
A
ge
ncy
an
d s
up
po
rt /
ou
tsou
rce
d s
erv
ices
2 3
36
7 94
3 -
10 2
79
13
093
(2
814
) 12
7.4%
13
11
8
1
2 6
31

144
DE
PA
RT
ME
NT
OF
EC
ON
OM
IC,
SM
AL
L B
US
INE
SS
DE
VE
LO
PM
EN
T,
TO
UR
ISM
AN
D E
NV
IRO
NM
EN
TA
L A
FF
AIR
S
VO
TE
3
AP
PR
OP
RIA
TIO
N S
TA
TE
ME
NT
for
the
ye
ar
en
de
d 3
1 M
arc
h 2
01
8
5
Ap
pro
pri
ati
on
pe
r e
co
no
mic
cla
ssif
icati
on
201
7/1
8
201
6/1
7
A
dju
ste
d
Ap
pro
pri
ati
on
S
hif
tin
g o
f F
un
ds
Vir
em
en
t F
ina
l A
pp
rop
ria
tio
n
Ac
tua
l E
xp
en
dit
ure
V
ari
an
ce
Ex
pe
nd
itu
re
as
% o
f fi
na
l a
pp
rop
ria
tio
n
Fin
al
Ap
pro
pri
ati
on
A
ctu
al
exp
en
dit
ure
R
'00
0
R'0
00
R
'00
0
R'0
00
R
'00
0
R'0
00
%
R
'00
0
R'0
00
Ente
rtain
me
nt
10
9 -
19
14
5
73.7
%
1
1
Fle
et
se
rvic
es (
inclu
din
g
go
ve
rnm
en
t m
oto
r t
ransp
ort
)
11
300
20
0 95
0 12
450
12 5
38
(88)
10
0.7%
6
904
8
355
In
ven
tory
: C
loth
ing
ma
teria
l a
nd
acce
sso
rie
s
-
- -
-
-
-
0.0%
537
-
In
ven
tory
: F
arm
ing
su
pp
lies
-
- -
-
-
-
0.0%
338
-
In
ven
tory
: F
ue
l, o
il a
nd
ga
s
-
- -
-
-
-
0.0%
393
-
In
ven
tory
: M
ate
ria
ls a
nd
su
pp
lies
-
- -
-
-
-
0.0%
1
453
-
Co
nsu
ma
ble
su
pp
lies
6 4
34
375
(70)
6
739
5
875
86
4 87
.2%
6
061
5
034
C
on
su
ma
ble
: S
tation
ery
, p
rin
ting
an
d o
ffic
e s
up
plie
s
4 9
90
(870
) (5
0)
4 07
0
3
237
83
3 79
.5%
4
451
3
694
Op
era
tin
g le
ases
7 3
00
33
1 90
0 9
233
12
933
(3
,733
) 14
0.6%
10
714
13
036
Pro
pe
rty
pa
ym
en
ts
11 5
11
2 26
5 (4
050
) 9
726
1
0 02
1
(295
) 10
3.0%
96
36
Tra
ve
l a
nd s
ub
sis
tence
16
645
(3
,539
) (1
90)
12 9
16
14
877
(1
961
) 11
5.2%
11
552
14
037
T
rain
ing
an
d d
eve
lop
men
t
3
251
(3
15)
(170
) 2
766
2
532
23
4 91
.5%
2
814
2
316
O
pe
ratin
g p
aym
ents
1
483
(7
12)
- 77
1
863
(9
2)
111.
9%
8
43
1 11
4
Ven
ues a
nd
facili
tie
s
9
36
65
- 1,
001
8
86
115
88.5
%
1 93
0
1 10
0
Re
nta
l an
d h
irin
g
5
85
549
(510
) 62
4
521
10
3 83
.5%
40
24
Tra
nsfe
rs a
nd
su
bs
idie
s
147
115
(6
465
) 6
985
147
635
1
28 9
06
18 7
29
87.3
%
128
974
12
8 67
7
Pro
vin
ces a
nd
mu
nic
ipa
litie
s
-
- -
-
-
-
0.0%
230
149
M
un
icip
alit
ies
-
- -
-
-
-
0.0%
230
149

145
DE
PA
RT
ME
NT
OF
EC
ON
OM
IC,
SM
AL
L B
US
INE
SS
DE
VE
LO
PM
EN
T,
TO
UR
ISM
AN
D E
NV
IRO
NM
EN
TA
L A
FF
AIR
S
VO
TE
3
AP
PR
OP
RIA
TIO
N S
TA
TE
ME
NT
for
the
ye
ar
en
de
d 3
1 M
arc
h 2
01
8
6
Ap
pro
pri
ati
on
pe
r e
co
no
mic
cla
ssif
icati
on
201
7/1
8
201
6/1
7
A
dju
ste
d
Ap
pro
pri
ati
on
S
hif
tin
g o
f F
un
ds
Vir
em
en
t F
ina
l A
pp
rop
ria
tio
n
Ac
tua
l E
xp
en
dit
ure
V
ari
an
ce
Ex
pe
nd
itu
re
as
% o
f fi
na
l a
pp
rop
ria
tio
n
Fin
al
Ap
pro
pri
ati
on
A
ctu
al
exp
en
dit
ure
R
'00
0
R'0
00
R
'00
0
R'0
00
R
'00
0
R'0
00
%
R
'00
0
R'0
00
Mu
nic
ipa
l a
ge
ncie
s a
nd
fu
nds
-
- -
-
-
-
0.0%
230
149
D
ep
art
me
nta
l a
ge
ncie
s a
nd
acco
unts
10
9 75
5
(3 8
30)
7 00
0 11
2 92
5
1
12 8
09
116
99.9
%
117
269
1
17 1
34
De
pa
rtm
en
tal a
ge
ncie
s (
non
-b
usin
ess e
ntitie
s)
109
755
(3
830
) 7
000
112
925
112
809
11
6 99
.9%
1
17 2
69
117
134
P
ub
lic c
orp
ora
tio
ns a
nd
p
riva
te e
nte
rprises
35 2
60
(3 0
00)
- 32
260
14
465
17
795
44
.8%
10
200
10
200
P
ub
lic c
orp
ora
tio
ns
3
5 26
0
(3 0
00)
- 32
260
1
4 46
5
17 7
95
44.8
%
1
0 20
0
1
0 20
0
Oth
er
tra
nsfe
rs to p
ublic
co
rpo
ratio
ns
3
5 26
0
(3 0
00)
- 32
260
1
4 46
5
17 7
95
44.8
%
1
0 20
0
1
0 20
0
Ho
use
ho
lds
2
100
36
5 (1
5)
2 45
0
1 6
32
818
66.6
%
1 27
5
1 19
4
Socia
l b
en
efits
80
-
360
440
5
93
(153
) 13
4.8%
975
634
O
the
r tr
ansfe
rs to h
ouse
ho
lds
2 02
0
365
(375
) 2
010
1 0
39
971
51.7
%
3
00
5
60
Pa
ym
en
ts f
or
ca
pit
al a
sse
ts
10
598
3
303
(1 9
00)
12 0
01
9 44
1
2 56
0 78
.7%
22 1
77
15
452
B
uild
ing
s a
nd
oth
er
fixe
d
str
uctu
res
5 40
5
- (1
700
) 3
705
3 89
2
(187
) 10
5.0%
18
275
13
124
B
uild
ing
s
1 70
0
- (1
450
) 25
0
847
(5
97)
338.
8%
-
-
Oth
er
fixe
d s
tru
ctu
res
3 70
5
- (2
50)
3 45
5
3
045
41
0 88
.1%
18
275
13
124
M
ach
ine
ry a
nd
eq
uip
me
nt
4 84
8
3 30
3 (2
00)
7 95
1
5
549
2
402
69.8
%
3 8
86
2 32
8
Tra
nsp
ort
eq
uip
me
nt
-
40
- 40
-
40
0.
0%
-
-
Oth
er
ma
chin
ery
an
d
eq
uip
me
nt
4
848
3
263
(200
) 7
911
5 54
9
2 36
2 70
.1%
3
886
2
328
S
oft
wa
re a
nd
oth
er
inta
ng
ible
a
sse
ts
3
45
- -
345
-
345
0.0%
16
-
P
aym
en
t fo
r fi
na
nc
ial a
sse
ts
-
15
15
30
41
(1
1)
136.
7%
411
40
7
TO
TA
L
505
148
-
-
50
5 14
8
488
926
16 2
22
96.8
%
474
996
46
3 07
6

146
DE
PA
RT
ME
NT
OF
EC
ON
OM
IC,
SM
AL
L B
US
INE
SS
DE
VE
LO
PM
EN
T,
TO
UR
ISM
AN
D E
NV
IRO
NM
EN
TA
L A
FF
AIR
S
VO
TE
3
AP
PR
OP
RIA
TIO
N S
TA
TE
ME
NT
for
the
ye
ar
en
de
d 3
1 M
arc
h 2
01
8
7
Pro
gra
mm
e 1
: A
DM
INIT
RA
TIO
N
20
17
/18
20
16
/17
A
dju
ste
d
Ap
pro
pri
ati
on
S
hif
tin
g o
f F
un
ds
Vir
em
en
t F
ina
l A
pp
rop
ria
tio
n
Ac
tual
Ex
pe
nd
itu
re
Va
ria
nc
e
Ex
pe
nd
itu
re
as
% o
f fi
na
l a
pp
rop
ria
tio
n
Fin
al
Ap
pro
pri
ati
on
A
ctu
al
ex
pe
nd
itu
re
R
'00
0
R'0
00
R
'00
0
R'0
00
R
'00
0
R'0
00
%
R'0
00
R
'00
0
Su
b p
rog
ram
me
1.
OF
FIC
E O
F T
HE
ME
C
11
856
(
27
7)
-
11
579
1
0 0
67
1 5
12
86
.9%
8
09
7
7 9
36
2.
MA
NA
GE
ME
NT
SE
RV
ICE
S
26
548
1
74
2
50
2
6 9
72
2
7 4
24
(4
52
) 1
01
.7%
2
5 6
90
25
333
3.
FIN
AN
CIA
L M
AN
AG
EM
EN
T
63
636
1
88
3
85
0
66
369
7
0 4
82
(4
11
3)
10
6.2
%
62
924
62
648
4.
CO
RP
OR
AT
E S
ER
VIC
ES
3
7 9
59
(
1 7
80)
-
36
179
3
3 0
83
3 0
96
91
.4%
3
9 7
28
38
827
To
tal
for
su
b p
rog
ram
mes
13
9 9
99
-
1
10
0
14
1 0
99
1
41
05
6
43
10
0.0
%
13
6 4
39
13
4 7
44
Cu
rre
nt
pa
ym
en
ts
13
7 1
20
(1
83
1)
85
0
1
36
13
9
13
7 7
37
(1
59
8)
1
01
.2%
13
4 8
06
13
3 4
15
Co
mp
en
sa
tio
n o
f e
mp
loye
es
83
316
(20
0)
(
2 5
00)
80
61
6
80
558
58
9
9.9
%
8
7 5
85
86
967
Sa
larie
s a
nd
wag
es
73
557
(10
0)
(2 5
00)
70 9
57
7
3 4
21
(2
46
4)
1
03
.5%
7
6 9
52
7
5 2
17
So
cia
l co
ntr
ibu
tio
ns
9 7
59
(10
0)
-
9
65
9
7 1
37
2
522
7
3.9
%
1
0 6
33
1
1 7
50
Go
od
s a
nd
se
rvic
es
53
80
4
(1
63
1)
3 3
50
55
523
5
7 1
79
(1
656
)
10
3.0
%
4
7 2
21
4
6 4
48
Ad
min
istr
ative
fe
es
2
40
(90
) -
1
50
20
0
(50
)
13
3.3
%
2
00
14
2
Ad
ve
rtis
ing
3 5
46
17
2
-
3
718
3
67
1
47
9
8.7
%
2
097
1
906
Min
or
asse
ts
9
07
(13
2)
-
7
75
54
3
23
2
7
0.1
%
3
24
12
7
Au
dit c
osts
: E
xtern
al
4
30
0
1 6
26
50
0
6
42
6
6
42
6
-
10
0.0
%
5
203
5 1
46
Bu
rsa
rie
s: E
mp
loye
es
4
05
32
-
4
37
41
0
27
9
3.8
%
1
27
21
1

147
DE
PA
RT
ME
NT
OF
EC
ON
OM
IC,
SM
AL
L B
US
INE
SS
DE
VE
LO
PM
EN
T,
TO
UR
ISM
AN
D E
NV
IRO
NM
EN
TA
L A
FF
AIR
S
VO
TE
3
AP
PR
OP
RIA
TIO
N S
TA
TE
ME
NT
for
the
ye
ar
en
de
d 3
1 M
arc
h 2
01
8
8
Pro
gra
mm
e 1
: A
DM
INIT
RA
TIO
N
20
17
/18
20
16
/17
A
dju
ste
d
Ap
pro
pri
ati
on
S
hif
tin
g o
f F
un
ds
Vir
em
en
t F
ina
l A
pp
rop
ria
tio
n
Ac
tual
Ex
pe
nd
itu
re
Va
ria
nc
e
Ex
pe
nd
itu
re
as
% o
f fi
na
l a
pp
rop
ria
tio
n
Fin
al
Ap
pro
pri
ati
on
A
ctu
al
ex
pe
nd
itu
re
R
'00
0
R'0
00
R
'00
0
R'0
00
R
'00
0
R'0
00
%
R'0
00
R
'00
0
Ca
tering
: D
epa
rtm
en
tal activitie
s
1
86
1
31
1
-
2 1
72
2 0
94
78
9
6.4
%
1 7
65
1 0
75
Co
mm
un
ica
tio
n (
G&
S)
3 4
14
26
4
-
3 6
78
3
41
3
26
5
9
2.8
%
3
02
3
4 3
84
Co
mp
ute
r se
rvic
es
2 9
95
(77
0)
-
2 2
25
1
32
6
89
9
5
9.6
%
1
27
7
1 2
18
C
on
su
lta
nts
: B
usin
ess a
nd
a
dvis
ory
se
rvic
es
5
23
(14
)
-
5
09
32
6
18
3
6
4.0
%
2
30
21
0
Le
ga
l se
rvic
es
6
60
(25
0)
-
4
10
32
9
81
8
0.2
%
4
84
48
4
Co
ntr
acto
rs
2
861
(15
9)
-
2 7
02
2 5
94
10
8
9
6.0
%
1
52
4
28
3
Age
ncy
an
d s
uppo
rt /
ou
tsou
rce
d
se
rvic
es
-
-
-
-
-
-
-
1
12
1
07
Fle
et
se
rvic
es (
inclu
din
g
go
vern
me
nt
mo
tor
tra
nspo
rt)
1
1 3
00
20
0
95
0
12
450
12
538
(88
)
10
0.7
%
6 9
04
8
35
5
Co
nsu
ma
ble
su
pp
lies
1 4
79
(18
9)
-
1 2
90
91
3
37
7
7
0.8
%
2
76
8
1
14
2
Co
nsu
ma
ble
: S
tatio
ne
ry, p
rin
tin
g
an
d o
ffic
e s
up
plie
s
2 6
62
(
48
1)
-
2 1
81
1 7
36
44
4
79
.6%
2 7
42
2 1
87
Op
era
tin
g le
ases
7 3
00
-
1 9
00
9 2
00
12
933
(3
70
0)
1
40
.1%
10
694
12
954
Pro
pert
y p
aym
en
ts
1
05
(45
)
-
60
70
2
(64
2)
1
17
0.0
%
80
28
Tra
ve
l a
nd
su
bsis
ten
ce
6
15
0
(1 4
54
)
-
4 6
96
4 5
22
17
4
9
6.3
%
5 2
09
4
52
4
Tra
inin
g a
nd
de
ve
lop
me
nt
2 4
59
(71
9)
-
1 7
40
1
85
5
(11
5)
1
06
.6%
2
08
6
1 7
71
Op
era
tin
g p
aym
ents
4
06
(89
)
-
3
17
30
5
1
2
9
6.2
%
2
49
1
46
Ven
ues a
nd
facili
tie
s
2
11
(17
4)
-
37
30
7
8
1.1
%
1
23
48

148
DE
PA
RT
ME
NT
OF
EC
ON
OM
IC,
SM
AL
L B
US
INE
SS
DE
VE
LO
PM
EN
T,
TO
UR
ISM
AN
D E
NV
IRO
NM
EN
TA
L A
FF
AIR
S
VO
TE
3
AP
PR
OP
RIA
TIO
N S
TA
TE
ME
NT
for
the
ye
ar
en
de
d 3
1 M
arc
h 2
01
8
9
Pro
gra
mm
e 1
: A
DM
INIT
RA
TIO
N
20
17
/18
20
16
/17
A
dju
ste
d
Ap
pro
pri
ati
on
S
hif
tin
g o
f F
un
ds
Vir
em
en
t F
ina
l A
pp
rop
ria
tio
n
Ac
tual
Ex
pe
nd
itu
re
Va
ria
nc
e
Ex
pe
nd
itu
re
as
% o
f fi
na
l a
pp
rop
ria
tio
n
Fin
al
Ap
pro
pri
ati
on
A
ctu
al
ex
pe
nd
itu
re
R
'00
0
R'0
00
R
'00
0
R'0
00
R
'00
0
R'0
00
%
R'0
00
R
'00
0
Re
nta
l a
nd
hirin
g
20
29
7
-
3
17
31
2
5
9
8.4
%
-
-
Tra
nsfe
rs a
nd
su
bs
idie
s
1
94
-
25
0
4
44
41
4
30
9
3.2
%
3
10
30
4
De
pa
rtm
en
tal a
ge
ncie
s a
nd
a
cco
un
ts
4
-
-
4
-
4
-
4
-
D
ep
art
me
nta
l a
ge
ncie
s (
non
-b
usin
ess e
ntitie
s)
4
-
-
4
-
4
-
4
-
Ho
use
ho
lds
1
90
-
25
0
4
40
41
4
26
9
4.1
%
3
06
30
4
So
cia
l b
enefits
-
-
25
0
2
50
22
4
26
8
9.6
%
2
06
20
4
Oth
er
tra
nsfe
rs t
o h
ouse
ho
lds
1
90
-
-
1
90
1
90
-
1
00
.0%
1
00
1
00
Pa
ym
en
ts f
or
ca
pit
al a
sse
ts
2
68
5
1
83
1
-
4 5
16
2
88
6
1
63
0
6
3.9
%
1 2
64
96
7
Bu
ildin
gs a
nd
oth
er
fixe
d
str
uctu
res
-
-
-
-
-
-
-
-
-
Ma
ch
ine
ry a
nd
eq
uip
men
t
2
68
5
1
83
1
-
4 5
16
2
88
6
1 6
30
6
3.9
%
1
26
4
96
7
Oth
er
mach
ine
ry a
nd
e
quip
me
nt
2 6
85
1 8
31
-
4 5
16
2 8
86
1 6
30
6
3.9
%
1 2
64
9
67
Pa
ym
en
t fo
r fi
na
nc
ial a
sse
ts
-
-
-
-
19
(1
9)
-
59
58
TO
TA
L
1
39
99
9
-
1 1
00
14
1 0
99
1
41
05
6
43
10
0.0
%
1
36
43
9
1
34
74
4

149
DE
PA
RT
ME
NT
OF
EC
ON
OM
IC,
SM
AL
L B
US
INE
SS
DE
VE
LO
PM
EN
T,
TO
UR
ISM
AN
D E
NV
IRO
NM
EN
TA
L A
FF
AIR
S
VO
TE
3
AP
PR
OP
RIA
TIO
N S
TA
TE
ME
NT
for
the
ye
ar
en
de
d 3
1 M
arc
h 2
01
8
10
1.1
OF
FIC
E O
F T
HE
ME
C
20
17
/18
20
16
/17
A
dju
ste
d
Ap
pro
pri
ati
on
S
hif
tin
g o
f F
un
ds
Vir
em
en
t F
ina
l A
pp
rop
riati
on
A
ctu
al
Ex
pe
nd
itu
re
Va
ria
nc
e
Ex
pe
nd
itu
re
as
% o
f fi
na
l a
pp
rop
ria
tio
n
Fin
al
Ap
pro
pri
ati
on
A
ctu
al
exp
en
dit
ure
Ec
on
om
ic c
las
sif
ica
tio
n
R'0
00
R
'00
0
R'0
00
R
'00
0
R'0
00
R
'00
0
%
R'0
00
R
'000
Cu
rre
nt
pa
ym
en
ts
11
494
(
75
) -
1
1 4
19
9
88
2
1 5
37
86
.5%
8 0
09
7 8
67
Com
pe
nsa
tio
n o
f e
mplo
yee
s
8 2
81
-
-
8 2
81
7 3
71
91
0
89
.0%
5 7
36
5 7
72
Go
od
s a
nd
se
rvic
es
3 2
13
(75
) -
3
13
8
2 5
10
62
7
80
.0%
2 2
73
2 0
95
Tra
nsfe
rs a
nd
su
bs
idie
s
-
-
-
-
60
(60)
-
-
-
Hou
se
ho
lds
-
-
-
-
60
(60)
-
-
-
Pa
ym
en
ts f
or
ca
pit
al a
sse
ts
36
2
(2
02
)
-
1
60
10
6
5
4
6
6.3
%
88
69
Ma
ch
inery
an
d e
qu
ipm
en
t 3
62
(
202
) -
1
60
1
06
5
4
66
.3%
8
8
69
Pa
ym
en
ts f
or
fin
an
cia
l ass
ets
-
- -
- 1
9
(19)
- -
-
TO
TA
L
11
856
(
277
) -
1
1 5
79
1
0 0
67
1
51
2
86
.9%
8 0
97
7 9
36

150
DE
PA
RT
ME
NT
OF
EC
ON
OM
IC,
SM
AL
L B
US
INE
SS
DE
VE
LO
PM
EN
T,
TO
UR
ISM
AN
D E
NV
IRO
NM
EN
TA
L A
FF
AIR
S
VO
TE
3
AP
PR
OP
RIA
TIO
N S
TA
TE
ME
NT
for
the
ye
ar
en
de
d 3
1 M
arc
h 2
01
8
11
1.2
MA
NA
GE
ME
NT
SE
RV
ICE
S
20
17
/18
20
16
/17
A
dju
ste
d
Ap
pro
pri
ati
on
S
hif
tin
g o
f F
un
ds
Vir
em
en
t F
ina
l A
pp
rop
ria
tio
n
Ac
tua
l E
xp
en
dit
ure
V
ari
an
ce
Ex
pe
nd
itu
re
as
% o
f fi
na
l a
pp
rop
riati
on
Fin
al
Ap
pro
pri
ati
on
A
ctu
al
exp
en
dit
ure
Eco
no
mic
cla
ss
ific
ati
on
R
'00
0
R'0
00
R
'00
0
R'0
00
R
'00
0
R'0
00
%
R
'00
0
R'0
00
Cu
rre
nt
pa
ym
en
ts
25
093
(5
89
) -
2
4 5
04
2
5 9
81
(
1 4
77)
10
6.0
%
25
399
25
070
Com
pe
nsa
tio
n o
f e
mplo
yee
s
21
696
-
-
21
696
2
2 7
46
(
1 0
50)
10
4.8
%
21
323
22
160
Go
od
s a
nd
se
rvic
es
3 3
97
(5
89
) -
2
808
3 2
35
(42
7)
11
5.2
%
4 0
76
2 9
10
Tra
nsfe
rs a
nd
su
bs
idie
s
19
0
-
25
0
440
3
04
1
36
6
9.1
%
10
5
104
Hou
se
ho
lds
19
0
-
25
0
440
3
04
1
36
6
9.1
%
10
5
104
Pa
ym
en
ts f
or
ca
pit
al a
sse
ts
1 2
65
76
3
-
2 0
28
1 1
39
88
9
56
.2%
1
71
144
Ma
ch
inery
an
d e
qu
ipm
en
t 1
26
5
76
3
-
2 0
28
1 1
39
88
9
56
.2%
1
71
144
Pa
ym
en
ts f
or
fin
an
cia
l a
ss
ets
- -
- -
-
-
-
15
15
TO
TA
L
26
548
17
4
25
0
26
972
2
7 4
24
(
45
2)
10
1.7
%
25
690
25
333

151
DE
PA
RT
ME
NT
OF
EC
ON
OM
IC,
SM
AL
L B
US
INE
SS
DE
VE
LO
PM
EN
T,
TO
UR
ISM
AN
D E
NV
IRO
NM
EN
TA
L A
FF
AIR
S
VO
TE
3
AP
PR
OP
RIA
TIO
N S
TA
TE
ME
NT
for
the
ye
ar
en
de
d 3
1 M
arc
h 2
01
8
12
1.3
. F
INA
NC
IAL
MA
NA
GE
ME
NT
20
17
/18
20
16
/17
A
dju
ste
d
Ap
pro
pri
ati
on
S
hif
tin
g o
f F
un
ds
Vir
em
en
t F
ina
l A
pp
rop
ria
tio
n
Ac
tual
Ex
pe
nd
itu
re
Va
ria
nc
e
Exp
en
dit
ure
a
s %
of
fin
al
ap
pro
pri
ati
on
Fin
al
Ap
pro
pri
ati
on
A
ctu
al
ex
pe
nd
itu
re
Eco
no
mic
cla
ss
ific
ati
on
R
'00
0
R'0
00
R'0
00
R
'00
0
R'0
00
R
'00
0
%
R'0
00
R
'000
Cu
rre
nt
pa
ym
en
ts
62
510
1
14
3
85
0
64
503
6
9 2
45
(
4 7
42)
10
7.4
%
62
100
62
021
Com
pe
nsa
tio
n o
f e
mplo
yee
s
29
338
-
(
2 5
00)
26
838
2
8 0
70
(
1 2
32)
10
4.6
%
29
393
28
564
Go
od
s a
nd
se
rvic
es
33
172
1
14
3
3 3
50
37
665
4
1 1
75
(
3 5
10)
10
9.3
%
32
707
33
457
Tra
nsfe
rs a
nd
su
bsid
ies
2
-
-
2
1
3
(11
) 6
50
.0%
1
25
12
3
Dep
art
me
nta
l a
ge
ncie
s a
nd
a
cco
un
ts
2
-
-
2
-
2
-
2
-
Hou
se
ho
lds
-
-
-
-
13
(
13
) -
1
23
12
3
Pa
ym
en
ts f
or
ca
pit
al a
sse
ts
1 1
24
74
0
-
1 8
64
1 2
24
64
0
65
.7%
6
67
47
3
Ma
ch
inery
an
d e
qu
ipm
en
t 1
12
4
74
0
-
1 8
64
1 2
24
64
0
65
.7%
6
67
47
3
Pa
ym
en
ts f
or
fin
an
cia
l a
sse
ts
-
-
-
-
-
-
-
32
31
TO
TA
L
63
636
1
88
3
85
0
66
369
7
0 4
82
(
4 1
13)
10
6.2
%
69
924
62
648

152
DE
PA
RT
ME
NT
OF
EC
ON
OM
IC,
SM
AL
L B
US
INE
SS
DE
VE
LO
PM
EN
T,
TO
UR
ISM
AN
D E
NV
IRO
NM
EN
TA
L A
FF
AIR
S
VO
TE
3
AP
PR
OP
RIA
TIO
N S
TA
TE
ME
NT
for
the
ye
ar
en
de
d 3
1 M
arc
h 2
01
8
13
1.4
. C
OR
PO
RA
TE
SE
RV
ICE
S
20
17
/18
20
16
/17
A
dju
ste
d
Ap
pro
pri
ati
on
S
hif
tin
g o
f F
un
ds
Vir
em
en
t F
ina
l A
pp
rop
ria
tio
n
Ac
tual
Ex
pe
nd
itu
re
Va
ria
nc
e
Exp
en
dit
ure
a
s %
of
fin
al
ap
pro
pri
ati
on
Fin
al
Ap
pro
pri
ati
on
A
ctu
al
ex
pe
nd
itu
re
Eco
no
mic
cla
ss
ific
ati
on
R
'00
0
R'0
00
R'0
00
R
'00
0
R'0
00
R
'00
0
%
R'0
00
R
'000
Cu
rre
nt
pa
ym
en
ts
38
023
(
2 3
10)
-
35
713
3
2 6
29
3
08
4
91
.4%
3
9 2
98
38
457
Com
pe
nsa
tio
n o
f e
mplo
yee
s
24
001
(
20
0)
-
2
3 8
01
2
2 3
72
1
42
9
94
.0%
3
1 1
33
30
471
Go
od
s a
nd
se
rvic
es
14
022
(
2 1
10)
-
11
912
1
0 2
57
1
65
5
86
.1%
8
16
5
7 9
86
Tra
nsfe
rs a
nd
su
bs
idie
s
2
-
-
2
37
(
35
) 1
85
0.0
%
80
77
Dep
art
me
nta
l a
ge
ncie
s a
nd
a
cco
un
ts
2
-
-
2
-
2
-
2
-
Hou
se
ho
lds
-
-
-
-
37
(
37
) -
7
8
77
Pa
ym
en
ts f
or
cap
ita
l a
sse
ts
(6
6)
53
0
-
46
4
41
7
47
8
9.9
%
33
8
28
1
Ma
ch
inery
an
d e
qu
ipm
en
t (
66
) 5
30
-
46
4
41
7
47
8
9.9
%
33
8
28
1
Pa
ym
en
ts f
or
fin
an
cia
l a
sse
ts
-
-
-
-
-
-
-
12
12
TO
TA
L
37
959
(
1 7
80)
-
36
179
3
3 0
83
3
09
6
91
.4%
3
9 7
28
38
827

153
DE
PA
RT
ME
NT
OF
EC
ON
OM
IC,
SM
AL
L B
US
INE
SS
DE
VE
LO
PM
EN
T,
TO
UR
ISM
AN
D E
NV
IRO
NM
EN
TA
L A
FF
AIR
S
VO
TE
3
AP
PR
OP
RIA
TIO
N S
TA
TE
ME
NT
for
the
ye
ar
en
de
d 3
1 M
arc
h 2
01
8
14
Pro
gra
mm
e 2
: E
NV
IRO
NM
EN
TA
L A
FF
AIR
S
20
17
/18
20
16
/17
A
dju
ste
d
Ap
pro
pri
ati
on
S
hif
tin
g o
f F
un
ds
Vir
em
en
t F
inal
Ap
pro
pri
ati
on
A
ctu
al
Exp
en
dit
ure
V
ari
an
ce
Ex
pe
nd
itu
re
as
% o
f fi
na
l a
pp
rop
riati
on
Fin
al
Ap
pro
pri
ati
on
A
ctu
al
ex
pe
nd
itu
re
R
'00
0
R'0
00
R
'00
0
R'0
00
R
'000
R
'00
0
%
R'0
00
R
'000
Su
b p
rog
ram
me
1.
EN
VIR
ON
ME
NT
AL
PO
LIC
Y,
PL
AN
NIN
G A
ND
C
OO
RD
INA
TIO
N
7 3
17
-
1 7
00
9 0
17
7 1
90
1 8
27
79
.7%
7
20
9
7 7
18
2.
CO
MP
LIA
NC
E A
ND
E
NF
OR
CE
ME
NT
15
399
(
965
) -
1
4 4
34
1
5 6
09
(
1 1
75)
10
8.1
%
13
170
10
996
3.
EN
VIR
ON
ME
NT
AL
QU
AL
ITY
M
AN
AG
EM
EN
T
23
051
(
608
) 1
15
2
2 5
88
2
3 6
55
(1
09
7)
10
4.7
%
11
244
7 4
47
4.
BIO
DIV
ER
SIT
Y
MA
NA
GE
ME
NT
82
599
2
10
1
(5
757)
78
943
8
0 5
03
(
1 5
60)
10
2.0
%
99
343
10
5 1
77
5.
EN
VIR
ON
ME
NT
AL
E
MP
OW
ER
ME
NT
SE
RV
ICE
S
12
267
(
528
) -
1
1 7
39
1
0 9
01
83
8
92
.9%
1
5 4
76
8 1
50
To
tal
for
su
b p
rog
ram
mes
14
0 6
33
-
(
3 9
42)
13
6 6
91
1
37
858
(
1 1
67)
10
0.9
%
14
6 4
42
13
9 4
88
Eco
no
mic
cla
ss
ific
ati
on
Cu
rre
nt
pa
ym
en
ts
13
1 1
72
9
10
(2 3
57
)
1
29
72
5
13
1 6
08
(1 8
83
)
10
1.5
%
12
5 6
17
12
4 7
74
Co
mpe
nsa
tio
n o
f e
mp
loye
es
9
5 6
81
-
4 5
00
1
00
18
1
10
3 2
26
(3 0
45
)
10
3.0
%
9
6 0
63
95
998
Sa
larie
s a
nd
wage
s
8
6 5
76
-
4 5
00
91
076
81
628
9 4
48
89
.6%
8
3 4
29
81
325
So
cia
l co
ntr
ibu
tio
ns
9
10
5
-
-
9 1
05
21
598
(1
2 4
93
)
23
7.2
%
1
2 6
34
14
673
Go
od
s a
nd
se
rvic
es
35
491
9
10
(6
857
)
29
544
28
382
1 1
62
96
.1%
2
9 5
54
28
776
Ad
min
istr
ative
fe
es
4
80
-
84
82
2
9
7.6
%
-
-
Ad
ve
rtis
ing
(5
13
)
(2
9)
6
43
1
01
140
(3
9)
13
8.6
%
2
83
12
2

154
DE
PA
RT
ME
NT
OF
EC
ON
OM
IC,
SM
AL
L B
US
INE
SS
DE
VE
LO
PM
EN
T,
TO
UR
ISM
AN
D E
NV
IRO
NM
EN
TA
L A
FF
AIR
S
VO
TE
3
AP
PR
OP
RIA
TIO
N S
TA
TE
ME
NT
for
the
ye
ar
en
de
d 3
1 M
arc
h 2
01
8
15
Pro
gra
mm
e 2
: E
NV
IRO
NM
EN
TA
L A
FF
AIR
S
20
17
/18
20
16
/17
A
dju
ste
d
Ap
pro
pri
ati
on
S
hif
tin
g o
f F
un
ds
Vir
em
en
t F
inal
Ap
pro
pri
ati
on
A
ctu
al
Exp
en
dit
ure
V
ari
an
ce
Ex
pe
nd
itu
re
as
% o
f fi
na
l a
pp
rop
riati
on
Fin
al
Ap
pro
pri
ati
on
A
ctu
al
ex
pe
nd
itu
re
R
'00
0
R'0
00
R
'00
0
R'0
00
R
'000
R
'00
0
%
R'0
00
R
'000
Adve
rtis
ing
(5
13
)
(2
9)
6
43
1
01
1
40
(3
9)
13
8.6
%
2
83
12
2
Min
or
asse
ts
1 6
28
(6
70
)
(1
50
)
8
08
1
24
6
84
15
.3%
8
86
12
7
Ca
tering
: D
epart
men
tal activitie
s
9
06
(2
4)
-
8
82
7
94
88
90
.0%
4
58
42
2
Co
mm
un
ica
tio
n (
G&
S)
43
4
(1
7)
-
4
17
4
67
(50
)
11
2.0
%
1
04
4
79
1
Co
mp
ute
r se
rvic
es
2
-
-
2
14
(1
2)
70
0.0
%
7
89
35
7
Co
nsu
lta
nts
: B
usin
ess a
nd
a
dvis
ory
se
rvic
es
4 0
00
(236
)
(2 8
00
)
9
64
5
91
3
73
61
.3%
7
46
3
7 3
41
Co
ntr
acto
rs
4 3
22
2 0
05
-
6 3
27
4 4
38
1 8
89
70
.1%
5
66
0
4 9
25
A
ge
ncy
an
d s
uppo
rt /
ou
tso
urc
ed
se
rvic
es
7
32
(6
89
)
-
43
17
26
39
.5%
3 6
94
3 5
03
In
ven
tory
: C
loth
ing
ma
teria
l
an
d a
cce
sso
rie
s
-
-
-
-
-
-
-
5
37
-
Inven
tory
: F
arm
ing
sup
plie
s
-
-
-
-
-
-
-
3
38
-
Inven
tory
: F
ue
l, o
il a
nd
ga
s
-
-
-
-
-
-
-
3
93
-
Inven
tory
: M
ate
ria
ls a
nd
su
pplie
s
-
-
-
-
-
-
-
1
25
3
-
Co
nsu
ma
ble
su
pp
lies
4 7
31
5
75
-
5 3
06
4 7
95
5
11
90
.4%
2 6
77
3 6
84
C
on
su
ma
ble
: S
tatio
ne
ry,
prin
ting
and
off
ice
su
pp
lies
1 6
01
(2
13
)
-
1 3
88
1 1
46
2
42
82
.6%
1 0
74
95
9
Op
era
tin
g le
ases
-
-
-
-
-
-
-
-
66
Pro
pert
y p
aym
en
ts
11
406
2 3
10
(4 0
50
)
9 6
66
9 3
20
34
6
9
6.4
%
16
8

155
DE
PA
RT
ME
NT
OF
EC
ON
OM
IC,
SM
AL
L B
US
INE
SS
DE
VE
LO
PM
EN
T,
TO
UR
ISM
AN
D E
NV
IRO
NM
EN
TA
L A
FF
AIR
S
VO
TE
3
AP
PR
OP
RIA
TIO
N S
TA
TE
ME
NT
for
the
ye
ar
en
de
d 3
1 M
arc
h 2
01
8
16
Pro
gra
mm
e 2
: E
NV
IRO
NM
EN
TA
L A
FF
AIR
S
20
17
/18
20
16
/17
A
dju
ste
d
Ap
pro
pri
ati
on
S
hif
tin
g o
f F
un
ds
Vir
em
en
t F
inal
Ap
pro
pri
ati
on
A
ctu
al
Exp
en
dit
ure
V
ari
an
ce
Ex
pe
nd
itu
re
as
% o
f fi
na
l a
pp
rop
riati
on
Fin
al
Ap
pro
pri
ati
on
A
ctu
al
ex
pe
nd
itu
re
R
'00
0
R'0
00
R
'00
0
R'0
00
R
'000
R
'00
0
%
R'0
00
R
'000
Tra
ve
l a
nd
su
bsis
ten
ce
5 1
38
(2
396)
-
2 7
42
5 4
39
(2 6
97
19
8.4
%
2
05
6
5 4
01
Tra
inin
g a
nd
de
ve
lop
me
nt
4
65
(5
0)
-
41
5
3
48
67
83
.9%
3
67
18
9
Op
era
tin
g p
aym
ents
6
21
(4
36
)
-
1
85
498
(3
13
)
26
9.2
%
5
10
83
3
Ven
ues a
nd
facili
tie
s
-
-
-
-
-
-
-
56
48
Re
nta
l a
nd
hirin
g
14
7
00
(5
00
)
2
14
1
69
45
79
.0%
-
-
Tra
nsfe
rs a
nd
su
bs
idie
s
4
06
-
1
00
5
06
3
39
16
7
6
7.0
%
7
32
51
2
Pro
vin
ces a
nd
mu
nic
ipa
litie
s
-
-
-
-
-
-
-
2
30
14
9
De
pa
rtm
en
tal a
ge
ncie
s a
nd
a
cco
un
ts
3
26
(1
30
)
-
1
96
39
1
57
19
.9%
1
82
51
Ho
use
ho
lds
80
1
30
1
00
3
10
3
00
10
96
.8%
3
20
31
2
So
cia
l b
enefits
80
-
1
00
1
80
2
70
(9
0)
15
0.0
%
3
20
31
2
Oth
er
tra
nsfe
rs t
o h
ouse
ho
lds
-
1
30
-
1
30
30
1
00
23
.1%
-
-
Pa
ym
en
ts f
or
cap
ita
l a
sse
ts
9 0
55
(9
10
)
(1 7
00
)
6
445
5 8
99
5
46
91
.5%
19
743
13
855
B
uild
ing
s a
nd
oth
er
fixe
d
str
uctu
res
5 4
05
-
(1 7
00
)
3
70
5
3 8
92
(18
7)
10
5.0
%
1
8 2
75
13
124
Bu
ildin
gs
1 7
00
-
(1 4
50
)
2
50
8
47
(5
97
)
33
8.8
%
-
-
Oth
er
fixe
d s
tru
ctu
res
3 7
05
-
(2
50
)
3 4
55
3 0
45
4
10
88
.1%
1
8 2
75
13
124
Ma
ch
ine
ry a
nd
eq
uip
men
t
3 3
05
(9
10
)
-
2 3
95
2 0
07
3
88
83
.8%
1
45
2
73
1

156
DE
PA
RT
ME
NT
OF
EC
ON
OM
IC,
SM
AL
L B
US
INE
SS
DE
VE
LO
PM
EN
T,
TO
UR
ISM
AN
D E
NV
IRO
NM
EN
TA
L A
FF
AIR
S
VO
TE
3
AP
PR
OP
RIA
TIO
N S
TA
TE
ME
NT
for
the
ye
ar
en
de
d 3
1 M
arc
h 2
01
8
17
Pro
gra
mm
e 2
: E
NV
IRO
NM
EN
TA
L A
FF
AIR
S
20
17
/18
20
16
/17
A
dju
ste
d
Ap
pro
pri
ati
on
S
hif
tin
g o
f F
un
ds
Vir
em
en
t F
inal
Ap
pro
pri
ati
on
A
ctu
al
Exp
en
dit
ure
V
ari
an
ce
Ex
pe
nd
itu
re
as
% o
f fi
na
l a
pp
rop
riati
on
Fin
al
Ap
pro
pri
ati
on
A
ctu
al
ex
pe
nd
itu
re
R
'00
0
R'0
00
R
'00
0
R'0
00
R
'000
R
'00
0
%
R'0
00
R
'000
Tra
nsp
ort
equ
ipm
en
t
-
40
-
40
-
40
0.0
%
-
-
Oth
er
mach
ine
ry a
nd
e
quip
me
nt
3 3
05
(9
50
)
-
2 3
55
2 0
07
3
48
85
.2%
1 4
52
73
1
So
ftw
are
an
d o
the
r in
tan
gib
le
asse
ts
3
45
-
-
34
5
-
3
45
0%
16
-
Pa
ym
en
t fo
r fi
na
nc
ial a
sse
ts
-
-
15
15
12
3
8
0.0
%
3
50
34
7
TO
TA
L
1
40 6
33
-
(3 9
42
)
1
36
69
1
13
7 8
58
(1
167
) 10
0.9
%
14
6 4
42
13
9 4
88

157
DE
PA
RT
ME
NT
OF
EC
ON
OM
IC,
SM
AL
L B
US
INE
SS
DE
VE
LO
PM
EN
T,
TO
UR
ISM
AN
D E
NV
IRO
NM
EN
TA
L A
FF
AIR
S
VO
TE
3
AP
PR
OP
RIA
TIO
N S
TA
TE
ME
NT
for
the
ye
ar
en
de
d 3
1 M
arc
h 2
01
8
18
2.1
EN
VIR
ON
ME
NT
AL
PO
LIC
Y,
PL
AN
NIN
G A
ND
CO
OR
DIN
AT
ION
20
17
/18
20
16
/17
A
dju
ste
d
Ap
pro
pri
ati
on
S
hif
tin
g o
f F
un
ds
Vir
em
en
t F
ina
l A
pp
rop
ria
tio
n
Ac
tua
l E
xp
en
dit
ure
V
ari
an
ce
Exp
en
dit
ure
a
s %
of
fin
al
ap
pro
pri
ati
on
Fin
al
Ap
pro
pri
ati
on
A
ctu
al
ex
pe
nd
itu
re
Ec
on
om
ic c
las
sif
ica
tio
n
R'0
00
R'0
00
R
'000
R
'00
0
R'0
00
R
'00
0
%
R'0
00
R
'000
Cu
rre
nt
pa
ym
en
ts
7 1
96
-
1 7
00
8 8
96
7 1
62
1 7
34
80
.5%
7
20
9
7 7
12
Com
pe
nsa
tio
n o
f e
mplo
yee
s
3 8
12
-
4 5
00
8 3
12
6 3
73
1 9
39
76
.7%
6
33
1
6 8
31
Go
od
s a
nd
se
rvic
es
3 3
84
-
(2
80
0)
58
4
789
(
20
4)
13
4.9
%
87
8
88
1
Tra
nsfe
rs a
nd
su
bs
idie
s
-
-
-
-
35
(
35
) -
-
6
Hou
se
ho
lds
-
-
-
-
35
(
35
) -
-
6
Pa
ym
en
ts f
or
ca
pit
al a
sse
ts
12
1
-
-
12
1
(7
) 1
28
(5
.8%
) 4
06
-
Ma
ch
inery
an
d e
qu
ipm
en
t 1
21
-
-
12
1
(7
) 1
28
(5
.8%
) -
-
TO
TA
L
7 3
17
-
1 7
00
9 0
17
7 1
90
1 8
27
79
.7%
7
20
9
7 7
18

158
DE
PA
RT
ME
NT
OF
EC
ON
OM
IC,
SM
AL
L B
US
INE
SS
DE
VE
LO
PM
EN
T,
TO
UR
ISM
AN
D E
NV
IRO
NM
EN
TA
L A
FF
AIR
S
VO
TE
3
AP
PR
OP
RIA
TIO
N S
TA
TE
ME
NT
for
the
ye
ar
en
de
d 3
1 M
arc
h 2
01
8
19
2.2
CO
MP
LIA
NC
E A
ND
EN
FO
RC
EM
EN
T
20
17
/18
20
16
/17
A
dju
ste
d
Ap
pro
pri
ati
on
S
hif
tin
g o
f F
un
ds
Vir
em
en
t F
ina
l A
pp
rop
ria
tio
n
Ac
tua
l E
xp
en
dit
ure
V
ari
an
ce
Exp
en
dit
ure
a
s %
of
fin
al
ap
pro
pri
ati
on
Fin
al
Ap
pro
pri
ati
on
A
ctu
al
ex
pe
nd
itu
re
Eco
no
mic
cla
ss
ific
ati
on
R
'00
0
R'0
00
R'0
00
R'0
00
R
'000
R
'000
%
R
'00
0
R'0
00
Cu
rre
nt
pa
ym
en
ts
14
993
(
1 1
10)
-
13 8
83
1
5 5
34
(
1 6
51)
11
1.9
%
13
116
10
907
Com
pe
nsa
tio
n o
f e
mplo
yee
s
12
241
-
-
1
2 2
41
1
3 7
89
(
1 5
48)
11
2.6
%
11
658
8 6
02
Go
od
s a
nd
se
rvic
es
2 7
52
(1
11
0)
-
1 6
42
1 7
45
(1
03
) 1
06
.3%
1
45
8
2 3
05
Tra
nsfe
rs a
nd
su
bs
idie
s
-
-
-
-
-
-
-
- 4
9
Hou
se
ho
lds
-
-
-
-
-
-
-
- 4
9
Pa
ym
en
ts f
or
ca
pit
al a
sse
ts
40
6
14
5
-
55
1
75
4
76
1
3.6
%
54
40
Ma
ch
inery
an
d e
qu
ipm
en
t 7
6
10
5
-
18
1
75
1
06
4
1.4
%
54
40
Tra
nsp
ort
Equ
ipm
en
t -
40
- 4
0
- 40
- -
-
Inta
ngib
le a
ssets
3
30
-
- 3
30
-
330
-
-
-
TO
TA
L
15
399
(
96
5)
-
14 4
34
1
5 6
09
(
1 1
75)
10
8.1
%
13
170
10
996

159
DE
PA
RT
ME
NT
OF
EC
ON
OM
IC,
SM
AL
L B
US
INE
SS
DE
VE
LO
PM
EN
T,
TO
UR
ISM
AN
D E
NV
IRO
NM
EN
TA
L A
FF
AIR
S
VO
TE
3
AP
PR
OP
RIA
TIO
N S
TA
TE
ME
NT
for
the
ye
ar
en
de
d 3
1 M
arc
h 2
01
8
20
2
.3.
EN
VIR
ON
ME
NT
AL
QU
AL
ITY
MA
NA
GE
ME
NT
201
7/1
8
20
16
/17
A
dju
ste
d
Ap
pro
pri
ati
on
S
hif
tin
g o
f F
un
ds
Vir
em
en
t F
ina
l A
pp
rop
ria
tio
n
Ac
tua
l E
xp
en
dit
ure
V
ari
an
ce
Ex
pe
nd
itu
re
as
% o
f fi
na
l a
pp
rop
ria
tio
n
Fin
al
Ap
pro
pri
ati
on
A
ctu
al
ex
pe
nd
itu
re
Eco
no
mic
cla
ss
ific
ati
on
R
'00
0
R'0
00
R'0
00
R'0
00
R
'00
0
R'0
00
%
R
'00
0
R'0
00
Cu
rre
nt
pa
ym
en
ts
20
605
5
78
-
21 1
83
2
1 9
26
(
743
) 1
03
.5%
9
81
9
6 9
30
Com
pe
nsa
tio
n o
f e
mplo
yee
s
14
319
-
-
1
4 3
19
1
6 5
39
(
2 2
20)
11
5.5
%
7 5
92
5 8
40
Go
od
s a
nd
se
rvic
es
6 2
86
57
8
-
6 8
94
5 3
87
1 4
77
78
.5%
2
22
7
1 0
90
Tra
nsfe
rs a
nd
su
bs
idie
s
5
-
10
0
10
5
92
1
3
87
.6%
2
30
16
7
Pro
vin
ces a
nd
mu
nic
ipa
litie
s
-
-
-
-
-
-
-
23
0
14
9
Dep
art
me
nta
l A
gen
cie
s a
nd
Accoun
ts
5
- -
5
- 5
-
- -
Hou
se
ho
lds
-
-
10
0
10
0
92
8
9
2.0
%
1
8
Pa
ym
en
ts f
or
ca
pit
al a
sse
ts
2 4
41
(1
18
6)
-
1 2
55
1 6
37
(3
82
) 1
30
.4%
1
14
5
34
3
Ma
ch
inery
an
d e
qu
ipm
en
t 2
44
1
(1
18
6)
-
1 2
55
1 6
37
(3
82
) 1
30
.4%
1
14
5
34
3
Pa
ym
en
ts f
or
fin
an
cia
l a
sse
ts
- -
15
15
-
15
-
5
0
7
TO
TA
L
23
051
(
60
8)
11
5
22 5
88
2
3 6
55
(
1 0
97)
10
4.9
%
11
244
7 4
47

160
DE
PA
RT
ME
NT
OF
EC
ON
OM
IC,
SM
AL
L B
US
INE
SS
DE
VE
LO
PM
EN
T,
TO
UR
ISM
AN
D E
NV
IRO
NM
EN
TA
L A
FF
AIR
S
VO
TE
3
AP
PR
OP
RIA
TIO
N S
TA
TE
ME
NT
for
the
ye
ar
en
de
d 3
1 M
arc
h 2
01
8
21
2.4
. B
IOD
IVE
RS
ITY
MA
NA
GE
ME
NT
201
7/1
8
20
16
/17
A
dju
ste
d
Ap
pro
pri
ati
on
S
hif
tin
g o
f F
un
ds
Vir
em
en
t F
ina
l A
pp
rop
ria
tio
n
Ac
tua
l E
xp
en
dit
ure
V
ari
an
ce
Ex
pe
nd
itu
re
as
% o
f fi
na
l a
pp
rop
ria
tio
n
Fin
al
Ap
pro
pri
ati
on
A
ctu
al
ex
pe
nd
itu
re
Ec
on
om
ic c
las
sif
icati
on
R
'00
0
R'0
00
R'0
00
R'0
00
R
'000
R
'00
0
%
R'0
00
R
'000
Cu
rre
nt
pa
ym
en
ts
76
338
1
94
0
(4
05
7)
74
221
7
6 2
08
(
1 9
87)
10
2.7
%
80
717
91
503
Com
pe
nsa
tio
n o
f e
mplo
yee
s
55
343
-
-
5
5 3
43
5
7 5
82
(
2 2
39)
10
4.0
%
58
666
68
929
Go
od
s a
nd
se
rvic
es
20
995
1
94
0
(4
05
7)
18
848
1
8 6
26
2
52
9
8.7
%
22
051
22
574
Tra
nsfe
rs a
nd
su
bs
idie
s
27
1
-
-
27
1
171
1
00
63
.1%
1
82
21
2
Dep
art
me
nta
l a
ge
ncie
s a
nd
a
cco
un
ts
19
1
-
-
19
1
39
1
52
2
0.4
%
18
2
51
Hou
se
ho
lds
80
-
-
8
0
132
(
52
) 1
65
.0%
-
16
1
Pa
ym
en
ts f
or
ca
pit
al a
sse
ts
5 9
90
16
1
(1
70
0)
4 4
51
4 1
21
33
0
92
.6%
1
8 4
44
13
381
Bu
ildin
gs a
nd
oth
er
fixe
d
str
uctu
res
5 4
05
-
(1
70
0)
3 7
05
3 8
92
(1
87)
1
05
.0%
1
8 2
75
13
124
Ma
ch
inery
an
d e
qu
ipm
en
t 5
85
1
61
-
74
6
229
5
17
3
0.7
%
16
9
25
7
Pa
ym
en
ts f
or
fin
an
cia
l a
sse
ts
- -
-
-
3
(3)
-
81
81
TO
TA
L
82
599
2
10
1
(5
75
7)
78
943
8
0 5
03
(
1 5
60)
10
2.0
%
99
343
10
5 1
77

161
DE
PA
RT
ME
NT
OF
EC
ON
OM
IC,
SM
AL
L B
US
INE
SS
DE
VE
LO
PM
EN
T,
TO
UR
ISM
AN
D E
NV
IRO
NM
EN
TA
L A
FF
AIR
S
VO
TE
3
AP
PR
OP
RIA
TIO
N S
TA
TE
ME
NT
for
the
ye
ar
en
de
d 3
1 M
arc
h 2
01
8
22
2.5
. E
NV
IRO
NM
EN
TA
L E
MP
OW
ER
ME
NT
SE
RV
ICE
S
201
7/1
8
20
16
/17
A
dju
ste
d
Ap
pro
pri
ati
on
S
hif
tin
g o
f F
un
ds
Vir
em
en
t F
ina
l A
pp
rop
ria
tio
n
Ac
tual
Ex
pe
nd
itu
re
Va
ria
nc
e
Ex
pe
nd
itu
re
as
% o
f fi
na
l a
pp
rop
ria
tio
n
Fin
al
Ap
pro
pri
ati
on
A
ctu
al
ex
pe
nd
itu
re
Eco
no
mic
cla
ss
ific
ati
on
R
'00
0
R'0
00
R'0
00
R'0
00
R
'00
0
R'0
00
%
R
'00
0
R'0
00
Cu
rre
nt
pa
ym
en
ts
12
040
(
49
8)
-
11
542
1
0 7
78
7
64
93
.4%
1
4 7
56
7 7
22
Com
pe
nsa
tio
n o
f e
mplo
yee
s
9 9
66
-
-
9 9
66
8 9
43
(1
023)
89
.7%
1
1 8
16
5 7
96
Go
od
s a
nd
se
rvic
es
2 0
74
(4
98
) -
1
57
6
1 8
35
(2
59
) 1
16
.4%
2
94
0
1 9
26
Tra
nsfe
rs a
nd
su
bs
idie
s
13
0
- -
1
30
4
1
89
31
.5%
3
20
78
De
pa
rtm
en
tal
ag
en
cie
s a
nd
a
cc
ou
nts
13
0
(13
0)
- -
- -
- -
-
De
pa
rtm
enta
l a
gencie
s
(non
-busin
ess e
ntitie
s)
13
0
(13
0)
- -
- -
- -
-
Hou
se
ho
lds
-
13
0
-
13
0
41
89
31
.5%
3
20
78
Pa
ym
en
ts f
or
ca
pit
al a
sse
ts
97
(
30
) -
6
7
73
(6
)
10
9.0
%
10
0
91
Ma
ch
inery
an
d e
qu
ipm
en
t 8
2
(3
0)
-
52
7
3
(21
)
14
0.4
%
84
91
Inta
ngib
le a
ssets
1
5
- -
15
-
15
-
1
6
-
Pa
ym
en
ts f
or
fin
an
cia
l a
sse
ts
- -
- -
9
(
9)
-
30
0
25
9
TO
TA
L
12
267
(
52
8)
-
11
739
1
0 9
01
83
8
92
.9%
1
5 4
76
8 1
50

162
DE
PA
RT
ME
NT
OF
EC
ON
OM
IC,
SM
AL
L B
US
INE
SS
DE
VE
LO
PM
EN
T,
TO
UR
ISM
AN
D E
NV
IRO
NM
EN
TA
L A
FF
AIR
S
VO
TE
3
AP
PR
OP
RIA
TIO
N S
TA
TE
ME
NT
for
the
ye
ar
en
de
d 3
1 M
arc
h 2
01
8
23
Pro
gra
mm
e 3
: E
CO
NO
MIC
AN
D S
MA
LL
BU
SIN
ES
S
DE
VE
LO
PM
EN
T
20
17
/18
20
16
/17
A
dju
ste
d
Ap
pro
pri
ati
on
S
hif
tin
g o
f F
un
ds
Vir
em
en
t F
ina
l A
pp
rop
riati
on
A
ctu
al
Ex
pe
nd
itu
re
Va
ria
nc
e
Exp
en
dit
ure
a
s %
of
fin
al
ap
pro
pri
ati
on
Fin
al
Ap
pro
pri
ati
on
A
ctu
al
ex
pe
nd
itu
re
R
'00
0
R'0
00
R'0
00
R'0
00
R
'00
0
R'0
00
%
R
'00
0
R'0
00
Su
b p
rog
ram
me
1.
INT
ER
GR
AT
ED
E
CO
NO
MIC
D
EV
ELO
PM
EN
T
49
182
(
4 0
23)
(2
12
)
44
947
3
2 7
50
1
2 1
97
72
.9%
2
4 2
56
23
103
2.
EC
ON
OM
IC
PL
AN
NIN
G
12
9 3
29
(
23
6)
6 4
12
13
5 5
05
1
39
42
8
(3
923)
10
2.9
%
70
357
68
370
3.
SM
AL
L B
US
INE
SS
D
EV
ELO
PM
EN
T
36
674
4
25
9
(3
21
8)
37
715
2
8 8
97
8
81
8
76
.6%
1
9 7
65
21
880
To
tal
for
su
b p
rog
ram
mes
21
5 1
85
-
2
98
2
21
8 1
67
2
01
07
5
17
092
9
2.2
%
11
4 3
78
11
3 3
53
Eco
no
mic
cla
ss
ific
ati
on
Cu
rre
nt
pa
ym
en
ts
69
883
4
068
(3 4
43
)
70
50
8
72
323
(1 8
15
)
10
2.6
%
4
7 2
09
4
6 5
42
C
om
pe
nsa
tion o
f e
mp
loye
es
45
69
0
-
(2 0
00
)
4
3 6
90
43
662
28
99
.9%
29
26
1
2
9 1
81
Sala
rie
s a
nd
wage
s
44
40
3
-
(2 0
00
)
4
2 4
03
39
27
6
3
12
7
9
2.6
%
25
41
6
2
5 6
23
Socia
l co
ntr
ibu
tio
ns
1
28
7
-
-
1
28
7
4
38
6
(3 0
99
)
34
0.8
%
3
84
5
3 5
58
Go
od
s a
nd
se
rvic
es
24
19
3
4
068
(1 4
43
)
26
81
8
28
66
1
(1 8
43
)
1
06
.9%
17
94
8
1
7 3
61
Adm
inis
trative
fe
es
2
13
(20
3)
(10
)
-
-
-
-
1
99
19
8
Adve
rtis
ing
8
33
70
4
(40
)
1
49
7
1
53
0
(3
3)
1
02
.2%
3
90
32
1
Min
or
asse
ts
1
79
(64
)
-
1
15
82
33
71
.3%
5
3
41
Aud
it c
osts
: E
xte
rna
l
-
5
(35
)
(3
0)
41
(7
1)
(1
36.7
%)
-
-

163
DE
PA
RT
ME
NT
OF
EC
ON
OM
IC,
SM
AL
L B
US
INE
SS
DE
VE
LO
PM
EN
T,
TO
UR
ISM
AN
D E
NV
IRO
NM
EN
TA
L A
FF
AIR
S
VO
TE
3
AP
PR
OP
RIA
TIO
N S
TA
TE
ME
NT
for
the
ye
ar
en
de
d 3
1 M
arc
h 2
01
8
24
Pro
gra
mm
e 3
: E
CO
NO
MIC
AN
D S
MA
LL
BU
SIN
ES
S
DE
VE
LO
PM
EN
T
20
17
/18
20
16
/17
A
dju
ste
d
Ap
pro
pri
ati
on
S
hif
tin
g o
f F
un
ds
Vir
em
en
t F
ina
l A
pp
rop
riati
on
A
ctu
al
Ex
pe
nd
itu
re
Va
ria
nc
e
Exp
en
dit
ure
a
s %
of
fin
al
ap
pro
pri
ati
on
Fin
al
Ap
pro
pri
ati
on
A
ctu
al
ex
pe
nd
itu
re
R
'00
0
R'0
00
R'0
00
R'0
00
R
'00
0
R'0
00
%
R
'00
0
R'0
00
Ca
terin
g:
De
pa
rtm
en
tal
activitie
s
1
26
8
97
1
(60
)
2 1
79
2
06
1
1
18
94
.6%
8
79
66
7
Co
mm
un
ica
tio
n (
G&
S)
4
94
(82
)
-
4
12
3
71
4
1
90
.0%
328
3
00
C
on
su
ltan
ts:
Busin
ess
an
d a
dvis
ory
se
rvic
es
11
86
8
(6 6
68
)
(90
3)
4
297
4
617
(3
20)
10
7.4
%
3 6
93
3 4
61
Le
ga
l se
rvic
es
2
0
-
(15
)
5
4
1
8
0.0
%
-
-
Co
ntr
acto
rs
3
20
64
7
(40
)
9
27
9
60
(3
3)
1
03
.6%
4
63
45
1
Ag
en
cy
an
d s
up
po
rt /
o
uts
ou
rce
d s
erv
ices
1
50
0
8
73
6
-
10
23
6
13
076
(2 8
40
)
1
27
.7%
9
01
1
8 9
96
En
tert
ain
me
nt
1
0
9
-
19
14
5
7
3.7
%
1
1
Co
nsu
ma
ble
sup
plie
s
2
11
(11
)
(70
)
1
30
1
62
(3
2)
1
24
.6%
4
86
91
C
on
su
ma
ble
: S
tatio
ne
ry,
prin
tin
g a
nd
off
ice
su
pp
lies
6
63
(14
6)
(50
)
4
67
3
29
1
38
70
.4%
5
77
50
4
Op
era
tin
g lea
ses
-
-
-
-
-
-
-
20
16
T
rave
l a
nd
su
bsis
tence
4
72
0
28
1
(17
0)
4 8
31
4 2
26
6
05
87
.5%
1 5
17
1 9
94
T
rain
ing
an
d
de
ve
lop
me
nt
3
27
31
8
(40
)
6
05
3
29
2
76
54
.4%
10
10
Op
era
tin
g p
aym
en
ts
3
96
(22
0)
-
1
76
60
1
16
34
.1%
84
13
5
Ve
nu
es a
nd
facili
tie
s
6
20
23
9
-
8
59
7
59
1
00
88
.4%
2
27
17
5
Re
nta
l a
nd
hirin
g
5
51
(44
8)
(10
)
93
40
53
43
.0%
10
-

164
DE
PA
RT
ME
NT
OF
EC
ON
OM
IC,
SM
AL
L B
US
INE
SS
DE
VE
LO
PM
EN
T,
TO
UR
ISM
AN
D E
NV
IRO
NM
EN
TA
L A
FF
AIR
S
VO
TE
3
AP
PR
OP
RIA
TIO
N S
TA
TE
ME
NT
for
the
ye
ar
en
de
d 3
1 M
arc
h 2
01
8
25
Pro
gra
mm
e 3
: E
CO
NO
MIC
AN
D S
MA
LL
BU
SIN
ES
S
DE
VE
LO
PM
EN
T
20
17
/18
20
16
/17
A
dju
ste
d
Ap
pro
pri
ati
on
S
hif
tin
g o
f F
un
ds
Vir
em
en
t F
ina
l A
pp
rop
riati
on
A
ctu
al
Ex
pe
nd
itu
re
Va
ria
nc
e
Exp
en
dit
ure
a
s %
of
fin
al
ap
pro
pri
ati
on
Fin
al
Ap
pro
pri
ati
on
A
ctu
al
ex
pe
nd
itu
re
R
'00
0
R'0
00
R'0
00
R'0
00
R
'00
0
R'0
00
%
R
'00
0
R'0
00
Tra
nsfe
rs a
nd
su
bsid
ies
1
46 4
85
(6 4
65
)
6 6
25
14
6 6
45
1
28
11
7
1
8 5
28
8
7.4
%
66
300
66
280
D
ep
art
me
nta
l a
ge
ncie
s
an
d a
cco
unts
1
09 4
25
(3
70
0)
7 0
00
1
12
72
5
1
12
77
0
(4
5)
1
00
.0%
55
55
1
5
5 5
51
Socia
l se
cu
rity
fu
nds
-
-
-
-
-
-
-
-
-
De
pa
rtm
en
tal a
ge
ncie
s
(no
n-b
usin
ess e
ntities)
1
09 4
25
(3 7
00
)
7 0
00
1
12
72
5
1
12
77
0
(4
5)
1
00
.0%
5
5 5
51
55
551
P
ub
lic c
orp
ora
tio
ns a
nd
p
rivate
en
terp
rises
35 2
60
(3 0
00
)
-
3
2 2
60
14
465
17
795
44
.8%
10
20
0
10
200
Pub
lic c
orp
ora
tio
ns
3
5 2
60
(3 0
00
)
-
32
260
14
465
17
795
4
4.8
%
1
0 2
00
10
200
O
ther
tra
nsfe
rs t
o p
ub
lic
co
rpo
ratio
ns
3
5 2
60
(3 0
00
)
-
32
260
14
465
17
795
4
4.8
%
10
20
0
1
0 2
00
Ho
use
ho
lds
1 8
00
23
5
(37
5)
1 6
60
8
82
7
78
53
.1%
5
49
52
9
Socia
l b
enefits
-
-
-
-
63
(6
3)
-
4
49
11
8
Oth
er
tra
nsfe
rs t
o
ho
use
ho
lds
1
800
23
5
(37
5)
1
66
0
8
19
8
41
49
.3%
1
00
41
1
Pa
ym
en
ts f
or
ca
pit
al
as
se
ts
(1 1
83
)
2 3
82
(20
0)
9
99
6
25
3
74
62
.6%
8
69
53
1
Ma
ch
ine
ry a
nd
e
quip
me
nt
(1 1
83
)
2 3
82
(20
0)
9
99
6
25
37
4
6
2.6
%
8
69
53
1
Oth
er
mach
ine
ry a
nd
e
quip
me
nt
(1 1
83
)
2 3
82
(20
0)
9
99
6
25
3
74
62
.6%
8
69
53
1
Pa
ym
en
t fo
r fi
na
nc
ial
as
se
ts
-
1
5
-
15
10
5
6
6.7
%
-
-
TO
TA
L
2
15
18
5
-
2 9
82
2
18
16
7
2
01
07
5
17
092
92
.2%
1
14
37
8
11
3 3
53

165
DE
PA
RT
ME
NT
OF
EC
ON
OM
IC,
SM
AL
L B
US
INE
SS
DE
VE
LO
PM
EN
T,
TO
UR
ISM
AN
D E
NV
IRO
NM
EN
TA
L A
FF
AIR
S
VO
TE
3
AP
PR
OP
RIA
TIO
N S
TA
TE
ME
NT
for
the
ye
ar
en
de
d 3
1 M
arc
h 2
01
8
26
3.1
IN
TE
RG
RA
TE
D E
CO
NO
MIC
DE
VE
LO
PM
EN
T
20
17
/18
20
16
/17
A
dju
ste
d
Ap
pro
pri
ati
on
S
hif
tin
g o
f F
un
ds
Vir
em
en
t F
inal
Ap
pro
pri
ati
on
A
ctu
al
Exp
en
dit
ure
V
ari
an
ce
Exp
en
dit
ure
a
s %
of
fin
al
ap
pro
pri
ati
on
Fin
al
Ap
pro
pri
ati
on
A
ctu
al
ex
pe
nd
itu
re
Eco
no
mic
cla
ss
ific
ati
on
R
'00
0
R'0
00
R
'00
0
R'0
00
R
'000
R
'00
0
%
R'0
00
R
'000
Cu
rre
nt
pa
ym
en
ts
18
922
(
1 0
23)
(2
12
)
17
687
2
3 2
85
(
5 5
98)
13
1.7
%
13
958
12
813
Com
pe
nsa
tio
n o
f e
mplo
yee
s
11
605
-
-
1
1 6
05
1
3 4
83
(
1 8
78)
11
6.2
%
9 3
40
8 5
82
Go
od
s a
nd
se
rvic
es
7 3
17
(1
023)
(2
12
)
6 0
82
9
802
(3
72
0)
1
61
.2%
4
61
8
4 2
31
Tra
nsfe
rs a
nd
su
bs
idie
s
30
260
(3
000
) -
2
7 2
60
9
46
5
17
795
3
4.7
%
10
200
10
226
Hig
he
r ed
uca
tio
n in
stitu
tio
ns
-
-
-
Pu
blic
co
rpo
ratio
ns a
nd
p
riva
te e
nte
rprises
30
260
(
3 0
00)
-
2
7 2
60
9
46
5
17
795
3
4.7
%
10
200
10
200
H
ou
se
ho
lds
-
-
-
-
-
-
-
- 2
6
Pa
ym
en
ts f
or
ca
pit
al a
sse
ts
-
-
-
-
-
-
-
98
64
Ma
ch
inery
an
d e
qu
ipm
en
t -
-
-
-
-
-
-
9
8
64
TO
TA
L
49
182
(
4 0
23)
(2
12
)
44
947
3
2 7
50
1
2 1
97
72
.9%
2
4 2
56
23
103

166
DE
PA
RT
ME
NT
OF
EC
ON
OM
IC,
SM
AL
L B
US
INE
SS
DE
VE
LO
PM
EN
T,
TO
UR
ISM
AN
D E
NV
IRO
NM
EN
TA
L A
FF
AIR
S
VO
TE
3
AP
PR
OP
RIA
TIO
N S
TA
TE
ME
NT
for
the
ye
ar
en
de
d 3
1 M
arc
h 2
01
8
27
3.2
EC
ON
OM
IC P
LA
NN
ING
2
01
7/1
8
20
16
/17
A
dju
ste
d
Ap
pro
pri
ati
on
S
hif
tin
g o
f F
un
ds
Vir
em
en
t F
inal
Ap
pro
pri
ati
on
A
ctu
al
Ex
pe
nd
itu
re
Va
ria
nc
e
Ex
pe
nd
itu
re
as
% o
f fi
na
l a
pp
rop
ria
tio
n
Fin
al
Ap
pro
pri
ati
on
A
ctu
al
ex
pe
nd
itu
re
Eco
no
mic
cla
ss
ific
ati
on
R
'00
0
R'0
00
R
'00
0
R'0
00
R
'00
0
R'0
00
%
R
'00
0
R'0
00
Cu
rre
nt
pa
ym
en
ts
19
839
3
42
3
(5
88
)
22
674
2
6 4
85
(
3 8
11)
11
6.8
%
14
619
12
586
Com
pe
nsa
tio
n o
f e
mplo
yee
s
15
057
-
-
1
5 0
57
1
9 0
01
(
3 9
44)
12
6.2
%
12
626
10
751
Go
od
s a
nd
se
rvic
es
4 7
82
3 4
23
(5
88
)
7 6
17
7 4
84
13
3
98
.3%
1
99
3
1 8
35
Tra
nsfe
rs a
nd
su
bs
idie
s
10
9 4
25
(
3 7
00)
7
00
0
11
2 7
25
1
12
77
0
(45
)
10
0.0
%
55
651
55
730
Dep
art
me
nta
l a
ge
ncie
s a
nd
a
cco
un
ts
10
9 4
25
(
3 7
00)
7
00
0
11
2 7
25
1
12
77
0
(45
)
10
0.0
%
55
551
55
551
Hou
se
ho
lds
-
-
-
-
-
-
-
10
0
17
9
Pa
ym
en
ts f
or
ca
pit
al a
sse
ts
65
4
1
-
10
6
17
3
(6
7)
16
3.2
%
87
54
Ma
ch
inery
an
d e
qu
ipm
en
t 6
5
41
-
1
06
1
73
(
67
) 1
63
.2%
8
7
54
TO
TA
L
12
9 3
29
(
236
) 6
41
2
13
5 5
05
1
39
42
8
(3
92
3)
10
2.9
%
70
357
68
370

167
DE
PA
RT
ME
NT
OF
EC
ON
OM
IC,
SM
AL
L B
US
INE
SS
DE
VE
LO
PM
EN
T,
TO
UR
ISM
AN
D E
NV
IRO
NM
EN
TA
L A
FF
AIR
S
VO
TE
3
AP
PR
OP
RIA
TIO
N S
TA
TE
ME
NT
for
the
ye
ar
en
de
d 3
1 M
arc
h 2
01
8
28
3.3
SM
AL
L B
US
INE
SS
DE
VE
LO
PM
EN
T
20
17
/18
20
16
/17
A
dju
ste
d
Ap
pro
pri
ati
on
S
hif
tin
g o
f F
un
ds
Vir
em
en
t F
ina
l A
pp
rop
riati
on
A
ctu
al
Ex
pe
nd
itu
re
Vari
an
ce
Ex
pe
nd
itu
re
as
% o
f fi
nal
ap
pro
pri
ati
on
Fin
al
Ap
pro
pri
ati
on
A
ctu
al
ex
pe
nd
itu
re
Eco
no
mic
cla
ss
ific
ati
on
R
'00
0
R'0
00
R
'00
0
R'0
00
R
'000
R
'00
0
%
R'0
00
R
'000
Cu
rre
nt
pa
ym
en
ts
31
122
1
66
8
(2
643)
30
147
2
2 5
53
7
59
4
74
.8%
1
0 3
24
12
835
Com
pe
nsa
tio
n o
f e
mplo
yee
s
19
028
-
(
2 0
00)
17
028
1
1 1
78
5
85
0
65
.6%
7
29
5
9 8
48
Go
od
s a
nd
se
rvic
es
12
094
1
66
8
(6
43
) 1
3 1
19
1
1 3
75
1
74
4
86
.7%
1
1 3
37
11
295
Tra
nsfe
rs a
nd
su
bs
idie
s
6 8
00
23
5
(3
75
) 6
66
0
5 8
82
77
8
88
.3%
4
49
32
4
Pu
blic
co
rpo
ratio
ns a
nd
priva
te
en
terp
rises
5 0
00
-
-
5 0
00
5 0
00
-
10
0.0
%
- -
Hou
se
ho
lds
1 8
00
23
5
(3
75
) 1
66
0
88
2
77
8
53
.1%
4
49
32
4
Pa
ym
en
ts f
or
ca
pit
al a
sse
ts
(1
24
8)
2 3
41
(2
00
) 8
93
45
2
44
1
50
.6%
6
84
41
3
Ma
ch
inery
an
d e
qu
ipm
en
t (
1 2
48)
2 3
41
(2
00
) 8
93
4
52
4
41
50
.6%
6
84
41
3
Pa
ym
en
ts f
or
fin
an
cia
l a
ss
ets
-
15
-
15
1
0
5
66
.7%
-
-
TO
TA
L
36
674
4
25
9
(3
218)
37
715
2
8 8
97
8
81
8
76
.6%
1
9 7
65
21
880
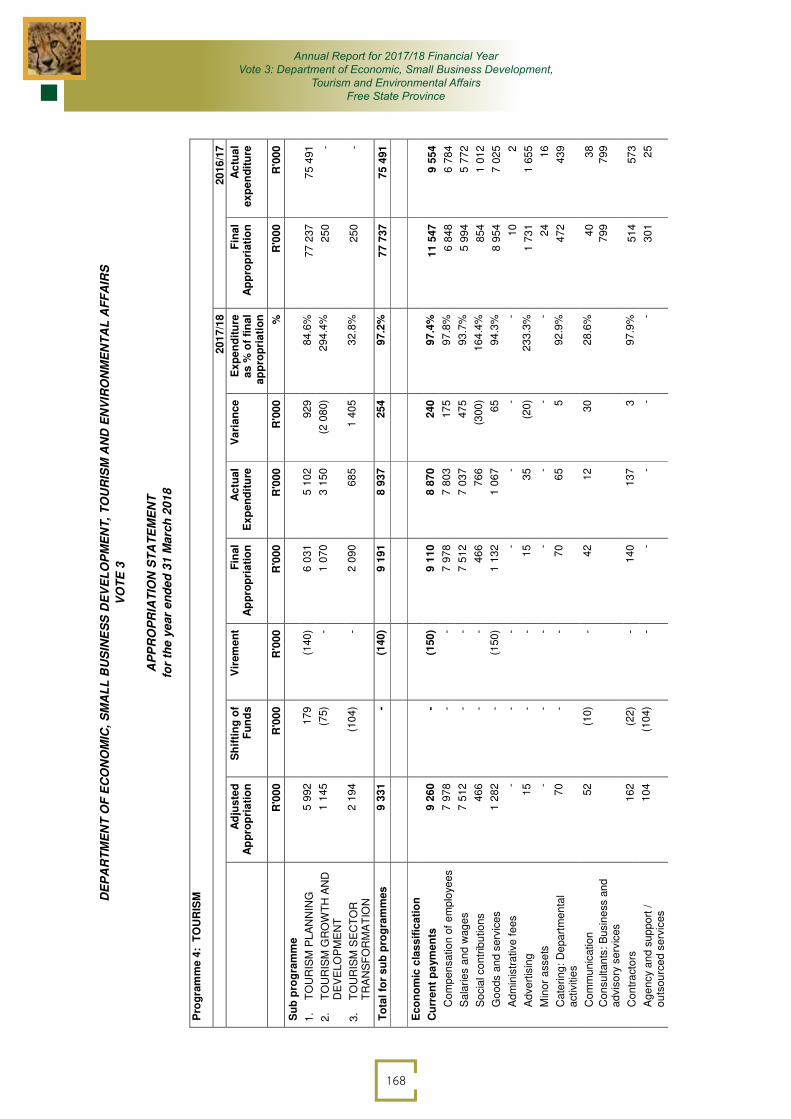
168
DE
PA
RT
ME
NT
OF
EC
ON
OM
IC,
SM
AL
L B
US
INE
SS
DE
VE
LO
PM
EN
T,
TO
UR
ISM
AN
D E
NV
IRO
NM
EN
TA
L A
FF
AIR
S
VO
TE
3
AP
PR
OP
RIA
TIO
N S
TA
TE
ME
NT
for
the
ye
ar
en
de
d 3
1 M
arc
h 2
01
8
29
Pro
gra
mm
e 4
: T
OU
RIS
M
201
7/1
8
20
16
/17
A
dju
ste
d
Ap
pro
pri
ati
on
S
hif
tin
g o
f F
un
ds
Vir
em
en
t F
inal
Ap
pro
pri
ati
on
A
ctu
al
Ex
pe
nd
itu
re
Va
ria
nc
e
Ex
pe
nd
itu
re
as
% o
f fi
na
l a
pp
rop
ria
tio
n
Fin
al
Ap
pro
pri
ati
on
A
ctu
al
ex
pe
nd
itu
re
R
'00
0
R'0
00
R
'00
0
R'0
00
R
'00
0
R'0
00
%
R
'00
0
R'0
00
Su
b p
rog
ram
me
1.
TO
UR
ISM
PL
AN
NIN
G
5 9
92
17
9
(1
40
)
6 0
31
5 1
02
92
9
84
.6%
7
7 2
37
75
491
2.
TO
UR
ISM
GR
OW
TH
AN
D
DE
VE
LO
PM
EN
T
1 1
45
(7
5)
-
1 0
70
3 1
50
(2
08
0)
29
4.4
%
25
0
-
3.
TO
UR
ISM
SE
CT
OR
T
RA
NS
FO
RM
AT
ION
2 1
94
(1
04)
-
2 0
90
68
5
1 4
05
32
.8%
2
50
-
To
tal
for
su
b p
rog
ram
mes
9 3
31
-
(1
40
)
9 1
91
8 9
37
25
4
97
.2%
7
7 7
37
75
491
Eco
no
mic
cla
ss
ific
ati
on
Cu
rre
nt
pa
ym
en
ts
9 2
60
-
(1
50
)
9 1
10
8 8
70
24
0
97
.4%
1
1 5
47
9 5
54
Co
mp
en
sa
tio
n o
f e
mp
loye
es
7 9
78
-
-
7 9
78
7 8
03
17
5
97
.8%
6
84
8
6 7
84
Sa
larie
s a
nd
wag
es
7 5
12
-
-
7 5
12
7 0
37
47
5
93
.7%
5
99
4
5 7
72
So
cia
l co
ntr
ibu
tio
ns
46
6
-
-
46
6
76
6
(3
00
) 1
64
.4%
8
54
1 0
12
Go
ods a
nd
se
rvic
es
1 2
82
-
(1
50
)
1 1
32
1 0
67
65
9
4.3
%
8 9
54
7 0
25
Ad
min
istr
ative
fe
es
-
-
-
-
-
-
-
10
2
Ad
ve
rtis
ing
15
-
-
1
5
35
(
20
) 2
33
.3%
1
73
1
1 6
55
Min
or
asse
ts
-
-
-
-
-
-
-
24
16
Ca
terin
g:
De
pa
rtm
en
tal
activitie
s
70
-
-
7
0
65
5
9
2.9
%
47
2
43
9
Co
mm
un
ica
tio
n
Co
nsu
ltan
ts:
Busin
ess a
nd
a
dvis
ory
se
rvic
es
52
(
10)
-
42
1
2
30
2
8.6
%
40
79
9
38
79
9
Co
ntr
acto
rs
16
2
(2
2)
-
14
0
13
7
3
97
.9%
5
14
57
3
Ag
en
cy
an
d s
up
po
rt /
ou
tsou
rce
d s
erv
ices
10
4
(1
04)
-
-
-
-
-
30
1
25

169
DE
PA
RT
ME
NT
OF
EC
ON
OM
IC,
SM
AL
L B
US
INE
SS
DE
VE
LO
PM
EN
T,
TO
UR
ISM
AN
D E
NV
IRO
NM
EN
TA
L A
FF
AIR
S
VO
TE
3
AP
PR
OP
RIA
TIO
N S
TA
TE
ME
NT
for
the
ye
ar
en
de
d 3
1 M
arc
h 2
01
8
30
Pro
gra
mm
e 4
: T
OU
RIS
M
201
7/1
8
20
16
/17
A
dju
ste
d
Ap
pro
pri
ati
on
S
hif
tin
g o
f F
un
ds
Vir
em
en
t F
inal
Ap
pro
pri
ati
on
A
ctu
al
Ex
pe
nd
itu
re
Va
ria
nc
e
Ex
pe
nd
itu
re
as
% o
f fi
na
l a
pp
rop
ria
tio
n
Fin
al
Ap
pro
pri
ati
on
A
ctu
al
ex
pe
nd
itu
re
R
'00
0
R'0
00
R
'00
0
R'0
00
R
'00
0
R'0
00
%
R
'00
0
R'0
00
Invento
ry:
Ma
teria
ls a
nd
su
pp
lies
-
-
-
-
-
-
-
20
0
-
Co
nsu
ma
ble
sup
plie
s
13
-
-
1
3
5
8
38
.5%
1
30
11
7
Co
nsu
ma
ble
: S
tatio
ne
ry,
prin
tin
g a
nd
off
ice
su
pp
lies
64
(
30)
-
34
2
6
8
76
.5%
5
8
44
Tra
ve
l a
nd
su
bsis
ten
ce
63
7
30
(
20
)
64
7
69
0
(2
3)
10
3.4
%
2 7
70
2 1
18
Tra
inin
g a
nd
deve
lop
me
nt
-
13
6
(1
30
)
6
-
13
6
-
35
1
34
6
Op
era
tin
g p
aym
en
ts
60
-
-
6
0
-
60
-
Ve
nu
es a
nd
facili
tie
s
10
5
-
-
10
5
97
8
9
2.4
%
1 5
24
82
9
Re
nta
l a
nd
hirin
g
-
-
-
-
-
-
-
30
24
Tra
nsfe
rs a
nd
su
bs
idie
s
30
-
1
0
40
3
6
4
90
.0%
6
1 6
32
61
581
De
pa
rtm
enta
l a
gencie
s a
nd
a
cco
un
ts
-
-
-
-
-
-
-
61
532
61
532
De
pa
rtm
enta
l a
gencie
s
- -
- -
- -
- 6
1 5
32
61
532
Ho
use
ho
lds
30
-
1
0
40
3
6
4
90
.0%
1
00
49
So
cia
l b
en
efits
-
-
1
0
10
3
6
(2
6)
3
60
.0%
-
-
Oth
er
transfe
rs t
o
ho
use
ho
lds
30
- -
30
- 3
0
- 1
00
49
Pa
ym
en
ts f
or
ca
pit
al a
sse
ts
41
-
-
4
1
31
1
0
75
.6%
3
01
99
Ma
chin
ery
an
d e
qu
ipm
en
t 4
1
-
-
41
3
1
10
7
5.6
%
30
1
99
Oth
er
ma
ch
ine
ry a
nd
e
qu
ipm
en
t
41
-
-
4
1
31
1
0
75
.6%
3
01
99

170
DE
PA
RT
ME
NT
OF
EC
ON
OM
IC,
SM
AL
L B
US
INE
SS
DE
VE
LO
PM
EN
T,
TO
UR
ISM
AN
D E
NV
IRO
NM
EN
TA
L A
FF
AIR
S
VO
TE
3
AP
PR
OP
RIA
TIO
N S
TA
TE
ME
NT
for
the
ye
ar
en
de
d 3
1 M
arc
h 2
01
8
31
Pro
gra
mm
e 4
: T
OU
RIS
M
201
7/1
8
20
16
/17
A
dju
ste
d
Ap
pro
pri
ati
on
S
hif
tin
g o
f F
un
ds
Vir
em
en
t F
inal
Ap
pro
pri
ati
on
A
ctu
al
Ex
pe
nd
itu
re
Va
ria
nc
e
Ex
pe
nd
itu
re
as
% o
f fi
na
l a
pp
rop
ria
tio
n
Fin
al
Ap
pro
pri
ati
on
A
ctu
al
ex
pe
nd
itu
re
R
'00
0
R'0
00
R
'00
0
R'0
00
R
'00
0
R'0
00
%
R
'00
0
R'0
00
Pa
ym
en
ts f
or
fin
an
cia
l a
sse
ts
- -
- -
- -
- 2
2
To
tal
9 3
31
-
(1
40
)
9 1
91
8 9
37
25
4
97
.2%
7
7 7
37
7
5 4
91

171
DE
PA
RT
ME
NT
OF
EC
ON
OM
IC,
SM
AL
L B
US
INE
SS
DE
VE
LO
PM
EN
T,
TO
UR
ISM
AN
D E
NV
IRO
NM
EN
TA
L A
FF
AIR
S
VO
TE
3
AP
PR
OP
RIA
TIO
N S
TA
TE
ME
NT
for
the
ye
ar
en
de
d 3
1 M
arc
h 2
01
8
32
4.1
.TO
UR
ISM
PL
AN
NIN
G
201
7/1
8
20
16
/17
A
dju
ste
d
Ap
pro
pri
ati
on
S
hif
tin
g o
f F
un
ds
Vir
em
en
t F
inal
Ap
pro
pri
ati
on
A
ctu
al
Exp
en
dit
ure
V
ari
an
ce
Ex
pe
nd
itu
re
as
% o
f fi
na
l a
pp
rop
ria
tio
n
Fin
al
Ap
pro
pri
ati
on
A
ctu
al
ex
pe
nd
itu
re
Eco
no
mic
cla
ss
ific
ati
on
R
'00
0
R'0
00
R
'00
0
R'0
00
R
'000
R
'00
0
%
R'0
00
R
'00
0
Cu
rre
nt
pa
ym
en
ts
5 9
21
17
9
(1
50
) 5
95
0
5 0
71
87
9
83
.1%
1
1 0
47
9 5
54
Com
pe
nsa
tio
n o
f e
mplo
yee
s
4 9
78
-
-
4 9
78
4 1
77
80
1
83
.9%
6
84
8
6 7
84
Go
od
s a
nd
se
rvic
es
94
3
17
9
(150
)
97
2
894
7
8
79
.7%
8
45
4
7 0
25
Tra
nsfe
rs a
nd
su
bs
idie
s
30
-
10
4
0
-
40
-
6
1 6
32
61
581
Dep
art
me
nta
l ag
encie
s
an
d
acco
un
ts
-
-
-
-
-
-
-
61
532
61
532
Hou
se
ho
lds
30
-
10
4
0
-
40
-
1
00
49
Pa
ym
en
ts f
or
ca
pit
al a
sse
ts
41
-
-
41
3
1
10
7
5.6
%
30
1
99
Ma
ch
inery
an
d e
qu
ipm
en
t 4
1
-
-
41
3
1
10
7
5.6
%
30
1
99
Pa
ym
en
ts f
or
fin
an
cia
l a
sse
ts
- -
- -
- -
- 2
2
TO
TA
L
5 9
92
17
9
(1
40
)
6 0
31
5 1
02
92
9
84
.6%
7
7 2
37
75
491

172
DE
PA
RT
ME
NT
OF
EC
ON
OM
IC,
SM
AL
L B
US
INE
SS
DE
VE
LO
PM
EN
T,
TO
UR
ISM
AN
D E
NV
IRO
NM
EN
TA
L A
FF
AIR
S
VO
TE
3
AP
PR
OP
RIA
TIO
N S
TA
TE
ME
NT
for
the
ye
ar
en
de
d 3
1 M
arc
h 2
01
8
33
4.2
TO
UR
ISM
GR
OW
TH
AN
D D
EV
EL
OP
ME
NT
20
17
/18
20
16
/17
A
dju
ste
d
Ap
pro
pri
ati
on
S
hif
tin
g o
f F
un
ds
Vir
em
en
t F
ina
l A
pp
rop
ria
tio
n
Ac
tua
l E
xp
en
dit
ure
V
ari
an
ce
Exp
en
dit
ure
a
s %
of
fin
al
ap
pro
pri
ati
on
Fin
al
Ap
pro
pri
ati
on
A
ctu
al
ex
pe
nd
itu
re
Eco
no
mic
cla
ss
ific
ati
on
R
'00
0
R'0
00
R
'000
R
'00
0
R'0
00
R
'00
0
%
R'0
00
R
'000
Cu
rre
nt
pa
ym
en
ts
1 1
45
(7
5)
-
1 0
70
3 1
14
(2
04
4)
29
1.0
%
25
0
-
Com
pe
nsa
tio
n o
f e
mplo
yee
s
1 0
00
1 0
00
2 9
58
(1 9
58
) 2
95
.8%
Go
od
s a
nd
se
rvic
es
14
5
(7
5)
-
70
1
56
(
86
) 2
22
.9%
2
50
-
Tra
nsfe
rs a
nd
su
bs
idie
s
- -
- -
36
(36
) -
- -
Hou
se
ho
lds
- -
- -
36
(36
) -
- -
TO
TA
L
1 1
45
(7
5)
-
1 0
70
3 1
50
(2
08
0)
29
4.4
%
25
0
-

173
DE
PA
RT
ME
NT
OF
EC
ON
OM
IC,
SM
AL
L B
US
INE
SS
DE
VE
LO
PM
EN
T,
TO
UR
ISM
AN
D E
NV
IRO
NM
EN
TA
L A
FF
AIR
S
VO
TE
3
AP
PR
OP
RIA
TIO
N S
TA
TE
ME
NT
for
the
ye
ar
en
de
d 3
1 M
arc
h 2
01
8
32
4.3
. T
OU
RIS
M S
EC
TO
R T
RA
NS
FO
RM
AT
ION
20
17
/18
20
16
/17
A
dju
ste
d
Ap
pro
pri
ati
on
S
hif
tin
g o
f F
un
ds
Vir
em
en
t F
ina
l A
pp
rop
ria
tio
n
Ac
tua
l E
xp
en
dit
ure
V
ari
an
ce
Ex
pe
nd
itu
re
as
% o
f fi
na
l a
pp
rop
riati
on
Fin
al
Ap
pro
pri
ati
on
A
ctu
al
ex
pe
nd
itu
re
Eco
no
mic
cla
ss
ific
ati
on
R
'00
0
R'0
00
R
'00
0
R'0
00
R'0
00
R
'00
0
%
R'0
00
R
'000
Cu
rre
nt
pa
ym
en
ts
2 1
94
(1
04
) -
2
090
68
5
1 4
05
32
.8%
2
50
-
Com
pe
nsa
tio
n o
f e
mplo
yee
s
2 0
00
2 0
00
66
8
1 3
32
33
.4%
Go
od
s a
nd
se
rvic
es
19
4
(1
04
) -
9
0
17
7
3
18
.9%
2
50
-
TO
TA
L
2 1
94
(1
04
) -
2
090
68
5
1 4
05
32
.8%
2
50
-

174
DEPARTMENT OF ECONOMIC, SMALL BUSINESS DEVELOPMENT, TOURISM AND
ENVIRONMENTAL AFFAIRS
VOTE 3
NOTES TO THE APPROPRIATION STATEMENT
for the year ended 31 March 2018
- 35 -
1. Detail of transfers and subsidies as per Appropriation Act (after Virement):
Detail of these transactions can be viewed in the note on Transfers and subsidies, disclosure
notes and Annexure 1 (A-H) to the Annual Financial Statements.
2. Detail of specifically and exclusively appropriated amounts voted (after Virement):
Detail of these transactions can be viewed in note 1 (Annual Appropriation) to the Annual
Financial Statements.
3. Detail on payments for financial assets
Detail of these transactions per programme can be viewed in the note on Payments for
financial assets to the Annual Financial Statements.
4. Explanations of material variances from Amounts Voted (after Virement):
4.1 Per programme Final
Appropriation
Actual
Expenditure
Variance
R’000
Variance as a
% of Final
Appropriation
1. ADMINISTRATION 141 099 141 056 43 0.03
2. ENVIRONMENTAL
AFFAIRS
136 691 137 858 (1 167) (0.85)
3. ECONOMIC
DEVELOPMENT
218 167 201 075 17 092 7.83
4. TOURISM 9 191 8 937 254 2.76
4.2 Per economic classification Final
Appropriation
Actual
Expenditure
Variance Variance as a
% of Final
Appropriation
R’000 R’000 R’000 R’000
Current payments
Compensation of employees 232 465 235 249 (2 784) (1 20)
Goods and services 113 017 115 289 (2 272) (2.01)
Transfers and subsidies
Departmental agencies and
accounts
112 925 112 809 116 0.10
Public corporations and private
enterprises
32 260 14 465 17 795 55.16
Households 2 450 1 632 818 33.39
Payments for capital assets
Buildings and other fixed structures 3 705 3 892 (187) (5.05)
Machinery and equipment
Software and other intangible assets
7 951
345
5 549
-
2 402
345
30.21
100.00
Payments for financial assets 30 41 (11) (36.67)

175
DEPARTMENT OF ECONOMIC, SMALL BUSINESS DEVELOPMENT, TOURISM AND
ENVIRONMENTAL AFFAIRS
VOTE 3
NOTES TO THE APPROPRIATION STATEMENT
for the year ended 31 March 2018
- 36 -
The department spent 100% of the budget allocated.
4.3 Per conditional grant Final
Appropriation
Actual
Expenditure
Variance Variance as a
% of Final
Appropriation
R’000 R’000 R’000 R’000
EPWP Incentive Grant 2 000 1 820 180 9.00
The department spent 91% on conditional grants, The R180 that was not spent was due to employees
who did not come to work and were not paid as such.

176
DEPARTMENT OF ECONOMIC, SMALL BUSINESS DEVELOPMENT, TOURISM AND
ENVIRONMENTAL AFFAIRS
VOTE 3 STATEMENT OF FINANCIAL PERFORMANCE
for the year ended 31 March 2018
- 37 -
Note 2017/18 2016/17
R'000 R'000
REVENUE
Annual appropriation 1 505 148 474 996
Departmental revenue 2 - -
TOTAL REVENUE 505 148 474 996
EXPENDITURE
Current expenditure
Compensation of employees 4 235 249 218 930
Goods and services 5 115 289 99 610
Aid assistance 3 51 403
Total current expenditure 350 589 318 943
Transfers and subsidies
Transfers and subsidies 7 128 904 128 677
Total transfers and subsidies 128 904 128 677
Expenditure for capital assets
Tangible assets 8 9 443 15 452
Total expenditure for capital assets 9 443 15 452
Payments for financial assets 6 41 407
TOTAL EXPENDITURE 488 977 463 479
SURPLUS/(DEFICIT) FOR THE YEAR 16 171 11 517
Reconciliation of Net Surplus/(Deficit) for the year
Voted funds 16 222 11 920
Annual appropriation 16 042 11 154
Conditional grants 180 766
Aid assistance 3 (51) (403)
SURPLUS/(DEFICIT) FOR THE YEAR 16 171 11 517

177
DEPARTMENT OF ECONOMIC, SMALL BUSINESS DEVELOPMENT, TOURISM AND
ENVIRONMENTAL AFFAIRS
VOTE 3
STATEMENT OF FINANCIAL POSITION
as at 31 March 2018
- 38 -
Note 2017/18 2016/17
R'000 R'000
ASSETS
Current assets
17 379 12 284
Unauthorised expenditure 9 1 167 -
Cash and cash equivalents 10 530 10 620
Prepayments and advances 11 13 617 17
Receivables 12 2 065 1 647
Non-current assets
2 126 1 753
Receivables 12 2 126 1 753
TOTAL ASSETS 19 505 14 037
LIABILITIES
Current liabilities
18 439 13 108
Voted funds to be surrendered to the Revenue Fund 13 17 389 11 920
Departmental revenue and NRF Receipts to be
surrendered to the Revenue Fund
14 801 894
Payables 15 6 -
Aid assistance unutilised 3 243 294
TOTAL LIABILITIES 18 439 13 108
NET ASSETS 1 066 929
Note 2017/18 2016/17
R'000 R'000
Represented by:
Recoverable revenue 1 066 929
TOTAL 1 066 929

178
DEPARTMENT OF ECONOMIC, SMALL BUSINESS DEVELOPMENT, TOURISM AND
ENVIRONMENTAL AFFAIRS
VOTE 3
STATEMENT OF CHANGES IN NET ASSETS
for the year ended 31 March 2018
- 39 -
Note 2017/18 2016/17
R'000 R'000
Recoverable revenue
Opening balance 929 386
Transfers: 137 543
Irrecoverable amounts written off 6.1 19 264
Debts revised 62 -
Debts recovered (included in departmental
receipts)
(1 093) (445)
Debts raised 1 147 724
Closing balance 1 066 929
TOTAL 1 066 929

179
DEPARTMENT OF ECONOMIC, SMALL BUSINESS DEVELOPMENT, TOURISM AND
ENVIRONMENTAL AFFAIRS
VOTE 3
CASH FLOW STATEMENT
for the year ended 31 March 2018
- 40 -
Note 2017/18 2016/17
R'000 R’000
CASH FLOWS FROM OPERATING ACTIVITIES
Receipts 518 956 486 332
Annual appropriated funds received 1.1 505 148 474 996
Departmental revenue received 2 13 780 11 308
Interest received 2.3 28 28
Net (increase)/decrease in working capital (15 552) 72
Surrendered to Revenue Fund (33 947) (16 931)
Current payments (349 422) (306 380)
Payments for financial assets (41) (407)
Transfers and subsidies paid (128 904) (141 240)
Net cash flow available from operating activities 16 (8 910) 21 446
CASH FLOWS FROM INVESTING ACTIVITIES
Payments for capital assets 8 (9 443) (15 452)
Proceeds from sale of capital assets 2.4 8 126 -
Net cash flows from investing activities (1 317) (15 452)
CASH FLOWS FROM FINANCING ACTIVITIES
Increase/(decrease) in net assets 137 543
Net cash flows from financing activities 137 543
Net increase/(decrease) in cash and cash equivalents (10 090) 6 537
Cash and cash equivalents at beginning of period 10 620 4 083
Cash and cash equivalents at end of period 16 530 10 620

180
DEPARTMENT OF ECONOMIC, SMALL BUSINESS DEVELOPMENT, TOURISM AND
ENVIRONMENTAL AFFAIRS
VOTE 3
NOTES TO THE ANNUAL FINANCIAL STATEMENTS
for the year ended 31 March 2018
- 41 -
PART A: ACCOUNTING POLICIES
Summary of significant accounting policies
The financial statements have been prepared in accordance with the following policies, which have been applied consistently in all material aspects, unless otherwise indicated. Management has concluded that the financial statements present fairly the department’s primary and secondary information.
The historical cost convention has been used, except where otherwise indicated. Management has used assessments and estimates in preparing the annual financial statements. These are based on the best information available at the time of preparation.
Where appropriate and meaningful, additional information has been disclosed to enhance the usefulness
of the financial statements and to comply with the statutory requirements of the Public Finance
Management Act (PFMA), Act 1 of 1999 (as amended by Act 29 of 1999), and the Treasury Regulations
issued in terms of the PFMA and the annual Division of Revenue Act.
1 Basis of preparation
The financial statements have been prepared in accordance with the Modified Cash Standard.
2 Going concern
The financial statements have been prepared on a going concern basis.
3 Presentation currency
Amounts have been presented in the currency of the South African Rand (R) which is also the
functional currency of the department.
4 Rounding
Unless otherwise stated financial figures have been rounded to the nearest one thousand Rand
(R’000).
5 Foreign currency translation
Cash flows arising from foreign currency transactions are translated into South African Rands
using the spot exchange rates prevailing at the date of payment / receipt.
6 Comparative information
6.1 Prior period comparative information
Prior period comparative information has been presented in the current year’s financial
statements. Where necessary figures included in the prior period financial statements have been
reclassified to ensure that the format in which the information is presented is consistent with the
format of the current year’s financial statements.
6.2 Current year comparison with budget
A comparison between the approved, final budget and actual amounts for each programme and
economic classification is included in the appropriation statement.

181
DEPARTMENT OF ECONOMIC, SMALL BUSINESS DEVELOPMENT, TOURISM AND
ENVIRONMENTAL AFFAIRS
VOTE 3
NOTES TO THE ANNUAL FINANCIAL STATEMENTS
for the year ended 31 March 2018
- 42 -
7 Revenue
7.1 Appropriated funds
Appropriated funds comprises of departmental allocations.
Appropriated funds are recognised in the statement of financial performance on the date the
appropriation becomes effective. Adjustments made in terms of the adjustments budget process
are recognised in the statement of financial performance on the date the adjustments become
effective.
The net amount of any appropriated funds due to / from the relevant revenue fund at the
reporting date is recognised as a payable / receivable in the statement of financial position.
7.2 Departmental revenue
Departmental revenue is recognised in the statement of financial performance when received
and is subsequently paid into the relevant revenue fund, unless stated otherwise.
Any amount owing to the relevant revenue fund at the reporting date is recognised as a payable
in the statement of financial position.
7.3 Accrued departmental revenue
Accruals in respect of departmental revenue (excluding tax revenue) are recorded in the notes to
the financial statements when:
• it is probable that the economic benefits or service potential associated with the transaction will flow to the department; and
• the amount of revenue can be measured reliably.
The accrued revenue is measured at the fair value of the consideration receivable.
Accrued tax revenue (and related interest and / penalties) is measured at amounts receivable
from collecting agents.
Write-offs are made according to the department’s debt write-off policy
8 Expenditure
8.1 Compensation of employees
8.1.1 Salaries and wages
Salaries and wages are recognised in the statement of financial performance on the date of
payment.
8.1.2 Social contributions
Social contributions made by the department in respect of current employees are recognised in
the statement of financial performance on the date of payment.
Social contributions made by the department in respect of ex-employees are classified as
transfers to households in the statement of financial performance on the date of payment.

182
DEPARTMENT OF ECONOMIC, SMALL BUSINESS DEVELOPMENT, TOURISM AND
ENVIRONMENTAL AFFAIRS
VOTE 3
NOTES TO THE ANNUAL FINANCIAL STATEMENTS
for the year ended 31 March 2018
- 43 -
8.2 Other expenditure
Other expenditure (such as goods and services, transfers and subsidies and payments for capital
assets) is recognised in the statement of financial performance on the date of payment. The
expense is classified as a capital expense if the total consideration paid is more than the
capitalisation threshold.
8.3 Accruals and payables not recognised
Accruals and payables not recognised are recorded in the notes to the financial statements when
the goods are received or, in the case of services, when they are rendered to the department or
in the case of transfers and subsidies when they are due and payable.
Accruals and payables not recognised are measured at cost.
8.4 Leases
8.4.1 Operating leases
Operating lease payments made during the reporting period are recognised as current
expenditure in the statement of financial performance on the date of payment.
The operating lease commitments are recorded in the notes to the financial statements.
8.4.2 Finance leases
Finance lease payments made during the reporting period are recognised as capital expenditure
in the statement of financial performance on the date of payment.
The finance lease commitments are recorded in the notes to the financial statements and are not
apportioned between the capital and interest portions.
Finance lease assets acquired at the end of the lease term are recorded and measured at the
lower of:
• cost, being the fair value of the asset; or
• the sum of the minimum lease payments made, including any payments made to acquire
ownership at the end of the lease term, excluding interest.
9 Aid Assistance
9.1 Aid assistance received
Aid assistance received in cash is recognised in the statement of financial performance when
received. In-kind aid assistance is recorded in the notes to the financial statements on the date
of receipt and is measured at fair value.
Aid assistance not spent for the intended purpose and any unutilised funds from aid assistance
that are required to be refunded to the donor are recognised as a payable in the statement of
financial position.
9.2 Aid assistance paid
Aid assistance paid is recognised in the statement of financial performance on the date of
payment. Aid assistance payments made prior to the receipt of funds are recognised as a

183
DEPARTMENT OF ECONOMIC, SMALL BUSINESS DEVELOPMENT, TOURISM AND
ENVIRONMENTAL AFFAIRS
VOTE 3
NOTES TO THE ANNUAL FINANCIAL STATEMENTS
for the year ended 31 March 2018
- 44 -
receivable in the statement of financial position.
10 Cash and cash equivalents
Cash and cash equivalents are stated at cost in the statement of financial position.
Bank overdrafts are shown separately on the face of the statement of financial position as a
current liability.
For the purposes of the cash flow statement, cash and cash equivalents comprise cash on hand,
deposits held, other short-term highly liquid investments and bank overdrafts.
11 Prepayments and advances
Prepayments and advances are recognised in the statement of financial position when the
department receives or disburses the cash.
Prepayments and advances are initially and subsequently measured at cost.
12 Receivables
Receivables are recognised in the statement of financial position at cost plus accrued interest,
where interest is charged, less amounts already settled or written-off. Write-offs are made
according to the department’s write-off policy.
13 Financial assets
13.1 Financial assets (not covered elsewhere)
A financial asset is recognised initially at its cost plus transaction costs that are directly
attributable to the acquisition or issue of the financial asset.
At the reporting date, a department shall measure its financial assets at cost, less amounts
already settled or written-off, except for recognised loans and receivables, which are measured
at cost plus accrued interest, where interest is charged, less amounts already settled or written-
off.
13.2 Impairment of financial assets
Where there is an indication of impairment of a financial asset, an estimation of the reduction in
the recorded carrying value, to reflect the best estimate of the amount of the future economic
benefits expected to be received from that asset, is recorded in the notes to the financial
statements.
14 Payables
Payables recognised in the statement of financial position are recognised at cost.
15 Capital Assets

184
DEPARTMENT OF ECONOMIC, SMALL BUSINESS DEVELOPMENT, TOURISM AND
ENVIRONMENTAL AFFAIRS
VOTE 3
NOTES TO THE ANNUAL FINANCIAL STATEMENTS
for the year ended 31 March 2018
- 45 -
15.1 Immovable capital assets
Immovable assets reflected in the asset register of the department are recorded in the notes to
the financial statements at cost or fair value where the cost cannot be determined reliably.
Immovable assets acquired in a non-exchange transaction are recorded at fair value at the date
of acquisition. Immovable assets are subsequently carried in the asset register at cost and are
not currently subject to depreciation or impairment.
Subsequent expenditure of a capital nature forms part of the cost of the existing asset when
ready for use.
Additional information on immovable assets not reflected in the assets register is provided in the
notes to financial statements.
15.2 Movable capital assets
Movable capital assets are initially recorded in the notes to the financial statements at cost.
Movable capital assets acquired through a non-exchange transaction is measured at fair value as
at the date of acquisition.
Where the cost of movable capital assets cannot be determined reliably, the movable capital
assets are measured at fair value and where fair value cannot be determined; the movable
assets are measured at R1.
All assets acquired prior to 1 April 2005 (or a later date as approved by the OAG) may be
recorded at R1.
Movable capital assets are subsequently carried at cost and are not subject to depreciation or
impairment.
Subsequent expenditure that is of a capital nature is added to the cost of the asset at the end of
the capital project unless the movable asset is recorded by another department/entity in which
case the completed project costs are transferred to that department.
15.3 Intangible assets
Intangible assets are initially recorded in the notes to the financial statements at cost. Intangible
assets acquired through a non-exchange transaction are measured at fair value as at the date of
acquisition.
Internally generated intangible assets are recorded in the notes to the financial statements when
the department commences the development phase of the project.
Where the cost of intangible assets cannot be determined reliably, the intangible capital assets
are measured at fair value and where fair value cannot be determined; the intangible assets are
measured at R1.
All assets acquired prior to 1 April 2005 (or a later date as approved by the OAG) may be
recorded at R1.
Intangible assets are subsequently carried at cost and are not subject to depreciation or
impairment.
Subsequent expenditure that is of a capital nature is added to the cost of the asset at the end of

185
DEPARTMENT OF ECONOMIC, SMALL BUSINESS DEVELOPMENT, TOURISM AND
ENVIRONMENTAL AFFAIRS
VOTE 3
NOTES TO THE ANNUAL FINANCIAL STATEMENTS
for the year ended 31 March 2018
- 46 -
the capital project unless the intangible asset is recorded by another department/entity in which
case the completed project costs are transferred to that department.
15.4 Project Costs: Work-in-progress
Expenditure of a capital nature is initially recognised in the statement of financial performance at
cost when paid.
Amounts paid towards capital projects are separated from the amounts recognised and
accumulated in work-in-progress until the underlying asset is ready for use. Once ready for use,
the total accumulated payments are recorded in an asset register. Subsequent payments to
complete the project are added to the capital asset in the asset register.
Where the department is not the custodian of the completed project asset, the asset is
transferred to the custodian subsequent to completion.
16 Provisions and Contingents
16.1 Provisions
Provisions are recorded in the notes to the financial statements when there is a present legal or
constructive obligation to forfeit economic benefits as a result of events in the past and it is
probable that an outflow of resources embodying economic benefits or service potential will be
required to settle the obligation and a reliable estimate of the obligation can be made. The
provision is measured as the best estimate of the funds required to settle the present obligation
at the reporting date.
16.2 Contingent liabilities
Contingent liabilities are recorded in the notes to the financial statements when there is a
possible obligation that arises from past events, and whose existence will be confirmed only by
the occurrence or non-occurrence of one or more uncertain future events not within the control of
the department or when there is a present obligation that is not recognised because it is not
probable that an outflow of resources will be required to settle the obligation or the amount of the
obligation cannot be measured reliably.
16.3 Contingent assets
Contingent assets are recorded in the notes to the financial statements when a possible asset
arises from past events, and whose existence will be confirmed by the occurrence or non-
occurrence of one or more uncertain future events not within the control of the department.
16.4 Commitments
Commitments (other than for transfers and subsidies) are recorded at cost in the notes to the
financial statements when there is a contractual arrangement or an approval by management in a
manner that raises a valid expectation that the department will discharge its responsibilities
thereby incurring future expenditure that will result in the outflow of cash.
17 Unauthorised expenditure
Unauthorised expenditure is recognised in the statement of financial position until such time as
the expenditure is either:

186
DEPARTMENT OF ECONOMIC, SMALL BUSINESS DEVELOPMENT, TOURISM AND
ENVIRONMENTAL AFFAIRS
VOTE 3
NOTES TO THE ANNUAL FINANCIAL STATEMENTS
for the year ended 31 March 2018
- 47 -
• approved by the Provincial Legislature with funding and the related funds are received; or
• approved by the Provincial Legislature without funding and is written off against the
appropriation in the statement of financial performance; or
• transferred to receivables for recovery.
Unauthorised expenditure is measured at the amount of the confirmed unauthorised expenditure.
18 Fruitless and wasteful expenditure
Fruitless and wasteful expenditure is recorded in the notes to the financial statements when
confirmed. The amount recorded is equal to the total value of the fruitless and or wasteful
expenditure incurred.
Fruitless and wasteful expenditure is removed from the notes to the financial statements when it
is resolved or transferred to receivables for recovery.
Fruitless and wasteful expenditure receivables are measured at the amount that is expected to
be recoverable and are de-recognised when settled or subsequently written-off as irrecoverable.
19 Irregular expenditure
Irregular expenditure is recorded in the notes to the financial statements when confirmed. The
amount recorded is equal to the value of the irregular expenditure incurred unless it is
impracticable to determine, in which case reasons therefor are provided in the note.
Irregular expenditure is removed from the note when it is either condoned by the relevant
authority, transferred to receivables for recovery or not condoned and is not recoverable.
Irregular expenditure receivables are measured at the amount that is expected to be recoverable
and are de-recognised when settled or subsequently written-off as irrecoverable.
20 Changes in accounting policies, accounting estimates and errors
Changes in accounting policies that are effected by management have been applied
retrospectively in accordance with MCS requirements, except to the extent that it is impracticable
to determine the period-specific effects or the cumulative effect of the change in policy. In such
instances the department shall restate the opening balances of assets, liabilities and net assets
for the earliest period for which retrospective restatement is practicable.
Changes in accounting estimates are applied prospectively in accordance with MCS
requirements.
Correction of errors is applied retrospectively in the period in which the error has occurred in
accordance with MCS requirements, except to the extent that it is impracticable to determine the
period-specific effects or the cumulative effect of the error. In such cases the department shall
restate the opening balances of assets, liabilities and net assets for the earliest period for which
retrospective restatement is practicable.
21 Events after the reporting date
Events after the reporting date that are classified as adjusting events have been accounted for in
the financial statements. The events after the reporting date that are classified as non-adjusting
events after the reporting date have been disclosed in the notes to the financial statements.

187
DEPARTMENT OF ECONOMIC, SMALL BUSINESS DEVELOPMENT, TOURISM AND
ENVIRONMENTAL AFFAIRS
VOTE 3
NOTES TO THE ANNUAL FINANCIAL STATEMENTS
for the year ended 31 March 2018
- 48 -
22 Departures from the MCS requirements
Management has concluded that the financial statements present fairly the department’s primary
and secondary information; that the department complied with the Standard.
23 Recoverable revenue
Amounts are recognised as recoverable revenue when a payment made in a previous financial
year becomes recoverable from a debtor in the current financial year. Amounts are either
transferred to the Provincial Revenue Fund when recovered or are transferred to the statement of
financial performance when written-off.
24 Employee benefits
The value of each major class of employee benefit obligation (accruals, payables not recognised
and provisions) is disclosed in the Employee benefits note.

188
DEPARTMENT OF ECONOMIC, SMALL BUSINESS DEVELOPMENT, TOURISM AND
ENVIRONMENTAL AFFAIRS
VOTE 3
NOTES TO THE ANNUAL FINANCIAL STATEMENTS
for the year ended 31 March 2018
- 49 -
PART B: EXPLANATORY NOTES
1. Annual Appropriation
1.1 Annual Appropriation
Included are funds appropriated in terms of the Appropriation Act (and the Adjustments
Appropriation Act) for Provincial Departments (Voted funds):
1.2 Conditional grants
Note
2017/18 2016/17
R’000 R’000
Total grants received 47 2 000 2 790
Provincial grants included in Total Grants received 2 000 2 790
2. Departmental revenue
Note 2017/18 2016/17
R’000 R’000
Sales of goods and services other than capital
assets
2.1 12 218 10 428
Fines, penalties and forfeits 2.2 393 30
Interest, dividends and rent on land 2.3 28 28
Sales of capital assets 2.4 8 126 -
Transactions in financial assets and liabilities 2.5 1 169 850
Total revenue collected 21 934 11 336
Less: Own revenue included in appropriation 13 21 934 11 336
Departmental revenue collected - -
2017/18 2016/17
Final
Appropri
ation
Actual
Funds
Received
Funds not
requested/
not
received
Final
Appropriati
on
Appropria
tion
received
R’000 R’000 R’000 R’000 R’000
Administration 141 099 141 099 - 136 439 136 439
Environmental
Affairs
136 691 136 691 - 146 442 146 442
Economic and
Small Business
Development
218 167 218 167 - 114 378 114 378
Tourism 9 191 9 191 - 77 737 77 737
Total 505 148 505 148 - 474 996 474 996

189
DEPARTMENT OF ECONOMIC, SMALL BUSINESS DEVELOPMENT, TOURISM AND
ENVIRONMENTAL AFFAIRS
VOTE 3
NOTES TO THE ANNUAL FINANCIAL STATEMENTS
for the year ended 31 March 2018
- 50 -
2.1 Sales of goods and services other than capital assets
Note 2017/18 2016/17
2 R’000 R’000
Sales of goods and services produced by the
department
12 210 10 401
Sales by market establishment - 20
Administrative fees 2 109 2 158
Other sales 10 101 8 223
Sales of scrap, waste and other used current
goods
8 27
Total 12 218 10 428
2.2 Fines, penalties and forfeits
Note 2017/18 2016/17
2 R’000 R’000
Fines 393 30
Total 393 30
2.3 Interest, dividends and rent on land
Note 2017/18 2016/17
2 R’000 R’000
Interest 28 28
Total 28 28
2.4 Sale of capital assets
Note 2017/18 2016/17
2 R’000 R’000
Tangible assets 8 126 -
Biological assets 27 8 126 -
Total 8 126 -
2.5 Transactions in financial assets and liabilities
Note 2017/18 2016/17
2 R’000 R’000
Receivables 1 159 846
Stale cheques written back 10 4
Total 1 169 850

190
DEPARTMENT OF ECONOMIC, SMALL BUSINESS DEVELOPMENT, TOURISM AND
ENVIRONMENTAL AFFAIRS
VOTE 3
NOTES TO THE ANNUAL FINANCIAL STATEMENTS
for the year ended 31 March 2018
- 51 -
3. Aid assistance
2017/18 2016/17
R’000 R’000
Opening Balance 294 697
Prior period error - -
As restated 294 697
Transferred from statement of financial
performance
(51) (403)
Closing Balance 243 294
3.1 Analysis of balance by source
2017/18 2016/17
R’000 R’000
Aid assistance from other sources 243 294
Closing balance 243 294
3.2 Analysis of balance
2017/18 2016/17
Note R’000 R’000
Aid assistance unutilised 3 243 294
Closing balance 243 294
Aid assistance not requested/not received - -
3.3 Aid assistance expenditure per economic classification
2017/18 2016/17
R’000 R’000
Current 51 403
Total aid assistance expenditure 51 403
4. Compensation of employees
4.1 Salaries and Wages
2017/18 2016/17
R’000 R’000
Basic salary 160 344 148 640
Performance award 57 -
Service Based 430 1 106
Compensative/circumstantial 7 244 5 555
Periodic payments 1 237 -
Other non-pensionable allowances 32 051 32 636
Total 201 363 187 937

191
DEPARTMENT OF ECONOMIC, SMALL BUSINESS DEVELOPMENT, TOURISM AND
ENVIRONMENTAL AFFAIRS
VOTE 3
NOTES TO THE ANNUAL FINANCIAL STATEMENTS
for the year ended 31 March 2018
- 52 -
4.2 Social contributions
2017/18 2016/17
R’000 R’000
Employer contributions
Pension 20 643 18 732
Medical 13 188 12 212
Bargaining council 55 49
Total 33 886 30 993
Total compensation of employees 235 249 218 930
Average number of employees 693 669
5. Goods and services
Note 2017/18 2016/17
R’000 R’000
Administrative fees 282 342
Advertising 5 378 4 004
Minor assets 5.1 749 311
Bursaries (employees) 410 211
Catering 5 014 2 604
Communication 4 262 5 512
Computer services 5.2 1 341 1 575
Consultants: Business and advisory services 5 534 11 810
Legal services 333 484
Contractors 8 131 6 233
Agency and support / outsourced services 13 094 5 289
Entertainment 14 -
Audit cost – external 5.3 6 467 5 146
Fleet services 12 538 8 354
Consumables 5.4 9 111 8 727
Operating leases 12 933 13 036
Property payments 5.5 10 021 7 378
Rental and hiring 522 24
Travel and subsistence 5.6 14 877 14 038
Venues and facilities 886 1 101
Training and development 2 532 2 317
Other operating expenditure 5.7 860 1 114
Total 115 289 99 610

192
DEPARTMENT OF ECONOMIC, SMALL BUSINESS DEVELOPMENT, TOURISM AND
ENVIRONMENTAL AFFAIRS
VOTE 3
NOTES TO THE ANNUAL FINANCIAL STATEMENTS
for the year ended 31 March 2018
- 53 -
5.1 Minor assets
Note 2017/18 2016/17
5 R’000 R’000
Tangible assets
Machinery and equipment 749 311
Total 749 311
5.2 Computer services
Note 2017/18 2016/17
5 R’000 R’000
SITA computer services 1 020 722
External computer service providers 321 853
Total 1 341 1 575
5.3 Audit cost – External
Note 2017/18 2016/17
5 R’000 R’000
Regularity audits
Performance audits
6 426
41
5 146
-
Total 6 467 5 146
5.4 Consumables
Note 2017/18 2016/17
5 R’000 R’000
Consumable supplies 5 875 5 194
Uniform and clothing 1 366 1 533
Household supplies 1 101 1 087
Building material and supplies 1 819 1 380
IT consumables 57 94
Other consumables 1 532 1 100
Stationery, printing and office supplies 3 226 3 533
Total 9 111 8 727
5.5 Property payments
Note 2017/18 2016/17
5 R’000 R’000
Municipal Services 26 -
Property maintenance and repairs 9 985 7 341
Other 10 37
Total 10 021 7 378

193
DEPARTMENT OF ECONOMIC, SMALL BUSINESS DEVELOPMENT, TOURISM AND
ENVIRONMENTAL AFFAIRS
VOTE 3
NOTES TO THE ANNUAL FINANCIAL STATEMENTS
for the year ended 31 March 2018
- 54 -
5.6 Travel and subsistence
Note 2017/18 2016/17
5 R’000 R’000
Local 11 955 12 256
Foreign 2 922 1 782
Total 14 877 14 038
5.7 Other operating expenditure
Note 2017/18 2016/17
5 R’000 R’000
Resettlement costs 31 224
Other 829 890
Total 860 1 114
6. Payments for financial assets
Note 2017/18 2016/17
R’000 R’000
Material losses through criminal conduct 22 143
Theft 6.2 22 143
Debts written off 6.1 19 264
Total 41 407
6.1 Debts written off
Note 2017/18 2016/17
6 R’000 R’000
Nature of debts written off
Recoverable revenue written off
Debt write-off 19 264
Total 19 264
6.2 Details of theft
Note 2017/18 2016/17
6 R’000 R’000
Nature of theft
Assets stolen from possession of officials and at
the resorts and reserves (i.e. laptops, desktops,
TV’s and decoder)
22 143
Total 22 143

194
DEPARTMENT OF ECONOMIC, SMALL BUSINESS DEVELOPMENT, TOURISM AND
ENVIRONMENTAL AFFAIRS
VOTE 3
NOTES TO THE ANNUAL FINANCIAL STATEMENTS
for the year ended 31 March 2018
- 55 -
7. Transfers and subsidies
2017/18 2016/17
R’000 R’000
Note
Provinces and municipalities Annex 1A - 149
Departmental agencies and accounts Annex 1B 112 809 117 134
Public corporations and private enterprises Annex 1D 14 465 10 200
Households Annex 1G 1 630 1 194
Total 128 904 128 677
8. Expenditure for capital assets
Note 2017/18 2016/17
R’000 R’000
Tangible assets 9 443 15 452
Buildings and other fixed structures 29 3 893 13 124
Machinery and equipment 28 5 550 2 328
Total 9 443 15 452
8.1 Analysis of funds utilised to acquire capital assets – 2017/18
Voted funds Aid
assistance
Total
R’000 R’000 R’000
Tangible assets
Buildings and other fixed structures 3 893 - 3 893
Machinery and equipment 5 550 - 5 550
Total 9 443 - 9 443
8.2 Analysis of funds utilised to acquire capital assets – 2016/17
Voted funds Aid
assistance
Total
R’000 R’000 R’000
Tangible assets
Buildings and other fixed structures 13 124 - 13 124
Machinery and equipment 2 328 - 2 328
Total 15 452 - 15 452

195
DEPARTMENT OF ECONOMIC, SMALL BUSINESS DEVELOPMENT, TOURISM AND
ENVIRONMENTAL AFFAIRS
VOTE 3
NOTES TO THE ANNUAL FINANCIAL STATEMENTS
for the year ended 31 March 2018
- 56 -
8.3 Finance lease expenditure included in Expenditure for capital assets
2017/18 2017/18
R’000 R’000
Tangible assets
Machinery and equipment 1 760 1 142
Total 1 760 1 142
9. Unauthorised expenditure
9.1 Reconciliation of unauthorised expenditure
Note 2017/18 2016/17
R’000 R’000
Opening balance - -
Prior period error -
As restated - -
Unauthorised expenditure – discovered in current
year (as restated)
1 167 -
Closing balance 1 167 -
Analysis of closing balance
Unauthorised expenditure awaiting authorisation 1 167 -
Total 1 167 -
9.2 Analysis of unauthorised expenditure awaiting authorisation per economic
classification
2017/18 2016/17
R’000 R’000
Current 1 167 -
Total 1 167 -
9.3 Analysis of unauthorised expenditure awaiting authorisation per type
2017/18 2016/17
R’000 R’000
Unauthorised expenditure relating to
overspending of the vote or a main division
within a vote
1 167 -
Total 1 167 -

196
DEPARTMENT OF ECONOMIC, SMALL BUSINESS DEVELOPMENT, TOURISM AND
ENVIRONMENTAL AFFAIRS
VOTE 3
NOTES TO THE ANNUAL FINANCIAL STATEMENTS
for the year ended 31 March 2018
- 57 -
9.4 Details of unauthorised expenditure – current year
Incident Disciplinary steps taken/criminal
proceedings
2017/18
R’000
Overspending on a main division
within the vote
Under investigation 1 167
Total 1 167
9.5 Unauthorised expenditure split into current and non-current asset
2017/18 2016/17
Current Non-
current
Total Current Non-
current
Total
Details R’000 R’000 R’000 R’000 R’000 R’000
Overspending
on a main
division within
the vote
1 167 - 1 167
Total 1 167 - 1 167
10. Cash and cash equivalents
2017/18 2016/17
R’000 R’000
Consolidated Paymaster General Account 262 10 550
Disbursements 198 -
Cash on hand 70 70
Total 530 10 620
11. Prepayments and advances
2017/18 2016/17
R’000 R’000
Travel and subsistence 17 17
Prepayments (Not expensed) 13 600 -
Total 13 617 17

197
DEPARTMENT OF ECONOMIC, SMALL BUSINESS DEVELOPMENT, TOURISM AND
ENVIRONMENTAL AFFAIRS
VOTE 3
NOTES TO THE ANNUAL FINANCIAL STATEMENTS
for the year ended 31 March 2018
- 58 -
11.1 Prepayments (Not expensed)
Amount as
at 1 April
2017
Less:
Received in
the current
year
Add: Current
Year
prepayments
Amount as
at 31 March
2018
R’000 R’000 R’000 R’000
Transfers and subsidies - - 13 600 13 600
Total - - 13 600 13 600
11.2 Prepayments (Expensed)
Amount as
at 1 April
2017
Less:
Received in
the current
year
Add: Current
Year
prepayments
Amount as
at 31 March
2018
R’000 R’000 R’000 R’000
Goods and services 17 467 467 17
Total 17 467 467 17
12. Receivables
2017/18 2016/17
Current Non-
current
Total Current Non-
current
Total
Note
R’000 R’000 R’000 R’000 R’000 R’000
Claims
recoverable
12.1
1 688 - 1 668 1 204 - 1 204
Recoverable
expenditure
12.2 158 - 158 49 - 49
Staff debt 12.3 239 598 837 394 335 729
Other
debtors
12.4 - 1 528 1 528 - 1 418 1 418
Total 2 065 2 126 4 191 1 647 1 753 3 400
12.1 Claims recoverable
Note 2017/18 2016/17
12 and Annex
4
R’000 R’000
Provincial departments 1 668 1 204
Total 1 668 1 204

198
DEPARTMENT OF ECONOMIC, SMALL BUSINESS DEVELOPMENT, TOURISM AND
ENVIRONMENTAL AFFAIRS
VOTE 3
NOTES TO THE ANNUAL FINANCIAL STATEMENTS
for the year ended 31 March 2018
- 59 -
12.2 Recoverable expenditure (disallowance accounts)
Note 2017/18 2016/17
12 R’000 R’000
DISALL DAMAGES & LOSSES:CA 115 49
SAL:DEDUCTION DISALL ACC:CA 1 -
SAL:REVERSAL CONTROL:CA 33 -
SAL:TAX DEBT:CA 1 -
SAL:GEHS REFUND CONTROL ACC:CL 8 -
Total 158 49
12.3 Staff debt
Note 2017/18 2016/17
12 R’000 R’000
Bursary debt(employee and non-employee) 194 184
Cellphone debt - 4
Communication debt 109 113
Employee debt 29 48
Ex- employee debt 76 73
Salary overpayment 364 239
Tax debt 23 28
Losses 42 40
837 729
12.4 Other debtors
Note 2017/18 2016/17
12 R’000 R’000
Supplier 1 528 1 418
Total 1 528 1 418
12.5 Impairment of receivables
2017/18 2016/17
R’000 R’000
Estimate of impairment of receivables 1 536 1 422
Total 1 536 1 422
The basis for the impairment is based on debts older than 3 years excluding the debts with
active instalment repayments.

199
DEPARTMENT OF ECONOMIC, SMALL BUSINESS DEVELOPMENT, TOURISM AND
ENVIRONMENTAL AFFAIRS
VOTE 3
NOTES TO THE ANNUAL FINANCIAL STATEMENTS
for the year ended 31 March 2018
- 60 -
13. Voted funds to be surrendered to the Revenue Fund
2017/18 2016/17
R’000 R’000
Opening balance 11 920 5 374
Prior period error -
As restated 11 920 5 374
Transfer from statement of financial performance
(as restated)
16 222 11 920
Add: Unauthorised expenditure for current year 1 167
Paid during the year (11 920) (5 374)
Closing balance 17 389 11 920
14. Departmental revenue and NRF Receipts to be surrendered to the Revenue
Fund
2017/18 2016/17
R’000 R’000
Opening balance 894 1 115
Prior period error -
As restated 894 1 115
Own revenue included in appropriation 21 934 11 336
Paid during the year (22 027) (11 557)
Closing balance 801 894
15. Payables – current
Note 2017/18 2016/17
R’000 R’000
Clearing accounts 15.1 6 -
Total 6 -
15.1 Clearing accounts
Note 2017/18 2016/17
15 R’000 R’000
SAL:ACB RECALLS:CA 6 -
Total 6 -

200
DEPARTMENT OF ECONOMIC, SMALL BUSINESS DEVELOPMENT, TOURISM AND
ENVIRONMENTAL AFFAIRS
VOTE 3
NOTES TO THE ANNUAL FINANCIAL STATEMENTS
for the year ended 31 March 2018
- 61 -
16. Net cash flow available from operating activities
2017/18 2016/17
R’000 R’000
Net surplus/(deficit) as per Statement of Financial
Performance
16 171 11 517
Add back non cash/cash movements not deemed
operating activities
(25 081) 9 929
(Increase)/decrease in receivables – current (791) 52
(Increase)/decrease in prepayments and advances (13 600) 20
Increase/(decrease) in payables – current 6 -
Proceeds rom sale of capital assets (8 126) -
Expenditure on capital assets 9 443 15 452
Surrenders to Revenue Fund (33 947) (16 931)
Own revenue included in appropriation 21 934 11 336
Net cash flow generated by operating activities (8 910) 21 446
17. Reconciliation of cash and cash equivalents for cash flow purposes
2017/18 2016/17
R’000 R’000
Consolidated Paymaster General account 262 10 550
Disbursements 198 -
Cash on hand 70 70
Total 530 10 620
18. Contingent liabilities and contingent assets
18.1 Contingent liabilities
Note 2017/18 2016/17
R’000 R’000
Liable to Nature
Claims against the department Annex 3B 24 713 24 713
Intergovernmental payables (unconfirmed
balances)
Annex 5 - 29
Total 24 713 24 742

201
DEPARTMENT OF ECONOMIC, SMALL BUSINESS DEVELOPMENT, TOURISM AND
ENVIRONMENTAL AFFAIRS
VOTE 3
NOTES TO THE ANNUAL FINANCIAL STATEMENTS
for the year ended 31 March 2018
- 58 -
18. Contingent liabilities and contingent assets
18.1 Contingent liabilities
Note 2017/18 2016/17
R’000 R’000
Liable to Nature
Claims against the department Annex 3B 24 713 24 713
Intergovernmental payables (unconfirmed
balances)
Annex 5 - 29
Total 24 713 24 742
19. Commitments
2017/18 2016/17
R’000 R’000
Current expenditure
Approved and contracted 9 914 22 940
Approved but not yet contracted 913 688
10 827 23 628
Capital expenditure
Approved and contracted 13 307 17 045
Approved but not yet contracted 148 19
13 455 17 064
Total Commitments 24 282 40 692
Going concern assumption - The department will continue to operate in the foreseeable future without the need
or intention to liquidate or significantly curtail its operational activities. However, due to the commitments as at
year end, there is significant doubt on the department’s ability to meet its financial obligations as they fall due
and achievement of service delivery as outlined in the Annual Performance Plan.
Construction of Fence at Sandveld Nature Reserve contract, Implementation, Coordination and Management of
the Free State Programme to Clean Up Water Resources (Dams & Rivers) and Exhibition Management Services
is for longer than 1 year.

202
DEPARTMENT OF ECONOMIC, SMALL BUSINESS DEVELOPMENT, TOURISM AND
ENVIRONMENTAL AFFAIRS
VOTE 3
NOTES TO THE ANNUAL FINANCIAL STATEMENTS
for the year ended 31 March 2018
- 59 -
20. Accruals and payables not recognised
20.1 Accruals
2017/18 2016/17
R’000 R’000
Listed by economic classification
30 Days 30+ Days Total Total
Goods and services 5 522 - 5 522 576
Total 5 522 - 5 522 576
2017/18 2016/17
R’000 R’000
Listed by programme level
Administration 4 632 -
Environmental Affairs 84 -
Economic Development 806 576
Tourism - -
Total 5 522 576
20.2 Payables not recognised
2017/18 2016/17
R’000 R’000
Listed by economic classification
30 Days 30+ Days Total Total
Goods and services 486 - 486 1 622
Total 486 - 486 1 622
2017/18
2016/17
R’000 R’000
Listed by programme level
Administration 105 1 427
Environmental Affairs - 91
Economic Development
Tourism
381
-
60
44
Total 486 1 622
Note
2017/18
2016/17
Included in the above totals are the following: R’000 R’000
Confirmed balances with other departments Annex 5 24 624
Total 24 624

203
DEPARTMENT OF ECONOMIC, SMALL BUSINESS DEVELOPMENT, TOURISM AND
ENVIRONMENTAL AFFAIRS
VOTE 3
NOTES TO THE ANNUAL FINANCIAL STATEMENTS
for the year ended 31 March 2018
- 64 -
21. Employee benefits
2017/18 2016/17
R’000 R’000
Leave entitlement 11 626 9 314
Service bonus (Thirteenth cheque) 6 496 5 704
Performance awards 9 117 1 557
Capped leave commitments 6 183 6 671
Other 501 144
Total 33 923 23 990
At this stage the department is not able to reliably measure the long term portion of the long
service awards.
Included in leave entitlement are negative leave credits amounting to R189 651.51. Other
employee benefits includes overtime due as at 31 March 2018 and the payment of the 10%
HOD allowance.
22. Lease commitments
22.1 Operating leases
2017/18
Specialised
military
equipment
Land
Buildings
and other
fixed
structures
Machinery
and
equipment
Total
Not later than 1 year - - - 10 882 10 882
Later than 1 year and
not later than 5 years
- - - 10 813 10 813
Total lease
commitments
- - - 21 695 21 695
2016/17
Specialised
military
equipment
Land
Buildings
and other
fixed
structures
Machinery
and
equipment
Total
Not later than 1 year - - - 8 188 8 188
Later than 1 year and
not later than 5 years
- - - 6 251 6 251
Later than five years - - - 63 63
Total lease
commitments
- - - 14 502 14 502

204
DEPARTMENT OF ECONOMIC, SMALL BUSINESS DEVELOPMENT, TOURISM AND
ENVIRONMENTAL AFFAIRS
VOTE 3
NOTES TO THE ANNUAL FINANCIAL STATEMENTS
for the year ended 31 March 2018
- 65 -
The major operating lease arrangement of the department is for the government owned
vehicles that are being leased from Fleet Management.
22.2 Finance leases
2017/18
Specialised
military
equipment
Land
Buildings
and other
fixed
structures
Machinery
and
equipment
Total
Not later than 1 year - - - 1 216 1 216
Later than 1 year and
not later than 5 years
- - - 517 517
Total lease
commitments
- - - 1 733 1 733
2016/17
Specialised
military
equipment
Land
Buildings
and other
fixed
structures
Machinery
and
equipment
Total
Not later than 1 year - - - 768 768
Later than 1 year and
not later than 5 years
- - - 593 593
Total lease
commitments - - - 1 361 1 361
The major lease arrangement for the department is for the photocopiers.
23. Accrued departmental revenue
2017/18 2016/17
R’000 R’000
Sales of goods and services other than capital
assets
20 349 18 167
Sales of capital assets 619 -
Total 20 968 18 167

205
DEPARTMENT OF ECONOMIC, SMALL BUSINESS DEVELOPMENT, TOURISM AND
ENVIRONMENTAL AFFAIRS
VOTE 3
NOTES TO THE ANNUAL FINANCIAL STATEMENTS
for the year ended 31 March 2018
- 66 -
23.1 Analysis of accrued departmental revenue
2017/18 2016/17
R’000 R’000
Opening balance 18 167 14 504
Add: amounts recorded 2 801 3 663
Closing balance 20 968 18 167
23.2 Impairment of accrued departmental revenue
2017/18 2016/17
R’000 R’000
Estimate of impairment of accrued departmental
revenue
10 863 7 609
Total 10 863 7 609
The basis of impairment is calculated on the R150 000 monthly rental out of the original R250,000.
Only R100 000 may be recoverable and the R150 000 deemed irrecoverable from the service provider.
24. Irregular expenditure
24.1 Reconciliation of irregular expenditure
2017/18 2016/17
R’000 R’000
Opening balance 78 382 69 480
Prior period error 594
As restated 78 382 70 074
Add: Irregular expenditure – relating to prior year 9 171 -
Add: Irregular expenditure – relating to current
year
11 787 8 308
Less: Prior year amounts condoned (2 084) -
Closing balance 97 256 78 382
Analysis of awaiting condonation per age
classification
Current year 11 787 8 308
Prior years 85 469 70 074
Total 97 256 78 382
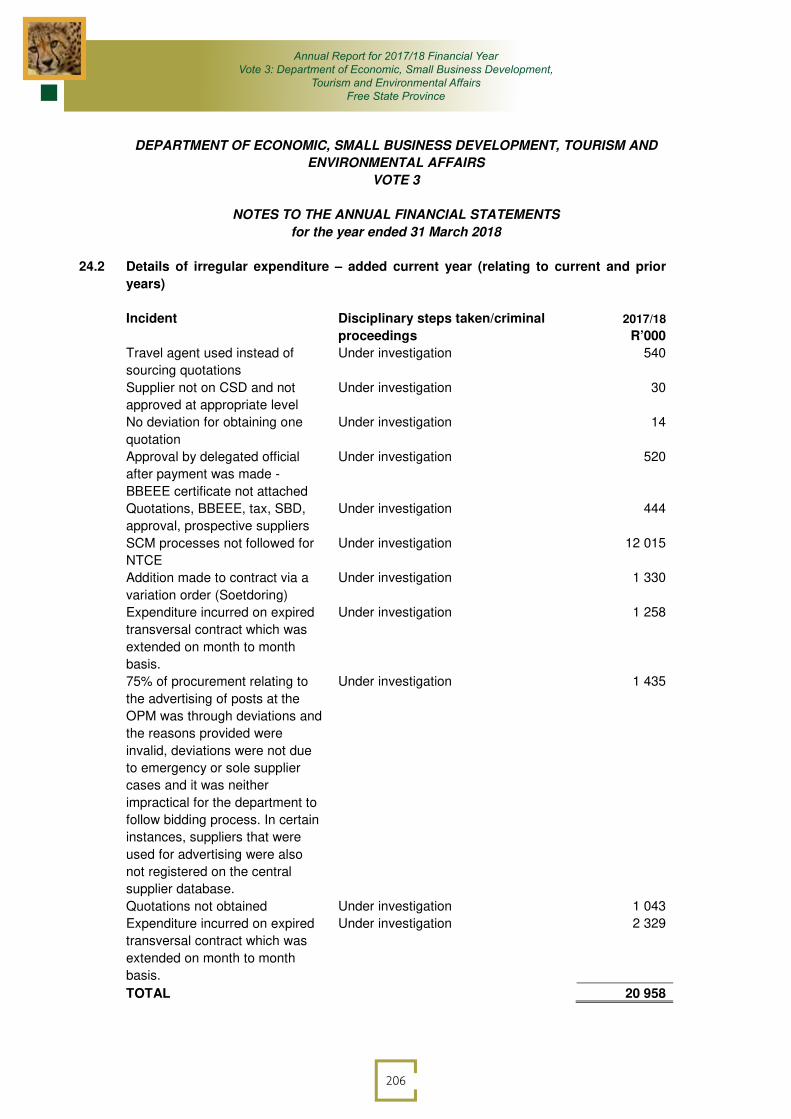
206
DEPARTMENT OF ECONOMIC, SMALL BUSINESS DEVELOPMENT, TOURISM AND
ENVIRONMENTAL AFFAIRS
VOTE 3
NOTES TO THE ANNUAL FINANCIAL STATEMENTS
for the year ended 31 March 2018
- 67 -
24.2 Details of irregular expenditure – added current year (relating to current and prior
years)
Incident Disciplinary steps taken/criminal
proceedings
2017/18
R’000
Travel agent used instead of
sourcing quotations
Under investigation 540
Supplier not on CSD and not
approved at appropriate level
Under investigation 30
No deviation for obtaining one
quotation
Approval by delegated official
after payment was made -
BBEEE certificate not attached
Under investigation
Under investigation
14
520
Quotations, BBEEE, tax, SBD,
approval, prospective suppliers
SCM processes not followed for
NTCE
Addition made to contract via a
variation order (Soetdoring)
Expenditure incurred on expired
transversal contract which was
extended on month to month
basis.
75% of procurement relating to
the advertising of posts at the
OPM was through deviations and
the reasons provided were
invalid, deviations were not due
to emergency or sole supplier
cases and it was neither
impractical for the department to
follow bidding process. In certain
instances, suppliers that were
used for advertising were also
not registered on the central
supplier database.
Quotations not obtained
Expenditure incurred on expired
transversal contract which was
extended on month to month
basis.
Under investigation
Under investigation
Under investigation
Under investigation
Under investigation
Under investigation
Under investigation
444
12 015
1 330
1 258
1 435
1 043
2 329
TOTAL 20 958

207
DEPARTMENT OF ECONOMIC, SMALL BUSINESS DEVELOPMENT, TOURISM AND
ENVIRONMENTAL AFFAIRS
VOTE 3
NOTES TO THE ANNUAL FINANCIAL STATEMENTS
for the year ended 31 March 2018
- 68 -
24.3 Details of irregular expenditure condoned
Incident Condoned by (condoning authority) 2017/18
R’000
Payments relating to Event
Management Transversal
Contract which were not part of
the events transversal contract
pricing list.
National Treasury 2 084
Total 2 084
24.4 Details of irregular expenditures under determination or investigation (not included
in the main note)
Incident 2017/18
R’000
Splitting of orders 1 446
Tender not advertised for 21 Days 1 596
Total 3 042
24.5 Prior period error
2016/17
R’000
Nature of prior period error
Relating to 2014/15 – 2016/17 [affecting the
opening balance]
594
Payments relating to Event Management
Transversal Contract which were not part of the
events transversal contract pricing list.
594
Total prior period errors 594
25. Fruitless and wasteful expenditure

208
DEPARTMENT OF ECONOMIC, SMALL BUSINESS DEVELOPMENT, TOURISM AND
ENVIRONMENTAL AFFAIRS
VOTE 3
NOTES TO THE ANNUAL FINANCIAL STATEMENTS
for the year ended 31 March 2018
- 65 -
25. Fruitless and wasteful expenditure
25.1 Reconciliation of fruitless and wasteful expenditure
2017/18 2016/17
R’000 R’000
Opening balance - 105
Prior period error
As restated - 105
Fruitless and wasteful expenditure – relating to
prior year
2 205
Less: Amounts transferred to receivables for
recovery
11.6 - 105
Closing balance 2 205 -
25.2 Analysis of awaiting resolution per economic classification
25.3 Analysis of Current year’s (relating to current and prior years) fruitless and wasteful
expenditure
Incident Disciplinary steps taken/criminal
proceedings
2017/18
R’000
Penalties and interest incurred
due to late payment of contractor.
Under investigation 2 205
Total 2 205
25.4 Details of fruitless and wasteful expenditures under investigation (not included in the
main note)
Incident 2017/18
R’000
Possible fruitless and wasteful expenditure on the work done on a project
that was suspended. The amount cannot be determined at this stage until
the final account is received for this project.
Total -
2017/18 2016/17
R’000 R’000
Capital 2 205 -
Total 2 205 -

209
DEPARTMENT OF ECONOMIC, SMALL BUSINESS DEVELOPMENT, TOURISM AND
ENVIRONMENTAL AFFAIRS
VOTE 3
NOTES TO THE ANNUAL FINANCIAL STATEMENTS
for the year ended 31 March 2018
- 70 -
26. Key management personnel
No. of
Individuals
2017/18 2016/17
R’000 R’000
Political office bearers (provide detail below) 1 1 978 2 138
Officials:
Level 15 to 16 3 2 855 4 346
Level 14 (incl. CFO if at a lower level) 7 7 924 8 077
Total 12 757 14 561
27. Provisions
2017/18 2016/17
R’000 R’000
Retention monies - 243
Total - 243
27.1 Reconciliation of movement in provisions – 2017/18
Provision
1
Provision
2
Provision
3
Total
provisions
R’000 R’000 R’000 R’000
Opening balance 243 - - 243
Settlement of provision (243) - - (243)
Closing balance - - - -
Reconciliation of movement in provisions – 2016/17
Provision
1
Provision
2
Provision
3
Total
provisions
R’000 R’000 R’000 R’000
Opening balance 243 - - 243
Closing balance 243 - - 243

210
DEPARTMENT OF ECONOMIC, SMALL BUSINESS DEVELOPMENT, TOURISM AND
ENVIRONMENTAL AFFAIRS
VOTE 3
NOTES TO THE ANNUAL FINANCIAL STATEMENTS
for the year ended 31 March 2018
- 71 -
The provision relates to retention monies on the Maria Moroka project. The retention is 10% of the
amount that was certified as being due to the contractor on the interim certificate, which was deducted
from the amount due and retained by the department. The purpose of retention is to ensure that the
contractor properly completes the activities required of them under the contract.
The amount retained was released as the contract has reached practical completion which means the
point where all building work is complete or all but completed, in accordance with the contract, and
the property is reasonably fit for occupation.
28. Movable Tangible Capital Assets
MOVEMENT IN MOVABLE TANGIBLE CAPITAL ASSETS PER ASSET REGISTER FOR THE YEAR
ENDED 31 MARCH 2018
Opening
balance
Value
adjustments
Additions Disposals Closing
Balance
R’000 R’000 R’000 R’000 R’000
MACHINERY AND
EQUIPMENT
31 377 - 3 792 1 391 33 314
Transport assets 5 527 - - 779 4 748
Computer equipment 9 600 - 1 492 7 11 085
Furniture and office equipment 8 626 - 1 268 - 9 894
Other machinery and equipment 7 624 - 568 605 7 587
SPECIALISED MILITARY
ASSETS
1 036 - - - 1 036
Specialised military assets 1 036 - - - 1 036
TOTAL MOVABLE TANGIBLE
CAPITAL ASSETS
32 413 - 3 328 1 391 34 350
Movable Tangible Capital Assets under investigation
Number Value
R’000
Included in the above total of the movable tangible capital assets per the
asset register are assets that are under investigation:
Machinery and equipment 318 4 762
1. Some of the assets under investigation could not been found during the Asset
Verification process. For these assets further investigations will be conducted with
respective asset holders so that all assets are accounted for.
2. Some the assets under investigation include those assets that were transferred to resorts
and reserves during the movement.
DEPARTMENT OF ECONOMIC, SMALL BUSINESS DEVELOPMENT, TOURISM AND
ENVIRONMENTAL AFFAIRS
VOTE 3
NOTES TO THE ANNUAL FINANCIAL STATEMENTS
for the year ended 31 March 2018
- 67 -
contractor properly completes the activities required of them under the contract.
The amount retained was released as the contract has reached practical completion which means the
point where all building work is complete or all but completed, in accordance with the contract, and
the property is reasonably fit for occupation.
28. Movable Tangible Capital Assets
MOVEMENT IN MOVABLE TANGIBLE CAPITAL ASSETS PER ASSET REGISTER FOR THE YEAR
ENDED 31 MARCH 2018
Opening
balance
Value
adjustments
Additions Disposals Closing
Balance
R’000 R’000 R’000 R’000 R’000
MACHINERY AND
EQUIPMENT
31 377 - 3 792 1 391 33 314
Transport assets 5 527 - - 779 4 748
Computer equipment 9 600 - 1 492 7 11 085
Furniture and office equipment 8 626 - 1 268 - 9 894
Other machinery and equipment 7 624 - 568 605 7 587
SPECIALISED MILITARY
ASSETS
1 036 - - - 1 036
Specialised military assets 1 036 - - - 1 036
TOTAL MOVABLE TANGIBLE
CAPITAL ASSETS
32 413 - 3 328 1 391 34 350
Movable Tangible Capital Assets under investigation
Number Value
R’000
Included in the above total of the movable tangible capital assets per the
asset register are assets that are under investigation:
Machinery and equipment 318 4 762
1. Some of the assets under investigation could not been found during the Asset
Verification process. For these assets further investigations will be conducted with
respective asset holders so that all assets are accounted for.
2. Some of the assets under investigation include those assets that were transferred to
resorts and reserves during the movement.

211
DEPARTMENT OF ECONOMIC, SMALL BUSINESS DEVELOPMENT, TOURISM AND
ENVIRONMENTAL AFFAIRS
VOTE 3
NOTES TO THE ANNUAL FINANCIAL STATEMENTS
for the year ended 31 March 2018
- 72 -
28.1 Additions
ADDITIONS TO MOVABLE TANGIBLE CAPITAL ASSETS PER ASSET REGISTER FOR THE
YEAR ENDED 31 MARCH 2018
Cash* Non-
cash**
(Capital
Work in
Progress
current
costs and
finance
lease
payments)
Received
current,
not paid
(Paid
current
year,
received
prior year)
Total
R’000 R’000 R’000 R’000 R’000
MACHINERY AND
EQUIPMENT
5 088 (1 760) - 3 328
Computer equipment 1 492 - - - 1 492
Furniture and office equipment 1 268 - - - 1 268
Other machinery and
equipment
2 328 - (1 760) - 568
TOTAL ADDITIONS TO
MOVABLE TANGIBLE
CAPITAL ASSETS
5 088 - (1 760) - 3 328
28.2 Disposals
DISPOSALS OF MOVABLE TANGIBLE CAPITAL ASSETS PER ASSET REGISTER FOR
THE YEAR ENDED 31 MARCH 2018
Sold for
cash
Non-cash
disposal
Total
disposals
Cash
Received
Actual
R’000 R’000 R’000 R’000
MACHINERY AND EQUIPMENT - 1 391 1 391 -
Transport assets - 779 779 -
Computer equipment - 7 7 -
Furniture and office equipment - - - -
Other machinery and equipment - 605 605 -
BIOLOGICAL ASSETS
Biological assets 8 126
TOTAL DISPOSAL OF
MOVABLE TANGIBLE CAPITAL
ASSETS
- 1 391 1 391 8 126

212
DEPARTMENT OF ECONOMIC, SMALL BUSINESS DEVELOPMENT, TOURISM AND
ENVIRONMENTAL AFFAIRS
VOTE 3
NOTES TO THE ANNUAL FINANCIAL STATEMENTS
for the year ended 31 March 2018
- 73 -
28.3 Movement for 2016/17
MOVEMENT IN TANGIBLE CAPITAL ASSETS PER ASSET REGISTER FOR THE YEAR ENDED 31
MARCH 2017
Opening
balance
Prior
period
error
Additions Disposals Closing
Balance
R’000 R’000 R’000 R’000 R’000
MACHINERY AND
EQUIPMENT
30 164 404 1 328 519 31 377
Transport assets 5 153 404 - 30 5 527
Computer equipment 8 902 704 6 9 600
Furniture and office equipment 8 537 - 89 - 8 626
Other machinery and equipment 7 572 - 535 483 7 624
SPECIALISED MILITARY
ASSETS
1 036 - - - 1 036
Specialised military assets 1 036 - - - 1 036
TOTAL MOVABLE TANGIBLE
CAPITAL ASSETS
31 200 404 1 328 519 32 413
28.3.1 Prior period error
2016/17
R’000
Nature of prior period error
Relating to 2015/16 [affecting the opening balance]
Tractors not included in opening balance 404
Total prior period errors 404

213
DEPARTMENT OF ECONOMIC, SMALL BUSINESS DEVELOPMENT, TOURISM AND
ENVIRONMENTAL AFFAIRS
VOTE 3
NOTES TO THE ANNUAL FINANCIAL STATEMENTS
for the year ended 31 March 2018
- 74 -
28.4 Minor assets
MOVEMENT IN MINOR ASSETS PER THE ASSET REGISTER FOR THE YEAR ENDED AS AT 31
MARCH 2018
Specialised
military
assets
Intangible
assets
Heritage
assets
Machinery
and
equipment
Biological
assets
Total
R’000 R’000 R’000 R’000 R’000 R’000
Opening
balance
314 - - 26 121 - 26 435
Value
adjustments
- - - - - -
Additions - - - 737 - 737
Disposals 128 128
TOTAL MINOR
ASSETS
314 - - 26 730 - 27 044
Specialised
military
assets
Intangible
assets
Heritage
assets
Machinery
and
equipment
Biological
assets
Total
Number of R1
minor assets
- - - 1 - 1
Number of
minor assets
at cost
129 - - 17 308 - 17 437
TOTAL
NUMBER OF
MINOR
ASSETS
129 - - 17 309 - 17 438
Minor Capital Assets under investigation
Number Value
R’000
Included in the above total of the minor capital assets per the asset
register are assets that are under investigation:
Machinery and equipment 1 644 2 579
1. Some of the assets under investigation could not been found during the Asset
Verification process. For these assets further investigations will be conducted with
respective asset holders so that all assets are accounted for.
2. Some the assets under investigation include those assets that were transferred to resorts
and reserves during the movement.

214
DEPARTMENT OF ECONOMIC, SMALL BUSINESS DEVELOPMENT, TOURISM AND
ENVIRONMENTAL AFFAIRS
VOTE 3
NOTES TO THE ANNUAL FINANCIAL STATEMENTS
for the year ended 31 March 2018
- 75 -
MOVEMENT IN MINOR ASSETS PER THE ASSET REGISTER FOR THE YEAR ENDED AS AT 31
MARCH 2017
Specialised
military
assets
Intangible
assets
Heritage
assets
Machinery
and
equipment
Biological
assets
Total
R’000 R’000 R’000 R’000 R’000 R’000
Opening
balance
314 - - 25 910 - 26 224
Prior period
error
- - - - - -
Additions - - - 337 - 337
Disposals - - - 126 - 126
TOTAL MINOR
ASSETS
314 - - 26 121 - 26 435
Specialised
military
assets
Intangible
assets
Heritage
assets
Machinery
and
equipment
Biological
assets
Total
Number of R1
minor assets
- - - 1 - 1
Number of
minor assets
at cost
129 - - 17 308 - 17437
TOTAL
NUMBER OF
MINOR
ASSETS
129 - - 17 309 - 17 438

215
DEPARTMENT OF ECONOMIC, SMALL BUSINESS DEVELOPMENT, TOURISM AND
ENVIRONMENTAL AFFAIRS
VOTE 3
NOTES TO THE ANNUAL FINANCIAL STATEMENTS
for the year ended 31 March 2018
- 76 -
29. Immovable Tangible Capital Assets
29.1 Additions
ADDITIONS TO IMMOVABLE TANGIBLE CAPITAL ASSETS PER ASSET REGISTER FOR
THE YEAR ENDED 31 MARCH 2018
Cash Non-cash (Capital
Work in
Progress
current
costs and
finance
lease
payments)
Received
current,
not paid
(Paid
current
year,
received
prior year)
Total
R’000 R’000 R’000 R’000 R’000
BUILDING AND OTHER
FIXED STRUCTURES
Other fixed structures 4 100 (4 100) -
TOTAL ADDITIONS TO
IMMOVABLE TANGIBLE
CAPITAL ASSETS
4 100 (4 100) -
29.2 Capital Work-in-progress
CAPITAL WORK-IN-PROGRESS AS AT 31 MARCH 2018
Note
Opening
balance
1 April
2017
Current
Year WIP
Ready for
use
(Assets to
the AR) /
Contracts
terminated
Closing
balance
31 March
2018
Annexure 7 R’000 R’000 R’000 R’000
Buildings and other fixed
structures
56 926 4 100 - 61 026
TOTAL 56 926 4 100 - 61 026

216
DEPARTMENT OF ECONOMIC, SMALL BUSINESS DEVELOPMENT, TOURISM AND
ENVIRONMENTAL AFFAIRS
VOTE 3
NOTES TO THE ANNUAL FINANCIAL STATEMENTS
for the year ended 31 March 2018
- 77 -
Age analysis on ongoing projects
Number of projects 2017/18
Planned,
Construction not
started
Planned,
Construction
started
Total
R’000
0 to 1 Year - - -
1 to 3 Years - 1 5 535
3 to 5 Years - 2 31 324
Longer than 5 Years - 1 24 167
Total - 4 61 026
Maria Moroka Resort - The project is on a Practical Completion stage and the retention
monies have been paid.
Accruals and payables not recognised relating to
Capital WIP Note 2017/18 2016/17
R’000 R’000
Maria Moroka Project 115
Total 115 -
CAPITAL WORK-IN-PROGRESS AS AT 31 MARCH 2017
Note
Opening
balance
1 April
2016
Prior
period
error
Current
Year WIP
Ready for
use
(Assets to
the AR) ) /
Contracts
terminated
Closing
balance
31 March
2017
Annexure 7 R’000 R’000 R’000 R’000 R’000
Buildings and
other fixed
structures
43 802 - 13 124 - 56 926
TOTAL 43 802 - 13 124 - 56 926

217
DEPARTMENT OF ECONOMIC, SMALL BUSINESS DEVELOPMENT, TOURISM AND
ENVIRONMENTAL AFFAIRS
VOTE 3
NOTES TO THE ANNUAL FINANCIAL STATEMENTS
for the year ended 31 March 2018
- 78 -
30. Prior period errors
30.1 Correction of prior period errors
Note Amount bef
error
correction
Prior period
error
Restated
Amount
2016/17 2016/17 2016/17
R’000 R’000 R’000
Expenditure:
Goods and Services
Payment made to service provider
for MESP incorrectly classified as a
transfer payment instead of goods
and services.
5 87 047 12 563 99 610
Transfers and subsidies 7 141 240 (12 563) 128 677
Payment made to service provider
for MESP incorrectly classified as a
transfer payment instead of goods
and services.
Net effect 228 287 - 228 287
30.2 Correction of prior period errors
Note Amount bef
error
correction
Prior period
error
Restated
Amount
2016/17 2016/17 2016/17
R’000 R’000 R’000
Other:
Liabilities
Accruals – payments due to service
provider for services rendered
20.1 - 576 576
Net effect - 576 576

218
DEPARTMENT OF ECONOMIC, SMALL BUSINESS DEVELOPMENT, TOURISM AND
ENVIRONMENTAL AFFAIRS
VOTE 3
NOTES TO THE ANNUAL FINANCIAL STATEMENTS
for the year ended 31 March 2018
- 79 -
30.3 Correction of prior period errors
Note Amount bef
error
correction
Prior period
error
Restated
Amount
2016/17 2016/17 2016/17
R’000 R’000 R’000
Other:
Fruitless Expenditure
Payments relating to Event
Management Transversal Contract
which were not part of the events
transversal contract pricing list.
23 1 490 594 2 084
S42 Movable Capital Assets 39.6 379 (379) -
The baler machines were already
transferred in terms of S42 during
the 2016/17 financial year.
Net effect 1 869 215 2 084
Payments relating to Event Management Transversal Contract which were not part of the
events transversal contract pricing list.

219
DE
PA
RT
ME
NT
OF
EC
ON
OM
IC,
SM
AL
L B
US
INE
SS
DE
VE
LO
PM
EN
T,
TO
UR
ISM
AN
D E
NV
IRO
NM
EN
TA
L A
FF
AIR
S
VO
TE
3
NO
TE
S T
O T
HE
AN
NU
AL
FIN
AN
CIA
L S
TA
TE
ME
NT
S
for
the
ye
ar
en
de
d 3
1 M
arc
h 2
01
8
- 7
5 -
31.
Tra
nsfe
r o
f fu
ncti
on
s
The
Fre
e S
tate
Exe
cutive
Co
un
cil
ap
pro
ve
d o
n 1
0 O
cto
be
r 2
01
7 t
o t
ran
sfe
r th
e f
un
ction
of
Hort
icu
ltu
re i
.e.
Ka
ree
Nu
rse
ry w
hic
h f
alls
un
de
r
Envir
on
me
nta
l M
an
age
me
nt
to t
he D
ep
art
me
nt
of
Agri
cu
lture
and
Ru
ral D
evelo
pm
en
t w
ith
eff
ect fr
om
01 N
ove
mb
er
20
17.
Kare
e
Nu
rse
ry
has
23
em
plo
ye
es.
Du
e
to
the
E
XC
O
Re
so
lutio
n
to
tran
sfe
r K
are
e
Nu
rse
ry
to
the
D
ep
art
me
nt
of
Ag
ricu
ltu
re
an
d
Ru
ral
De
ve
lop
me
nt,
it
will
als
o b
e a
ppro
pri
ate
tha
t th
e a
ffecte
d o
ffic
ials
be t
ransfe
rre
d.
Sectio
n 1
4 (
4)
of
the
Pub
lic S
erv
ice A
ct,
199
4,
as a
me
nd
ed,
wa
s
ad
he
red
to.
The
De
pa
rtm
ent
of
Ag
ricu
ltu
re a
nd
Rura
l D
eve
lop
me
nt
was e
ng
age
d a
bou
t th
e t
ran
sfe
r o
f K
are
e N
urs
ery
an
d i
ts p
ers
on
nel
to t
heir
dep
art
me
nt
an
d it
wa
s a
gre
ed t
ha
t th
e a
ffe
cte
d o
ffic
ials
wo
uld
assu
me
du
ty in t
he D
ep
art
men
t w
ith
eff
ect
from
01 N
ove
mb
er
201
7.
Th
e t
wo
re
co
gnis
ed
un
ion
s
in t
he D
ep
art
me
nt,
na
me
ly P
SA
an
d N
EH
AW
U,
we
re e
nga
ge
d a
bo
ut
the
tra
nsfe
r o
f K
are
e N
urs
ery
du
rin
g t
he
sp
ecia
l D
TT
mee
tin
gs h
eld
on 2
4
an
d 3
0 O
cto
ber
20
17
re
sp
ectively
. T
he
tw
o u
nio
ns a
gre
ed
to t
he
tra
nsfe
r.
The
co
mp
en
satio
n b
udg
et
for
the
re
ma
ind
er
of
the f
ina
ncia
l ye
ar
from
01 N
ove
mb
er
201
7 t
o 3
1 M
arc
h 2
01
7,
wh
ich
am
ou
nts
to
R2
370
67
8.0
0 w
ill
be
tra
nsfe
rred
to
th
e D
epa
rtm
ent
of
Ag
ricultu
re a
nd
Rura
l D
eve
lop
me
nt
in A
pri
l 2
018
.
31.1
S
tate
me
nt
of
Fin
an
cia
l P
os
itio
n
N
ote
B
al
per
dep
t
20
16
/17 A
FS
be
fore
tra
nsfe
r
Fu
ncti
on
s
pe
r d
ep
t
(tra
nsfe
rre
d
) /
rec
eiv
ed
Fu
nc
tio
ns
pe
r d
ep
t
(tra
ns
ferr
ed
) /
rec
eiv
ed
Fu
nc
tio
ns
pe
r d
ep
t
(tra
ns
ferr
ed
) /
rec
eiv
ed
20
16
/17 B
al
aft
er
tra
ns
fer
20
16
/17
20
16
/17
201
6/1
7
20
16
/17
20
16
/17
R’0
00
R
’00
0
R’0
00
R
’00
0
R’0
00
AS
SE
TS
Cu
rre
nt
As
se
ts
1
2 2
84
-
- -
12 2
84
Ca
sh
an
d c
ash
eq
uiv
ale
nts
10
620
-
- -
10 6
20
Pre
pa
ym
en
ts a
nd
ad
va
nce
s
17
-
- -
17
Re
ce
iva
ble
s
1
64
7
- -
- 1 6
47

220
DE
PA
RT
ME
NT
OF
EC
ON
OM
IC,
SM
AL
L B
US
INE
SS
DE
VE
LO
PM
EN
T,
TO
UR
ISM
AN
D E
NV
IRO
NM
EN
TA
L A
FF
AIR
S
VO
TE
3
NO
TE
S T
O T
HE
AN
NU
AL
FIN
AN
CIA
L S
TA
TE
ME
NT
S
for
the
ye
ar
en
de
d 3
1 M
arc
h 2
01
8
- 8
1 -
No
n-C
urr
en
t A
sse
ts
Re
ce
iva
ble
s
1
75
3
- -
- 1 7
53
TO
TA
L A
SS
ET
S
1
4 0
37
-
- -
14 0
37
LIA
BIL
ITIE
S
Cu
rre
nt
Lia
bil
itie
s
Vote
d f
un
ds t
o b
e s
urr
en
de
red
to t
he
Reve
nu
e F
un
d
1
1 9
20
-
- -
11 9
20
De
pa
rtm
en
tal
reve
nu
e
an
d
NR
F
Re
ceip
ts
to
be
su
rre
nd
ere
d t
o t
he
Reve
nu
e F
un
d
8
94
-
- -
894
Aid
assis
tan
ce
un
utilis
ed
29
4
- -
- 2
94
TO
TA
L L
IAB
ILIT
IES
13
108
-
- -
13 1
08
NE
T A
SS
ET
S
9
29
-
- -
929

221
DE
PA
RT
ME
NT
OF
EC
ON
OM
IC,
SM
AL
L B
US
INE
SS
DE
VE
LO
PM
EN
T,
TO
UR
ISM
AN
D E
NV
IRO
NM
EN
TA
L A
FF
AIR
S
VO
TE
3
NO
TE
S T
O T
HE
AN
NU
AL
FIN
AN
CIA
L S
TA
TE
ME
NT
S
for
the
ye
ar
en
de
d 3
1 M
arc
h 2
01
8
- 7
7 -
31.2
N
ote
s
N
ote
B
al
pe
r d
ep
t
20
16
/17
AF
S
be
fore
tra
ns
fer
Fu
nc
tio
ns
per
de
pt
(tra
ns
ferr
ed
) /
rece
ive
d
Fu
nc
tio
ns
pe
r d
ep
t
(tra
nsfe
rred
) /
rec
eiv
ed
Fu
nc
tio
ns
pe
r d
ep
t
(tra
ns
ferr
ed
) /
rec
eiv
ed
20
16
/17
Ba
l
aft
er
tra
ns
fer
20
16
/17
20
16
/17
20
16
/17
20
16
/17
20
16
/17
R’0
00
R
’00
0
R’0
00
R
’00
0
R’0
00
Co
ntin
ge
nt
liab
ilities
2
4 7
13
-
- -
24 7
13
Co
mm
itm
en
ts
4
0 6
92
-
- -
40 6
92
Pa
ya
ble
s n
ot
reco
gn
ise
d
1
62
2
- -
- 1 6
22
Em
plo
ye
e b
en
efits
23
39
0
- -
- 2
3 3
90
Le
ase
co
mm
itm
en
ts –
Op
era
tin
g le
ase
14
50
2
- -
- 1
4 5
02
Le
ase
co
mm
itm
en
ts –
Fin
an
ce
lea
se
1 3
61
-
- -
1 3
61
Accru
ed
de
part
me
nta
l re
ve
nu
e
1
8 1
67
-
- -
18 1
67
Irre
gu
lar
exp
en
ditu
re
7
7 7
88
-
- -
77 7
88
Pro
vis
ion
s
2
43
-
- -
243
Mo
va
ble
ta
ng
ible
ca
pita
l asse
ts
5
9 3
30
-
- -
59 3
30
Pro
vid
e a
de
scri
ptio
n o
f a
ctio
ns t
aken
to
en
su
re c
om
plia
nce w
ith t
he
PF
MA
S4
2
All
reco
rds o
f a
ffe
cte
d o
ffic
ials
(th
is is in
clu
siv
e o
f a
ll H
R a
nd
PE
RS
AL f
iles a
nd
re
co
rds)
will
be
tra
nsfe
rre
d t
o A
gri
cu
ltu
re a
nd
Ru
ral D
eve
lop
me
nt
an
d a
lis
t of
all
off
icia
ls t
o b
e t
ran
sfe
rre
d h
as b
een
dra
wn u
p.
All
mo
va
ble
asse
ts w
ill b
e t
ransfe
rre
d t
o D
ep
art
me
nt
of
Ag
ricultu
re a
nd
Ru
ral D
eve
lop
me
nt
an
d a
lis
t of
all
asse
ts t
o b
e tra
nsfe
rred
ha
s b
ee
n
dra
wn
up
for
the s
igna
ture
of
DE
ST
EA
HO
D a
nd a
cce
pta
nce b
y th
e H
OD
of
Agri
cu
lture
and
Ru
ral D
evelo
pm
en
t.

222
DE
PA
RT
ME
NT
OF
EC
ON
OM
IC,
SM
AL
L B
US
INE
SS
DE
VE
LO
PM
EN
T,
TO
UR
ISM
AN
D E
NV
IRO
NM
EN
TA
L A
FF
AIR
S
VO
TE
3
NO
TE
S T
O T
HE
AN
NU
AL
FIN
AN
CIA
L S
TA
TE
ME
NT
S
for
the
ye
ar
en
de
d 3
1 M
arc
h 2
01
8
- 8
3 -
Pro
vid
e a
refe
ren
ce
to t
he p
rocla
ma
tion
or
decla
ration
giv
ing
eff
ect
to t
he t
ran
sfe
r or
rece
ipt
of
fun
ctio
ns
Fre
e S
tate
Exe
cu
tive C
ou
ncil
resolu
tion
ap
pro
ved
by t
he
Pre
mie
r, M
r E
S M
ag
ash
ule
, o
n 1
0 O
cto
be
r 2
01
7.
Ind
ica
te w
he
ther
the
re w
as a
n a
gre
em
en
t dra
wn u
p,
and p
rovid
e a
de
scri
ptio
n o
f ro
les,
resp
onsib
ilitie
s a
nd a
cco
un
tabili
ty a
rra
ng
em
en
ts.
A s
ubm
issio
n f
or
the
tra
nsfe
r o
f off
icia
ls t
o t
he
De
pa
rtm
ent
of
Ag
ricultu
re a
nd
Rura
l D
eve
lop
me
nt
wa
s a
pp
rove
d b
y t
he
DE
ST
EA
ME
C,
ME
C B
Ma
lako
an
e,
on 1
4 D
ece
mbe
r 2
01
7.
It w
as c
lea
rly s
tate
d t
hat
the
co
nd
itio
ns o
f e
mp
loym
en
t fo
r th
e t
ran
sfe
rred
off
icia
ls w
ill n
ot,
in
an
y w
ay,
be
ne
ga
tive
ly a
ffe
cte
d a
s t
he
y w
ill r
eta
in t
he
ir c
urr
en
t sala
rie
s a
nd
be
ne
fits
.

223
DE
PA
RT
ME
NT
OF
EC
ON
OM
IC,
SM
AL
L B
US
INE
SS
DE
VE
LO
PM
EN
T,
TO
UR
ISM
AN
D E
NV
IRO
NM
EN
TA
L A
FF
AIR
S
VO
TE
3
NO
TE
S T
O T
HE
AN
NU
AL
FIN
AN
CIA
L S
TA
TE
ME
NT
S
for
the
ye
ar
en
de
d 3
1 M
arc
h 2
01
8
-
84
-
32.
ST
AT
EM
EN
T O
F C
ON
DIT
ION
AL
GR
AN
TS
RE
CE
IVE
D
NA
ME
OF
DE
PA
RT
ME
NT
GR
AN
T A
LL
OC
AT
ION
S
PE
NT
2
01
6/1
7
Div
isio
n o
f
Re
ve
nu
e
Ac
t/
Pro
vin
cia
l
Gra
nts
Ro
ll
Ove
rs
DO
RA
Ad
jus
t-
me
nts
Oth
er
Ad
jus
t-
me
nts
To
tal
Ava
ila
ble
Am
ou
nt
rec
eiv
ed
by
de
pa
rt-
me
nt
Am
ou
nt
sp
en
t b
y
de
pa
rt-
me
nt
Un
de
r /
(Ove
rsp
en
din
g)
% o
f
ava
ilab
le
fun
ds
sp
en
t b
y
de
part
-
me
nt
Div
isio
n
of
Re
ve
nu
e
Ac
t
Am
ou
nt
sp
en
t b
y
de
pa
rtm
en
t
R’0
00
R’0
00
R'0
00
R
'000
R
’00
0
R'0
00
R
'00
0
R'0
00
%
R
’000
R’0
00
EP
WP
In
ce
ntive
gra
nt
for
Infr
astr
uctu
re
2 0
00
- -
- 2
00
0
2 0
00
1 8
20
18
0
91
%
2 7
90
2 0
24
2
00
0
- -
- 2
00
0
2 0
00
1 8
20
18
0
91
%
2 7
90
2 0
24

224
DE
PA
RT
ME
NT
OF
EC
ON
OM
IC,
SM
AL
L B
US
INE
SS
DE
VE
LO
PM
EN
T,
TO
UR
ISM
AN
D E
NV
IRO
NM
EN
TA
L A
FF
AIR
S
VO
TE
3
AN
NE
XU
RE
S T
O T
HE
AN
NU
AL
FIN
AN
CIA
L S
TA
TE
ME
NT
S
for
the
ye
ar
en
de
d 3
1 M
arc
h 2
01
8
-
85
-
AN
NE
XU
RE
1A
S
TA
TE
ME
NT
OF
CO
ND
ITIO
NA
L G
RA
NT
S A
ND
OT
HE
R T
RA
NS
FE
RS
PA
ID T
O M
UN
ICIP
AL
ITIE
S
NA
ME
OF
MU
NIC
IPA
LIT
Y
GR
AN
T A
LL
OC
AT
ION
TR
AN
SF
ER
S
PE
NT
20
16/1
7
Do
RA
an
d
oth
er
tran
sfe
rs
Ro
ll
Ove
rs
Ad
jus
t-
me
nts
To
tal
Ava
ila
ble
Ac
tua
l
Tra
ns
fer
Fu
nd
s
Wit
hh
eld
Re
-
all
oc
ati
on
s b
y
Na
tio
na
l
Tre
as
ury
or
Na
tio
na
l
De
pa
rt-
me
nt
Am
ou
nt
rec
eiv
ed
by
mu
nic
i-
pa
lity
Am
ou
nt
sp
en
t b
y
mu
nic
ipa
l
ity
Un
sp
en
t
fun
ds
% o
f
avail
ab
le
fun
ds
sp
en
t b
y
mu
nic
i-
pa
lity
Div
isio
n
of
Re
ve
nu
e
Ac
t
R’0
00
R’0
00
R'0
00
R
'00
0
R'0
00
R
'00
0
%
R'0
00
R
'00
0
R'0
00
%
R
’00
0
Ma
silo
nya
na
a
nd
Se
tso
to
Mu
nic
ipa
lity
- -
- -
- -
- -
- -
- 2
30
TO
TA
L
- -
- -
- -
- -
- -
- 2
30

225
DE
PA
RT
ME
NT
OF
EC
ON
OM
IC,
SM
AL
L B
US
INE
SS
DE
VE
LO
PM
EN
T,
TO
UR
ISM
AN
D E
NV
IRO
NM
EN
TA
L A
FF
AIR
S
VO
TE
3
AN
NE
XU
RE
S T
O T
HE
AN
NU
AL
FIN
AN
CIA
L S
TA
TE
ME
NT
S
for
the
ye
ar
en
de
d 3
1 M
arc
h 2
01
8
-
86
-
AN
NE
XU
RE
1B
S
TA
TE
ME
NT
OF
TR
AN
SF
ER
S T
O D
EP
AR
TM
EN
TA
L A
GE
NC
IES
AN
D A
CC
OU
NT
S
DE
PA
RT
ME
NT
AL
AG
EN
CY
/
AC
CO
UN
T
TR
AN
SF
ER
AL
LO
CA
TIO
N
TR
AN
SF
ER
2
01
6/1
7
Ad
jus
ted
Ap
pro
pri
ati
on
Ro
ll
Ove
rs
Ad
jus
tme
nts
To
tal
Ava
ila
ble
Ac
tual
Tra
nsfe
r
% o
f
Avail
ab
le
fun
ds
Tra
ns
ferr
ed
Fin
al
Ap
pro
pri
ati
on
R'0
00
R
'00
0
R'0
00
R
'00
0
R'0
00
%
R
'000
PR
OV
DA
: F
S G
AM
BL
ING
& L
IQU
OR
AU
TH
PR
OV
DA
: F
S T
OU
RIS
M A
UT
HO
RIT
Y
CO
M:
LIC
EN
CE
S (
RA
DIO
& T
V)
58 3
49
46 5
06
200
- - -
-
7 8
70
-
58 3
49
54 3
76
20
0
53
695
59
076
39
92%
10
9%
90%
55 5
51
65 5
05
186
TO
TA
L
10
5 0
55
-
7 8
70
1
12 9
25
1
12
809
12
1 2
42

226
DE
PA
RT
ME
NT
OF
EC
ON
OM
IC,
SM
AL
L B
US
INE
SS
DE
VE
LO
PM
EN
T,
TO
UR
ISM
AN
D E
NV
IRO
NM
EN
TA
L A
FF
AIR
S
VO
TE
3
AN
NE
XU
RE
S T
O T
HE
AN
NU
AL
FIN
AN
CIA
L S
TA
TE
ME
NT
S
for
the
ye
ar
en
de
d 3
1 M
arc
h 2
01
8
-
87
-
AN
NE
XU
RE
1D
S
TA
TE
ME
NT
OF
TR
AN
SF
ER
S/S
UB
SID
IES
TO
PU
BL
IC C
OR
PO
RA
TIO
NS
AN
D P
RIV
AT
E E
NT
ER
PR
ISE
S
NA
ME
OF
PU
BL
IC
CO
RP
OR
AT
ION
/PR
IVA
TE
EN
TE
RP
RIS
E
TR
AN
SF
ER
AL
LO
CA
TIO
N
EX
PE
ND
ITU
RE
20
16
/17
Ad
jus
ted
Ap
pro
-
pri
ati
on
Act
Ro
ll
Overs
A
dju
stm
en
ts
To
tal
Ava
ila
ble
Ac
tua
l
Tra
ns
fer
% o
f
Ava
ila
ble
fun
ds
Tra
nsfe
rre
d
Ca
pit
al
Cu
rre
nt
Fin
al
Ap
pro
pri
ati
on
R'0
00
R
'00
0
R'0
00
R
'000
R
'00
0
%
R'0
00
R
'00
0
R'0
00
Pu
bli
c C
orp
ora
tio
ns
Tra
ns
fers
FR
EE
S
TA
TE
DE
VE
LO
PM
EN
T
CO
RP
OR
AT
ION
32
26
0
-
-
32
260
9 4
65
29
.3%
-
9 4
65
10 2
00
To
tal
32
26
0
- -
32
260
9
46
5
-
9 4
65
1
0 2
00
Pri
va
te E
nte
rpri
se
s
Tra
ns
fers
OT
HE
R
TR
AN
SF
ER
S
PR
IVA
TE
EN
TE
RP
R
FR
EE
S
TA
TE
B
US
INE
SS
CH
AM
BE
R
-
5 0
00
- -
- -
-
5 0
00
-
5 0
00
-
100
%
- -
-
5 0
00
- -
To
tal
5 0
00
-
- 5
000
5
00
0
-
5 0
00
-
TO
TA
L
37
26
0
- -
37
260
14
46
5
-
14
465
1
0 2
00

227
DE
PA
RT
ME
NT
OF
EC
ON
OM
IC,
SM
AL
L B
US
INE
SS
DE
VE
LO
PM
EN
T,
TO
UR
ISM
AN
D E
NV
IRO
NM
EN
TA
L A
FF
AIR
S
VO
TE
3
AN
NE
XU
RE
S T
O T
HE
AN
NU
AL
FIN
AN
CIA
L S
TA
TE
ME
NT
S
for
the
ye
ar
en
de
d 3
1 M
arc
h 2
01
8
-
88
-
AN
NE
XU
RE
1G
S
TA
TE
ME
NT
OF
TR
AN
SF
ER
S T
O H
OU
SE
HO
LD
S
HO
US
EH
OL
DS
TR
AN
SF
ER
AL
LO
CA
TIO
N
EX
PE
ND
ITU
RE
2
01
6/1
7
Ad
jus
ted
Ap
pro
-
pri
ati
on
Ac
t
Ro
ll
Ove
rs
Ad
jus
t-
me
nts
To
tal
Ava
ila
ble
Ac
tua
l
Tra
ns
fer
% o
f
Ava
ilab
le
fun
ds
Tra
ns
ferr
ed
Fin
al
Ap
pro
pri
ati
o
n
R'0
00
R
'000
R
'00
0
R'0
00
R
'00
0
%
R'0
00
Tra
ns
fers
H/H
EM
PL
S/B
EN
: L
EA
VE
GR
AT
UIT
Y
H/H
: D
ON
AT
ION
S &
GIF
TS
(C
AS
H)
80
2 0
20
- -
36
0
(10
)
44
0
2 0
10
59
1
1 0
39
134
%
52
%
626
649
TO
TA
L
2 1
00
-
35
0
2 4
50
1
63
0
1 2
75
AN
NE
XU
RE
1I
ST
AT
EM
EN
T O
F A
ID A
SS
IST
AN
CE
RE
CE
IVE
D
NA
ME
OF
DO
NO
R
PU
RP
OS
E
OP
EN
ING
B
AL
AN
CE
R
EV
EN
UE
E
XP
EN
DI-
TU
RE
PA
ID
BA
CK
O
N/B
Y 3
1
MA
RC
H
CL
OS
ING
B
AL
AN
CE
R'0
00
R
'00
0
R'0
00
R
'00
0
R'0
00
Re
ce
ive
d i
n c
ash
De
pa
rtm
en
t o
f E
nvir
on
me
nta
l A
ffa
irs
Fre
e S
tate
Prio
rity
Bio
div
ers
ity R
eh
ab
ilita
tion
Pro
ject
(FS
PB
R)
2
94
-
51
-
24
3
TO
TA
L
2
94
-
5
1
- 2
43

228
DE
PA
RT
ME
NT
OF
EC
ON
OM
IC,
SM
AL
L B
US
INE
SS
DE
VE
LO
PM
EN
T,
TO
UR
ISM
AN
D E
NV
IRO
NM
EN
TA
L A
FF
AIR
S
VO
TE
3
AN
NE
XU
RE
S T
O T
HE
AN
NU
AL
FIN
AN
CIA
L S
TA
TE
ME
NT
S
for
the
ye
ar
en
de
d 3
1 M
arc
h 2
01
8
-
89
-
AN
NE
XU
RE
3B
S
TA
TE
ME
NT
OF
CO
NT
ING
EN
T L
IAB
ILIT
IES
AS
AT
31
MA
RC
H 2
01
8
Na
ture
of
Lia
bil
ity
Op
en
ing
B
ala
nc
e
Lia
bil
itie
s
inc
urr
ed
d
uri
ng
th
e
ye
ar
Lia
bil
itie
s
pa
id/c
an
ce
lle
d/r
ed
uc
ed
d
uri
ng
th
e
ye
ar
Lia
bil
itie
s
rec
overa
bl
e (
Pro
vid
e
de
tail
s
he
reu
nd
er)
Clo
sin
g
Ba
lan
ce
1 A
pri
l 2
01
7
31
Ma
rch
2
01
8
R’0
00
R
’000
R
’00
0
R’0
00
R
’00
0
Cla
ims a
gain
st
the d
ep
art
me
nt
Ho
me
Ma
de
Reta
il 1
2 2
72
-
- -
12 2
72
P
KX
Ca
pita
l 1
2 4
41
-
- -
12 4
41
TO
TA
L
24
71
3
- -
- 2
4 7
13

229
DE
PA
RT
ME
NT
OF
EC
ON
OM
IC,
SM
AL
L B
US
INE
SS
DE
VE
LO
PM
EN
T,
TO
UR
ISM
AN
D E
NV
IRO
NM
EN
TA
L A
FF
AIR
S
VO
TE
3
AN
NE
XU
RE
S T
O T
HE
AN
NU
AL
FIN
AN
CIA
L S
TA
TE
ME
NT
S
for
the
ye
ar
en
de
d 3
1 M
arc
h 2
01
8
-
90
-
AN
NE
XU
RE
4
CL
AIM
S R
EC
OV
ER
AB
LE
Go
ve
rnm
en
t E
nti
ty
Co
nfi
rme
d b
ala
nc
e
ou
tsta
nd
ing
U
nc
on
firm
ed
ba
lan
ce
ou
tsta
nd
ing
T
ota
l C
as
h i
n t
ran
sit
at
ye
ar
en
d
20
17
/18
*
31/0
3/2
01
8
31/0
3/2
01
7
31
/03
/20
18
31
/03
/20
17
3
1/0
3/2
01
8
31
/03
/20
17
Rec
eip
t d
ate
up
to
s
ix (
6)
wo
rkin
g
da
ys a
fte
r ye
ar
en
d
Am
ou
nt
R’0
00
R’0
00
R’0
00
R
’000
R
’00
0
R’0
00
R’0
00
De
pa
rtm
en
t
He
alth
: F
S
226
-
- 1
020
22
6
1 0
20
-
-
Hu
ma
n S
ett
lem
en
t: G
P
- -
16
5
165
16
5
165
-
-
Le
gis
latu
re:
FS
-
- -
19
-
19
-
-
Agricu
lture
: F
S
1 2
78
-
- -
1 2
78
-
- -
TO
TA
L
1 5
04
-
16
5
1 2
04
1 6
69
1 2
04
-
-

230
DE
PA
RT
ME
NT
OF
EC
ON
OM
IC,
SM
AL
L B
US
INE
SS
DE
VE
LO
PM
EN
T,
TO
UR
ISM
AN
D E
NV
IRO
NM
EN
TA
L A
FF
AIR
S
VO
TE
3
AN
NE
XU
RE
S T
O T
HE
AN
NU
AL
FIN
AN
CIA
L S
TA
TE
ME
NT
S
for
the y
ear
en
ded
31 M
arc
h 2
01
8
-
91
-
AN
NE
XU
RE
5
INT
ER
-GO
VE
RN
ME
NT
PA
YA
BL
ES
G
OV
ER
NM
EN
T E
NT
ITY
Co
nfi
rmed
bala
nce
ou
tsta
nd
ing
U
nc
on
firm
ed
bala
nce
ou
tsta
nd
ing
T
OT
AL
C
as
h i
n t
ran
sit
at
year
en
d
2017/1
8 *
31/0
3/2
018
31/0
3/2
017
31/0
3/2
018
31/0
3/2
017
31/0
3/2
018
31/0
3/2
017
Pa
ym
en
t d
ate
up
to
six
(6)
wo
rkin
g
da
ys b
efo
re
ye
ar
en
d
Am
ou
nt
R’0
00
R’0
00
R’0
00
R’0
00
R’0
00
R’0
00
R
’000
DE
PA
RT
ME
NT
S
Cu
rren
t
Pre
mie
r 24
624
-
- 24
624
-
-
SA
PS
-
- -
23
-
23
-
-
Depart
ment
of
Rura
l,
Enviro
nm
enta
l and A
gricu
ltura
l D
evelo
pm
ent
- -
- 6
- 6
- -
TO
TA
L
24
624
-
29
24
653

231
DEPARTMENT OF ECONOMIC, SMALL BUSINESS DEVELOPMENT, TOURISM AND
ENVIRONMENTAL AFFAIRS
VOTE 3
ANNEXURES TO THE ANNUAL FINANCIAL STATEMENTS
for the year ended 31 March 2018
- 92 -
ANNEXURE 7 MOVEMENT IN CAPITAL WORK IN PROGRESS
MOVEMENT IN CAPITAL WORK IN PROGRESS FOR THE YEAR ENDED 31 MARCH 2018
Opening
balance
Current
Year
Capital
WIP
Ready for
use (Asset
register) /
Contract
terminated
Closing
balance
R’000 R’000 R’000 R’000
BUILDINGS AND OTHER FIXED STRUCTURES
Other fixed structures 56 926 4 100 61 026
TOTAL 56 926 4 100 61 026
Age analysis on ongoing projects
Number of projects 2016/17
Planned,
Construction
not started
Planned,
Construction
started
Total
R’000
0 to 1 Year -
1 to 3 Years 1 5 535
3 to 5 Years 2 31 324
Longer than 5 Years 1 24 164
Total 4 61 026
Include discussion on projects longer than 5 years in Capital WIP
Maria Moroka Resort - The project is on a Practical Completion stage and the retention monies have
been paid.
MOVEMENT IN CAPITAL WORK IN PROGRESS FOR THE YEAR ENDED 31 MARCH 2017
Opening
balance
Prior
period
error
Current
Year
Capital
WIP
Ready for
use (Asset
register) /
Contract
terminated
Closing
balance
R’000 R’000 R’000 R’000 R’000
BUILDINGS AND OTHER FIXED
STRUCTURES
Other fixed structures 43 802 - 13 124 - 56 926
TOTAL 43 802 - 13 124 - 56 926

232
NOTES

233
NOTES

234
NOTES

235
NOTES

236
NOTES

237
NOTES

238
NOTES

239
NOTES

240
NOTES

VOTE NO. 3
ANNUAL REPORT2017/18 FINANCIAL YEAR
DEPARTMENT OF ECONOMIC, SMALL BUSINESS DEVELOPMENT, TOURISM AND ENVIRONMENTAL AFFAIRS
FREE STATE PROVINCE
Free State Departm
ent of Economic, Sm
all Business Developm
ent, Tourism and Environm
ental Aff
airs Annual Report 2017/ 2018
Free State Department of Economic, Small Business Development, Tourism and
Environmental Affairs Annual Report 2017/ 2018
Physical: 113 St Andrew Street, Bloemfontein, 9300
Postal: P.O. Box X20801, Bloemfontein, 9300
Tel: (051) 400 9542Email: [email protected]
Website: www.detea.fs.gov.za
PR305/2018ISBN: 978-0-621-46603-4