2018-2023 price submission - urban
TRANSCRIPT

2018-2023 Price Submission - Urban Lower Murray Water 28 September 2017
Lower Murray Water Price Submission 2018-23 Urban| ii
ii
Highlights of LMW’s Urban Price Submission LMW Urban customers are overwhelmingly satisfied with the service LMW provides. Surveys demonstrate greater than 95% approval for two years running. Through the PREMO process, customers have engaged to tell us they value our services, want to see service levels maintained, and expect that we will improve incrementally and with prudence. Therefore our Submission outlines a price path that increases customer value through continuous improvement over the five years to 2023, with real prices proposed to decrease by 0.2% per annum. The drivers for this have been confirmed with our customers using their language, and with our Board through an iterative process; and will:
• minimise costs; • maintain services and standards; • value our local community presence; and • work with minimal environmental impact.
Customer outcomes are based on quantified engagement through surveys and through engagement with varied communities across our service area. LMW managers and staff live in our communities. Board and management engagement and feedback of community perceptions and expectations occur constantly. This proposal will deliver on our customer’s expectations. It sets an engagement standard that will continue through the Price Submission period to 2023 and beyond. LMW’s vision and strategy prepares the corporation for the future through significant change initiatives: Customer at the Centre, Culture Change, Business Transformation and Asset Optimisation, together designed to deliver customer preferences and outcomes. Our controllable costs will decrease and we commit to efficiency improvements of over 1% per annum. We have confirmed with our customers that our capital program will maintain service standards and support water security, community growth, the resilience of our networks, health-based targets and new commitments around emissions reduction. New government obligations required by the Minister’s Letter of Expectations and the Water for Victoria strategy will be delivered, often through regional multi-agency approaches. Risk allocation has been assessed at multiple levels aligned to customer preferences: in particular LMW plans to accept risk associated with (a) the volatile electricity market and (b) maximising revenues from water allocation sales. Management has delivered this Price Submission with extensive Board engagement over a long period to ensure this Submission is our ‘best offer’, and that we address each element of the PREMO framework. LMW’s self-assessed PREMO rating is “Standard”, proposing improved customer value through sustainable change by ‘Maintaining service with continuous improvement while containing costs’. This rating is underpinned by a stable track record in delivering strong performance outcomes and managing ‘for the customer’ through a demonstrated willingness to accept risk and return additional revenue to customers.

Lower Murray Water Price Submission 2018-23 Urban| iii
iii

Lower Murray Water Price Submission 2018-23 Urban| iv
iv
Lower Murray Water Acknowledgement of the Aboriginal Traditional Owners of the Region Lower Murray Water operates within the traditional lands of First Nations People; these groups are, starting from the furthest upstream group along the Murray (Mil) and moving downstream through to the Western edge of our area at the Victorian South Australian Border: The Barapa Barapa Peoples, the Wamba Wamba Peoples, the Wadi Wadi Peoples, the Tatti Tatti Peoples, the Latji Latji Peoples, the Nyeri Nyeri Peoples and the Werigia Peoples. The management and staff at Lower Murray Water proudly acknowledge the traditional owners and respect their connection to both their land and waterways. Importantly, we at Lower Murray Water also acknowledge that the land and water in which we operate, is still the life blood of the traditional owners of this land. The stories that connected the ancestors to their world still connect the First Nations Peoples of this area today. The land and water are to be respected and nurtured, to be in keeping with these First Nations Peoples.

Lower Murray Water Price Submission 2018-23 Urban| v
v
Executive Summary
Introduction
While LMW operates as a single business entity, its prices are regulated under two different regulators with different regulatory frameworks. Urban services are regulated by the Essential Services Commission (ESC) under the Victorian government’s Water Industry Regulatory Order 2014 (WIRO) and the rural services operated within the Murray-Darling Basin are regulated by the Australian Competition and Consumer Commission (ACCC) under the Water Charge Infrastructure Rules (WCIR).
This Price Submission is for urban water supply and sewerage services. Costs for shared services, such as corporate, are allocated between the urban and rural parts of the business. The price submission for rural water supply services is provided separately to this submission.
A five-year regulatory price period is proposed, consistent with previous practice and with the regulatory period proposal for LMW’s rural business.
Overview of Proposed Urban Prices
Proposed annual urban combined water and sewerage prices for the period to 2022-23 are shown in Table 1. These tariffs represent a decrease of 0.2% per annum in real terms or dollars as at 1 January 2018 ($ 1/1/18).
Table 1 Proposed Urban Tariffs – $ 1/1/18
Current Fourth Regulatory Period
Amounts in $ 1/1/18 2017-18 2018-19 2019-20 2020-21 2021-22 2022-23
Annual Water Service Charges (20 mm connection)
Residential 203.20 202.79 202.38 201.97 201.56 201.15
Non residential 203.20 202.79 202.38 201.97 201.56 201.15
Annual Sewerage Service Charges (base charge)
Residential 479.68 478.71 477.74 476.77 475.80 474.83
Non residential 479.68 478.71 477.74 476.77 475.80 474.83
Water Volumetric Charges- per kL
1st tier residential 0.4414 0.4405 0.4396 0.4387 0.4378 0.4369
2nd tier residential 0.8033 0.8017 0.8000 0.7984 0.7968 0.7952
3rd tier residential 1.0323 1.0302 1.0281 1.0260 1.0239 1.0219
Non-residential 0.8033 0.8017 0.8000 0.7984 0.7968 0.7952
Minor Trade Waste
Charge 66.80 66.66 66.53 66.39 66.26 66.13

Lower Murray Water Price Submission 2018-23 Urban| vi
vi
For an average residential customer using 477 kL of water, the proposed prices translate into an average decrease in their annual water and sewerage bill of $1.93 per annum in real terms. The primary drivers for the price changes are the net result of:
• Electricity cost increases,
• Efficiencies in business processes, energy efficiency and procurement, and asset management,
• Investment in IT network security,
• Increase in the Regulatory Asset Base (RAB), and
• Workforce efficiency gains.
Examples of the price impacts for both residential and non-residential customers are shown in Table 2.
Table 2 Water and Sewerage Bill Changes
$1/1/18 Current Fourth Regulatory Period
2017-18 2018-19 2019-20 2020-21 2021-22 2022-23
RESIDENTIAL Total Bill Increase from previous year
400 kL 895.63 -1.82 -1.81 -1.81 -1.81 -1.80
477 kL (average) 957.48 -1.94 -1.94 -1.93 -1.93 -1.93
1,200 kL 1675.67 -3.40 -3.39 -3.39 -3.38 -3.37
NON-RESIDENTIAL Total Bill Increase from previous year
400 kl 524.52 -2.04 -2.03 -2.03 -2.02 -2.02
3,000 kl 2,613.10 -6.27 -6.26 -6.25 -6.24 -6.22
30,000 kl 24,302.20 -50.27 -50.17 -50.06 -49.96 -49.86
220,000 kl 176,929.20 -359.86 -359.13 -358.41 -357.68 -356.95
Average residential bill changes from 2017-18 are set out in Figure 1, showing a proposed gradual decline in real prices throughout the fourth and fifth regulatory periods to 2027-28.
Figure 1 Proposed Urban Price Changes – Average Residential Bill - $1/1/18

Lower Murray Water Price Submission 2018-23 Urban| vii
vii
Overview of Proposed Customer Outcomes
In 2016, LMW identified a need to have a deeper level of engagement with customers. Adopting the International Association of Public Participation (IAP2) principles for customer engagement, LMW created a new Customer Engagement Strategy as part of the preparation for this Price Submission preparation. The ‘deeper’ level of engagement took LMW from an ‘inform’ level of consultation to ‘involve’, which provided LMW with a strong link from customer wants to the outcomes proposed in this submission.
Extensive customer engagement revealed a strong customer preference for ‘maintaining services with continuous improvement while containing costs’, and was expressed by customers as: minimising costs, maintaining services and standards, valuing local community presence, and working with minimal environmental impact.
As a consequence there is no significant, or step change, in price path or tariff structure for customers over the next period, reflecting high levels of customer satisfaction while seeking improved value for money, as shown in Figure 2. LMW will strive to continue to improve customer service standards, drive efficiency and improve risk management to maintain pressure on costs.
Figure 2 Customer Satisfaction With Water Services
Following four rounds of engagement, debate, revision and agreement with its customer forums, LMW adopted six customer outcomes, plus a further outcome to: ‘Comply with other government obligations’. The proposed six customer outcomes, their performance assessment criteria and indicative target performance over the PS4 period are shown in Table 3 below, demonstrating that LMW will accept more risk with higher targets and commits to a number of new service performance targets, whilst maintaining service levels at least at current levels.
Lower Murray Water Price Submission 2018-23 Urban| viii
viii
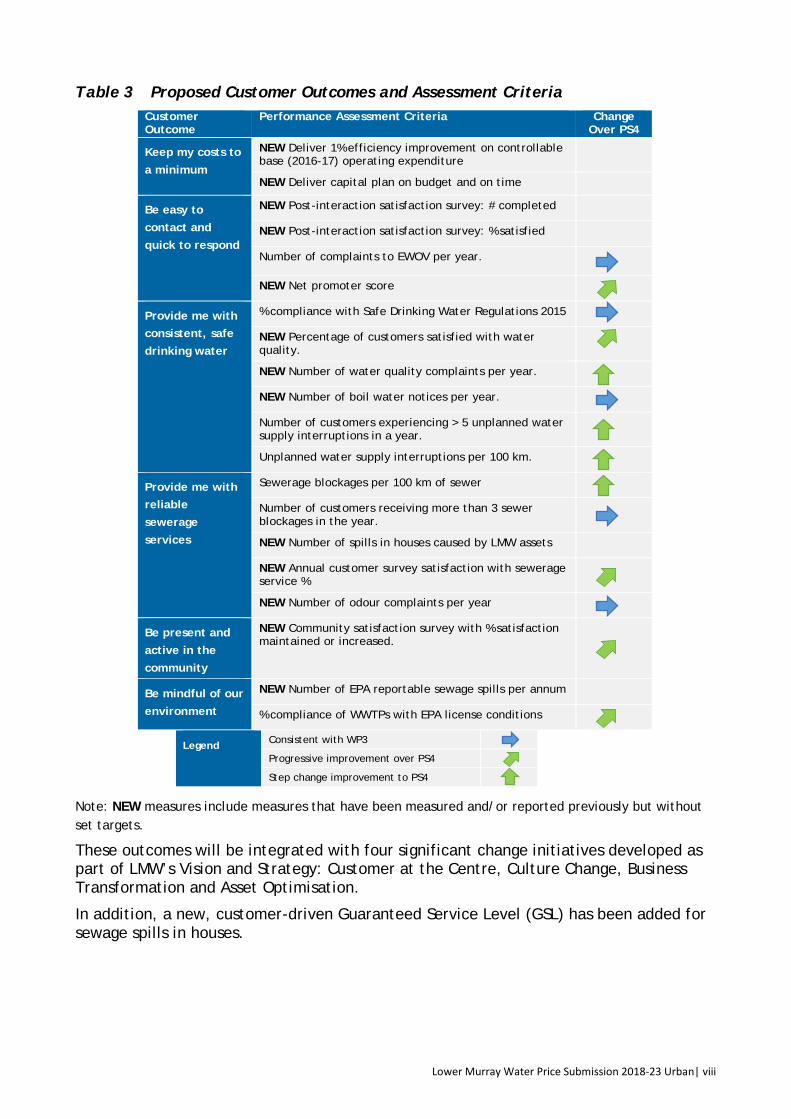
Table 3 Proposed Customer Outcomes and Assessment Criteria
Note: NEW measures include measures that have been measured and/or reported previously but without set targets.
These outcomes will be integrated with four significant change initiatives developed as part of LMW’s Vision and Strategy: Customer at the Centre, Culture Change, Business Transformation and Asset Optimisation.
In addition, a new, customer-driven Guaranteed Service Level (GSL) has been added for sewage spills in houses.
Customer Outcome
Performance Assessment Criteria Change Over PS4
Keep my costs to a minimum
NEW Deliver 1% efficiency improvement on controllable base (2016-17) operating expenditure
NEW Deliver capital plan on budget and on time
Be easy to contact and quick to respond
NEW Post-interaction satisfaction survey: # completed
NEW Post-interaction satisfaction survey: % satisfied
Number of complaints to EWOV per year.
NEW Net promoter score
Provide me with consistent, safe drinking water
% compliance with Safe Drinking Water Regulations 2015
NEW Percentage of customers satisfied with water quality.
NEW Number of water quality complaints per year.
NEW Number of boil water notices per year.
Number of customers experiencing > 5 unplanned water supply interruptions in a year.
Unplanned water supply interruptions per 100 km.
Provide me with reliable sewerage services
Sewerage blockages per 100 km of sewer
Number of customers receiving more than 3 sewer blockages in the year.
NEW Number of spills in houses caused by LMW assets
NEW Annual customer survey satisfaction with sewerage service %
NEW Number of odour complaints per year
Be present and active in the community
NEW Community satisfaction survey with % satisfaction maintained or increased.
Be mindful of our environment
NEW Number of EPA reportable sewage spills per annum
% compliance of WWTPs with EPA license conditions
Legend Consistent with WP3
Progressive improvement over PS4
Step change improvement to PS4
Lower Murray Water Price Submission 2018-23 Urban| ix
ix
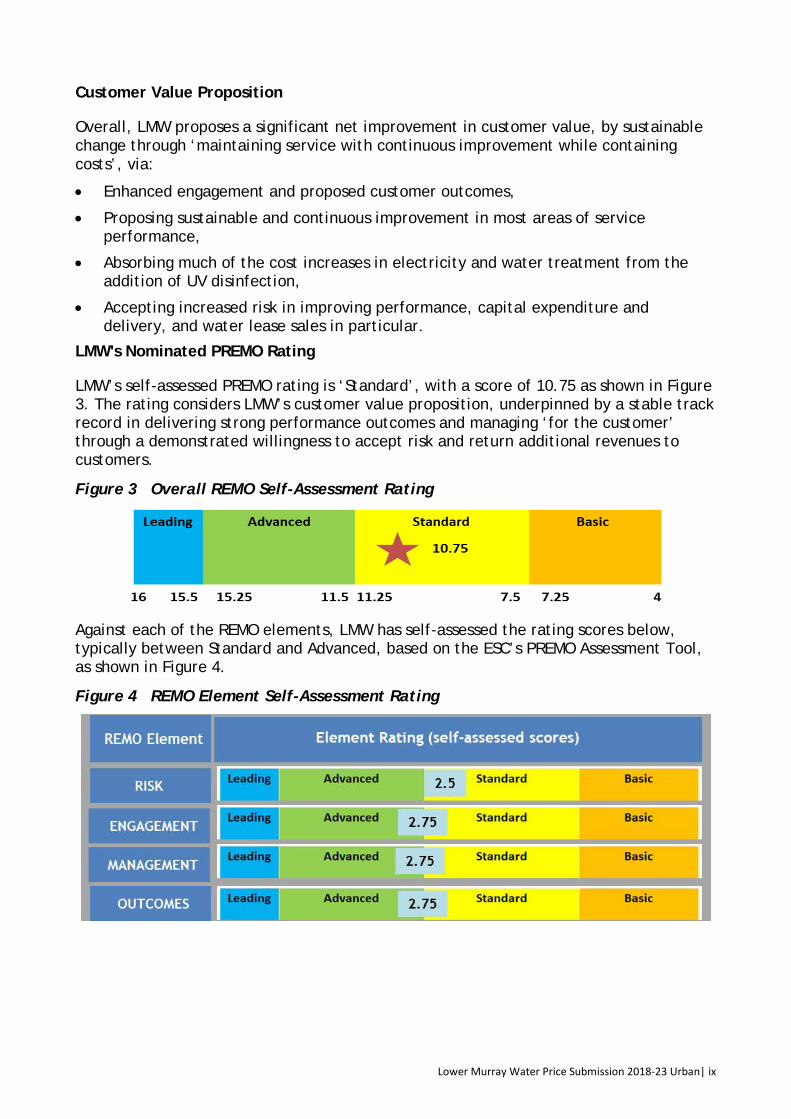
Customer Value Proposition
Overall, LMW proposes a significant net improvement in customer value, by sustainable change through ‘maintaining service with continuous improvement while containing costs’, via:
• Enhanced engagement and proposed customer outcomes,
• Proposing sustainable and continuous improvement in most areas of service performance,
• Absorbing much of the cost increases in electricity and water treatment from the addition of UV disinfection,
• Accepting increased risk in improving performance, capital expenditure and delivery, and water lease sales in particular.
LMW's Nominated PREMO Rating
LMW’s self-assessed PREMO rating is ‘Standard’, with a score of 10.75 as shown in Figure 3. The rating considers LMW’s customer value proposition, underpinned by a stable track record in delivering strong performance outcomes and managing ‘for the customer’ through a demonstrated willingness to accept risk and return additional revenues to customers.
Figure 3 Overall REMO Self-Assessment Rating
Against each of the REMO elements, LMW has self-assessed the rating scores below, typically between Standard and Advanced, based on the ESC’s PREMO Assessment Tool, as shown in Figure 4.
Figure 4 REMO Element Self-Assessment Rating
Contents 1. Lower Murray Water Urban Business Summary .................................................... 1
1.1 Business Entity ........................................................................................................................... 1
1.2 LMW Urban Services .................................................................................................................. 1
1.3 Customers and Assets ............................................................................................................... 2
1.4 Operating Context ....................................................................................................................... 2
2. Customer Engagement ............................................................................................. 3
2.1 Customer Engagement Approach and Basis ........................................................................... 3
2.2 What LMW’s Customers Say ...................................................................................................... 6
3. Customer Outcomes ................................................................................................. 8
3.1 Proposed Outcomes Agreed With Customers ......................................................................... 8
3.1.1 Proposed Outcomes, Outputs, Deliverables and Targets. ............................................... 8
3.2 Proposed Performance Assessment and Reporting ............................................................... 9
3.3 Delivery on Outcomes Commitments ..................................................................................... 12
3.4 Guaranteed Service Levels ...................................................................................................... 13
4. LMW’s Strategic Response .................................................................................... 14
4.1 LMW’s Strategic Approach ...................................................................................................... 14
4.2 Government and Other Obligations ........................................................................................ 14
4.3 LMW’s Vision and Strategic Themes ...................................................................................... 15
4.3.1 Customer at the Centre .................................................................................................. 16 4.3.2 Business Transformation ................................................................................................ 16 4.3.3 Culture Change ............................................................................................................... 17 4.3.4 Asset Optimisation .......................................................................................................... 17
4.4 Performance Track Record ...................................................................................................... 18 4.4.1 Service Standards and Other Outcomes ........................................................................ 18 4.4.2 Actual Capital Expenditure for the Delivery of Outcomes............................................... 20 4.4.3 Actual Operating Expenditure for the Delivery of Outcomes .......................................... 21 4.4.4 Actual Revenue for 2013-18 ........................................................................................... 22 4.4.5 Return of Revenue to Customers ................................................................................... 23
5. Management ............................................................................................................ 24
5.1 Management of the Price Submission .................................................................................... 24

Lower Murray Water Price Submission 2018-23 Urban| xii
xii
5.1.1 Substantial Assumptions ................................................................................................ 25 5.1.2 PREMO Rating ............................................................................................................... 26
5.2 Managing Risk ........................................................................................................................... 29
5.3 Regulatory Period ..................................................................................................................... 30
6. Revenue Requirement............................................................................................. 31
6.1 Overview of Revenue Requirement ......................................................................................... 31
6.2 Demand ...................................................................................................................................... 32 6.2.1 LMW Demand Context ................................................................................................... 32 6.2.2 Summary of Approach to Demand Forecasting ............................................................. 33 6.2.3 Demand Influences and Assumptions ............................................................................ 34 6.2.4 Water & Sewerage Demand Forecasts .......................................................................... 36
6.3 Forecast Operating Expenditure ............................................................................................. 39
6.3.1 Actual and Planned Operating Expenditure ................................................................... 39 6.3.2 Baseline Controllable Operating Expenditure ................................................................. 40 6.3.3 Electricity Costs .............................................................................................................. 41 6.3.4 Additional Costs for PS4 ................................................................................................. 42 6.3.5 Productivity Improvements for the Forthcoming Period.................................................. 43 6.3.6 Allocation of Shared Costs ............................................................................................. 44
6.4 Forecast Capital Expenditure .................................................................................................. 44 6.4.1 Basis for Development of the Capital Program .............................................................. 44 6.4.2 Forecast Capital Expenditure ......................................................................................... 45 6.4.3 Major Projects ................................................................................................................. 47 6.4.4 Programs and Other Projects ......................................................................................... 48 6.4.5 Delivery of the Capital Program ...................................................................................... 48 6.4.6 Uncertain Projects........................................................................................................... 49 6.4.7 Capex/Opex Tradeoffs .................................................................................................... 49
6.5 Return on the RAB .................................................................................................................... 50 6.5.1 Regulatory Depreciation ................................................................................................. 51 6.5.2 Return on Equity. ............................................................................................................ 52
6.6 Tax Allowance ........................................................................................................................... 52
7. Prices........................................................................................................................ 53
7.1 Form of Price Control ............................................................................................................... 53
7.2 Prices and Tariff Structures ..................................................................................................... 54 7.2.1 Introduction ..................................................................................................................... 54 7.2.2 Tariff Structures .............................................................................................................. 54 7.2.3 Proposed Tariffs .............................................................................................................. 56 7.2.4 New Customer Contributions .......................................................................................... 57 7.2.5 Negotiated Trade Waste ................................................................................................. 58 7.2.6 Miscellaneous Revenues for Prescribed Services ......................................................... 58

Lower Murray Water Price Submission 2018-23 Urban| xiii
xiii
7.3 Adjustment to Prices ................................................................................................................ 59 7.3.1 Uncertain or Unforeseen Events ..................................................................................... 59 7.3.2 Trailing Cost of Debt ....................................................................................................... 59 7.3.3 Electricity Prices .............................................................................................................. 60
7.4 Non-Prescribed Services .......................................................................................................... 63 7.4.1 Classification of Services as Non-Prescribed ................................................................. 63 7.4.2 Expenditure and Revenue Associated With Non-Prescribed Services .......................... 63
7.5 Financial Position ..................................................................................................................... 64
Figures Figure 1 Proposed Urban Price Changes – Average Residential Bill - $1/1/18 .......................................... vi Figure 2 Customer Satisfaction With Water Services ................................................................................ vii Figure 3 Overall REMO Self-Assessment Rating ....................................................................................... ix Figure 4 REMO Element Self-Assessment Rating ...................................................................................... ix Figure 5 LMW Operating Area .................................................................................................................... 1 Figure 6 Price Submission Customer Engagement Overview .................................................................... 3 Figure 7 Timeline for Price Submission Customer Engagement ................................................................ 4 Figure 8 Maturity of Customer Engagement Process ................................................................................. 5 Figure 9 Customer Survey Results for Overall Satisfaction ........................................................................ 6 Figure 10 LMW’s Strategic Alignment to Customer Outcomes ................................................................... 14 Figure 11 Actual Capital Expenditure Compared to Approved Forecast $M – 1/1/18 ................................ 20 Figure 12 Actual Operating Expenditure Compared to Approved Forecast ................................................ 22 Figure 13 Actual Revenue Compared to Approved Forecast ..................................................................... 23 Figure 14 Aggregate REMO Self-Assessment Rating ................................................................................ 26 Figure 15 REMO Element Self-Assessment Rating .................................................................................... 26 Figure 16 Revenue Requirement - $M 1/1/18 ............................................................................................. 31 Figure 17 Average Annual Rainfall .............................................................................................................. 32 Figure 18 Residential Consumption and Rainfall Trends ............................................................................ 33 Figure 19 Actual and Forecast Volumetric Demand ................................................................................... 37 Figure 20 Forecast Operating Expenditure - $M 1/1/18 .............................................................................. 40 Figure 21 Forecast Capital Expenditure ...................................................................................................... 46 Figure 22 Historical and Forecast Urban and Rural Capital Program ......................................................... 49 Figure 23 Rolling Forward the Regulatory Asset Base to 2027-28 ............................................................. 51 Figure 24 Return on Equity Based on PREMO Rating ............................................................................... 52 Figure 25 Proposed Urban Price Changes – Average Residential Bill $1/1/18 .......................................... 57 Figure 26 Price Adjustment Scenarios ........................................................................................................ 61
Tables Table 1 Proposed Urban Tariffs – $ 1/1/18 ................................................................................................. v Table 2 Water and Sewerage Bill Changes ............................................................................................... vi Table 3 Proposed Customer Outcomes and Assessment Criteria .......................................................... viii Table 4 Urban Water Supply and Sewerage Customers and Assets (2016-17) ....................................... 2 Table 5 Sample Customer Outcome Template .......................................................................................... 9 Table 6 Proposed Performance Assessment Criteria .............................................................................. 10 Table 7 Customer Activity Commitments ................................................................................................. 11 Table 8 Proposed Guaranteed Service Level Scheme ............................................................................ 13 Table 9 LMW Strategy Area Alignment to Customer Outcomes ............................................................. 15 Table 10 Service Performance for WP3 Period 2013-18 ........................................................................... 19 Table 11 Actual Capital Expenditure for 2013-18 ($M 1/1/18) ................................................................... 20

Lower Murray Water Price Submission 2018-23 Urban| xiv
xiv
Table 12 Actual Operating Expenditure for 2013-18 ($M 1/1/18) .............................................................. 21 Table 13 Actual Revenue for 2013-18 ($M 1/1/18) .................................................................................... 23 Table 14 Key PS4 Assumptions ................................................................................................................. 25 Table 15 REMO Self-Assessment Summary ............................................................................................. 27 Table 16 Significant Risks and their Management ..................................................................................... 29 Table 17 Revenue Requirement – $M 1/1/18 ............................................................................................ 31 Table 18 Price Elasticity Assumptions ....................................................................................................... 35 Table 19 Connection Forecasts ................................................................................................................. 36 Table 20 Forecast Annual Demand per Equivalent Connection ................................................................ 36 Table 21 Water Volumetric Demand Forecast – ML pa ............................................................................. 37 Table 22 Wastewater Flows ....................................................................................................................... 38 Table 23 Forecast Number of Development Lots ...................................................................................... 38 Table 24 Actual and Planned Operating Expenditure ($M 1/1/18) ............................................................ 39 Table 25 Baseline Controllable Operating Expenditure 2016-17. .............................................................. 41 Table 26 Forecast Capital Expenditure by Service Category - $M 1/1/18 ................................................. 46 Table 27 Forecast Capital Expenditure by Cost Driver - $M 1/1/18 .......................................................... 47 Table 28 Top Ten Proposed Capital Projects and Programs .................................................................... 48 Table 29 Updating the Regulatory Asset Base .......................................................................................... 50 Table 30 Rolling Forward the Regulatory Asset Base ............................................................................... 51 Table 31 Proposed Urban Tariffs – $ 1/1/18 .............................................................................................. 56 Table 32 Water Service Charge by Meter Size - 2017-18 charges ........................................................... 56 Table 33 Water and Sewerage Bill Changes ............................................................................................. 57 Table 34 New Customer Contributions ($ 1/1/18) ...................................................................................... 58 Table 35 Miscellaneous Revenue .............................................................................................................. 59 Table 36 Forecast Energy Costs ($M – Urban, Large Sites, Financial Year) ............................................ 60 Table 37 Baseline Volumetric Charges and Energy Prices ....................................................................... 62 Table 38 Non- Prescribed Revenues ......................................................................................................... 63 Table 39 Non Prescribed Expenditure ....................................................................................................... 63 Table 40 Financial Indicators ..................................................................................................................... 64
Appendices Appendix A Customer Outcomes .................................................................................................................... 65 Appendix B Capital Expenditure ...................................................................................................................... 72 Appendix C Major Project Summaries ............................................................................................................. 74 Appendix D Miscellaneous Charges ................................................................................................................ 77

Lower Murray Water Price Submission 2018-23 Urban| 1
1
1. Lower Murray Water Urban Business Summary
1.1 Business Entity Lower Murray Urban & Rural Water Authority was formed on 1 July 2004, and became the Lower Murray Urban and Rural Water Corporation (LMW) On 1 July 2007. On 19th August 2008, it took over the functions of the First Mildura Irrigation Trust (FMIT). While LMW operates as a single business entity, its prices are regulated under two different regulators and regulatory frameworks: the Essential Services Commission (ESC) for urban services under the Victorian government’s Water Industry Regulatory Order 2014 (WIRO); and the Australian Competition and Consumer Commission (ACCC) for rural services operated within the Murray-Darling Basin under the Water Charge Infrastructure Rules (WCIR).
1.2 LMW Urban Services LMW operates across the municipalities of Mildura, Swan Hill and Gannawarra in North-Western Victoria.
LMW delivers urban water supply and wastewater services to towns along the Murray River in Victoria, from Kerang to Mildura providing:
• Treated drinking water to 14 cities and towns, and
• Sewerage collection, wastewater treatment and effluent disposal to 12 cities and towns.
Figure 5 depicts LMW’s operating area in Victoria and key services.
Figure 5 LMW Operating Area

Lower Murray Water Price Submission 2018-23 Urban| 2
2
1.3 Customers and Assets LMW pumps and treats raw water from the Murray and Loddon Rivers and from Goulburn Murray Water irrigation channels, and supplies almost 37,000 customers from both residential and commercial/industrial sectors. LMW collects and treats wastewater more than 30,000 connections from residential and commercial/industrial customers. Table 4 summarises customer and asset data for urban water and sewerage.
Table 4 Urban Water Supply and Sewerage Customers and Assets (2016-17)
Urban customers and volumes Water supply Sewerage
Permanent Population Served 71,827 61,371
Equivalent Residential Connections 30,036 26,216
Equivalent Non-residential Connections 6,907 4,518 Total Equivalent Connections 36,943 30,734 Water Consumption or Wastewater Collected: Residential 12,833 ML Water Consumption or Wastewater Collected: Non-residential 4,200 ML Total Volume Water Supplied / Wastewater Collected (ML) 17,033 ML 6,062 ML Assets Water supply Sewerage Treatment plants (No.) 9 10 Pumping stations (No.) 38 113 Water mains / sewers (km) 962 km 647 km
1.4 Operating Context LMW’s operating region is highly productive, delivering $2.8 billion per annum0F
1 in gross regional product to the Victorian and Australian economy. Conversely, the region is relatively remote and covers a large geographic area extending over 300 km along the lower Murray River, in the driest part of Victoria.
LMW recognises that its customers’ and community’s overall well-being and livelihood is directly linked to the agricultural, tourism and support industries which form the region’s economic backbone. The relationship between water resources and the region’s social and economic success is critical – as part of this relationship LMW must deliver its services efficiently and appropriately.
These factors pose challenges for control of essential water services and their efficient management, whilst also providing opportunities for greater community engagement and a contribution to the community and its growth through the synergies of a combined urban and rural water business. Critical risks for LMW include:
• Water security and maintaining community amenity and liveability, especially under drought conditions
• Flood, blackwater and blue-green algae events causing highly variable water quality over sustained periods and associated increases in operational costs
• Maintaining affordability of water services to the community under the economic impacts of fluctuating food commodity prices and volatile electricity prices.
1 Mildura Development Corporation www.milduraregion.com.au/region

Lower Murray Water Price Submission 2018-23 Urban| 3
3
2. Customer Engagement
2.1 Customer Engagement Approach and Basis LMW embarked on a journey of significant change to engage customers more deeply, broadly and earlier than in previous price submissions in order to:
• get to the heart of customer issues and concerns,
• define what is important and valued by customers,
• specifically develop customer outcomes, and
• validate operating and capital expenditure and price paths.
The journey was integrated with an overall Customer Engagement Strategy1F
2 endorsed by the Board, designed to build strong relationships with customers, communities and partners to enable informed decision making and deliver sustainable outcomes. The Strategy incorporated the values, ethics and process for public participation as established by the International Association of Public Participation (IAP2).
Specifically for the Price Submission and to align with the PREMO framework, an approach was designed as depicted in Figure 62F
3, recognising both the urban and rural parts of the business and the diversity of LMW’s customer groups and geographic regions.
Figure 6 Price Submission Customer Engagement Overview
2 LMW Customer Engagement Strategy for 2016-18 3 LMW Presentation on Pricing Submission Customer Engagement, August 2017.
Customer Value Proposition – Engagement LMW’s engagement process enabled it to understand customer needs and expectations through deeper, broader and earlier engagement than ever before. The approach was carefully planned and delivered using multiple communication platforms to openly seek input from across the customer base, from September 2016 to September 2017. Customers heavily influenced and approved the proposed set of defined customer outcomes and areas of expenditure. LMW is committed to continuing to engage, to ensure its plans are in line with what customers value.

Lower Murray Water Price Submission 2018-23 Urban| 4
4
The approach was developed into a delivery plan along with funding, resourcing and a delivery timeline, shown in Figure 7, commencing in September 2016 and progressing through to finalisation of the draft Price Submission in August 2017.
Figure 7 Timeline for Price Submission Customer Engagement
LMW deliberately chose to engage early and proactively through multiple channels because past experience of engagement on urban issues had met with limited responses from our customers. Well-advertised public meetings held at customer friendly times that required a customer to interact with LMW have historically attracted few customers. This is not the case on the rural side of the business. LMW realised that it would have to proactively seek input, and that a large number of people would need to be canvassed to generate a group of people who were genuinely engaged and committed to the PS4 process. LMW also realised that it would take time to work up responses to customer’s requirements and several interactions on issues would be required to refine the positions included within PS4.
LMW tailored the engagement process so that customers across the region were provided with multiple, iterative opportunities and methods to contribute their views over a sustained period of time, from a broad invitation to contribute, through to individual and group customer engagement on service needs and preferences. This enabled LMW to process and analyse the information and progressively build and test the customer outcomes and the projects and activities required to deliver them.
While LMW requested deliberate feedback on a number of issues to generate discussion, the engagement process requested customers to raise any issues that resonated with them. There were no items that were quarantined from discussion. LMW did not specifically engage on matters that were viewed as a regulatory requirement but did explain and discuss these matters if they were raised by customers.
Specifically, LMW:
• Reviewed existing customer information and annual customer survey data to identify service performance gaps and any specific issues and concerns
• Undertook a research based, quantitative Urban survey (Bartley Consulting, November 2016)

Lower Murray Water Price Submission 2018-23 Urban| 5
5
• Conducted customer and stakeholder interviews by LMW extended leadership team including the Executive Team, with both urban residential and commercial customers and major stakeholders
• Developed and implemented an on-line survey that received 121 responses from urban and rural customers
• Used social media and electronic communication to update and inform the community of the pricing submission process and its requirements. For example, the use of a Pricing Submission informational video clip on Facebook had over 20,000 views
• One on One in-person surveys conducted through direct engagement, for example, pop up kiosks at Mildura farmers markets and Mildura Centro shopping centre, seeking input from a wide range of customer groups, which engaged with more than 500 customers across LMW’s regions
• 10 focus groups representing 10 key segments, along with the members of LMW’s Customer Consultative Committee (CCC), met over some 11 meetings to identify customer needs and priorities facilitated by consultants One Idea (One Idea, June 2017), and develop, refine and agree to customer outcomes along with their performance measures and key projects and activities
• A further four focus group meetings and interaction via electronic means to review draft operating and capital expenditure and price path proposals.
The key to LMW’s engagement in this process has been to identify the key customer concerns and issues, along with specific areas where customer sought a better level of service overall, while ensuring that price was considered. The process also ensured much broader and diverse groups of customers engaged with LMW than ever before. For example LMW deliberately met with members of Sunraysia Mallee Ethnic Community Council to discuss LMW’s services and to satisfy itself that all customers were given a reasonable and fair opportunity to participate and have their views heard.
LMW’s level of maturity in customer engagement directly relating to the Price Submission, compared with the previous Water Plan 3, is depicted in Figure 8, showing improvement towards deeper, broader and earlier engagement with customers.
Figure 8 Maturity of Customer Engagement Process
LMW maintains extensive records of its customer engagement processes, resources and materials, feedback and customer inputs which are available to the ESC upon request.
Lower Murray Water Price Submission 2018-23 Urban| 6
6
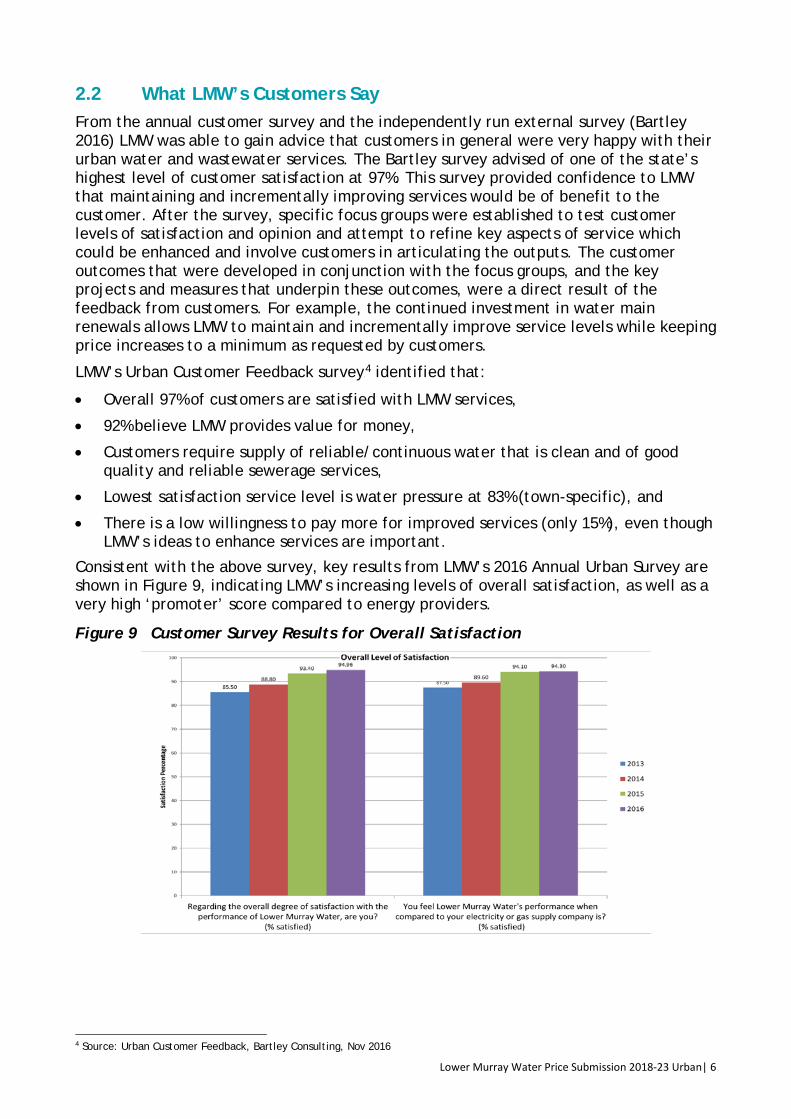
2.2 What LMW’s Customers Say From the annual customer survey and the independently run external survey (Bartley 2016) LMW was able to gain advice that customers in general were very happy with their urban water and wastewater services. The Bartley survey advised of one of the state’s highest level of customer satisfaction at 97%. This survey provided confidence to LMW that maintaining and incrementally improving services would be of benefit to the customer. After the survey, specific focus groups were established to test customer levels of satisfaction and opinion and attempt to refine key aspects of service which could be enhanced and involve customers in articulating the outputs. The customer outcomes that were developed in conjunction with the focus groups, and the key projects and measures that underpin these outcomes, were a direct result of the feedback from customers. For example, the continued investment in water main renewals allows LMW to maintain and incrementally improve service levels while keeping price increases to a minimum as requested by customers.
LMW’s Urban Customer Feedback survey3F
4 identified that:
• Overall 97% of customers are satisfied with LMW services,
• 92% believe LMW provides value for money,
• Customers require supply of reliable/continuous water that is clean and of good quality and reliable sewerage services,
• Lowest satisfaction service level is water pressure at 83% (town-specific), and
• There is a low willingness to pay more for improved services (only 15%), even though LMW’s ideas to enhance services are important.
Consistent with the above survey, key results from LMW’s 2016 Annual Urban Survey are shown in Figure 9, indicating LMW’s increasing levels of overall satisfaction, as well as a very high ‘promoter’ score compared to energy providers.
Figure 9 Customer Survey Results for Overall Satisfaction
4 Source: Urban Customer Feedback, Bartley Consulting, Nov 2016

Lower Murray Water Price Submission 2018-23 Urban| 7
7
This survey supported and extended the information from LMW’s own annual customer survey process, and helped LMW to identify areas of service enhancement important to customers, including:
• Employ local staff and contractors where possible,
• Provide personal service on the phone or through an office,
• Reduce greenhouse gas emissions,
• Provide financial support to customers experiencing significant hardship,
• Provide access to real time property or billing/payments information online,
• Enable account payments online or via smart phone.
In summary, LMW’s customer engagement revealed strong customer views of:
Further more detailed and specific engagement identified the following urban customer needs and priorities4F
5:
• No additional investment to increase treatment capacity for managing ‘blackwater’ events, with LMW managing these events well, but improved communication possible
• Purchase additional water entitlements over time to maintain a 50% buffer between forecast demand and bulk water entitlements to minimise risk of severe water restrictions and their impact on customers and local amenity to maintain the ‘community fabric’
• Guaranteed service level compensation is not as important compared to LMW’s responsiveness and communication on service interruptions. No expectation of increased GSLs, except for sewage flooding of a house. Any rebates should be paid as an account credit. Customers have a high level of trust in LMW’s performance and want them to deal with issues as they arise
• Expand urban network into rural areas where appropriate, but not at a cost to existing customers
• Renewals of water mains and sewers should be maintained or additional investment ‘built in’ to maintain reliable services
• Implement digital customer services gradually while maintaining customer preferences for existing methods (paper bills, etc.)
• Improve water and sewerage system reliability through use of standby power generators
• Continue water mains cleaning for water quality (e.g. After a blackwater event), supported by analysis prior to work, allowing cleaning once in the forthcoming regulatory period.
5 Source: LMW Urban Customer Needs and Priorities, One Idea, June 2017
‘Maintaining service with continuous improvement while containing costs‘,
expressed in key preferences of:
• minimising costs, • maintaining services and standards,
• valuing local community presence, and • working with minimal environmental impact.

Lower Murray Water Price Submission 2018-23 Urban| 8
8
3. Customer Outcomes
3.1 Proposed Outcomes Agreed With Customers
3.1.1 Proposed Outcomes, Outputs, Deliverables and Targets. Following four rounds of engagement, debate and revision with its customers, LMW adopted the following seven customer outcomes along with the associated performance measures and targets:
1. Keep my costs to a minimum
2. Be easy to contact and quick to respond
3. Provide me with consistent, safe, clean drinking water
4. Provide me with reliable sewerage services
5. Be present and active in the community
6. Be mindful of our environment
7. Comply with other government obligations
LMW also committed to and gained agreement from customers, to the major change projects, key operational activities, and inputs in terms of cost movements and resources required to achieve these customer outcomes.
The outcomes are detailed in Appendix A in a format that is easily understood and was agreed with customers, as shown in the Table 5 example from Appendix A, overleaf, for LMW’s priority customer outcome of ‘Keep My Costs To A Minimum’.
Customer Value Proposition – Outcomes
With its customers, and expressed in customer language, LMW collaboratively developed a set of outcomes, outputs, performance targets, programs and activities based on what customers said they valued: ‘Maintaining service with continuous improvement while containing costs’. LMW will deliver the agreed outcomes while delivering a 0.2% real cost decrease per annum to its customers, and will measure performance and report to customers on progress.

Lower Murray Water Price Submission 2018-23 Urban| 9
9
Table 5 Sample Customer Outcome Template
What customers will receive
Customer Outcome: Keep My Costs To A Minimum
Performance measures and targets
• Deliver residential price path as approved by the ESC • Deliver 1% efficiency improvement on controllable base (2016-17) operating
expenditure • 100% of statutory compliance reports generated automatically • Deliver capital plan on budget and on time
Major change projects • Business Transformation Project (costs efficiencies and customer service) • Culture Program around “running it like their own business” • Electricity and renewables cost reduction Project
Key operational activities
• Utilise natural attrition to reduce staff numbers • Collaborate with other agencies to reduce costs through bulk purchasing
and shared services • Maintain long term financial viability and sustainability through full cost
recovery • Manage assets to optimise whole of life cycle costs • Communicate effectively with customers on aesthetic water quality events
such as Blackwater. We will not ‘gold plate assets for rare events’ • Install solar to reduce electricity costs
Inputs • Cost movements • Resources required
• 3 new resources: asset management analyst and 2 business process resources
• $2.6M in labour savings delivered over Price Submission 4, a substantial portion through natural attrition.
A number of regional and local projects have been developed to align with the customer outcomes and specifically address customer needs and priorities which were revealed during the engagement process. These include:
• Piangil and Koondrook water main replacements to enable water pressure improvements,
• Water treatment and control system improvements in all towns to better manage poor raw water quality events and provide greater drinking water quality assurance, and
• Additional standby generators to sustain water services during power failures.
Notably, there are no significant customer-identified urban projects or activities that LMW has not included in its projects or activities.
3.2 Proposed Performance Assessment and Reporting Proposed performance standards and targets for reporting to customers are derived from the customer outcomes detailed in Appendix A. Where possible and appropriate, LMW has utilised measures from the current ESC performance reporting suite to track performance and demonstrate improvement over time. These are supplemented by a range of new measures agreed with customers, eg. a post interaction service satisfaction rating. The proposed Performance Assessment Criteria along with their annual targets are summarised in Table 6 overleaf, and the broader Customer Activity Commitments are summarised in Table 7 that follows.

Lower Murray Water Price Submission 2018-23 Urban| 10
10
Table 6 Proposed Performance Assessment Criteria
Customer Outcome
Performance Assessment Criteria
Average/Target
for WP3
Annual target for fourth regulatory period 2018-
19 2019-
20 2020-
21 2021-
22 2022-
23 Be easy to contact and quick to respond
Post-interaction satisfaction survey: # completed
N/A 150 150 150 150 150
Post-interaction satisfaction survey: % satisfied
N/A > 80% > 80% > 80% > 80% > 80%
Number of complaints to EWOV per year.
11/ no target
< 10 < 10 < 10 < 10 < 10
Net promoter score 26% for 2016-17
26% 27% 28% 29% 30%
Provide me with consistent, safe drinking water
% compliance with Safe Drinking Water Regulations 2015
100% /100%
100% 100% 100% 100% 100%
Percentage of customers satisfied with water quality.
91%/no target
> 90% > 91% > 92% > 93% > 94%
Number of water quality complaints per year.
44/no target
< 25 < 25 < 25 < 25 < 25
Number of boil water notices per year.
0/no target
0 0 0 0 0
Number of customers experiencing > 5 unplanned water supply interruptions in a year.
0/15 0 0 0 0 0
Unplanned water supply interruptions per 100 km.
23.2
/51.34
< 25 < 25 < 25 < 25 < 25
Provide me with reliable sewerage services
Sewerage blockages per 100 km of sewer
16.7 /22.6
< 20 < 20 < 20 < 20 < 20
Number of customers receiving more than 3 sewer blockages in the year.
0/0 0 0 0 0 0
Number of spills in houses caused by LMW assets
N/A <= 2 <= 2 <= 2 <= 2 <= 2
Annual customer survey satisfaction with sewerage service %
93%/no target
> 90% > 90% > 90% > 90% > 91%
Number of odour complaints per year
9/no target
< 10 < 10 < 10 < 10 < 10
Be present and active in the community
Community satisfaction survey with % satisfaction maintained or increased.
91%/no target
> 92% > 93% > 94% > 95% > 95%
Be mindful of our environment
Number of EPA reportable sewage spills per annum
1.5/no target
<= 2 <= 2 <= 2 <= 2 <= 2
% compliance of WWTPs with EPA license conditions
98.5% /100%
100% 100% 100% 100% 100%
Notes: WP3 is Water Plan 3 period from 2013 to 2017.
‘N/A’ signifies no previous data available.
‘No target’ signifies data previously collected but no target set.

Lower Murray Water Price Submission 2018-23 Urban| 11
11
Table 7 Customer Activity Commitments
Customer Outcome Performance Measure/Target Report Description
Keep my costs to a minimum
Deliver residential price path Residential urban prices compared to ESC approved price path
Deliver 1% per annum efficiency improvement
Efficiency improvement on controllable costs from 2016-17 base year, measured net of growth, new obligations and abnormal events
Deliver capital plan on budget and on time
Capital program progress against ESC approved capital expenditure budget and individually at major project level (> $1 million value)
100% statutory compliance reports generated automatically.
Status update on automatic compliance reporting
Provide me with consistent, safe drinking water
% compliance with Health-Based Targets (HBT) by 2020.
Status of UV project completion and level of compliance % for all urban water supplies
Be present and active in the community
Local engagement groups meet formally at least annually with yearly ‘Pop up Kiosks’ in major centres
Number and location/format of groups (may be online). Details of Pop Up Kiosks – dates, attendance/engagement, content/activities of kiosk
Publish “LMW News” informing community on activities on monthly basis
Number of LMW News published on website and key topics covered
Run an annual open day of key local infrastructure
Date of open day, attendance/engagement, content/activities of open day
Develop/deliver strategy for cultural minorities inclusion
Status of development and delivery of strategy.
Be mindful of our environment
Reduce CO2 emissions by 16,800 tonnes during life of PS4.
Extent of CO2 emissions reduced by efficiencies, renewable production and offsets compared to forecast emissions at end of each year.
All key sites have generator availability or capability to maintain services in event of sustained power outage
Status of generator availability for all key sites (# completed vs total # of key sites)
Comply with other government obligations
% compliance with government reporting and policy requirements
Status of compliance against government reporting requirements.
Implement strategies to deliver Letter of Expectations and associated policies (Water for Victoria)
Status of strategies against Letter of Expectations and associated policies (Water for Victoria).
Performance monitoring results of all the criteria and targets detailed in Table 6 and Table 7 will be published annually in summary on LMW’s website with a downloadable performance report, along with any interim reporting determined as appropriate and relevant. The report will be supported by explanations of progress towards targets and updates on key capital and internal projects. Results will be reported to and discussed with Customer Committees as part of normal meeting regimes.
In addition to the above customer reporting, LMW has a range of reporting obligations to the Department of Environment, Land, Water and Planning under its Statement of Obligations and the Minister’s Letter of Expectations, and to other regulators, of which much is also required to be reported publicly. LMW will continue to report its performance against the ESC’s suite of performance measures in accordance with

Lower Murray Water Price Submission 2018-23 Urban| 12
12
current practice for the WP3 period. LMW intends to review its Customer Charter during 2018, and will establish an approved set of performance measures and proposed targets for the next 10 years.
3.3 Delivery on Outcomes Commitments LMW’s Board adopted the Customer Engagement Strategy in 2016 and the principles articulated by the IAP2. The key aim of this is to ensure a better level of trust, service and appreciation between customers and stakeholders and LMW.
LMW’s journey to engage more deeply and earlier with customers has already paid dividends in terms of improved relationships with a broad group of customers, and a recognition by customers that LMW honestly and earnestly seeks a better understanding of their needs. LMW will build on this early engagement to maintain momentum by acting on its commitments before commencement of the next price period as well as establishing customer reporting arrangements based on the customer outcomes.
Internal reporting to the Board and management for tracking of progress will also be implemented, with the measures above forming a key component of LMW’s strategic scorecard. The strategic scorecard will cascade key performance indicators throughout the business to allow all staff to have ‘line of sight’ of where their actions influence the outputs of the business and the overall achievement of customer outcomes. The strategic scorecard will become a key business process with frequent review at Board and Executive level. This means that there will be a greater level of customer engagement embedded throughout the entire organisation.
LMW will maintain its Customer Committee structure meeting arrangements and will be adopting a new digital communication method to ensure continual updates on achievements can be provided to the community. This is to ensure accountability in meeting the outcomes agreed with the community and that the actions LMW has articulated over the 5 year period are being completed.
Commitments have been made to customers to further engage and adapt to changing circumstances and changing customer preferences by:
• Maintain the representative focus group and conduct, as a minimum annually, briefing sessions to advise on progress against the customer outcomes
• Undertaking periodic customer telephone surveys
• Providing opportunities for indigenous engagement as our Reconciliation Action Plan develops and our relationship strengthens.
In this way the relevance of the outcomes and measures can be tested and refined as PS4 progresses. It is anticipated that this process will feed directly into PS5 and influence the annual business planning process.
As discussed in Section 4.4, and as evidenced by the urban customer satisfaction rating, LMW has a strong track record of meeting customer expectations. LMW is confident that it will deliver on the outcomes included in this submission. Should LMW underperform on outcome delivery, it will engage with its customers and determine a suitable response. Responses could range from customers determining that this is priority issue and resources being redirected to focus on achieving this outcome or deciding that the current level of performance is adequate.

Lower Murray Water Price Submission 2018-23 Urban| 13
13
3.4 Guaranteed Service Levels Customer engagement regarding GSLs revealed that customers value the reliability of the key services of water and sewerage. Consistent with overall feedback, customers were very happy with the service levels that they currently receive. When combined with explanations regarding continued investment in renewals and operating expenditure and given LMW’s strong historical performance, customers did not think that lower thresholds or higher payments were required, despite this being explicitly offered. Customers preferred LMW to focus on continuing to just ‘get on and fix’ issues as quickly as possible.
The only exception to this was the impact of sewage spills within houses, where customers considered that the associated high level of inconvenience warranted a large customer rebate. This has been reflected in a proposed new GSL with a high rebate, demonstrating that LMW has substantially increased its risk acceptance and seeks to drive improved performance in an area which has high customer impact and could have reputational consequences for LMW.
Customers felt very strongly that any rebates should be paid as an account credit not as a cash payment.
Consequently, LMW proposed changes that were tested with customer representatives in the customer focus groups and endorsed by the Board. These agreed GSL outcomes are detailed below in Table 8 along with any changes from the current regulatory period.
Table 8 Proposed Guaranteed Service Level Scheme
Service Rebate Applies Under Service Circumstances
Proposed Rebate
Change from Previous Period
Water Supply
More than 5 unplanned water supply interruptions in a year.
$75 No change.
Sewerage More than 3 sewer blockages in a year $75 No change.
Sewerage Sewage spill within house caused by LMW assets where customers internal plumbing is functioning correctly.
$1500
GSL changed from spills not contained within 5 hours to a more customer-oriented service.
Payment difficulty - Hardship
Restricting the water supply of, or taking legal action against, a customer prior to taking reasonable endeavours (as defined by the Essential Services Commission) to contact the customer to test for hardship.
$300
No change.

Lower Murray Water Price Submission 2018-23 Urban| 14
14
4. LMW’s Strategic Response
4.1 LMW’s Strategic Approach LMW has developed a strategic approach to ensure alignment of customer needs and expectations, outcomes, the LMW vision and strategies, and business outputs and deliverables This enables effective pricing and service performance outcomes, and is shown in Figure 10. This Price Submission has been developed using this strategic approach and related processes.
Figure 10 LMW’s Strategic Alignment to Customer Outcomes
4.2 Government and Other Obligations In addition to customer outcomes derived in close consultation with customers, LMW has significant legislative requirements and expectations from government stakeholders, many of which have a significant impact on the LMW business and its strategies, services, plans and processes. The most important of these include:
• Minister’s Letter of Expectations5F
6 and Statement of Obligations6F
7, with major changes derived from Water for Victoria: the State Water Plan7F
8, including most significantly:
– Climate change adaptation and net-zero carbon emissions – Aboriginal and recreational water values – Resilient and liveable cities and towns, including affordability – Diversity and inclusion.
• Department of Treasury and Finance, revised Standing Directions including Risk Management Framework and Asset Management Accountability Framework
• Drinking Water Quality – Department of Health and Human Services (DHHS), Health-based water quality targets
• Environmental Requirements - Environment Protection Authority (EPA). 6 2017-18 Ministerial Expectations and Corporate Plan Guidelines for Water Corporations, 14 February 2017 7 Statement of Obligations, 20/12/15 8 Water for Victoria, State Government Victoria

Lower Murray Water Price Submission 2018-23 Urban| 15
15
These requirements are integrated in the strategic approach outlined above, and will be met through the implementation of LMW’s Vision and Strategic Themes explored in Section 4.3 below.
4.3 LMW’s Vision and Strategic Themes To deliver the customer outcomes and government requirements and as part of LMW’s strategic planning process, the LMW Board and Executive developed Vision 2023, its blueprint for the future. Inherent in Vision 2023 and all LMW’s planning for delivery of services, LMW developed four key strategic themes:
• Customer at the Centre
• Business Transformation
• Asset Optimisation
• Culture Change.
The strategic themes are strongly aligned and are integral to delivering the agreed customer outcomes in Section 3.1, as shown below in Table 9.
Table 9 LMW Strategy Area Alignment to Customer Outcomes
Strategic Theme
Customer Outcome Customer at the Centre
Business Transformation
Asset Optimisation
Culture Change
Keep my costs to a minimum
Be easy to contact and quick to respond
Provide me with consistent, safe drinking water
Provide me with reliable sewerage services
Be present and active in the community
Be mindful of our environment
Comply with other government obligations
A range of supporting documentation is available to the ESC to underpin this submission, with more details of strategic projects, initiatives and their management. In particular, LMW’s Corporate Plan8F
9 sets out more details of the business strategies and initiatives commenced and intended to progress through the next regulatory period. The more important aspects of each of the four strategic themes are summarised below.
9 LMW Corporate Plan 2017-18
Lower Murray Water Price Submission 2018-23 Urban| 16
16
4.3.1 Customer at the Centre LMW’s strategic theme of ‘Customer at the Centre’ commenced and gained momentum during preparations for this Price Submission, and includes:
• The significant journey to engage with customers more deeply, more broadly and earlier as noted in Section 2.1, with a Customer Engagement Strategy designed to build strong relationships with customers, communities and partners. This has been applied to engagement for the Price Submission and will continue to be implemented for all major LMW projects including the Urban Water Strategy
• Embedding customer engagement methods through facilitated focus groups, increased external customer surveys, social media interaction and greater use of Customer Committees
• Creating an Executive Manager Customer and Stakeholder position and a Customer Experience Team that incorporates Revenue and Reception front-of-house services in one group to improve customer service and make it more accessible and easier for the customer. This shares the message with LMW’s community that the business is on a new path
• A new website and Customer Portal is under development which will improve accessibility and capacity for self-service in paying bills, reading meters, viewing and updating information. This will also improve services to developers, builders and plumbers
• Faster turnaround times for response to customer service requirements
• Development of a Reconciliation Action Plan, which will include engagement with traditional owners to identify values in water management, cultural awareness for staff, and development of employment and procurement opportunities.
4.3.2 Business Transformation Business transformation is being led through the Transform project, which aims to streamline customer service delivery, operational efficiency and simplicity, as well as reducing costs. This will enable LMW to serve its customers with greater flexibility and agility.
The Transform project will bring with it significant organisational change, namely:
• Improved customer interaction and information via online services and social media
• Automated operations, business processes and reporting
• Flexible workforce enabled by mobility
• Transparency of information and improved decision making enabled by analytics
• Improved business continuity and resilience enabled by cloud.
The project will also incorporate needs for managing data through data warehousing, standardising hardware platforms and software, and upgrading protective systems against emergencies and threats.
The appointment of a Chief Information Officer in 2016 has unified these business improvement activities under one champion, and the Transform project is being driven by this position to ensure its success.
Lower Murray Water Price Submission 2018-23 Urban| 17
17
4.3.3 Culture Change To ensure success of the implementation of the key strategies and business transformation identified, the right skills and mindset in the business are required. LMW has identified changes required to ensure it continues on its journey to deliver a productive, performance driven culture.
LMW has initiated a highly consultative organisational restructure and recruited two new executives along with more effective succession planning. Further steps in 2017-18 are establishing the platform for benefits throughout the next regulatory period including:
• Community support and involvement through support for community events and organisations, educational events and programs, awareness of water issues, and community art
• A new performance management framework
• A training focus on people management
• Creating opportunities for improved diversity through improving recruitment processes, a traineeship and cadetship program, and ensuring that LMW’s promotional materials reflect the diversity of the organisation and the local community
• Improvement to workplace culture through improved work methods and styles, as well as developing shared values and preferred behaviours to guide people in their work, as evidenced by Organisational Cultural Identity (OCI) survey results.
4.3.4 Asset Optimisation Optimising assets will contribute to improved customer outcomes in terms of service reliability and compliance, managed risk and efficiency of decision making and service delivery. The theme encompasses a range of initiatives covering management systems, lifecycle asset management (planning, asset acquisition, operations and maintenance, asset renewal and disposal), information systems and data (also linked to the Transform project) and capability (resources, skills and tools).
As part of this initiative, LMW has developed an implementation plan for compliance with the Asset Management Accountability Framework (AMAF) and the principles of ISO55000, the international standard for an Asset Management System.
In 2016, LMW commenced on a pathway to System Management, through introducing an ‘input-activity-output’ business process perspective for management of service delivery systems and networks. System Management will embed consideration of operations, assets, risk and efficiency with outputs focused on customer service outcomes.
Together, these initiatives will also:
• Assist the customer culture of LMW with a focus on the systems and processes which produce services to customers
• Promote greater clarity in customer service objectives at the level of each water-related system
• Improve the assessment of performance of systems and decision-making based on these assessments to address gaps and risks
• Improve the justification of resources and budgets, including business cases for new initiatives, and in turn to improve pricing submissions to regulators
• Improve efficiencies by targeting renewals programs to higher risk ‘critical’ assets, and optimising preventive maintenance and condition-based inspections.
Lower Murray Water Price Submission 2018-23 Urban| 18
18
4.4 Performance Track Record LMW has a strong track record in delivering commitments, managing service performance and meeting approved budgets over the past three regulatory periods. This section summarises LMW’s performance and cost outcomes over the Water Plan 3 (WP3) period to date, and is provided to support LMW’s PREMO rating in the following section.
4.4.1 Service Standards and Other Outcomes LMW has met or bettered most service performance targets approved for the WP3 period, as shown in Table 10 overleaf. Performance of both water and sewerage networks was maintained at a high level due to LMW’s continuing focus on responsiveness to service requests and ongoing commitment to water main replacement and sewer renewals. The exception of the planned average duration water supply interruptions not meeting the target was attributed to some larger main replacements exceeding estimated installation times due to unforeseen events, and the unprecedented growth of new subdivisions within the district. LMW continues to review and identify improvements to work methods to assist in reducing times of planned interruption to customers.
LMW achieved 100% compliance with the water quality standards detailed in Schedule 2 of the Safe Drinking Water regulations 2015, and the 2011 Australian Drinking Water Guidelines (ADWG), despite a significant blue green algae bloom in 2015-16, and a blackwater and severe storm events in recent years. LMW also achieved 98.5% compliance with the Environment Protection Authority (EPA) WWTP corporate licence conditions that can be attributed to LMW’s proactive approach to water and wastewater treatment. LMW use highly skilled and qualified engineers and operators, progressively upgrades water and wastewater treatment plants, uses live online water quality data to optimise treatment processes and alert on-call staff to address process faults, and has a vigorous verification monitoring program.
LMW also maintains its assets utilising established and new technologies to assist with preventive maintenance programs, ensuring constant monitoring of asset condition and operating capacity.

Lower Murray Water Price Submission 2018-23 Urban| 19
19
Table 10 Service Performance for WP3 Period 2013-18
Urban Service Standards Outcome to date
Water
Unplanned water supply interruptions (per 100km)
Average time taken to attend bursts and leaks - Priority 1, 2, 3
Water supply interruptions restored within 5 hours (%) – Unplanned, Planned
Average customer minutes off water supply – Unplanned, Planned
Average frequency of water supply interruptions – Unplanned, Planned
Average duration of water supply interruptions (minutes) – Unplanned, Planned
No. of customers experiencing > 5 unplanned water supply interruptions in the year
Unaccounted for water
Sewerage
Sewerage blockages (per 100km)
Average time to attend sewer spills and blockages (minutes)
Average time to rectify a sewer blockage (minutes)
Spills contained within 5 hours (%)
Customers receiving more than 3 blockages in the year
Customer Service
Complaints to EWOV (per 1000 customers)
Telephone calls answered within 30 seconds %
Other notable improvements or outcomes over the WP3 period that improved customer service include: • LMW met its extended obligations for management of sewer connections to 1 metre
inside a property boundary, adding an estimated $1.1 million to LMW’s operating expenditure over the WP3 period. This cost has been absorbed by LMW
• In 2017-18, improvements are proposed in customer service via digital communications platform, improving customer’s ability to view bills and usage, pay accounts, submit a meter read, and update details
• Commencement of an investment program for more fixed and mobile generators following the 27 hour power outage in the Swan Hill region in 2016 which resulted in no LMW service disruptions (although outside water use was discouraged)
Legend
Met target in all years
Met target in most years and on average
Did not meet target in most years

Lower Murray Water Price Submission 2018-23 Urban| 20
20
• Investment in a common remote monitoring and control platform (ClearSCADA) to provide a greater level of control and flexibility of operation. Remote monitoring and resolution of issues has increased dramatically, driving efficiencies throughout the business.
4.4.2 Actual Capital Expenditure for the Delivery of Outcomes Actual capital expenditure over the WP3 period is expected to be $58.61 million, with the service category and annual expenditure breakdown as shown in Table 11.
Table 11 Actual Capital Expenditure for 2013-18 ($M 1/1/18)
Service Category 2013-14 2014-15 2015-16 2016-17 2017-18 Total
Water 4.97 5.66 8.59 2.76 7.46 33.80
Water corporate 0.87 0.77 0.67 0.74 1.27 4.17
Sewerage 6.39 2.47 1.57 2.30 4.73 17.08
Sewerage corporate 0.74 0.66 0.57 0.63 1.09 3.55
Recycled water 0.00 0.00 0.00 0.00 0.00 0.00 Total Actual Capital Expenditure 12.97 9.56 11.40 6.44 14.55 58.61 Total Approved Capital Expend. 17.55 13.83 11.27 7.17 9.81 59.63
Note: 2017-18 figures are expected estimates, not actual.
This total is within 2% of the ESC approved forecast of $59.63 million (1/1/18), with the annual comparison of actual and approved forecast shown in Figure 11.
Figure 11 Actual Capital Expenditure Compared to Approved Forecast $M – 1/1/18
Most major projects and all renewals programs were completed generally under budget which enabled delivery of a number of projects arising from LMW undertaking risk and condition assessments. The Merbein diversion to Koorlong WWTP was unable to be completed due to insufficient storage capacity at Koorlong, which is addressed in PS4. Some Mildura Water Supply Upgrade mains changed priorities due to different development growth than initially planned, works by other agencies and based on

Lower Murray Water Price Submission 2018-23 Urban| 21
21
condition of the mains. A number of critical risk and efficiency improvements for automation of water and wastewater treatment plants were delivered over budget due to scope additions to replace incompatible or obsolete equipment.
In all cases, changes to projects were carefully planned, risks and options were considered and validated internally and changes approved by the Board where required. Projects were delivered either through competitive tendering processes or by available internal resources for projects such as some water mains renewals, or where integration with existing assets posed a higher risk requiring significant LMW operational coordination.
All capital expenditure is considered to be prudent and efficient in accordance with WIRO regulatory requirements.
4.4.3 Actual Operating Expenditure for the Delivery of Outcomes Table 12 and Figure 12 show actual operating expenditure (by expenditure category and annual cost breakdown) over the WP3 period is expected to be $111.19 million, compared to the ESC approved forecast of $106.63 million (1/1/18).
Table 12 Actual Operating Expenditure for 2013-18 ($M 1/1/18)
Expenditure Category 2013-14 2014-15 2015-16 2016-17 2017-18 Total
Operations & Maintenance 11.74 12.96 14.22 14.97 14.04 67.94
Treatment 1.17 1.37 1.33 1.37 1.33 6.57
Customer Service and billing 1.08 1.18 1.30 1.32 1.19 6.07
GSL Payments - - - - - -
Corporate 3.92 3.90 3.85 4.46 3.87 20.00
External bulk water charges 0.79 0.80 0.83 0.73 0.72 3.86
External water allocation purchases - 0.05 - - - 0.05
Licence fees 0.09 0.11 0.07 0.08 0.08 0.43
Environment Contribution 1.30 1.27 1.25 1.23 1.21 6.27 Total Actual Operating Expenditure 20.10 21.64 22.85 24.17 22.43 111.19 Total Approved Operating Expend. 21.13 21.24 21.68 21.24 21.35 106.63
Note: 2017-18 figures are expected estimates, not actual.
The actual operating expenditure is 4.2% higher, with the basis for this additional expenditure comprising:
• Abnormal and unforeseen events:
– 2015-16 was a very hot and dry year that increased water demand which in turn increased operational pumping and water treatment costs.
– 2016-17 had water quality issues relating firstly to Blue Green Algae and then a prolonged Black Water event. Both events created additional water treatment costs.
• New obligations:
– From 1 July 2014, LMW’s responsibility for the maintenance of the sewer network changed to include from the main connection to 1 metre within the customer’s property boundary. It is believed many customers who had connection or maintenance issues and who had not rectified the issue previously did so when the responsibility became LMW’s. Additional costs estimated at $1.1 million were incurred over the WP3 period to meet this new obligation, which has been absorbed by LMW.
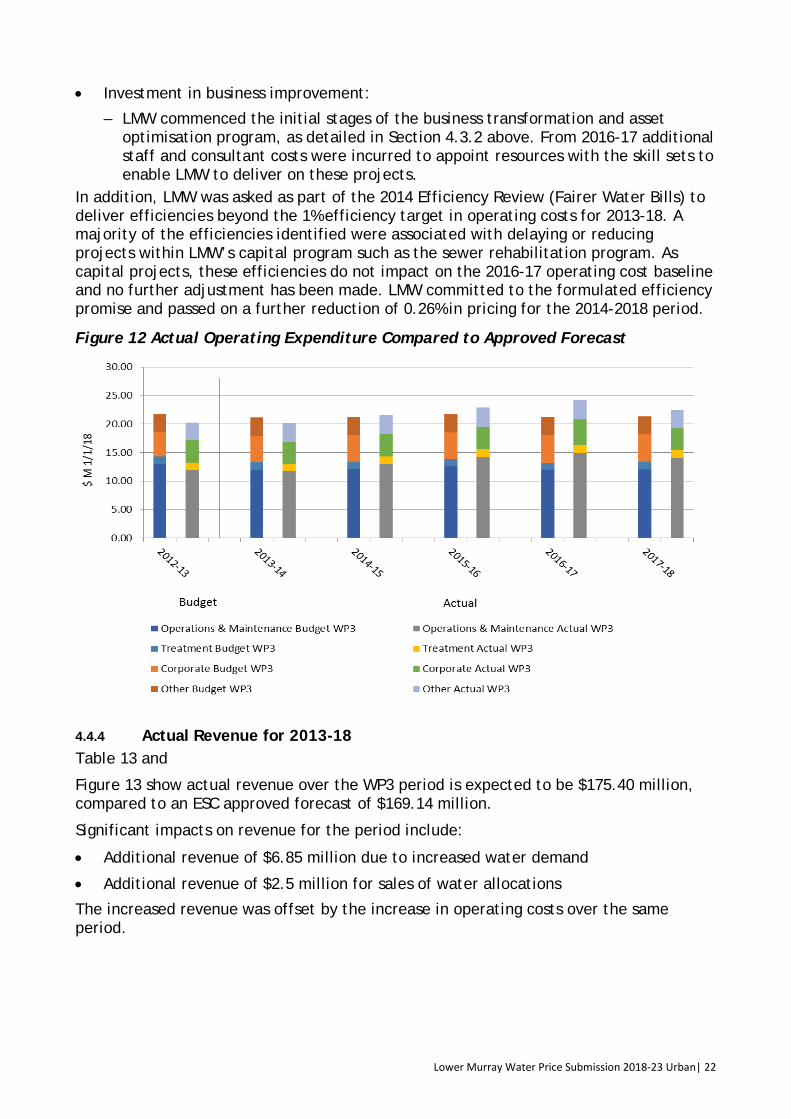
Lower Murray Water Price Submission 2018-23 Urban| 22
22
• Investment in business improvement:
– LMW commenced the initial stages of the business transformation and asset optimisation program, as detailed in Section 4.3.2 above. From 2016-17 additional staff and consultant costs were incurred to appoint resources with the skill sets to enable LMW to deliver on these projects.
In addition, LMW was asked as part of the 2014 Efficiency Review (Fairer Water Bills) to deliver efficiencies beyond the 1% efficiency target in operating costs for 2013-18. A majority of the efficiencies identified were associated with delaying or reducing projects within LMW’s capital program such as the sewer rehabilitation program. As capital projects, these efficiencies do not impact on the 2016-17 operating cost baseline and no further adjustment has been made. LMW committed to the formulated efficiency promise and passed on a further reduction of 0.26% in pricing for the 2014-2018 period.
Figure 12 Actual Operating Expenditure Compared to Approved Forecast
4.4.4 Actual Revenue for 2013-18 Table 13 and
Figure 13 show actual revenue over the WP3 period is expected to be $175.40 million, compared to an ESC approved forecast of $169.14 million.
Significant impacts on revenue for the period include:
• Additional revenue of $6.85 million due to increased water demand
• Additional revenue of $2.5 million for sales of water allocations
The increased revenue was offset by the increase in operating costs over the same period.

Lower Murray Water Price Submission 2018-23 Urban| 23
23
Table 13 Actual Revenue for 2013-18 ($M 1/1/18)
2nd Period
Third Regulatory Period
Revenue Component 2012-13 2013-14 2014-15 2015-16 2016-17 2017-18 Total
Residential water 15.09 14.77 15.63 16.41 14.74 15.78 77.33
Non residential water 4.87 4.58 4.95 5.17 4.84 4.83 24.37
Total water 19.96 19.35 20.58 21.57 19.58 20.61 101.70
Residential sewerage 11.68 12.02 12.23 12.38 12.54 12.73 61.92
Non residential sewerage 2.02 2.16 2.14 2.14 2.16 2.18 10.78
Trade Waste 0.19 0.20 0.20 0.20 0.20 0.20 1.00
Total Sewerage 13.89 14.38 14.57 14.72 14.91 15.12 73.70
Total Tariff Revenue 33.85 33.73 35.16 36.29 34.48 35.74 175.40
Approved Revenue 31.33 32.14 32.96 33.81 34.67 35.56 169.14
Figure 13 Actual Revenue Compared to Approved Forecast
4.4.5 Return of Revenue to Customers Over the three years from 2015-16 to 2017-18, LMW returned over $1.00 million to customers in volumetric prices reducing by 1.76% annually from those allowable under the price cap. This was due to higher demand and higher revenues received in the preceding two years. To maintain lower prices, LMW did not seek to recover higher operating costs than budgeted in the 2015-16 to 2017-18 period. This demonstrates LMW’s commitment to minimise prices to customers with LMW taking on the higher risk of additional operating expenditure.
Lower Murray Water Price Submission 2018-23 Urban| 24
24
5. Management
5.1 Management of the Price Submission In September 2016, LMW developed a comprehensive Project Plan9F
10 and program for preparation, review, verification and attestation of this Price Submission. Key parts of the delivery process included:
• Establishing governance arrangements10F
11 involving the Board, Finance and Audit Committee, a PS4 Governance Group comprising the Executive Team and Manager Planning and Regulation, a Project Delivery Team, and processes to support oversight and review, direction and decisions, and final attestation,
• Regular tracking of Price Submission progress and risks, and reporting to the Executive Team and Board11F
12,
• Accelerated and adaptive customer engagement program delivered through the entire Price Submission preparation,
• Planning and progressive delivery of papers on each key Price Submission input for critical review by the Finance and Audit Committee,
• Risk assessment to treat and mitigate risks associated with or arising in the course of preparation of the Price Submission12F
13
• Checklist review, verification and signoff of each element of the Price Submission13F
14 by the Executive Team and various senior staff as a precursor to Board attestation,
• Board resolution for attestation, and
• Automated financial model processes to ensure financial table and figure outputs are directly input into the Price Submission document.
10 PS4 Project Plan 28-09-2016 11 PS4 Planning Workshop Minutes 28 September 2016. 12 Example, Board Pricing Submission 20170223 v4. 13 Delivering PS4 Risk Assessment 14 Attestation Requirements Executive v2
Customer Value Proposition – Management
LMW’s Project Plan for management of this submission, supported by its business processes and utilisation of external consulting expertise demonstrates that the proposed prices reflect prudent and efficient expenditure.
LMW has absorbed cost pressures and has committed to strategies such as Business Transformation which combined with other initiatives will generate greater than 1% controllable cost savings. The Board and Executive have shaped this proposal and driven key decisions on risk, risk allocation, capital investment, expenditure and pricing.
The Submission is supported by documentation and evidence providing assurance of the quality of the submission.

Lower Murray Water Price Submission 2018-23 Urban| 25
25
Information on these procedures and relevant documents are available for inspection by the ESC.
5.1.1 Substantial Assumptions Substantial assumptions on which the Price Submission is based, are summarised in Table 14. These assumptions are all based on reasonable investigations and analysis, and provide the best estimate of costs and revenues for the price period.
Table 14 Key PS4 Assumptions
Element Key Assumption
Demand Water demand and new connections estimates are based on growth in household estimates from Victoria in Future 201614F
15, with equivalent connection demand based on the combination of continued gradual increase in temperatures, average rainfall, Permanent Water Saving Rules, no water restrictions, and no change to tariff structures. Details in Section 6.2.
Capital projects assume the same levels of growth in customers as the demand forecasts.
Electricity Electricity cost assumptions are detailed in Section 6.3.3, along with a price adjustment mechanism proposed in Section 7.3.3. A risk-based mechanism is proposed to manage electricity price volatility.
Labour Labour costs have been estimated based on an assumed 6 urban FTE reduction on current 17/18 staffing levels over the PS4 period. The labour cost reduction will start lower in the early years and grow as natural attrition occurs, with forecast savings over PS4 of $2.6M. Any new obligations arising during the PS4 period may influence staffing requirements.
Operating costs In general, all other operating costs are assumed to remain at the same real cost. Operating costs are based on normal operations and assume a low risk of possible abnormal operating costs arising from poor raw water quality, flood or storm events
Capital cost Capital costs for major projects have been estimated using ‘most likely outcome’ or P50 costs, with LMW bearing the risk of any overall program delivery cost overruns. Refer Section 6.4.1 for details of capital costs and LMW’s processes for capital planning and cost estimating.
Revenue – water allocation trade
LMW’s surplus water allocation is traded on the water market to maximise the benefit of unused water entitlement in any year. Assumed forecast in WP3 was $300,000 per year where LMW for the PS4 period has assumed $850,000 per year of traded allocation water. This non-prescribed revenue is used to offset tariff revenues.
15 Victoria In Future 2016, Department of Land, Environment, Water and Planning
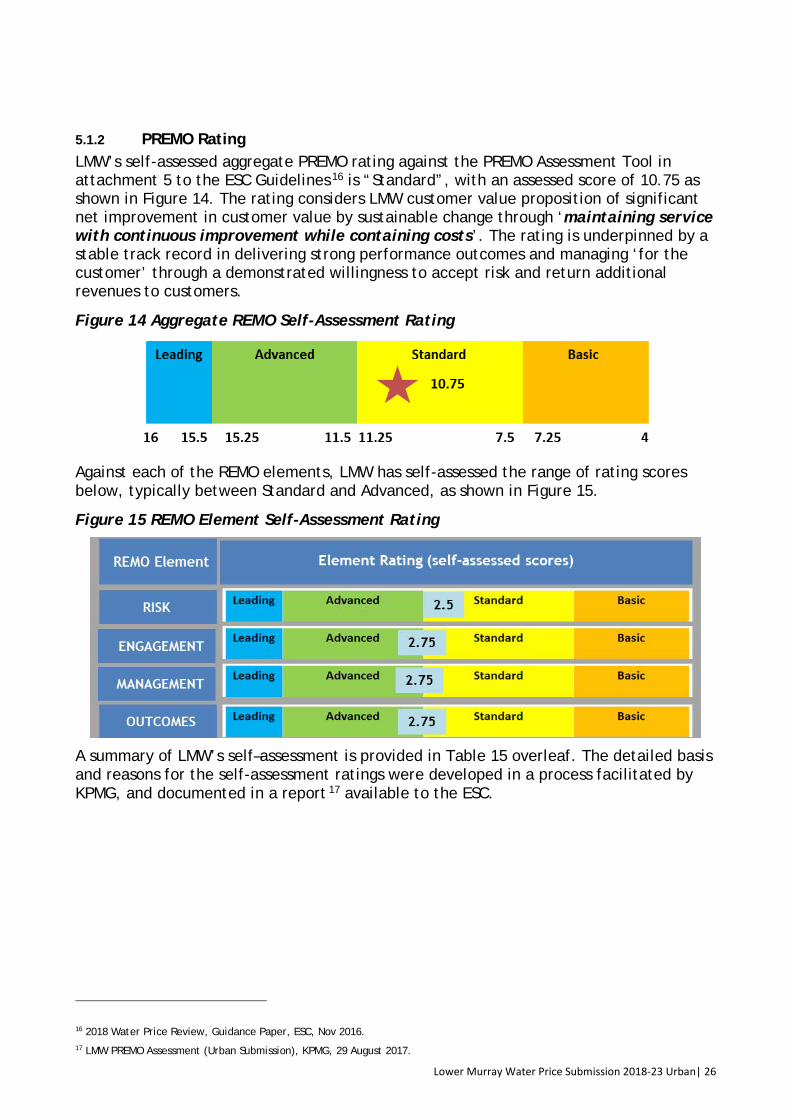
Lower Murray Water Price Submission 2018-23 Urban| 26
26
5.1.2 PREMO Rating LMW’s self-assessed aggregate PREMO rating against the PREMO Assessment Tool in attachment 5 to the ESC Guidelines15F
16 is “Standard”, with an assessed score of 10.75 as shown in Figure 14. The rating considers LMW customer value proposition of significant net improvement in customer value by sustainable change through ‘maintaining service with continuous improvement while containing costs’. The rating is underpinned by a stable track record in delivering strong performance outcomes and managing ‘for the customer’ through a demonstrated willingness to accept risk and return additional revenues to customers.
Figure 14 Aggregate REMO Self-Assessment Rating
Against each of the REMO elements, LMW has self-assessed the range of rating scores below, typically between Standard and Advanced, as shown in Figure 15.
Figure 15 REMO Element Self-Assessment Rating
A summary of LMW’s self–assessment is provided in Table 15 overleaf. The detailed basis and reasons for the self-assessment ratings were developed in a process facilitated by KPMG, and documented in a report16F
17 available to the ESC.
16 2018 Water Price Review, Guidance Paper, ESC, Nov 2016. 17 LMW PREMO Assessment (Urban Submission), KPMG, 29 August 2017.

Lower Murray Water Price Submission 2018-23 Urban| 27
27
Table 15 REMO Self-Assessment Summary
Guiding Question Summary Response Rating
Outcomes
Has the business provided evidence that the outcomes proposed have taken into account the views, concerns and priorities of customers?
Outcomes have been developed with customer focus groups and address the matters raised and developed during the engagement process
3.0 Low Advanced
Has the business provided sufficient explanation of how the outcomes it has proposed align to the forecast expenditure requested?
The outcomes proposed and the key projects and initiatives that support these outcomes are included in the Outcome documents
2.5
High Standard
Has the business proposed outputs to support each of its outcomes, which are measurable, robust and deliverable?
Each outcome has a list of outputs that have been developed with customers and the business
3.0
Low Advanced
Has the business provided evidence that the outputs it has proposed are reasonable measures of performance against stated outcomes?
LMW has proposed a mix of new and existing output measures which have been developed with customers and agreed across the business
2.5
High Standard
Has the business demonstrated a process to measure performance against each outcome and to inform customers?
LMW has committed to tracking and informing its customers on progress. LMW will continue to engage to determine if outcomes or outputs need to change throughout PS4
2.5
High Standard
Management
To what extent has the business demonstrated how its proposed prices reflect only prudent and efficient expenditure?
Robust demand forecast, Expenditure driven by customer requirements
Robust capital plan based on Master Plan process and proven capital delivery process
2.5
High Standard
To what extent has the business justified its commitment to cost efficiency or productivity improvements?
Delivering greater than 1% controllable cost efficiency savings
2.5
High Standard
To what extent have senior management, including the Board, demonstrated ownership and commitment to the proposals in its submission?
Attestation signed by Board, Finance and Audit committee reviewed detail of submission, Executive attestation process
3.0
Low Advanced
To what extent has the business justified or provided assurance about the quality of the submission, including the quality of supporting information on forecast costs or projects?
Engaged external expertise KPMG (PREMO), GHD (submission compiling and checklist and Capital works), ACIl Allen (financial modeling and templates)
Internal checklist and review
2.5
High Standard
To what extent has the business provided evidence that there is senior level, including Board level, ownership and commitment to its submission and its outcomes?
Executives have driven process and had clear transparency and input into proposals. Essentially the business plan for next five years
3.0
Low Advanced

Lower Murray Water Price Submission 2018-23 Urban| 28
28
Guiding Question Summary Response Rating
Engagement
To what extent has the business justified how the form of engagement suits the content of consultation, the circumstances facing the water business and its customers?
Broader, deeper, multiple platforms and interactions. Starting from a high degree of customer satisfaction allowed focus on key areas
3.0
Low Advanced
To what extent has the business demonstrated that it provided appropriate instruction and information to customers about the purpose, form and content of the customer engagement?
Broad community engagement through social media explaining PS4, Independent facilitator at focus groups to ensure bias free and open discussion on any customer issue
2.5
Standard
To what extent has the business demonstrated that the matters it has engaged on are those that have the most influence on the services provided to customers and prices charged?
Customer surveys highlighted broad issues, these were then refined with customer focus groups and ultimately developed as Outcomes again with customer focus groups
2.75
Low Advanced
To what extent has the business explained how it decided when to carry out its engagement?
Experience told us that it would take time to build engagement, multiple interactions would be required so the earlier the better
2.75
Low Advanced
To what extent has the business demonstrated how its engagement with customers has influenced its submission?
Customers have collaboratively determined the outcomes that will be delivered
2.75
Low Advanced
Risk
To what extent has the business demonstrated a robust process for identifying risk, and how it has decided who should bear these risks?
Business Risk framework has been utilised to identify and manage business risks and risk in delivering PS4. Risk allocation between LMW and Customer has been considered at every stage of PS4 development.
2.75
Low Advanced
To what extent does the proposed guaranteed service level (GSL) scheme provide incentives for the business to be accountable for the quality of services delivered, and provide incentives to deliver valued services efficiently?
Substantial increase in rebate and lowered threshold in key customer area of concern being sewer spills in houses.
2.25 Standard

Lower Murray Water Price Submission 2018-23 Urban| 29
29
5.2 Managing Risk
Significant risks that may have a material impact on customer services or prices are summarised in Table 16, along with LMW’s proposed risk mitigation strategies and residual customer risks. LMW has supporting documentation detailing the basis for the risk allocation17F
18, and the risk tools and strategies adopted by LMW for their management.
Table 16 Significant Risks and their Management
Risk Description LMW Risk Mitigation Strategies Customer Residual Risk
Water security – inability to meet demand
• Making prudent bulk water purchases. • Urban Water Strategy • Water Restrictions • Demand management measures. • Water Strategy and Master Plans.
• Some risk (reduced) of requiring water restrictions and reduced water availability.
• Additional cost of bulk water purchases, offset by allocation sales.
Demand • Urban Water Strategy • Demand Forecasting approach • Two-part tariff and three tier
volumetric charges structure providing control for residential customers.
• Board practice of returning revenues to customers where demand significantly exceeds forecast.
• Low actual demand risk in wet years will be managed through curtailing expenditure.
• Managing individual water demand to minimise water bill.
• Low risk of higher costs over the period in the event of higher than forecast demand, due to LMW practice of returning revenues to customers where demand significantly exceeds forecast.
Managing capital costs – planning/construction /project management
• Long term Service Strategies, Master Plans and relevant investigations
• Capital program development and approval process.
• Robust cost estimation and refinement as projects progress through planning, development and design.
• ‘Most likely outcome’ cost estimates developed for major projects (premature to develop P50 cost estimates due to incomplete scoping of projects at this early stage).
• Major project delivery risk
• Limited risk of cost implications from major project cost overrun that would be passed onto customers.
• Low risk of service failure due to inability of LMW to complete capital projects on time to meet demand or compliance requirement.
18 LMW Price Submission 2018-23, Risk Management - Urban
Customer Value Proposition – Risk
LMW has consciously accepted greater risks than ever before on behalf of its customers to minimise customer prices and improve services. Significant additional risk acceptance by LMW is proposed with respect to delivering improved performance outcomes, absorbing capital contingency outcomes, accepting a substantial portion of risks relating to electricity prices, and seeking substantially increased revenues from water sales by working its water entitlements harder.
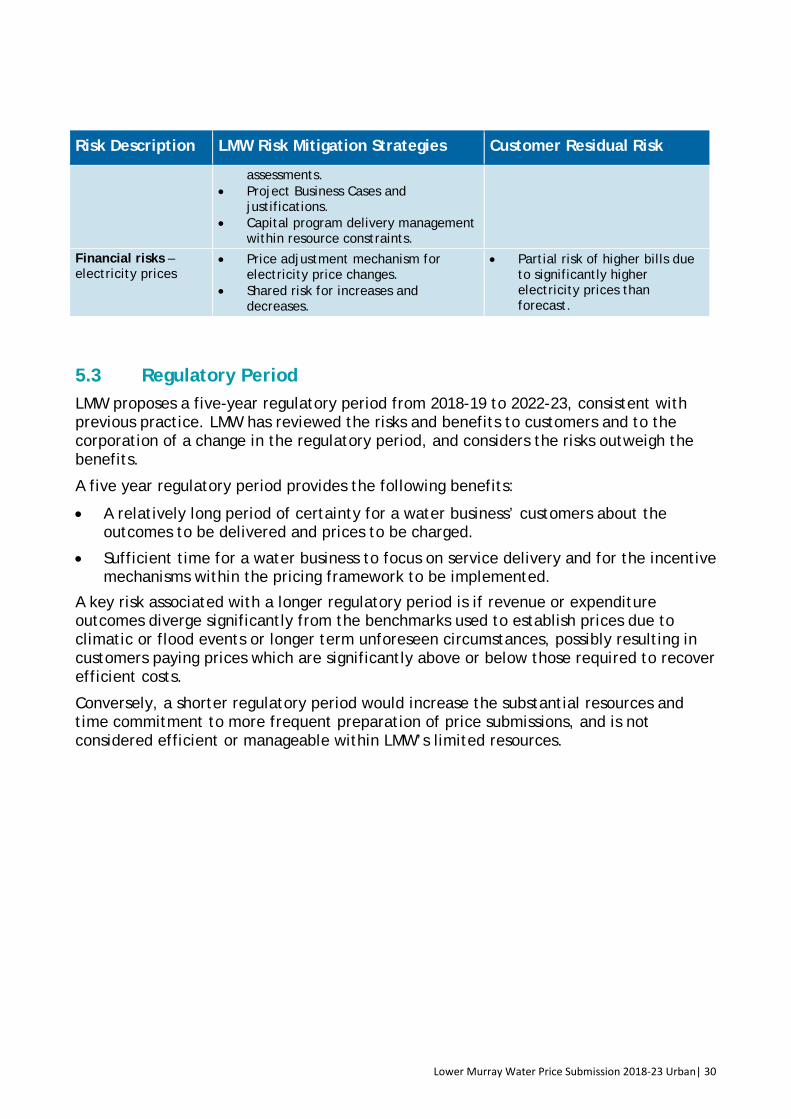
Lower Murray Water Price Submission 2018-23 Urban| 30
30
Risk Description LMW Risk Mitigation Strategies Customer Residual Risk
assessments. • Project Business Cases and
justifications. • Capital program delivery management
within resource constraints. Financial risks – electricity prices
• Price adjustment mechanism for electricity price changes.
• Shared risk for increases and decreases.
• Partial risk of higher bills due to significantly higher electricity prices than forecast.
5.3 Regulatory Period LMW proposes a five-year regulatory period from 2018-19 to 2022-23, consistent with previous practice. LMW has reviewed the risks and benefits to customers and to the corporation of a change in the regulatory period, and considers the risks outweigh the benefits.
A five year regulatory period provides the following benefits:
• A relatively long period of certainty for a water business’ customers about the outcomes to be delivered and prices to be charged.
• Sufficient time for a water business to focus on service delivery and for the incentive mechanisms within the pricing framework to be implemented.
A key risk associated with a longer regulatory period is if revenue or expenditure outcomes diverge significantly from the benchmarks used to establish prices due to climatic or flood events or longer term unforeseen circumstances, possibly resulting in customers paying prices which are significantly above or below those required to recover efficient costs.
Conversely, a shorter regulatory period would increase the substantial resources and time commitment to more frequent preparation of price submissions, and is not considered efficient or manageable within LMW’s limited resources.
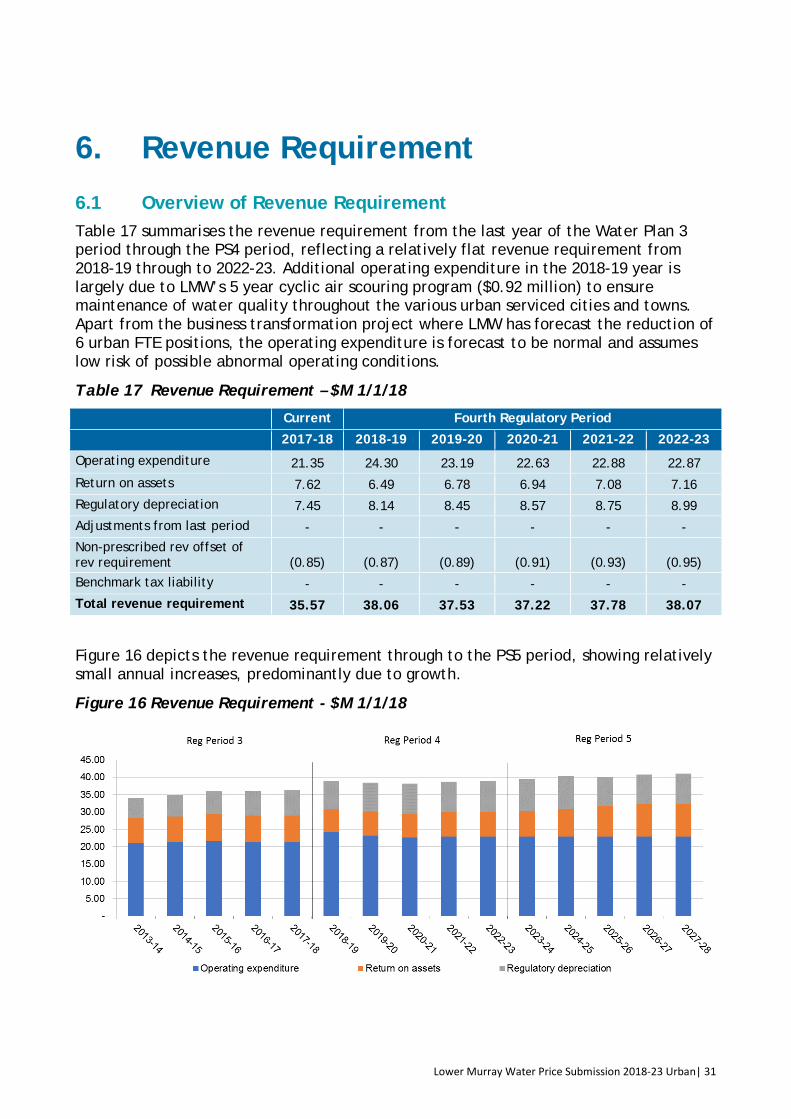
Lower Murray Water Price Submission 2018-23 Urban| 31
31
6. Revenue Requirement
6.1 Overview of Revenue Requirement Table 17 summarises the revenue requirement from the last year of the Water Plan 3 period through the PS4 period, reflecting a relatively flat revenue requirement from 2018-19 through to 2022-23. Additional operating expenditure in the 2018-19 year is largely due to LMW’s 5 year cyclic air scouring program ($0.92 million) to ensure maintenance of water quality throughout the various urban serviced cities and towns. Apart from the business transformation project where LMW has forecast the reduction of 6 urban FTE positions, the operating expenditure is forecast to be normal and assumes low risk of possible abnormal operating conditions.
Table 17 Revenue Requirement – $M 1/1/18
Current Fourth Regulatory Period
2017-18 2018-19 2019-20 2020-21 2021-22 2022-23
Operating expenditure 21.35 24.30 23.19 22.63 22.88 22.87 Return on assets 7.62 6.49 6.78 6.94 7.08 7.16 Regulatory depreciation 7.45 8.14 8.45 8.57 8.75 8.99 Adjustments from last period - - - - - - Non-prescribed rev offset of rev requirement (0.85) (0.87) (0.89) (0.91) (0.93) (0.95) Benchmark tax liability - - - - - - Total revenue requirement 35.57 38.06 37.53 37.22 37.78 38.07
Figure 16 depicts the revenue requirement through to the PS5 period, showing relatively small annual increases, predominantly due to growth.
Figure 16 Revenue Requirement - $M 1/1/18
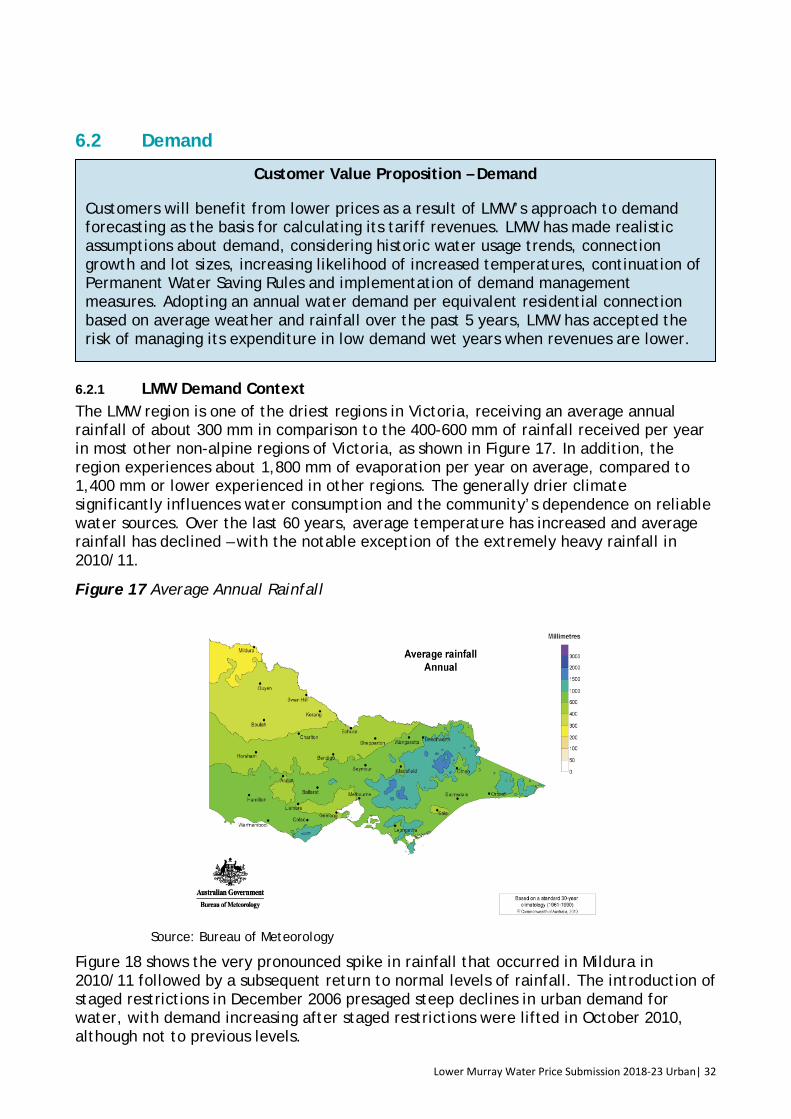
Lower Murray Water Price Submission 2018-23 Urban| 32
32
6.2 Demand
6.2.1 LMW Demand Context The LMW region is one of the driest regions in Victoria, receiving an average annual rainfall of about 300 mm in comparison to the 400-600 mm of rainfall received per year in most other non-alpine regions of Victoria, as shown in Figure 17. In addition, the region experiences about 1,800 mm of evaporation per year on average, compared to 1,400 mm or lower experienced in other regions. The generally drier climate significantly influences water consumption and the community’s dependence on reliable water sources. Over the last 60 years, average temperature has increased and average rainfall has declined – with the notable exception of the extremely heavy rainfall in 2010/11.
Figure 17 Average Annual Rainfall
Source: Bureau of Meteorology
Figure 18 shows the very pronounced spike in rainfall that occurred in Mildura in 2010/11 followed by a subsequent return to normal levels of rainfall. The introduction of staged restrictions in December 2006 presaged steep declines in urban demand for water, with demand increasing after staged restrictions were lifted in October 2010, although not to previous levels.
Customer Value Proposition – Demand
Customers will benefit from lower prices as a result of LMW’s approach to demand forecasting as the basis for calculating its tariff revenues. LMW has made realistic assumptions about demand, considering historic water usage trends, connection growth and lot sizes, increasing likelihood of increased temperatures, continuation of Permanent Water Saving Rules and implementation of demand management measures. Adopting an annual water demand per equivalent residential connection based on average weather and rainfall over the past 5 years, LMW has accepted the risk of managing its expenditure in low demand wet years when revenues are lower.
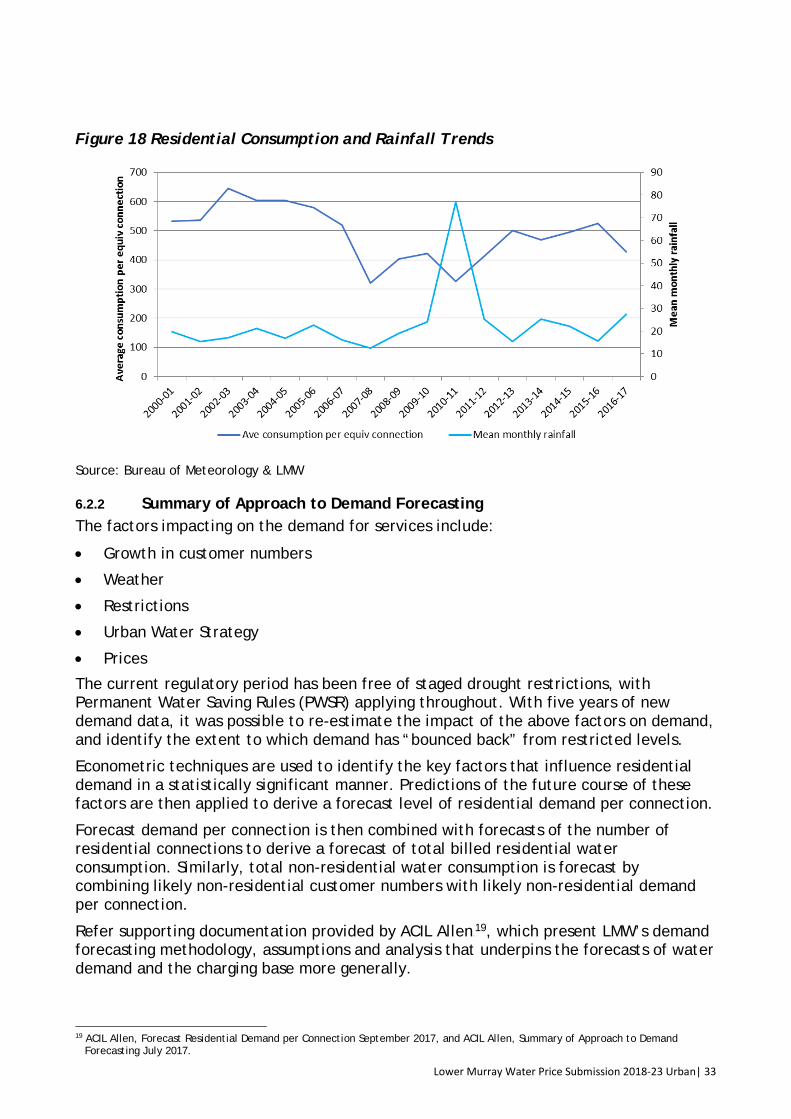
Lower Murray Water Price Submission 2018-23 Urban| 33
33
Figure 18 Residential Consumption and Rainfall Trends
Source: Bureau of Meteorology & LMW
6.2.2 Summary of Approach to Demand Forecasting The factors impacting on the demand for services include:
• Growth in customer numbers
• Weather
• Restrictions
• Urban Water Strategy
• Prices
The current regulatory period has been free of staged drought restrictions, with Permanent Water Saving Rules (PWSR) applying throughout. With five years of new demand data, it was possible to re-estimate the impact of the above factors on demand, and identify the extent to which demand has “bounced back” from restricted levels.
Econometric techniques are used to identify the key factors that influence residential demand in a statistically significant manner. Predictions of the future course of these factors are then applied to derive a forecast level of residential demand per connection.
Forecast demand per connection is then combined with forecasts of the number of residential connections to derive a forecast of total billed residential water consumption. Similarly, total non-residential water consumption is forecast by combining likely non-residential customer numbers with likely non-residential demand per connection.
Refer supporting documentation provided by ACIL Allen18F
19, which present LMW’s demand forecasting methodology, assumptions and analysis that underpins the forecasts of water demand and the charging base more generally.
19 ACIL Allen, Forecast Residential Demand per Connection September 2017, and ACIL Allen, Summary of Approach to Demand
Forecasting July 2017.

Lower Murray Water Price Submission 2018-23 Urban| 34
34
6.2.3 Demand Influences and Assumptions The key demand forecasting issues and assumptions and their justification are summarised below:
Growth Rates and Connections: LMW uses a graduated service charge, which varies according to the diameter of the connecting water supply pipe. To allow for this graduated charge, LMW assesses the number of connections in terms of 20 mm equivalent connections. Equivalent connections count larger connections as a multiple of the standard 20 mm connection, with the multiple reflecting the pricing structure.
Information on numbers of equivalent connections for residential and non-residential customers is sourced from LMW’s billing system.
LMW has sourced future growth in numbers of households from Victoria in Future 201619F
20. This report includes changes in population, households, and household sizes. For the period from June 2016 to June 2021 the forecast growth for occupied private dwellings is 1.1% for the Mildura LGA region, with growth of 1.0% forecast for the following ten years. Growth in equivalent connections is assumed to reflect the growth forecast for occupied private dwellings.
Growth in the number of non-residential customers is assumed to mirror the growth of residential customers and to maintain the existing relationship between actual and equivalent connections.
Influence of Weather and Water Restrictions on Demand: A regression analysis was used to relate demand per equivalent connection to weather conditions and the level of water restrictions, based on consumption data for the period from 2000-01 to 2015-16 inclusive.
The analysis involved regressing average consumption per equivalent connection against average maximum temperature and average monthly rainfall per quarter. The analysis accounted for the varying water restrictions that were in place previously, and ongoing PWSR, by including five different stages of restrictions.
As expected, higher temperatures result in increased demand for water, and higher rainfall results in a reduction in demand. Each degree increase in average maximum temperature results in an increase of 7.2 kL/per quarter in demand per equivalent connection. Each additional mm in monthly rainfall results in a decrease of 0.42 kL/per quarter.
Similarly, there is a steady decrease in demand as restrictions become tighter. There have been no stage restrictions in place since October 2010. Instead, the PWSR reflect a level of water restrictions which are less restrictive than Stage 1. The impact of permanent water savings is significant and the analysis suggests that quarterly water demand is on average 29.3 kilolitres less than the period prior to the introduction of water restrictions. This result suggests that demand has “bounced back” to around 75% of its pre-restriction level; however the actual level of bounce back depends on the weather assumptions that are made when calculating the forecasts. Less than full bounce back is to be expected given that LMW continues to support water conservation measures, and some households have bought water efficient appliances and made lng term changes to the water sensitivity of their gardens.
20 Victoria in Future 2016, Department of Environment, Land, Water and Planning

Lower Murray Water Price Submission 2018-23 Urban| 35
35
Price Elasticity: LMW proposes the same approach it adopted for the previous price review, effectively an adjustment for price responsiveness based on the results of published empirical studies of the demand for water for residential use. This approach assumes that the forecast consumption derived from the regression analysis provides an estimate of ‘base demand’ prior to taking account of any price changes. Taking into account LMW’s tiered volumetric charges, extent of outdoor use, lack of volumetric charges for sewerage and lower price elasticities for households which have implemented water savings measures; a range of price elasticity assumptions were made, as set out in Table 18.
Table 18 Price Elasticity Assumptions
Volumetric tier Assumed price elasticity
First tier volumes -0.05
Second tier volumes -0.10
Third tier volumes -0.15
Source: ACIL Allen Consulting
LMW has not assumed any impact on non-residential demand due to price elasticity. Published studies on the price sensitivity of non-residential demand are difficult to implement, since they are specific to the nature of the industrial and commercial activity being undertaken, the price of water in alternative locations and the ability of the relevant industries to reduce their water usage. Moreover experience with large consumption non-residential customers has not indicated any significant changes in urban demand – eg through decisions to relocate.
Demand Management Activities: LMW has applied a range of water savings programs, some sponsored by the Victorian Government along with the PWSRs, while others are part of LMW’s own water saving program. The programs included a number of rebate schemes for efficient water using appliances such as dual flush toilets, rainwater tanks and WELS rated showerheads, a rebate program for small businesses, and exchanges and give-aways of water saving devices such as garden hose trigger nozzles.
The programs contributed to reductions in water demand per household since its peak in the early 1990’s. It is however difficult to include water savings programs in the regression analysis, given the wide variety of programs under offer and the fact that many of them were of limited duration. Further, intensive education and water saving programs coincided with the imposition of restrictions and higher water prices, making it impossible to distinguish these effects econometrically.
LMW will continue to maintain a focus on water conservation and awareness by supporting a range of efficiency measures across its supply systems. These measures include maintaining its water conservation education and awareness campaign, implementation of an efficient garden program, and programs for commercial, industrial customers and local councils.
While it has not been possible to estimate the likely magnitude of the resultant water savings, it is reasonable to assume that their effect is incorporated into the savings attributed to the PWSRs.

Lower Murray Water Price Submission 2018-23 Urban| 36
36
6.2.4 Water & Sewerage Demand Forecasts Connection Forecast
Table 19 shows forecast water and sewerage connections. A base for 2016-17 was established using “equivalent connections,” for both residential and non-residential connections, with growth as detailed in Section 6.2.3.
Whilst historically the aggregate number of residential sewerage connections has been lower than water, the forecasts assume that the growth in water and sewerage connections will be the same in terms of absolute numbers of equivalent connections. For non-residential sewerage connections, growth has been based on an average increase in connections over the past five years.
Table 19 Connection Forecasts
Current Fourth regulatory period
Service 2017-18 2018-19 2019-20 2020-21 2021-22 2022-23
Water
Residential equivalent connections water 30,366 30,700 31,038 31,380 31,693 32,010
Non-residential equivalent connections 6,983 7,060 7,137 7,216 7,288 7,361
Total water 37,349 37,760 38,176 38,596 38,981 39,371
Sewerage
Residential equiv connections sewerage 26,546 26,880 27,218 27,560 27,873 28,190
Non-residential equiv connections sewerage 4,553 4,588 4,623 4,658 4,693 4,728
Total sewerage 31,099 31,468 31,841 32,218 32,566 32,918
Water Volumetric Demand
In order to forecast the average water demand per equivalent connection for LMW, it is necessary to make an assumption about the average daily maximum temperature and average monthly rainfall that will apply over the forecast period. The historical behaviour of the weather forms the basis for making these projections.
Table 20 shows the forecast annual water demand per equivalent connection using a range of historically averaged time periods.
Table 20 Forecast Annual Demand per Equivalent Connection
Average weather (length of period)
Average annual demand per equivalent connection (kL)
5 years 477.1
20 years 455.4
30 years 445.0
70 years 431.7
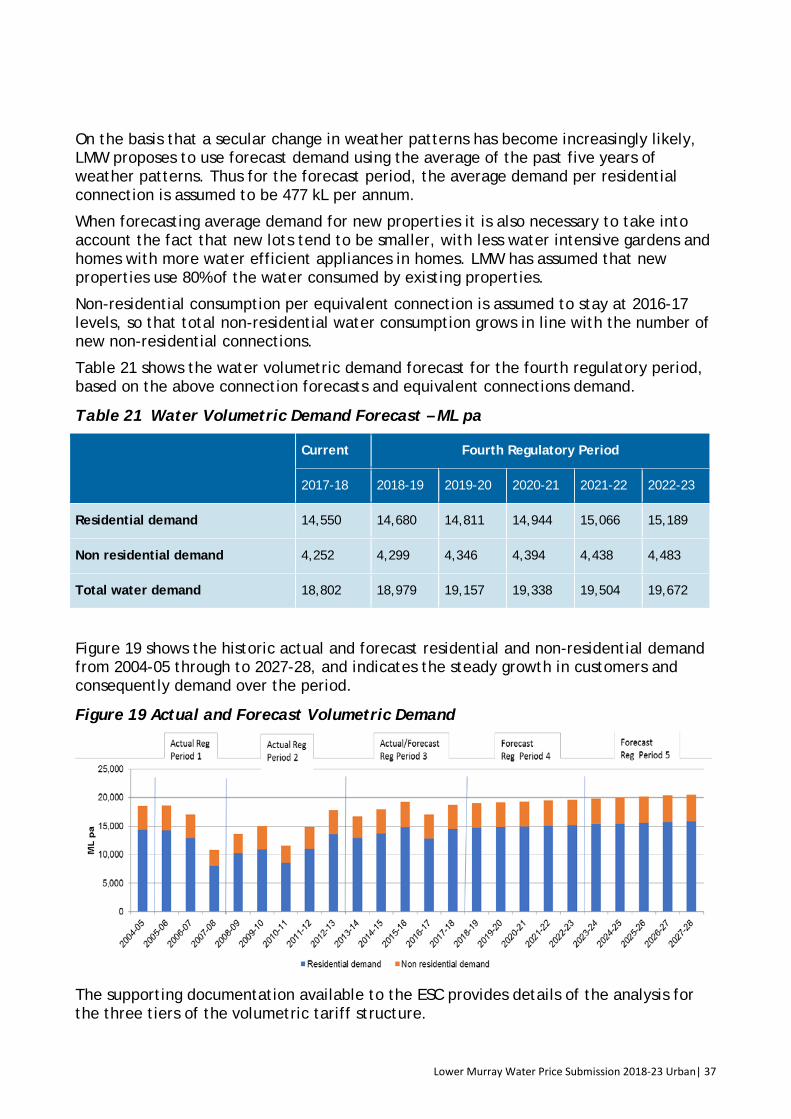
Lower Murray Water Price Submission 2018-23 Urban| 37
37
On the basis that a secular change in weather patterns has become increasingly likely, LMW proposes to use forecast demand using the average of the past five years of weather patterns. Thus for the forecast period, the average demand per residential connection is assumed to be 477 kL per annum.
When forecasting average demand for new properties it is also necessary to take into account the fact that new lots tend to be smaller, with less water intensive gardens and homes with more water efficient appliances in homes. LMW has assumed that new properties use 80% of the water consumed by existing properties.
Non-residential consumption per equivalent connection is assumed to stay at 2016-17 levels, so that total non-residential water consumption grows in line with the number of new non-residential connections.
Table 21 shows the water volumetric demand forecast for the fourth regulatory period, based on the above connection forecasts and equivalent connections demand.
Table 21 Water Volumetric Demand Forecast – ML pa
Current Fourth Regulatory Period
2017-18 2018-19 2019-20 2020-21 2021-22 2022-23
Residential demand 14,550 14,680 14,811 14,944 15,066 15,189
Non residential demand 4,252 4,299 4,346 4,394 4,438 4,483
Total water demand 18,802 18,979 19,157 19,338 19,504 19,672
Figure 19 shows the historic actual and forecast residential and non-residential demand from 2004-05 through to 2027-28, and indicates the steady growth in customers and consequently demand over the period.
Figure 19 Actual and Forecast Volumetric Demand
The supporting documentation available to the ESC provides details of the analysis for the three tiers of the volumetric tariff structure.

Lower Murray Water Price Submission 2018-23 Urban| 38
38
Wastewater Flows
Wastewater flows are not relevant for pricing, as there is no volumetric tariff for wastewater, but they influence operating costs, which have been prepared taking into account:
• Population growth in all districts, provided by Victoria in Future 2016 for historic and future growth.
• Historic and expected growth in number of wastewater connections.
• Historic wastewater flow patterns and influences. Water demand management measures in the LMW region mainly impact on garden watering and consequently have less effect on wastewater flows.
Table 22 shows a summary of estimated wastewater flows based on the above factors.
Table 22 Wastewater Flows
Wastewater Flows 2018-19 2019-20 2020-21 2021-22 2022-23
Residential equiv connections sewerage 26,880 27,218 27,560 27,873 28,190
Non residential equiv connections sewerage 4,588 4,623 4,658 4,693 4,728
Total sewerage equivalent connections 31,468 31,841 32,218 32,566 32,918
Total Wastewater Flows (ML per annum) 6,194 6,262 6,331 6,401 6,471
Recycled Water: Koorlong is the main WWTP where recycled water is supplied externally under commercial contracts. Some 2,400 ML is available from this source, with use subject to contractual needs and quality of supplied water for its purpose. The demand estimate for recycled water averages 2,000 ML per annum.
For the WWTPs at Mildura, Robinvale, and Koondrook, onsite reuse on tree lots and/or pasture is practiced. Evaporation is the major method of disposal of wastewater at Merbein, Swan Hill, Nyah/Nyah West, Lake Boga and Kerang.
Developed Lots: The historic developer lots and forecast for the next regulatory period are shown in Table 23.
Table 23 Forecast Number of Development Lots
Lot Type
Historic Actual / Forecast for Current Period Projected for Fourth Regulatory Period
2013-14
2014-15
2015-16
2016-17
2017-18
2018-19
2019-20
2020-21
2021-22
2022-23
Water – residential
302 357 254 261 330 334 338 341 314 317
Sewerage –residential
293 338 247 269 330 334 338 341 314 317
Water –non residential
6 7 15 10 44 44 45 45 42 42
Sewerage – non residential
9 15 17 20 20 20 20 20 20 20

Lower Murray Water Price Submission 2018-23 Urban| 39
39
6.3 Forecast Operating Expenditure
6.3.1 Actual and Planned Operating Expenditure Table 24 sets out LMW’s proposed prudent and efficient operating expenditure for each year of the fourth regulatory period, across each major service category. The total forecast operating expenditure for the period is $116.87 million in real dollars ($M 1/1/18).
Table 24 Actual and Planned Operating Expenditure ($M 1/1/18)
Current Period Fourth Regulatory Period
$M, 1/1/18 2016-17 2017-18 2018-19 2019-20 2020-21 2021-22 2022-23
Controllable Opex
Water 13.82 12.22 13.43 12.44 12.23 12.36 12.42
Sewerage 8.31 8.21 8.35 8.22 7.86 7.98 7.91
Total controllable opex 22.13 20.43 21.78 20.66 20.09 20.34 20.33
Non controllable opex
External bulk water charges and water allocation purchases
0.73 0.72 0.68 0.69 0.69 0.70 0.71
Licence fees 0.08 0.08 0.08 0.08 0.08 0.08 0.08
Environment Contribution
1.23 1.21 1.77 1.77 1.77 1.77 1.77
Total non controllable opex
2.04 2.01 2.52 2.53 2.54 2.54 2.55
Total Prescribed Opex 24.17 22.43 24.30 23.19 22.63 22.88 22.87
Table 24 above separates out the costs that are not controllable by LMW. Controllable operating expenditures are expected to remain reasonably steady over the fourth regulatory period, with the exception of 2018-19 which includes LMW’s 5-year cyclic air scouring program.
Labour costs are forecast to increase by 0.7% real annually with the negotiation of an Enterprise Bargaining Agreement (EBA) at the conclusion of the existing EBA on 30 June 2018. To offset these labour increases, through the business transformation, efficiency measures will be implemented which include reductions of some 6 urban staff through natural attrition.
Chemical costs have been forecast at normal levels for the PS4 period. The blackwater event of 2016-17 saw chemical and other associated costs total an additional $1.12 million. To minimise chemical costs and the effect of customer growth, LMW has
Customer Value Proposition – Operating Cost
LMW actively commits to implementing efficiencies and absorbing additional regulatory costs to achieve a real net reduction in controllable operating expenditure over the PS4 period. This commitment is reinforced by maintaining or improving service performance through the adoption of business transformation and cultural change programs designed to put the customer at the centre of everything LMW does.

Lower Murray Water Price Submission 2018-23 Urban| 40
40
entered into a purchasing partnership contract and will implement the asset optimisation project.
LMW will install UV treatment at all water treatment plants as a secondary barrier to ensure safe drinking water. The UV treatment process and additional maintenance of the UV system has been included in the years following construction and commissioning.
Some 10% of controllable operating costs are power costs. LMW currently has a favourable power contract which expires on 30 June 2018. The power market is currently volatile with a large degree of uncertainly around price and security of supply going forward. Refer to Section 6.3.3 for discussion on electricity costs.
Accompanying this document is the financial model templates which provides the ESC with the detailed categorised operating costs.
Figure 20 shows the increase in proposed operating expenditure and shows the trend forecast through the next regulatory period.
Figure 20 Forecast Operating Expenditure - $M 1/1/18
This trend shows stable operating expenditure through the fifth regulatory period, and highlights the 2016-17 black water event and the 2018-19 major air scouring program.
6.3.2 Baseline Controllable Operating Expenditure During the baseline 2016-17 year, LMW experienced abnormal operating conditions due to poor raw water quality, firstly a blue green algae (BGA) outbreak followed by a prolonged blackwater event, causing additional operating costs for water treatment of some $1.12 million.
• The BGA outbreak was extensive and stretched large distances up and down the Murray River.
• The blackwater event was as a result of September flooding of the Murray River and its tributaries, and subsequent draining of flooded areas, which prolonged the event and lasted approximately 12 weeks. LMW’s water treatment plants are not specifically designed to treat blackwater so considerable effort and resources were required to ensure safe quality drinking water was produced for LMW’s customers.

Lower Murray Water Price Submission 2018-23 Urban| 41
41
In addition, the planning and preparation of the Price Submission incurred additional costs in 2016-17 of $0.42 million for customer engagement, contractors and consultants to accommodate the PREMO framework requirements.
No adjustment has been made to the baseline for business-as-usual (BAU) costs not incurred in the 2016-17 baseline year.
The net impact of the above adjustments to ‘normalise’ the 2016-17 operating cost to a baseline for efficient and prudent operation, is a reduction of $1.54 million of controllable operating expenditure.
LMW undertook an organisational restructure throughout 2016-17 which aligned LMW’s labour resources with its corporate goals and objectives. Within the restructure 3 new executive manager positions were created, Chief Information Officer, Executive Manager Customer & Stakeholder, and Executive Manager People & Culture. No adjustment has been made to the baseline due to these BAU labour costs. The restructure with the additional executive managers complementing the business transformation project will enable LMW to realise labour force efficiencies through the PS4 period.
The baseline 2016-17 year has been indexed for growth using the Victoria in Future 2016 of 1.1% for the period June 2016 – June 2021 and 1% thereafter.
Table 25 shows the calculation of the 2016-17 baseline operating expenditure in accordance with the ESC’s guidance, and the projected change in operating expenditure over the PS4 period, allowing for growth and the 1% per annum efficiency improvement along with proposed variations to the baseline.
Table 25 Baseline Controllable Operating Expenditure 2016-17.
Component Current Period Fourth Regulatory Period
2016-17 2017-18 2018-19 2019-20 2020-21 2021-22 2022-23
Prescribed Opex in 2016/17 24.17
Less non controllable opex -2.04
Add one-off adjustments -1.54
Baseline controllable operating expenditure
20.59 20.61 20.63 20.65 20.67 20.67 20.67
Variations to Baseline
Admin and IT 0.14 0.15 -0.10 0.07 -0.12 Tech services and infrastructure (exc. power)
0.18 -0.83 -1.20 -1.16 -1.07
Power Costs (See note) 0.40 0.25 0.29 0.30 0.37
Balancing variations 0.43 0.43 0.43 0.45 0.47 Total Controllable Operating Costs
21.78 20.66 20.09 20.34 20.33
Note: Expected power cost price increases from LMW's 16/17 contracted prices.
6.3.3 Electricity Costs The operating environment for the energy sector across Australia is highly uncertain and consequently volatile, and there is significant uncertainty as to electricity price outcomes for LMW in common with all Victorian regulated water businesses.
Lower Murray Water Price Submission 2018-23 Urban| 42
42
LMW currently has an agreed contract for electricity which expires on 30 June 2018, and is exploring options for electricity procurement post 30 June 2018.
In preparing the PS4 draft submission LMW assembled six electricity price forecasts based on a variety of scenarios and which were produced at different points of time, revealing marked variations in prices over the next six years.
A further electricity price forecast20F
21 by Ernst and Young was developed based upon LMW’s actual energy demand profile, water demand forecast and latest market intelligence, which is lower than the previous forecasts, and has been adopted for the purposes of this Price Submission. However, given the high uncertainties and risks associated with electricity pricing, alternative mechanisms for managing electricity price volatility were developed by LMW, following consultation with the ESC on its view and in seeking the most stable outcome for customers. The proposed mechanisms are:
• LMW be provided with an opportunity to adjust the draft price submission in March 2018 based upon the latest market intelligence at that time, and
• LMW operates with a ‘collar’ providing a price adjustment mechanism to 2023, whereby deviations from the electricity price forecast in this Price Submission, outside of an upper and lower bound (or ‘collar’), would be passed through to customers.
Details of the proposed price adjustment mechanism are provided in Section 7.3.3. The proposed set-point of the collar requires LMW to take significant risk and creates an incentive for management of electricity costs.
6.3.4 Additional Costs for PS4 LMW will incur new costs in the PS4 period and into the future. These additional costs are not substantial and are mainly in response to the Minister for Water’s 2016 Standing Directions or other compliance requirements.
LMW has include costs into the PS4 submission for:
• UV treatment – progressively implemented over the S4 period, adds further to energy and maintenance costs totalling $0.41 million
• Victorian Protective Data Security Standards (VPDSS) – establish 18 high level mandatory requirements to protect public sector data and provide for governance across the four domains of information, personnel, ICT and physical security. Each standard is supported by four protocols, this follows the continuous improvement process of plan, do, check, and act. This enables LMW to continually assess our security controls against any new or updated threats and vulnerabilities. The aim is to ensure that LMW’s and its customers’ information is secure and also that LMW’s business systems and operating infrastructure are safe - $0.45 million
• Asset optimisation and AMAF attestation – The Asset Management Accountability Framework (AMAF) was issued in February 2016 under the Financial Management Act, Section 8 - Standing Direction 3.4.9 – ‘Managing Assets’ and closely aligns with the International Standard ISO55000 series for Asset Management. The framework is intended to ensure that Victorian public sector agencies manage their asset portfolios appropriately so that they contribute effectively and efficiently to delivering services to the community. Public Attestation of compliance will be required for the 2017-18 year in the LMW Annual Report. - $0.29 million
21 Ernst Young, LMW Electricity Price Forecast, August 2017.

Lower Murray Water Price Submission 2018-23 Urban| 43
43
• Diversity and Aboriginal cultural connection - LMW will generate opportunities for diverse people to join our business. To this aim, LMW is improving its recruitment processes, developing an aboriginal traineeship program and ensuring that promotional materials reflect the diversity of the organisation and the local community. - $0.26 million
• LMW’s environmental levy contribution, an uncontrollable cost, has been increased from $1.20 million to $1.765 million per annum – totalling an estimated $2.80 million over the PS4 period
• Power engineer – LMW is responding to its greenhouse gas emission pledge and acting on its customer feedback to support and approve of LMW being mindful of the environment whilst operating and doing business - $0.40 million.
6.3.5 Productivity Improvements for the Forthcoming Period In general terms, LMW’s proposed services represent an incremental improvement on current service levels. Customers have advised they are highly satisfied with LMW service level and that they wish to keep costs to a minimum. Customers have confirmed that they want consistent, safe, clean drink water and reliable sewerage services.
In order to find productivity improvements, LMW has not proposed any cost savings that would reduce LMW’s level of service to its customers.
LMW has, however, sought productivity improvements through an organisation restructure and the business transformation project.
LMW recognises that it can streamline business processes with the use of technology and enable the information and procedural tasks to flow more efficiently throughout its workforce. For the PS4 period, LMW has forecast that a reduction of 6 urban FTE employees will generate a saving of $2.6 million which will more than offset the wage increases forecast of 0.7% real annually with a new Enterprise Bargaining Agreement to be negotiated during 2017-18.
As examples of the business transformation benefits:
• LMW has invested in the development of a new corporate website which will be launched during 2018. The new website will enable customers to interact with LMW without the need to contact staff members. The website will enable customers to view their water bills, change personal information, inform LMW of tenant movements, request meter readings and have links with Centrelink for rebate card validation. The automated workflows will also enable plumbers to pay for and receive LMW network map information and be integrated with the LMW GIS system.
• Another valuable benefit to customers and LMW alike will be that the website will link to LMW’s new Customer Relation Management (CRM) software which captures all dealings that occur between LMW and the customer. This will save valuable time when a staff member is interacting with customers.
LMW continues to ensure efficient procurement of goods as a member of the Victorian Water Industry Association (VicWater) to leverage chemical purchasing savings. LMW endeavours to bundle works in order to maximise pricing benefits such as the contracting of the air scouring program. The contractor is not local and due to the scale of the works, LMW benefits from lower rates due to the economies of scale.

Lower Murray Water Price Submission 2018-23 Urban| 44
44
6.3.6 Allocation of Shared Costs LMW has a Corporate Allocation Framework21F
22 that defines the allocation methodology used to reallocate ‘indirect’ revenue or expenditure to a business function, district or activity. Allocations are generated to reflect inclusive revenue or expenditure and to enable monitoring of the financial performance of individual business functions or districts inclusive of indirect corporate transactions.
This framework is configured within LMW’s financial system to remove the need for manual allocation of indirect revenue or expenditure to functions and districts for financial reporting purposes.
The bases used for allocation of the majority of shared costs between the urban and rural businesses of LMW, and between water and sewerage within the urban business, are:
• Corporate: Comprising corporate and administration, and depreciation of corporate assets: allocated on operational asset expense ledger labour and contractor expenditure.
• Billing and IT: comprising billing and customer services, IT and depreciation of IT assets: allocated on number of customer services.
Allocations are adjusted annually to reflect the changing nature of the customer base, assets or costs, as appropriate.
For the PS4 period, the allocations of shared costs for the business is:
Corporate Billing and IT
Urban 52.5% 90%
Rural 47.5% 10%.
6.4 Forecast Capital Expenditure
6.4.1 Basis for Development of the Capital Program LMW has developed, documented22F
23 and followed a consistent approach to capital forecasting and cost estimating for the Price Submission, covering capital planning processes, alignment of capital planning with business requirements, business case
22 LMW Corporate Allocation Framework, April 2014 23 LMW Price Submission 2018-23 Capital Forecasting Approach
Customer Value Proposition – Capital Expenditure
LMW has followed a carefully planned process to build a prudent and efficient capital expenditure program to meet the agreed customer outcomes and associated performance targets, current and new government obligations and commitments, and/or to manage risk to the business. Estimated costs have excluded general contingency allowances, placing the onus on LMW to deliver its program commitments within budget and on time. Uncertain projects have been excluded, with LMW accepting the initial financial risks if new projects arise or later projects are brought forward to maintain service performance during the PS4 period.
Lower Murray Water Price Submission 2018-23 Urban| 45
45
preparation, cost estimating and contingencies, capital efficiency, and allocation of risk between LMW and its service providers.
The capital expenditure for this Price Submission has been prepared with specific attention to:
• Major strategies developed for water and sewerage services to meet growth in the Northern and Southern regions of LMW,
• Master Plans for the major growth areas of Mildura/Red Cliffs and Swan Hill,
• Specific investigations for business-wide improvements such as UV treatment to meet health-based targets in the Australian Drinking Water Guidelines,
• Renewals forecast for water mains based on network performance to meet customer outcomes, taking into account the ageing of the water networks, failure history and giving attention to critical water mains,
• A site-based inspection regime for all key facilities, to identify any projects arising for reasons of non-compliance with safety or other standards, or condition of assets, and
• Specialist facility condition inspections, such as the storage tank inspection program.
Each project was justified as prudent and efficient to meet the agreed customer outcomes and associated performance targets, current and new government obligations and commitments, and/or to manage risk to the business. Options have been considered and evaluated wherever relevant.
Cost estimating has been based on P50 (50% probability) of cost outcomes as far as possible for the level of project development and scope that is appropriate at the current time. This recognises that many projects need to undergo further planning, investigation, design and market testing prior to their implementation, and that there are a range of risks to be considered and managed, including risks associated with planning, site conditions, integration with existing facilities, and the application of new technologies.
The program has been prioritised by operational and engineering management, followed by review and approval by the Executive team and the Board. Supporting documentation is available to the ESC for inspection on all projects.
6.4.2 Forecast Capital Expenditure Table 26 overleaf sets out LMW’s proposed prudent and efficient capital expenditure for each year of the fourth regulatory period, across each major service category. The total proposed capital expenditure for the period is $72.44 million in real dollars ($1/1/18). The detailed capital program is provided in Appendix B.
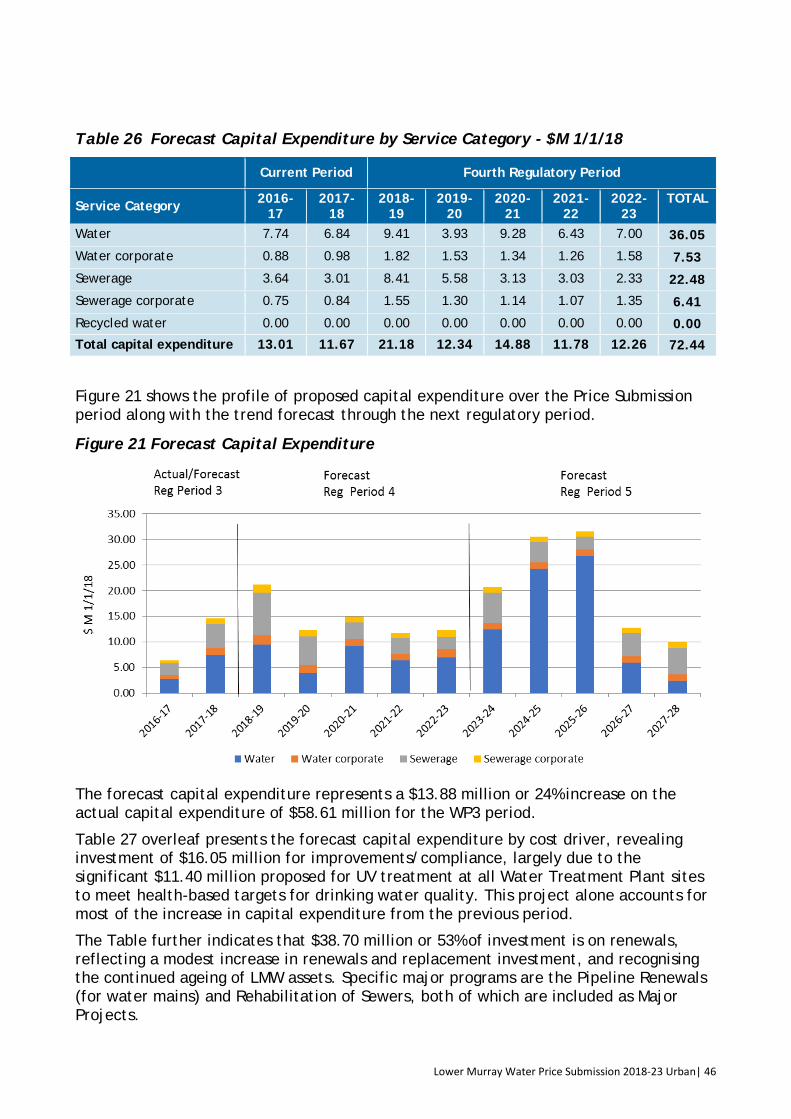
Lower Murray Water Price Submission 2018-23 Urban| 46
46
Table 26 Forecast Capital Expenditure by Service Category - $M 1/1/18
Current Period Fourth Regulatory Period
Service Category 2016-17
2017-18
2018-19
2019-20
2020-21
2021-22
2022-23
TOTAL
Water 7.74 6.84 9.41 3.93 9.28 6.43 7.00 36.05
Water corporate 0.88 0.98 1.82 1.53 1.34 1.26 1.58 7.53
Sewerage 3.64 3.01 8.41 5.58 3.13 3.03 2.33 22.48
Sewerage corporate 0.75 0.84 1.55 1.30 1.14 1.07 1.35 6.41
Recycled water 0.00 0.00 0.00 0.00 0.00 0.00 0.00 0.00 Total capital expenditure 13.01 11.67 21.18 12.34 14.88 11.78 12.26 72.44
Figure 21 shows the profile of proposed capital expenditure over the Price Submission period along with the trend forecast through the next regulatory period.
Figure 21 Forecast Capital Expenditure
The forecast capital expenditure represents a $13.88 million or 24% increase on the actual capital expenditure of $58.61 million for the WP3 period.
Table 27 overleaf presents the forecast capital expenditure by cost driver, revealing investment of $16.05 million for improvements/compliance, largely due to the significant $11.40 million proposed for UV treatment at all Water Treatment Plant sites to meet health-based targets for drinking water quality. This project alone accounts for most of the increase in capital expenditure from the previous period.
The Table further indicates that $38.70 million or 53% of investment is on renewals, reflecting a modest increase in renewals and replacement investment, and recognising the continued ageing of LMW assets. Specific major programs are the Pipeline Renewals (for water mains) and Rehabilitation of Sewers, both of which are included as Major Projects.
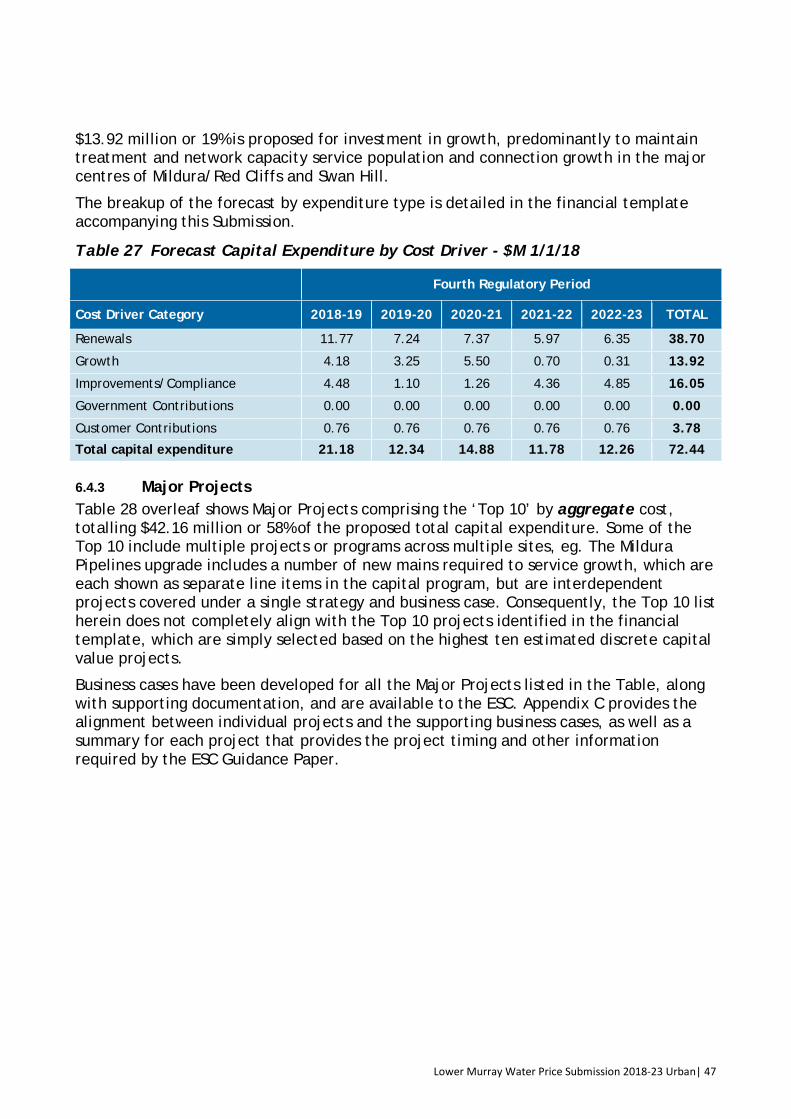
Lower Murray Water Price Submission 2018-23 Urban| 47
47
$13.92 million or 19% is proposed for investment in growth, predominantly to maintain treatment and network capacity service population and connection growth in the major centres of Mildura/Red Cliffs and Swan Hill.
The breakup of the forecast by expenditure type is detailed in the financial template accompanying this Submission.
Table 27 Forecast Capital Expenditure by Cost Driver - $M 1/1/18
Fourth Regulatory Period
Cost Driver Category 2018-19 2019-20 2020-21 2021-22 2022-23 TOTAL
Renewals 11.77 7.24 7.37 5.97 6.35 38.70
Growth 4.18 3.25 5.50 0.70 0.31 13.92
Improvements/Compliance 4.48 1.10 1.26 4.36 4.85 16.05
Government Contributions 0.00 0.00 0.00 0.00 0.00 0.00
Customer Contributions 0.76 0.76 0.76 0.76 0.76 3.78
Total capital expenditure 21.18 12.34 14.88 11.78 12.26 72.44
6.4.3 Major Projects Table 28 overleaf shows Major Projects comprising the ‘Top 10’ by aggregate cost, totalling $42.16 million or 58% of the proposed total capital expenditure. Some of the Top 10 include multiple projects or programs across multiple sites, eg. The Mildura Pipelines upgrade includes a number of new mains required to service growth, which are each shown as separate line items in the capital program, but are interdependent projects covered under a single strategy and business case. Consequently, the Top 10 list herein does not completely align with the Top 10 projects identified in the financial template, which are simply selected based on the highest ten estimated discrete capital value projects.
Business cases have been developed for all the Major Projects listed in the Table, along with supporting documentation, and are available to the ESC. Appendix C provides the alignment between individual projects and the supporting business cases, as well as a summary for each project that provides the project timing and other information required by the ESC Guidance Paper.

Lower Murray Water Price Submission 2018-23 Urban| 48
48
Table 28 Top Ten Proposed Capital Projects and Programs
No. Business Case Component Projects Total Project Cost ($M)
Major Service Category
ESC Cost Driver
1 Pipeline Renewals
ALL SITES Main Replacement PIA - Replace Main from WTP to Town (Mallee Hwy) LB - Lake Boga Trunk Main Replacement Stage 1
5.00 Urban Water
Maintain - Renewals
2 UV Treatment ALL SITES - UV Treatment Plants MDA WTP 7th St Upgrade Power Supply
11.40 Urban Water
Expand/Improve - Improvements
3 Purchase of Water
Purchase of Water 5.40 Urban Water
Expand/Improve - Improvements
4 Mildura Pipelines MDA ME DN225 Merbein River Ave - Reily St to Charles Rd MDA ME DN300 Trunk Main 15th St Benetook - Sandilong
1.36 Urban Water
Expand/Improve - Growth
5 Swan Hill North WTP
SH North WTP 6 ML Ground Level Storage SH North WTP Treated Water Pump Station (Stage 1)
4.70 Urban Water
Expand/Improve - Growth
6 Kerang Treated Water Pump Station
KER - Kerang Replace Treated Water Pump Station
1.50 Urban Water
Maintain - Renewals
7 Rehabilitation of Sewers
Northern - Sewer Rehab Program Southern - Sewer Rehab Program
5.25 Urban Sewerage
Maintain - Renewals
8 Koorlong Wet Weather Storage
KLG - WWTP Construct 400 ML Wet Weather Storage No 1
4.50 Urban Sewerage
Expand/Improve - Growth
9 Merbein Decommissioning and Diversion
MER - Merbein Decommission Waste Water Treatment Plant MER WWTP Divert to Koorlong
1.25 Urban Sewerage
Expand/Improve - Growth
10 Replace Swan Hill WWTP Rising Main
S/H - Replace WWTP Rising Main Stage 2
1.80 Urban Sewerage
Maintain – Renewals
TOTAL Major Projects $42.16 million
6.4.4 Programs and Other Projects LMW’s two major programs comprise Pipeline Renewals (including water mains) and Rehabilitation of Sewers, detailed in business cases 1 and 7 respectively in Table 28 above.
All other projects in the capital program are supported by at least a Project Briefing Sheet that sets out the project drivers, justification, scope, cost and expenditure by year, and alignment with customer outcomes to meet ESC Guideline requirements. These are available to the ESC.
6.4.5 Delivery of the Capital Program LMW has demonstrated a track record of delivering varied and larger capital programs than proposed for the fourth regulatory period. The forward total capital program for

Lower Murray Water Price Submission 2018-23 Urban| 49
49
both the rural and urban businesses is significantly below historic peaks as shown in Figure 22, and LMW is very confident in its capability to deliver the forward program.
Figure 22 Historical and Forecast Urban and Rural Capital Program
LMW has an established suite of planning and project/contract management procedures and documents, and a dedicated team of staff supported by consultants where required, to ensure successful and efficient management of the capital program delivery.
Construction is typically undertaken by contractors under competitive tendering conditions with contractual performance requirements. Some low risk capital projects are undertaken by LMW staff where resources and capability can demonstrate efficient and quality delivery, for example, for water main construction or replacement.
6.4.6 Uncertain Projects There are no nominated uncertain projects for the urban business, however LMW has through its capital planning process identified a number of projects that could have been included within PS4 as uncertain projects but have been deferred to the PS5 period. This is due to the confidence that LMW has in the strength of its capital and master planning processes, risk assessments, and the depth of understanding of desired customer outcomes.
An example of this is the future replacement of the Swan Hill WTP with the Swan Hill North WTP. The extensive options analysis conducted to determine the most economic replacement model (and minimise customer costs) undertaken within the master planning process combined with a critical failure assessment of the existing plant has given LMW confidence to delay components of this project to PS5.
6.4.7 Capex/Opex Tradeoffs Projects which may have potential capex/opex tradeoffs include:
• Renewals projects, where replacing a failing asset may reduce future maintenance requirements. In this case, LMW continues to deliver ongoing asset replacement (water mains, plant and equipment), refurbishment (storage tanks) and relining (sewers) programs. The programs are all designed to maintain service levels within targets, manage risk of major failure, and maintain a balance between reactive and preventive maintenance. Consequently, there are no specific and quantifiable operating expenditure reductions from renewals investment that might otherwise be possible if new or significantly enhanced programs are introduced. There is a change of focus in water main renewals to give more attention to critical water mains that should not be allowed to fail: this does not have any impact on forecast costs

Lower Murray Water Price Submission 2018-23 Urban| 50
50
although it does avoid some future reactive maintenance that would be incurred if mains were allowed to fail.
• Automation projects, where increased automation and remote monitoring provide opportunities for reductions in labour costs and site attendance. The operating expenditure efficiencies from these projects are described in Section 6.3.5 relating to productivity improvement and the Business Transformation project.
6.5 Return on the RAB The revenue requirement includes a return on the RAB and depreciation of the RAB. The RAB is rolled forward over time by adding new capital expenditure and deducting the government and customer contributions and asset disposals expected for each price review period, and RAB depreciation.
At the start of a new review period, the RAB is updated for actual outcomes with respect to capital expenditure, contributions and disposals for the current regulatory period. As the final year of the 3rd regulatory period is not complete, however, 2017/18 capital expenditure, contributions and disposals remain as per the 2013 Price Determination and will not be updated until the 5th Regulatory Review. Forecast capital expenditure for 2017-18 is anticipated to be slightly higher than that originally budgeted for at the time, which means that LMW will not receive a return on or of this additional planned expenditure during the fourth regulatory period.
Table 29 shows the updated roll forward calculation for the RAB, with actuals included for the years 2012/13 to 2016/17. The proceeds from disposals is largely due to renewal of plant and equipment.
Table 29 Updating the Regulatory Asset Base
Updated asset base 2nd Period Third Regulatory Period
$M, 1/1/18 2012-13 2013-14 2014-15 2015-16 2016-17 2017-18 Opening asset base 147.27 148.06 153.11 154.21 157.67 155.21
plus Gross capital expenditures 6.61 13.04 9.56 11.40 6.44 9.81
less Customer contributions 0.62 1.51 1.45 0.94 1.69 0.81
less Government contributions - - - - - -
less Regulatory depreciation 4.91 5.80 6.39 6.82 7.11 7.45
less Proceeds from disposals 0.30 0.68 0.61 0.18 0.10 0.42
Closing Asset Base 148.06 153.11 154.21 157.67 155.21 156.35
Capital expenditure of $72.44 million added to the RAB is consistent with the capital program forecast for the PS4 period. Capital additions occur only after the individual projects are considered prudent and efficient and meet the customer outcomes and LMW’s obligations.
Table 30 overleaf sets out the roll forward of the RAB to 2023 based on the forecasts of capital, depreciation, contributions and the return on equity based on the PREMO rating of Standard as shown in Figure 24.
The largest influences on the RAB are capital expenditure and regulatory depreciation.

Lower Murray Water Price Submission 2018-23 Urban| 51
51
Capital expenditure of $72.44 million added to the RAB is consistent with the capital program forecast for the PS4 period. Capital additions occur only after the individual projects are considered prudent and efficient and meet the customer outcomes and LMW’s obligations.
Regulatory depreciation is forecast to be $42.9 million over the PS4 period, as discussed in Section 6.5.1.
Table 30 Rolling Forward the Regulatory Asset Base
Rolled forward asset base Current Fourth Regulatory Period
$M, 1/1/18 2017-18 2018-19 2019-20 2020-21 2021-22 2022-23
Opening asset base 155.21 156.35 168.21 170.93 176.06 177.92
plus Gross capital expenditures 9.81 21.18 12.34 14.88 11.78 12.26
less Customer contributions 0.81 0.76 0.76 0.76 0.76 0.76
less Government contributions - - - - - -
less Regulatory depreciation 7.45 8.14 8.45 8.57 8.75 8.99
less Proceeds from disposals 0.42 0.42 0.42 0.42 0.42 0.42
Closing Asset Base 156.35 168.21 170.93 176.06 177.92 180.01
Figure 23 shows the rolling forward of the RAB to the end of the fifth regulatory period in 2027-28, indicating the progressive depreciation of existing assets and the value for new assets built from 2018-19.
Figure 23 Rolling Forward the Regulatory Asset Base to 2027-28
6.5.1 Regulatory Depreciation Regulatory depreciation is calculated on a straight line basis, using the ESC’s methodology for new asset additions. Regulatory depreciation is calculated with the RAB rolled forward from its starting value in 2004/5 using actual/forecast expenditure. As outturn capital expenditure and contributions etc. will differ from forecast, then the regulatory depreciation allowed for in the revenue requirement for the 3rd regulatory period may differ from the regulatory depreciation calculated with outturn actuals.

Lower Murray Water Price Submission 2018-23 Urban| 52
52
Therefore an adjustment is made to ensure that regulatory depreciation is not over or under recovered in total. The schedule of regulatory depreciation is included in the supporting documentation provided with the financial template.
6.5.2 Return on Equity. Based on LMW’s proposed PREMO rating of Standard, the proposed Return on Equity is 4.50% as shown in Figure 24 below.
Figure 24 Return on Equity Based on PREMO Rating
6.6 Tax Allowance For the tax allowance, ESC requires information on actual tax payments forecast as payable for National Tax Equivalent Regime (NTER) purposes under the Corporate Plan. Tax depreciation allowances have been calculated using the opening allowances and the amount of capital expenditure for each tax category. Carried forward losses mean that there will be no tax forecast as being payable in the regulatory review period.
Leading Advanced Standard Basic
Leading 5.30
Advanced 4.70 4.90
Standard 4.10 4.30 4.50
Basic 3.90 4.10
LMW Urban self-assessment (Maximum al lowable ROE) Standard 4.50
Water business self-assessment
ESC
asse
ssm
ent
of s
ubm
issi
on
Lower Murray Water Price Submission 2018-23 Urban| 53
53
7. Prices
7.1 Form of Price Control Consistent with LMW’s practice over the past three regulatory periods, LMW proposes a tariff basket form of control to set urban prices, as approved by the ESC in its Final Decision for WP3. The proposed approach is aligned with information from the urban customer survey which indicates 92% of customers consider LMW provides value for money. Customers are not requesting wholesale change to pricing and services, and maintaining the current tariff basket will maintain stability and consistency of prices. The approach provides an appropriate balance between the ability of LMW to respond to changing circumstances while providing certainty to customers regarding the level of their bills.
Under the proposed tariff basket price control, LMW takes the risk that the demand for water will be less than forecast, providing an incentive for LMW to manage its business efficiently, and ensure that, to the extent possible, costs are contained in line with the volume of water delivered to customers. By contrast, a revenue cap that enables a water supply business to recover from customers any under-recovery of revenue from previous years, adds considerably to the uncertainty faced by customers as to the level of their bills through possible annual swings in prices.
Moreover, compared to individual price caps, the tariff basket provides LMW with a degree of flexibility of pricing, within the limits set by additional side constraints. Given previous uncertainties which surrounded the extent of customers’ demand responses to the ending of the drought in 2010-11, along with the continuing impact of changing climate patterns, LMW seeks to retain the flexibility of being able to re-balance tariffs within the review period.
In practice, LMW has a strong track record of operating on this basis, having previously funded losses during the second regulatory period caused by both drought-driven water restrictions and flood-influenced lower demand, and in the case of ‘windfall’ gains during periods of higher than forecast water demand, has either returned income in price relief, or provided debt repayment or funded essential capital works which in the longer term results in price relief. For example, in addition to the price reductions introduced by the Fairer Water Bills review 2014, in 2015-16 LMW initiated the return of $1.0 million to customers via prices over a three year period due to a windfall through delivering more water than forecast during 2014-15. The volumetric prices were reduced by 1.76% annually from the ESC approved price path.
Customer Value Proposition – Prices
LMW proposes a form of price control and tariff structures that are consistent with past practice and familiar to customers. The two-part tariff and three-tiered volumetric structure provides benefit to vulnerable and low income customers in affordably meeting essential water needs, while providing all customers with reasonable means to control their water bill.
The proposed price adjustment mechanism for electricity costs recognises and shares the risks of significant electricity price increases, while providing for LMW to take the greatest share of risk as well as incentives for it to minimise energy use.
Lower Murray Water Price Submission 2018-23 Urban| 54
54
As a side constraint, LMW proposes to continue an upper constraint of CPI + 10% on the maximum increase in any individual tariff. This provides a further measure of protection to individual customers.
7.2 Prices and Tariff Structures
7.2.1 Introduction The ESC has given LMW discretion to decide on tariff structures in the past and it is noted that the ESC intends to continue this approach. For the PS4 period, LMW has not proposed any changes to its current tariff structures. LMW also is also proposing to retain postage stamp pricing, where the tariffs do not reflect any differences in costs of water and sewerage systems by time or location.
In setting prices and tariff structures, LMW has applied the principles of the Water Industry Regulatory Order (WIRO), which specifies that prices must:
• Provide incentives for the sustainable use of Victoria’s water resources by providing appropriate signals to water users about the costs of providing services (including costs associated with future supplies and periods of peak demand and/or restricted supply) and choices regarding alternative supplies for different purposes.
• Take into account the interest of customers of the regulated entity, including low income and vulnerable customers.
• Provide the regulated entity with incentives to pursue efficiency improvements and to promote the sustainable use of Victoria’s water resources, and
• Enable customers to readily understand the prices charged.
The balance between fixed and volumetric charges in the average bill is influenced by affordability concerns. LMW aims for a ratio of 40% fixed charges to 60% volumetric charges, intended to provide households with a high degree of control over their water bills. A high percentage of fixed charges would provide low-income households with little ability to influence the size of the bill by economising on water use. On the other hand, some element of fixed charge is appropriate given that over the medium to long term, many of the costs of water supply (and particularly sewerage) are invariant to the amount of water supplied.
LMW is proposing to smooth the price path for its customers. This will see the price path decrease in real terms consistently over the 5 year period.
7.2.2 Tariff Structures Water Service Charges (Residential and Non-Residential)
Water services are proposed to be levied a service charge based on the size of the connection. The vast majority of property connections are 20mm ,and the service charges listed in Table 31 below are for a 20mm connection.
The size of the water service charge increases for domestic and non-residential properties in proportion to the size of the connection as listed in Table 32 below. The structure of the service charges reflects the fact that maximum flow rates (and hence potential peak volumes supplied) increases with the square of the diameter of the pipe connection.
The water service charge is billed quarterly in advance.
Lower Murray Water Price Submission 2018-23 Urban| 55
55
Sewerage Service Charges (Residential and Non-Residential)
A fixed sewerage charge is proposed, with no volumetric component, reflecting the high fixed costs of providing sewerage services. Although the cost of pumping and treatment will vary with volume, sewage volumes are more related to infiltration rather than customer usage.
Likewise the sewerage service charges listed in Table 31 refers to the ‘base charge’. This base charge is subject to specific formulae to derive the service charge applicable to particular property classifications (related to the potential discharge load of each property type). The quantities in the financial model templates have been converted into an ‘equivalent’ basis so that equivalent demand multiplied by the base charge equals actual revenue.
The sewer service charge is billed quarterly in advance.
Water Volumetric Charges (Residential)
LMW proposes a three tier volumetric tariff structure for residential customers, with the second tier applying to volumes above 300 kL and the third tier applying to volumes above 600kL.
Customers are billed on a quarterly basis, with a seasonal split applied to the 300kL and 600 kL thresholds. In the warmer quarters (October to December and January to March) the quarterly thresholds are 100kL and 200 kL respectively. In the cooler quarters (April to June and July to September) the quarterly thresholds are 50kL and 100 kL. Thus the quarterly threshold, which is non-cumulative, accommodates a modest level of garden water, while ensuring that large discretionary water users pay for additional volumes at the higher tier rates.
Water Volumetric Charges (Non-Residential)
LMW proposes to continue its uniform volumetric rate for non-residential customers, with the rate consistent with the second tier of the residential rate structure.
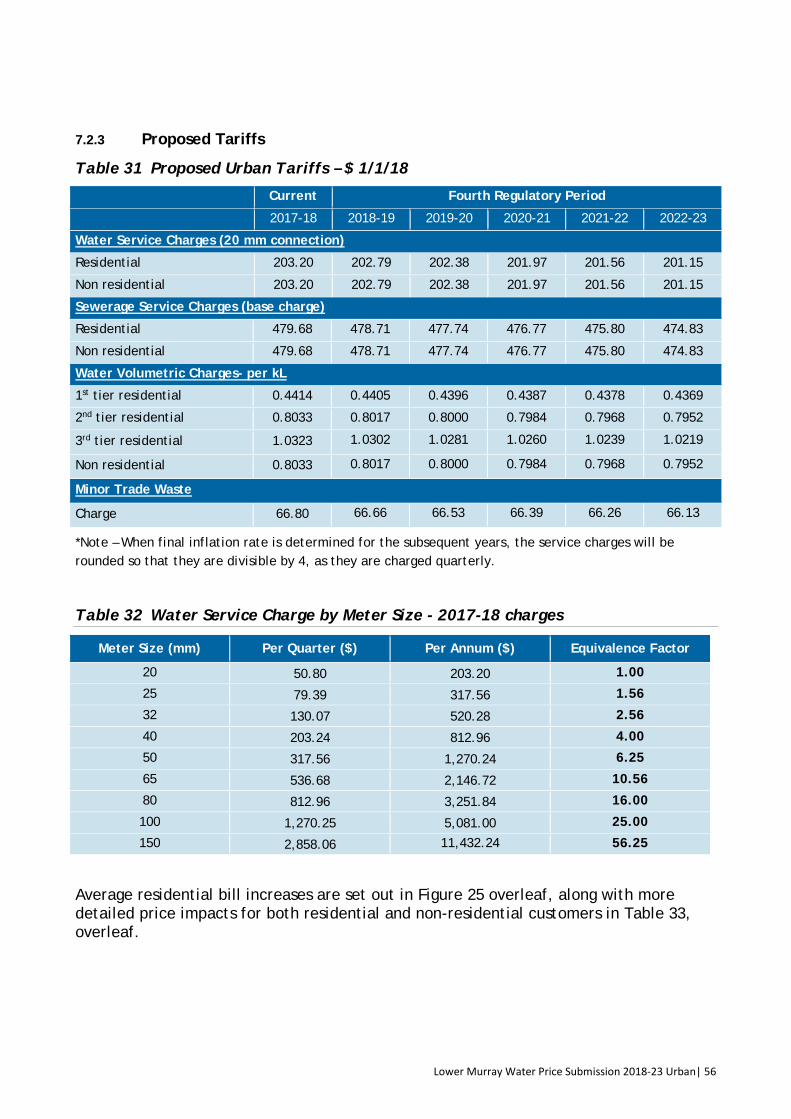
Lower Murray Water Price Submission 2018-23 Urban| 56
56
7.2.3 Proposed Tariffs
Table 31 Proposed Urban Tariffs – $ 1/1/18
Current Fourth Regulatory Period
2017-18 2018-19 2019-20 2020-21 2021-22 2022-23
Water Service Charges (20 mm connection)
Residential 203.20 202.79 202.38 201.97 201.56 201.15
Non residential 203.20 202.79 202.38 201.97 201.56 201.15
Sewerage Service Charges (base charge)
Residential 479.68 478.71 477.74 476.77 475.80 474.83
Non residential 479.68 478.71 477.74 476.77 475.80 474.83
Water Volumetric Charges- per kL
1st tier residential 0.4414 0.4405 0.4396 0.4387 0.4378 0.4369
2nd tier residential 0.8033 0.8017 0.8000 0.7984 0.7968 0.7952
3rd tier residential 1.0323 1.0302 1.0281 1.0260 1.0239 1.0219
Non residential 0.8033 0.8017 0.8000 0.7984 0.7968 0.7952
Minor Trade Waste
Charge 66.80 66.66 66.53 66.39 66.26 66.13
*Note – When final inflation rate is determined for the subsequent years, the service charges will be rounded so that they are divisible by 4, as they are charged quarterly.
Table 32 Water Service Charge by Meter Size - 2017-18 charges
Meter Size (mm) Per Quarter ($) Per Annum ($) Equivalence Factor
20 50.80 203.20 1.00
25 79.39 317.56 1.56
32 130.07 520.28 2.56
40 203.24 812.96 4.00
50 317.56 1,270.24 6.25
65 536.68 2,146.72 10.56
80 812.96 3,251.84 16.00
100 1,270.25 5,081.00 25.00
150 2,858.06 11,432.24 56.25
Average residential bill increases are set out in Figure 25 overleaf, along with more detailed price impacts for both residential and non-residential customers in Table 33, overleaf.

Lower Murray Water Price Submission 2018-23 Urban| 57
57
Figure 25 Proposed Urban Price Changes – Average Residential Bill $1/1/18
Table 33 Water and Sewerage Bill Changes
$1/1/18 Current Fourth Regulatory Period
2017-18 2018-19 2019-20 2020-21 2021-22 2022-23
RESIDENTIAL Total Bill Increase from previous year
400 kL 895.63 -1.82 -1.81 -1.81 -1.81 -1.80
477 kL (average) 957.48 -1.94 -1.94 -1.93 -1.93 -1.93
1,200 kL 1675.67 -3.40 -3.39 -3.39 -3.38 -3.37
NON-RESIDENTIAL Total Bill Increase from previous year
400 kl 524.52 -2.04 -2.03 -2.03 -2.02 -2.02
3,000 kl 2,613.10 -6.27 -6.26 -6.25 -6.24 -6.22
30,000 kl 24,302.20 -50.27 -50.17 -50.06 -49.96 -49.86
220,000 kl 176,929.20 -359.86 -359.13 -358.41 -357.68 -356.95
7.2.4 New Customer Contributions LMW applies the ESC’s New Customer Contribution (NCC) framework and NCC Estimator to calculate NCCs. LMW’s Negotiating Framework was approved by the ESC as part of LMW’s 2013-18 Water Plan and has not been amended, and is available to the ESC as supporting documentation.
LMW provides information to all development applicants in accordance with the Negotiating Framework to provide the basis for connection contributions and conditions of service, along with the pricing principles, timeframes for response, and dispute resolution information.
The outcome of the standard NCC using the Estimator (and based on the proposed forecasts of incremental growth-related capital expenditure, incremental tariff revenue, new connections, estimated consumption, current tariffs, incremental bulk water charges from Goulburn Murray Water, and incremental operating costs over a 35 year

Lower Murray Water Price Submission 2018-23 Urban| 58
58
period) is detailed in Table 34 for the fourth regulatory period. The Table shows a minor decrease in real terms for a water connection and a minor increase in real terms for a sewer connection for developers based on current 2017-18 charges.
LMW proposes to continue to adopt two lot size ranges: below 750 m² and above 750 m². There has been an increase in the number of small lot sizes being developed, and two lot sizes that reflect the increase in small lot sizes is considered a fair and equitable approach.
Table 34 New Customer Contributions ($ 1/1/18)
Lot Size Current Fourth Regulatory Period
2017-18 2018-19 2019-20 2020-21 2021-22 2022-23
Water
0-750m² 1,880.00 1,872.00 1,872.00 1,872.00 1,872.00 1,872.00
>750m² 3,760.00 3,744.00 3,744.00 3,744.00 3,744.00 3,744.00
Sewerage
0-750m² 1,251.00 1,280.00 1,280.00 1,280.00 1,280.00 1,280.00
>750m² 2,508.00 2,561.00 2,561.00 2,561.00 2,561.00 2,561.00
7.2.5 Negotiated Trade Waste To date LMW’s trade waste pricing has been based on the Water Industry Regulatory Order (“WIRO”) 2003. The updated WIRO October 2014 provides greater flexibility in the manner, approach and method to be used for pricing water services. Following on from the 2014 WIRO, the ESC made a number of changes to its water pricing framework and approach, which are outlined in its Water Pricing Framework and Approach, October 2016 (WPF). Applying these pricing principles will allow LMW the flexibility to meet the market, by setting the price of trade waste services at levels which are below the cost of alternative processing options available to customers while securing a responsible level of marginal revenue. To enable implementation of the new WPF, an updated Trade Waste Pricing Model has been developed which calculates both the full absorbed cost and the marginal cost of processing trade waste. The revenue from trade waste is included in miscellaneous revenues, detailed below.
7.2.6 Miscellaneous Revenues for Prescribed Services LMW has a number of miscellaneous charges to cover a range of services. There are also a range of other revenues which serve to offset the amount of revenue required to be recovered from customers. Appendix D lists all of the miscellaneous charges levied by LMW and the charges levied for the current year. The Appendix also sets out the increases in charges proposed for the five years of the regulatory period.
Table 35 overleaf sets out the forecast for miscellaneous revenue for the review period. These include forecast contract revenues for recycled water from the Koorlong wastewater treatment plant.

Lower Murray Water Price Submission 2018-23 Urban| 59
59
Table 35 Miscellaneous Revenue
$M 1/1/18 Current Fourth Regulatory Period
Revenue type 2017-18 2018-19 2019-20 2020-21 2021-22 2022-23
Trade waste 0.40 0.31 0.31 0.32 0.33 0.34
Recycled water contract revenues
0.18 0.18 0.19 0.19 0.20 0.20
Miscellaneous revenue
0.60 0.59 0.60 0.61 0.63 0.64
7.3 Adjustment to Prices
7.3.1 Uncertain or Unforeseen Events LMW proposes that the adjustment mechanism for unforeseen or uncertain events continues to apply for this regulatory period unchanged. Under the provisions of a Determination, LMW may apply for an adjustment of the scheduled prices and/or the revenue requirements as a result of events that could not reasonably have been foreseen or were uncertain at the time the Determination is made. Examples of unforeseen or uncertain events include licence fees or contributions which differ from the forecast, changes in the timing or scope of expenditure on major capital projects, or material differences in outturn demand. Exclusions would continue to apply, including matters which should have been known about or under LMW’s control, could have been planned for or managed by LMW or reflect inefficient expenditure.
7.3.2 Trailing Cost of Debt LMW proposes a price adjustment mechanism to allow prices to adjust on an annual basis to reflect movements in the trailing cost of debt. The Commission will use a 10 year trailing average approach to estimate the benchmark cost of debt. The trailing average approach will determine the whole cost of debt (risk free rate and debt risk premium). The averaging period will be the 10 years preceding the year in which the rate applies.
The 10 year trailing average costs of debt will be rolled forward each year, such that:
• The cost of debt for the foll forward (previous) year reflects the yields of 10 year BBB rated corporate bonds – the RBA Table F3 series FNFYBBB10M
• The annual update is a simple average of 12 months of the RBA 10 year BBB-rated corporate bond over 1 April to 31 March
• The trailing average is a simple average of 10 years of cost of debt.
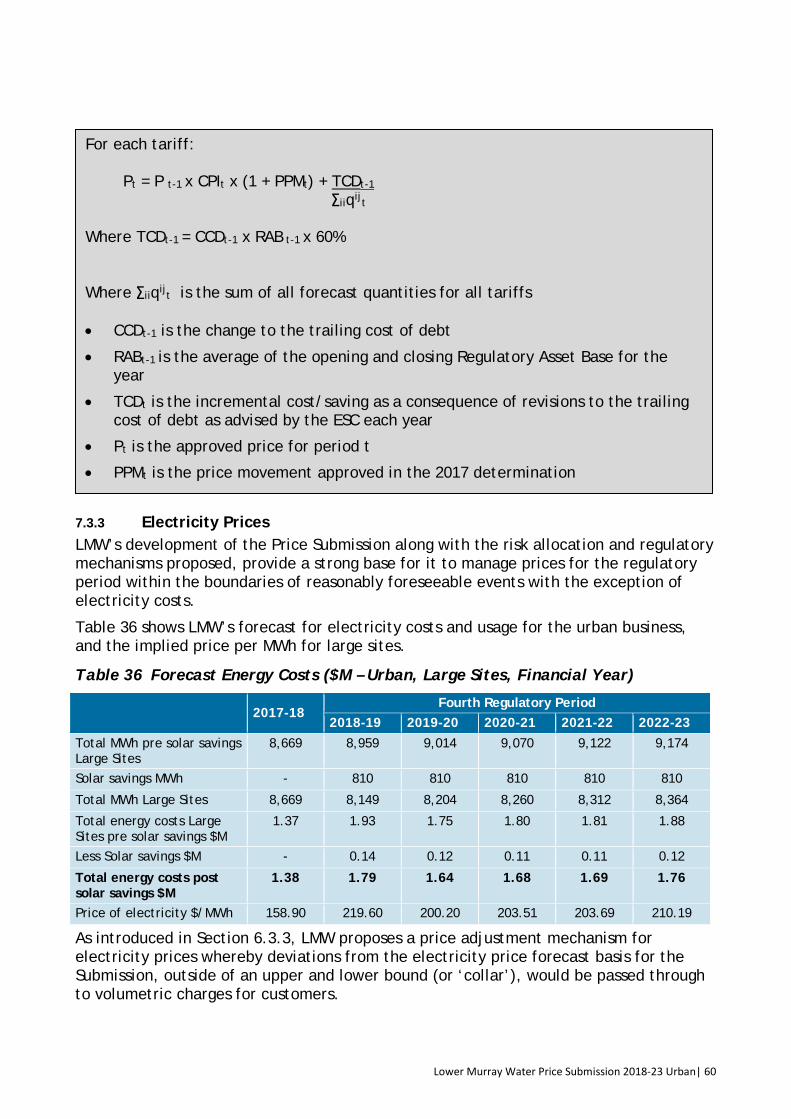
Lower Murray Water Price Submission 2018-23 Urban| 60
60
7.3.3 Electricity Prices LMW’s development of the Price Submission along with the risk allocation and regulatory mechanisms proposed, provide a strong base for it to manage prices for the regulatory period within the boundaries of reasonably foreseeable events with the exception of electricity costs.
Table 36 shows LMW’s forecast for electricity costs and usage for the urban business, and the implied price per MWh for large sites.
Table 36 Forecast Energy Costs ($M – Urban, Large Sites, Financial Year)
2017-18 Fourth Regulatory Period
2018-19 2019-20 2020-21 2021-22 2022-23 Total MWh pre solar savings Large Sites
8,669 8,959 9,014 9,070 9,122 9,174
Solar savings MWh - 810 810 810 810 810
Total MWh Large Sites 8,669 8,149 8,204 8,260 8,312 8,364
Total energy costs Large Sites pre solar savings $M
1.37 1.93 1.75 1.80 1.81 1.88
Less Solar savings $M - 0.14 0.12 0.11 0.11 0.12
Total energy costs post solar savings $M
1.38 1.79 1.64 1.68 1.69 1.76
Price of electricity $/MWh 158.90 219.60 200.20 203.51 203.69 210.19
As introduced in Section 6.3.3, LMW proposes a price adjustment mechanism for electricity prices whereby deviations from the electricity price forecast basis for the Submission, outside of an upper and lower bound (or ‘collar’), would be passed through to volumetric charges for customers.
For each tariff:
Pt = P t-1 x CPIt x (1 + PPMt) + TCDt-1
∑iiqijt
Where TCDt-1 = CCDt-1 x RAB t-1 x 60%
Where ∑iiqij
t is the sum of all forecast quantities for all tariffs • CCDt-1 is the change to the trailing cost of debt
• RABt-1 is the average of the opening and closing Regulatory Asset Base for the year
• TCDt is the incremental cost/saving as a consequence of revisions to the trailing cost of debt as advised by the ESC each year
• Pt is the approved price for period t
• PPMt is the price movement approved in the 2017 determination

Lower Murray Water Price Submission 2018-23 Urban| 61
61
Upper and lower bounds of the ‘collar’ of plus or minus 60% are proposed, which implies that LMW would absorb a financial impact up to $1 million before passing through an adjustment in prices to customers.
Once the trigger has been reached, the increased costs to be passed through into prices are calculated by multiplying the incremental energy price by the forecast MWh as per Table 36. To avoid a full pass-through, the adjustment mechanism passes through only the additional costs over the trigger plus half the additional costs that follow from electricity prices reaching the trigger point.
Less than full pass through of costs will ensure that LMW does not simply rely on passing through any and all costs differences between the actual and forecast onto the customer, and will be motivated to negotiate the lowest possible total electricity price as well as minimising energy use where possible.
The concept and possible price scenarios are shown in Figure 26 below.
Figure 26 Price Adjustment Scenarios
Under Scenarios 1 and 4, LMW would pass on a proportion of the energy price increase or decrease. Under Scenarios 2 and 3, LMW would absorb additional energy costs or savings, although it would be open to LMW to pass on the full savings of a price decrease.
The effect on prices to customers would be spread across the remaining years of the price review period, so that if electricity prices were increased by say 80% above the base case in 2018-19, then volumetric charges for customers would be increased by $0.0122 per kL for the years 2019-20 to 2022-23.
The advantage of this mechanism is that LMW is protected from large unforeseen electricity price increases, and this protection enables LMW to incorporate lower energy prices in its Price Submission than would be possible without some form of risk sharing.
LMW proposes the required adjustment to Schedule 2 formulae in the box below.

Lower Murray Water Price Submission 2018-23 Urban| 62
62
The mechanism necessarily operates with a lag, with actual changes in energy prices resulting in an adjustment to prices to customers in the following year (if the collar is passed). Actual energy costs per MWh for the financial year will not be known in time for the price adjustment to be assessed, so LMW proposes that the movement in energy prices on a Feb to Jan year be used as the basis of determining the energy price increase.
Table 37 sets out the base Feb to Jan energy prices that form the baseline for calculation of the collar each year, together with the baseline volumetric charges.
Table 37 Baseline Volumetric Charges and Energy Prices
Units Fourth Regulatory Period 2018-19 2019-20 2020-21 2021-22 2022-23
Price of electricity $/MWh (see note)
$/MWh 195.94 207.86 202.54 203.58 207.55
Domestic tier 1 $/kL 0.4405 0.4396 0.4387 0.4378 0.4369
Domestic tier 2 $/kL 0.8017 0.8000 0.7984 0.7968 0.7952
Domestic tier 3 $/kL 1.0302 1.0281 1.0260 1.0239 1.0219
Non Domestic $/kL 0.8017 0.8000 0.7984 0.7968 0.7952
Note: Feb to Jan year basis for costs.
For each volumetric tariff component:
Pt = P t-1 x CPIt x (1 + PPMt) + PECt-1
∑iiqijt
Provided IEC t-1 / FMWht-1 > 60% x FECt-1 / FMWht-1 or < -60% x FECt-1 / FMWht-1 Where IEC t-1 = ECt-1 – FECt-1 x INDt-1
IND18
Where ∑iiqij
t is the sum of all forecast quantities for all volumetric tariff components Where PECt = ECt – FECt x 160% x INDt + FECt x 60% x INDt
IND18 2 IND18 • PECt is the incremental electricity cost calculated on forecast megawatt hours to
be passed through in prices
• IECt-1 is the incremental electricity cost calculated on forecast megawatt hours
• ECt is outturn electricity prices in regulatory year t x forecast megawatt hours
• FECt is forecast electricity costs per the 2017 determination, in 2017/18 prices
• FMWht is forecast megawatt hours per the 2017 determination
• INDt is the CPI index for regulatory year
• IND18 is the CPI index for 2017/18
• Pt is the approved price for period t
• PPMt is the price movement approved in the 2017 determination
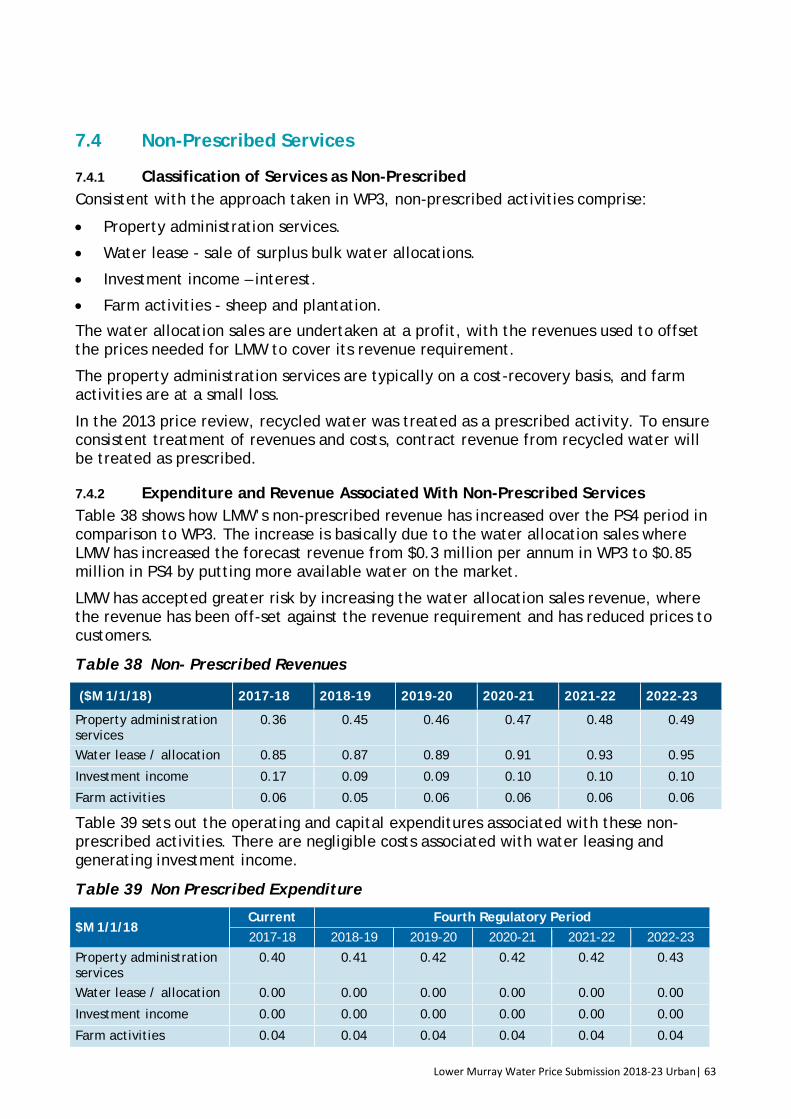
Lower Murray Water Price Submission 2018-23 Urban| 63
63
7.4 Non-Prescribed Services
7.4.1 Classification of Services as Non-Prescribed Consistent with the approach taken in WP3, non-prescribed activities comprise:
• Property administration services.
• Water lease - sale of surplus bulk water allocations.
• Investment income – interest.
• Farm activities - sheep and plantation.
The water allocation sales are undertaken at a profit, with the revenues used to offset the prices needed for LMW to cover its revenue requirement.
The property administration services are typically on a cost-recovery basis, and farm activities are at a small loss.
In the 2013 price review, recycled water was treated as a prescribed activity. To ensure consistent treatment of revenues and costs, contract revenue from recycled water will be treated as prescribed.
7.4.2 Expenditure and Revenue Associated With Non-Prescribed Services Table 38 shows how LMW’s non-prescribed revenue has increased over the PS4 period in comparison to WP3. The increase is basically due to the water allocation sales where LMW has increased the forecast revenue from $0.3 million per annum in WP3 to $0.85 million in PS4 by putting more available water on the market.
LMW has accepted greater risk by increasing the water allocation sales revenue, where the revenue has been off-set against the revenue requirement and has reduced prices to customers.
Table 38 Non- Prescribed Revenues
($M 1/1/18) 2017-18 2018-19 2019-20 2020-21 2021-22 2022-23
Property administration services
0.36 0.45 0.46 0.47 0.48 0.49
Water lease / allocation 0.85 0.87 0.89 0.91 0.93 0.95
Investment income 0.17 0.09 0.09 0.10 0.10 0.10
Farm activities 0.06 0.05 0.06 0.06 0.06 0.06
Table 39 sets out the operating and capital expenditures associated with these non-prescribed activities. There are negligible costs associated with water leasing and generating investment income.
Table 39 Non Prescribed Expenditure
$M 1/1/18 Current Fourth Regulatory Period 2017-18 2018-19 2019-20 2020-21 2021-22 2022-23
Property administration services
0.40 0.41 0.42 0.42 0.42 0.43
Water lease / allocation 0.00 0.00 0.00 0.00 0.00 0.00
Investment income 0.00 0.00 0.00 0.00 0.00 0.00
Farm activities 0.04 0.04 0.04 0.04 0.04 0.04

Lower Murray Water Price Submission 2018-23 Urban| 64
64
7.5 Financial Position Table 40 details the financial indicators for the primary measures included in the ESC financial template, to enable the ESC to assess LMW’s financial position in context with the prices proposed within the PS4 submission.
The ESC template allocates any available cash to repayment of loans, however this assumption does not take into account LMW’s rural business.
LMW’s urban business currently has a cash surplus which is used within the LMW consolidated business, removing the need for rural business to borrow from the Treasury Corporation of Victoria (TCV). The LMW urban business borrowed $20 million ($40 million in total with the rural business) in 2010 and the loan does not mature until 2040.
LMW has included the interest repayments as per the TVC repayment schedule within the template however the indicators in the FO template adjusts LMW’s debt and interest payments utilising surplus cash.
LMW’s cash position remains strong with cash generated from operating activities ranging from $14.9 million to $20.1 million over the PS4 period.
The primary indicator – Funds From Operations (FFO) interest cover, demonstrates LMW’s strong ability to meet its debt obligations.
The remaining indicators also point to LMW urban business continuing in a strong and sustainable financial position.
Table 40 Financial Indicators
Financial Indicator Current Fourth Regulatory Period 2017-18 2018-19 2019-20 2020-21 2021-22 2022-23
Funds from operations $m 16.51 14.93 16.82 18.10 19.11 20.17
FFO interest cover (times) -69.94 -843.44 -545.87 262.83 -42.58 -28.19
Net Debt / RAV (Gearing) (%) -1.8% -5.9% -2.0% -4.3% -5.4% -8.6%
FFO / Net debt (%) -601.3% -151.4% -473.1% -228.9% -181.5% -117.3%
Internal financing ratio (%) 183.3% 71.5% 138.8% 119.7% 158.3% 156.5%

Lower Murray Water Price Submission 2018-23 Urban| 65
65
Appendix A Customer Outcomes What customers will receive
Keep My Costs To A Minimum
Performance measures and targets
• Deliver residential price path as ESC approved • Deliver 1% efficiency improvement on controllable base (2016-17)
operating expenditure • 100% of statutory compliance reports generated automatically • Deliver capital plan on-cost and on-budget
Major Change Projects • Business Transformation Project (costs efficiencies and customer service)
• Culture Program around “running it like their own business” • Electricity and renewables cost reduction Project
Key Operational activities
• Utilise natural attrition to reduce staff numbers • Collaborate with other agencies to reduce costs through bulk
purchasing and shared services • Maintain long term financial viability and sustainability through
full cost recovery • Manage assets to optimise whole of life cycle costs • Communicate effectively with customers on aesthetic water
quality events such as blackwater. We will not ‘gold plate assets for rare events’
• Install solar to reduce electricity costs
Inputs • Cost movements • Resources required
• 3 new resources: asset management analyst and 2 business process resources
• $2.60 million in labour savings delivered over PS4, a substantial portion through natural attrition.

Lower Murray Water Price Submission 2018-23 Urban| 66
66
What customers will receive
Be Easy To Contact and Quick To Respond
Performance measures and targets
• Post-interaction satisfaction survey 150 completed and 80% satisfied
• Complaints to EWOV less than 10 per year • Net promoter score increasing from 26 to 30%
Major Change Projects • Completion of specific IT projects to increase customer contact channels
• Completion of Customer Portal to improve customer’s ability to easily contact LMW, obtain information, and request services.
• Investment in Mobility to allow in-field resolution of issues
Key Operational Activities
• Respond promptly and effectively to service requests and complaints.
• Engage with customers on their service needs and report back on our performance.
• Prompt communication of water related issues • Implement an optional post-interaction satisfaction survey,
including developers and customers seeking development services Manage customer services to comply with Water Customer Service Code including amendments relating to family violence.
• Maintain trained staff and resources to respond to service issues • Maintain and consult with community customer committees and
stakeholders • Continue our review of business processes with customers service
and efficiency as priorities, including to streamline customer interactions
Inputs • Cost movements • Resources required
• Increase in two positions to support business process review - $0.116 million per annum for 2 years
• Training budget and HR budget for Culture program $59,000 per annum.

Lower Murray Water Price Submission 2018-23 Urban| 67
67
What customers will receive
Provide Me With Consistent, Safe, Clean Drinking Water
Performance measures and targets
• 100% compliance with Safe Drinking Water Regulations 2015 • 100% compliance with Health-Based Targets (HBT) by 2020 • Percentage of customers satisfied with water quality increasing
from > 90% to > 94% • Water quality complaints per year less than 25 customers • No boiled water notices • No customers experiencing > 5 unplanned interruptions in a year • Unplanned water supply interruptions < 25 per 100 km per annum
Major Change Projects • Improve water quality under stressed river conditions through UV treatment at all WTPs to meet Health-Based Targets
• Invest $5.0 million in renewals and replacement of water mains to maintain network reliability
• Invest $3.14 million in renewals and replacement of pumping and treatment equipment, switchboards and structures over the period to maintain water quality and system capability
• Deliver proposed major capital projects for: • UV treatment at all WTPs and 7th St Mildura WTP power
($11.4 million) • Mildura Water Supply System upgrade ($1.36 million) • Swan Hill Water Supply System upgrade ($4.70 million) • Kerang Treated Water Pump Station ($0.75 million)
• Improved performance monitoring and control systems and data collection ($2.45 million)
• Purchase of 2 mobile generators for service resilience.
Key Operational Activities
• Provide river-to-tap water quality management. • Manage water taste and odour issues, and follow up on water
quality complaints. • Periodically clean water mains and tanks • Support reliability with backup generators. • Meet government compliance requirements for water quality
planning, reporting, auditing and training, eg. publish Annual Drinking Water Quality Report and prepare Water Quality Management Plan.
• Maintain blue-green algae regional coordination, contingency planning, monitoring and reporting
Inputs • Cost movements • Resources required
• Additional operating costs of $0.41 million associated with UV operation, and $0.12 million for air scouring, over the PS4 period
• Proposed Capex of $30.11 million total for drinking water supply (excluding water purchase and solar projects)
• Employ SCADA engineer
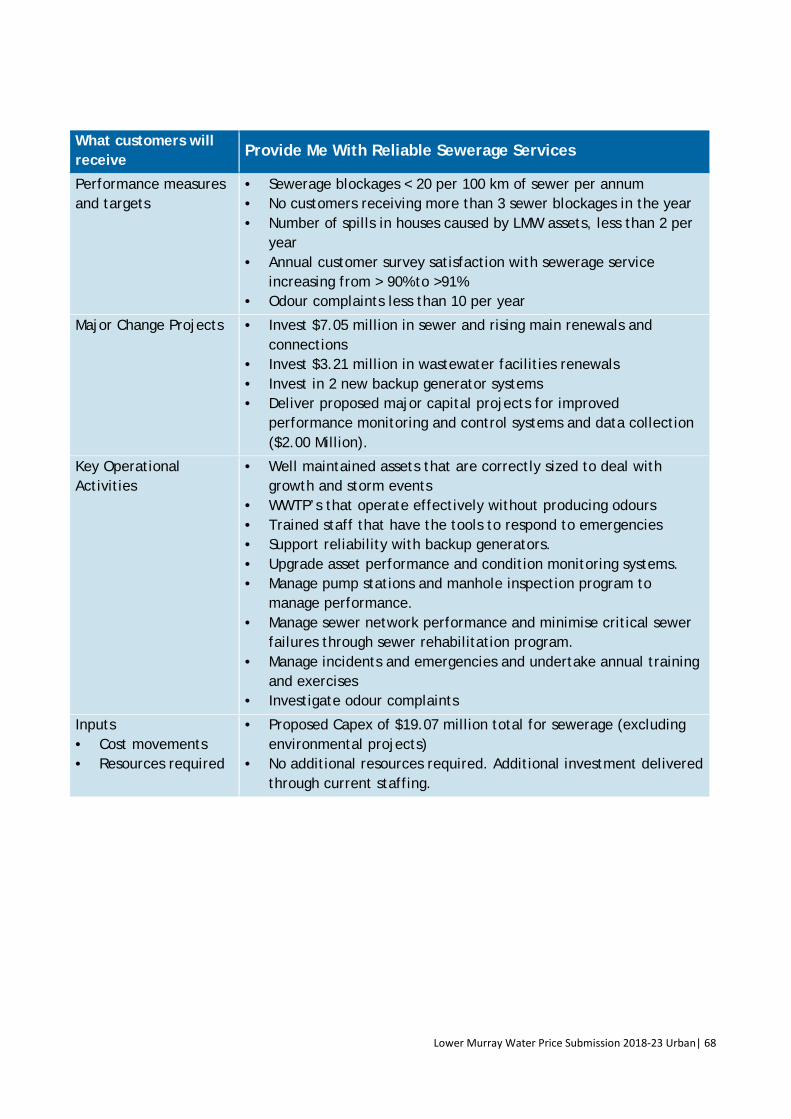
Lower Murray Water Price Submission 2018-23 Urban| 68
68
What customers will receive
Provide Me With Reliable Sewerage Services
Performance measures and targets
• Sewerage blockages < 20 per 100 km of sewer per annum • No customers receiving more than 3 sewer blockages in the year • Number of spills in houses caused by LMW assets, less than 2 per
year • Annual customer survey satisfaction with sewerage service
increasing from > 90% to >91% • Odour complaints less than 10 per year
Major Change Projects • Invest $7.05 million in sewer and rising main renewals and connections
• Invest $3.21 million in wastewater facilities renewals • Invest in 2 new backup generator systems • Deliver proposed major capital projects for improved
performance monitoring and control systems and data collection ($2.00 Million).
Key Operational Activities
• Well maintained assets that are correctly sized to deal with growth and storm events
• WWTP’s that operate effectively without producing odours • Trained staff that have the tools to respond to emergencies • Support reliability with backup generators. • Upgrade asset performance and condition monitoring systems. • Manage pump stations and manhole inspection program to
manage performance. • Manage sewer network performance and minimise critical sewer
failures through sewer rehabilitation program. • Manage incidents and emergencies and undertake annual training
and exercises • Investigate odour complaints
Inputs • Cost movements • Resources required
• Proposed Capex of $19.07 million total for sewerage (excluding environmental projects)
• No additional resources required. Additional investment delivered through current staffing.

Lower Murray Water Price Submission 2018-23 Urban| 69
69
What customers will receive Be Present And Active In The Community
Performance measures and targets
• Community satisfaction survey with satisfaction level increasing from >91% to >95%
• Local engagement groups meet formally at least annually with yearly ‘Pop up Kiosks’ in major centres
• Publish “LMW News” informing community on activities on monthly basis
• Run an annual open day of key local infrastructure • Develop/deliver strategy for cultural minorities inclusion
Major Change Projects • Purchase water entitlements to maintain 50% buffer between bulk water entitlement and water demand to protect local community amenity and drinking water supplies during drought
• Develop a mechanism for maintenance of community assets during drought
• Develop/ Deliver trainee programs for local Aboriginal and other cultural minorities
• Implement Family Violence policy • Implement Reconciliation Action Plan. • Aboriginal engagement and involvement in water management
and access to water (LoE 3, CPRG App 3A-AC1) • Traditional Owners engagement to include Aboriginal values in
water planning (LoE 3, CPRG App 3A-AC2) • Project – generating economic opportunities through improving
Aboriginal access to water(LoE 3) Key Operational Activities
• Continue to implement shared services arrangements for process and services.
• Local offices and staff who know our local area and what we are talking about
• Continue leadership on growing and strengthening our communities
• Assistance for the vulnerable members of our community • Maintain current levels of engagement with the community and
continue consultation on key projects • Proactive relationships with local councils, developers,
community groups and local Chambers of Commerce to facilitate growth
• Develop/deliver strategy for gender equity and aboriginal and other cultural minorities inclusion
• Continue to utilise local contractors and service providers within purchasing guidelines
• Community sponsorship of local water related events • Provide educational information to schools, customers and the
broader community on sustainable water resource management, water quality and environment and provide tours of operational
Inputs • Cost movements • Resources required
• Budget of $100,000 per year to fund inclusion initiatives • Community sponsorship budget of $20,000 • Water purchase budget of $5.40 million

Lower Murray Water Price Submission 2018-23 Urban| 70
70
What customers will receive Be Mindful Of Our Environment
Performance measures and targets
• Reduce CO2 emissions by 16,800 tonnes during PS4 • Number of EPA reportable sewage spills less than 2 per annum • 100% compliance of WWTP discharges with EPA corporate license
conditions • All key sites have generator availability or capability to maintain
services in event of sustained power outage
Major Change Projects • Completion of renewable energy projects comprising five pilot solar PV installations
• Develop Climate Change Adaptation Strategy (LoE 1.) and build into Corporate Strategy
• Develop energy strategy including procurement and efficiency options
• Koorlong Waste Water Treatment Plant Wet Weather Storage
Key Operational Activities
• Urban Water Supply Strategy updated every five years ensuring long term planning around resource availability
• Services delivered by an organisation which minimises its impact of its activities on the environment by being:
• Resilient and adaptive to a changing climate • Which is aware of and complies with its environmental
regulatory obligations • Embraces proven cost effective technology to reduce
environmental footprint. • Investigate all sewer spills and odour complaints and implement
control measures • Maintain accurate recording and reporting of CO2 emissions • Manage wastewater in accordance with Environmental
Management Plan (EMP) including recycled water. • Undertake environmental water quality monitoring and testing • Maintain Emergency Management System, procedures and staff
training • Manage discharges to waters from WWTPs • Recycle bio solids according to bio solids strategy • Support local councils and developers in integrated water cycle
planning • Asbestos waste generated from activities handled according to
industry practice
Inputs • Cost movements • Resources required
• Investment of $0.9 million by 2019 in five 100KW solar PV pilots to reduce electricity charges and CO2 emissions
• Investment of $1.8 million to replace main outfall main to Swan Hill WWTP.
• Investment of $1.25 million divert flows and decommission Merbein WWTP

Lower Murray Water Price Submission 2018-23 Urban| 71
71
What customers will receive Comply with Other Government Obligations
Performance measures and targets
• 100% compliance with government reporting and policy requirements
• Implement strategies to deliver Letter of Expectations and associated policies (Water for Victoria)
Major Change Projects • Enabling local government & communities to realise liveability outcomes(LoE 3, CPRG App 3A-L1)
• Water efficiency (CPRG App 3A-L2) • Gender and cultural diversity measure, incl exec leadership (LoE
6, CPRG 3A-G1) • Extend community engagement to recreational water to consider
shared benefits (LoE 4) • Deliver project for recreational water (LoE 4) • Develop/deliver strategy for gender equity and aboriginal
inclusion (LoE 4 & 6, Vision 2023) • Expansion of urban water supply districts (Customer) • Drought Preparedness and Urban Water Strategy (CPRG App 3A) • Manage trade waste to protect sewerage systems, treatment
works, the health and safety of the public and workers, minimise environmental impacts, and not present barriers to recycling.
Key Operational Activities
• Support sustainable and liveable communities (SoO 1.6.1) • Monitor and report on compliance with obligations and if
required, notify of failures and plan of action to rectify (SoO 8.1) • Arrange independent audits of compliance (SoO 8.2.2) or other
audits (SoO 8.3.1)
Inputs • Cost movements • Resources required
• Engage 3 Aboriginal stewards / trainees / interns over PS4 period. • Victorian Protective Data Security Standards (VPDSS) - $0.05
million.
• Asset optimisation and AMAF attestation -$0.31 million
• Diversity and Aboriginal cultural connection - $0.25 million.
Notes: LoE is the Minister’s Letter of Expectations SoO is the Statement of Obligations

Lower Murray Water Price Submission 2018-23 Urban| 72
72
Appendix B Capital Expenditure
Water Capital Expenditure 2018-19 2019-20 2020-21 2021-22 2022-23 Project TotalALL SITES Land Development 0.25 0.25 0.25 0.25 0.25 1.25ALL SITES Minor Capital Works - Replacement 0.39 0.31 0.27 0.27 0.27 1.51ALL SITES Minor Capital Works - New 0.35 0.25 0.25 0.25 0.25 1.35ALL SITES Main Replacement 0.65 0.85 0.67 0.90 1.30 4.37ALL SITES Asset Performance & Condition Monitoring Equipmen 0.25 0.25 0.10 0.10 0.10 0.80ALL SITES - UV Treatment Plants 3.40 - - 3.28 3.32 10.00KER - Kerang Replace Treated Water Pump Station 0.75 - - - - 0.75KOO - Koondrook Standpipe Storage Paint Internals 0.33 - - - - 0.33MBN Booster PS Upgrade - 0.02 0.18 - - 0.20MDA - Mildura West Ground Level Stroage Repaint 50% Internal - - - 0.50 - 0.50MDA - Mildura West WTP Upgrade to ClearSCADA 0.40 0.60 - - - 1.00MDA ME DN225 Merbein River Ave - Reily St to Charles Rd (1,56 - - 0.66 - - 0.66MDA ME DN300 Trunk Main 15th St Benetook - Sandilong (1,265 - - 0.70 - - 0.70MDA Raw Water PS Upgrade Controls - 0.15 - - - 0.15MDA Raw Water 100 kW Solar PV Pilot 0.18 - - - - 0.18MDA West WTP Replace Filter Media - - - - 0.08 0.08MDA West WTP 100 kW Solar PV Pilot 0.18 - - - - 0.18MDA WTP 7th St Upgrade Power Supply 0.70 0.70 - - - 1.40MDA WTP Filter outlet & backwashvalve replacement - 0.30 - - - 0.30MDA WTP Replace Filter Media - - 0.10 0.10 - 0.20MDA WTP 100 kW Solar PV Pilot 0.18 - - - - 0.18PIA - Replace Main from WTP to Town (Mallee Hwy) 0.30 - - - - 0.30R/C WTP Capacity Upgrade 9.5 ML/d to 12 ML/d 0.55 - - - - 0.55RC - Treated Water PS Refurbishment - - - 0.20 - 0.20RC Cliffside Storage Repaint Internals - - - - 0.45 0.45ROB - Robinvale Waster Treatment Plant Upgrade to ClearSCADA - - - 0.25 0.25 0.50LB - Lake Boga Ground Level Storage Repaint Internals - - - - 0.23 0.23LB - Lake Boga Trunk Main Replacement Stage 1 - - - 0.33 - 0.33S/H DN450 Truck Main Arnoldt/Stratbroke (1,245 m) - - 0.80 - - 0.80S/H WTP Clarifier Rehabilitation 0.10 - - - - 0.10SH North WTP 6 ML Ground Level Storage - - 3.10 - - 3.10SH - Swan Hill Raw Water Pumping Station Replace 3 No. VSDs - - - - 0.15 0.15SH - North WTP Treated Water Pump Station (Stage 1) - - 1.60 - - 1.60S/H Nyah Relift PS Replace VSDs & Scada Upgrade 0.45 - - - - 0.45SH - Swan Hill Western Storage 1 Repaint Internals - - 0.35 - - 0.35SH - Swan Hill Western Storage 2 Repaint Internals - - - - 0.35 0.35SH - Swan Hill Western Tower Repaint Internals - 0.25 - - - 0.25S/H Nyah Standpipe Repaint Externals - - 0.10 - - 0.10S/H Nyah West Replace Elevated Storage - - 0.15 - - 0.15Water TOTAL 9.41 3.93 9.28 6.43 7.00 36.05
Fourth Regulatory Period ($million 1/1/18)
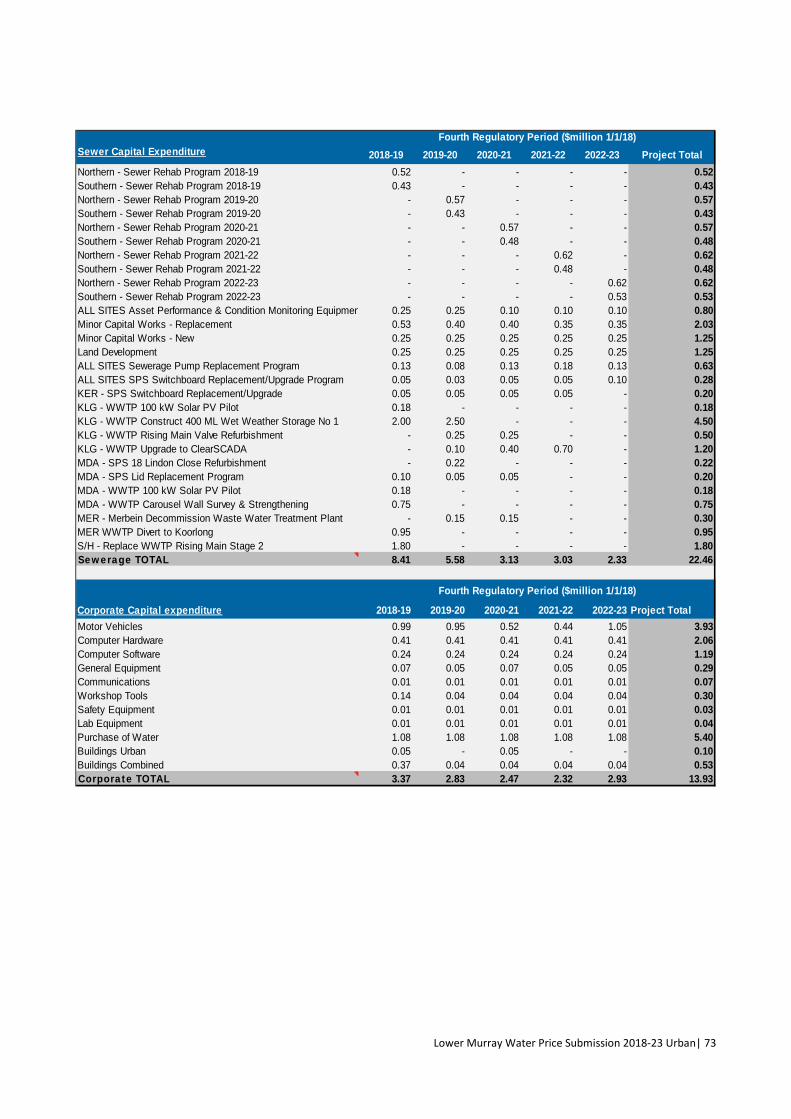
Lower Murray Water Price Submission 2018-23 Urban| 73
73
Sewer Capital Expenditure 2018-19 2019-20 2020-21 2021-22 2022-23 Project TotalNorthern - Sewer Rehab Program 2018-19 0.52 - - - - 0.52Southern - Sewer Rehab Program 2018-19 0.43 - - - - 0.43Northern - Sewer Rehab Program 2019-20 - 0.57 - - - 0.57Southern - Sewer Rehab Program 2019-20 - 0.43 - - - 0.43Northern - Sewer Rehab Program 2020-21 - - 0.57 - - 0.57Southern - Sewer Rehab Program 2020-21 - - 0.48 - - 0.48Northern - Sewer Rehab Program 2021-22 - - - 0.62 - 0.62Southern - Sewer Rehab Program 2021-22 - - - 0.48 - 0.48Northern - Sewer Rehab Program 2022-23 - - - - 0.62 0.62Southern - Sewer Rehab Program 2022-23 - - - - 0.53 0.53ALL SITES Asset Performance & Condition Monitoring Equipmen 0.25 0.25 0.10 0.10 0.10 0.80Minor Capital Works - Replacement 0.53 0.40 0.40 0.35 0.35 2.03Minor Capital Works - New 0.25 0.25 0.25 0.25 0.25 1.25Land Development 0.25 0.25 0.25 0.25 0.25 1.25ALL SITES Sewerage Pump Replacement Program 0.13 0.08 0.13 0.18 0.13 0.63ALL SITES SPS Switchboard Replacement/Upgrade Program 0.05 0.03 0.05 0.05 0.10 0.28KER - SPS Switchboard Replacement/Upgrade 0.05 0.05 0.05 0.05 - 0.20KLG - WWTP 100 kW Solar PV Pilot 0.18 - - - - 0.18KLG - WWTP Construct 400 ML Wet Weather Storage No 1 2.00 2.50 - - - 4.50KLG - WWTP Rising Main Valve Refurbishment - 0.25 0.25 - - 0.50KLG - WWTP Upgrade to ClearSCADA - 0.10 0.40 0.70 - 1.20MDA - SPS 18 Lindon Close Refurbishment - 0.22 - - - 0.22MDA - SPS Lid Replacement Program 0.10 0.05 0.05 - - 0.20MDA - WWTP 100 kW Solar PV Pilot 0.18 - - - - 0.18MDA - WWTP Carousel Wall Survey & Strengthening 0.75 - - - - 0.75MER - Merbein Decommission Waste Water Treatment Plant - 0.15 0.15 - - 0.30MER WWTP Divert to Koorlong 0.95 - - - - 0.95S/H - Replace WWTP Rising Main Stage 2 1.80 - - - - 1.80Sewerage TOTAL 8.41 5.58 3.13 3.03 2.33 22.46
Corporate Capital expenditure 2018-19 2019-20 2020-21 2021-22 2022-23 Project TotalMotor Vehicles 0.99 0.95 0.52 0.44 1.05 3.93Computer Hardware 0.41 0.41 0.41 0.41 0.41 2.06Computer Software 0.24 0.24 0.24 0.24 0.24 1.19General Equipment 0.07 0.05 0.07 0.05 0.05 0.29Communications 0.01 0.01 0.01 0.01 0.01 0.07Workshop Tools 0.14 0.04 0.04 0.04 0.04 0.30Safety Equipment 0.01 0.01 0.01 0.01 0.01 0.03Lab Equipment 0.01 0.01 0.01 0.01 0.01 0.04Purchase of Water 1.08 1.08 1.08 1.08 1.08 5.40Buildings Urban 0.05 - 0.05 - - 0.10Buildings Combined 0.37 0.04 0.04 0.04 0.04 0.53Corporate TOTAL 3.37 2.83 2.47 2.32 2.93 13.93
Fourth Regulatory Period ($million 1/1/18)
Fourth Regulatory Period ($million 1/1/18)

Lower Murray Water Price Submission 2018-23 Urban| 74
74
Appendix C Major Project Summaries
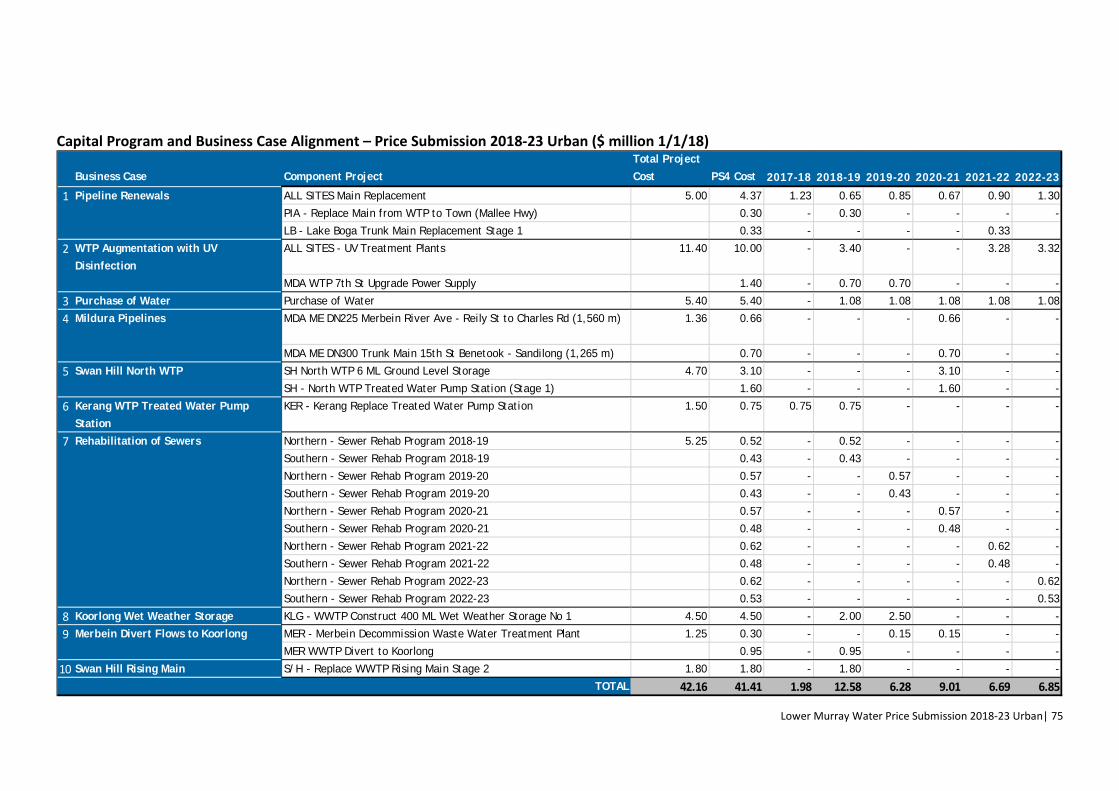
Lower Murray Water Price Submission 2018-23 Urban| 75
75
Capital Program and Business Case Alignment – Price Submission 2018-23 Urban ($ million 1/1/18)
Business Case Component ProjectTotal Project Cost PS4 Cost 2017-18 2018-19 2019-20 2020-21 2021-22 2022-23
1 Pipeline Renewals ALL SITES Main Replacement 5.00 4.37 1.23 0.65 0.85 0.67 0.90 1.30
PIA - Replace Main from WTP to Town (Mallee Hwy) 0.30 - 0.30 - - - -
LB - Lake Boga Trunk Main Replacement Stage 1 0.33 - - - - 0.33
2 WTP Augmentation with UV Disinfection
ALL SITES - UV Treatment Plants 11.40 10.00 - 3.40 - - 3.28 3.32
MDA WTP 7th St Upgrade Power Supply 1.40 - 0.70 0.70 - - -
3 Purchase of Water Purchase of Water 5.40 5.40 - 1.08 1.08 1.08 1.08 1.08
4 Mildura Pipelines MDA ME DN225 Merbein River Ave - Reily St to Charles Rd (1,560 m) 1.36 0.66 - - - 0.66 - -
MDA ME DN300 Trunk Main 15th St Benetook - Sandilong (1,265 m) 0.70 - - - 0.70 - -
5 Swan Hill North WTP SH North WTP 6 ML Ground Level Storage 4.70 3.10 - - - 3.10 - -
SH - North WTP Treated Water Pump Station (Stage 1) 1.60 - - - 1.60 - -
6 Kerang WTP Treated Water Pump Station
KER - Kerang Replace Treated Water Pump Station 1.50 0.75 0.75 0.75 - - - -
7 Rehabilitation of Sewers Northern - Sewer Rehab Program 2018-19 5.25 0.52 - 0.52 - - - -
Southern - Sewer Rehab Program 2018-19 0.43 - 0.43 - - - -
Northern - Sewer Rehab Program 2019-20 0.57 - - 0.57 - - -
Southern - Sewer Rehab Program 2019-20 0.43 - - 0.43 - - -
Northern - Sewer Rehab Program 2020-21 0.57 - - - 0.57 - -
Southern - Sewer Rehab Program 2020-21 0.48 - - - 0.48 - -
Northern - Sewer Rehab Program 2021-22 0.62 - - - - 0.62 -
Southern - Sewer Rehab Program 2021-22 0.48 - - - - 0.48 -
Northern - Sewer Rehab Program 2022-23 0.62 - - - - - 0.62
Southern - Sewer Rehab Program 2022-23 0.53 - - - - - 0.53
8 Koorlong Wet Weather Storage KLG - WWTP Construct 400 ML Wet Weather Storage No 1 4.50 4.50 - 2.00 2.50 - - -
9 Merbein Divert Flows to Koorlong MER - Merbein Decommission Waste Water Treatment Plant 1.25 0.30 - - 0.15 0.15 - -
MER WWTP Divert to Koorlong 0.95 - 0.95 - - - -
10 Swan Hill Rising Main S/H - Replace WWTP Rising Main Stage 2 1.80 1.80 - 1.80 - - - -
TOTAL 42.16 41.41 1.98 12.58 6.28 9.01 6.69 6.85
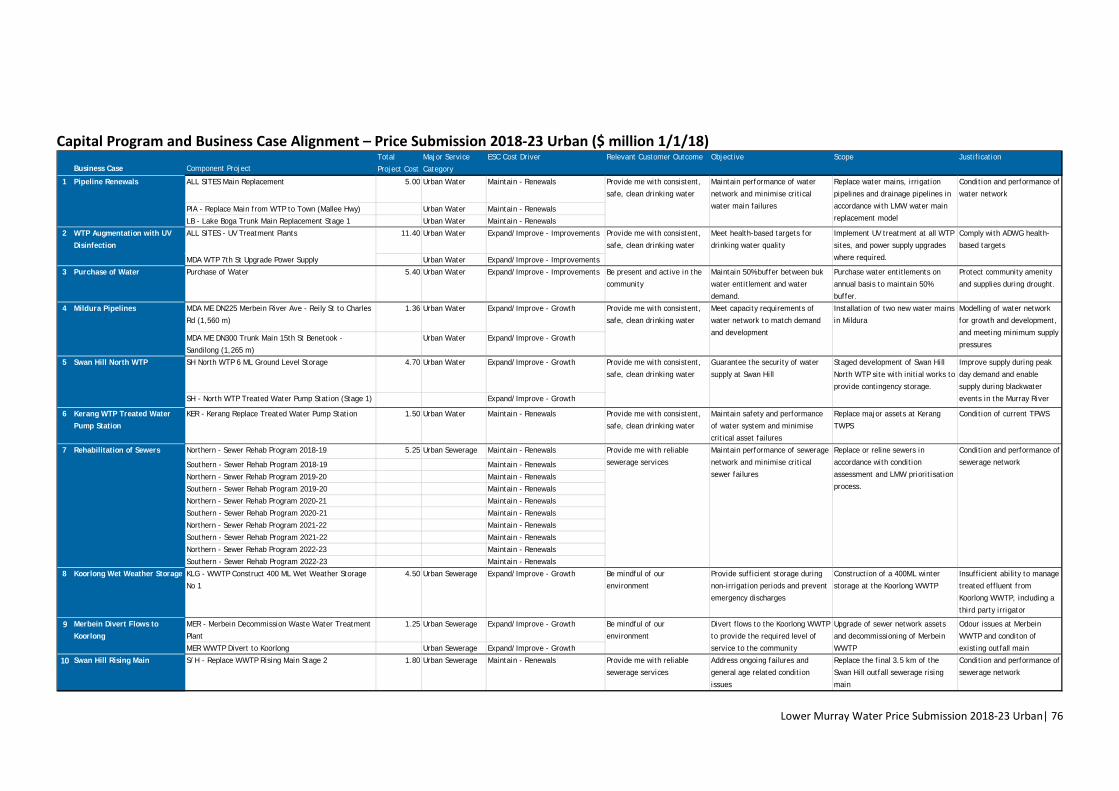
Lower Murray Water Price Submission 2018-23 Urban| 76
76
Capital Program and Business Case Alignment – Price Submission 2018-23 Urban ($ million 1/1/18)
Business Case Component ProjectTotal
Project Cost
Major Service
Category
ESC Cost Driver Relevant Customer Outcome Objective Scope Justification
1 Pipeline Renewals ALL SITES Main Replacement 5.00 Urban Water Maintain - Renewals
PIA - Replace Main from WTP to Town (Mallee Hwy) Urban Water Maintain - Renewals
LB - Lake Boga Trunk Main Replacement Stage 1 Urban Water Maintain - Renewals
2 WTP Augmentation with UV Disinfection
ALL SITES - UV Treatment Plants 11.40 Urban Water Expand/Improve - Improvements
MDA WTP 7th St Upgrade Power Supply Urban Water Expand/Improve - Improvements
3 Purchase of Water Purchase of Water 5.40 Urban Water Expand/Improve - Improvements Be present and active in the
community
Maintain 50% buffer between buk
water entitlement and water
demand.
Purchase water entitlements on
annual basis to maintain 50%
buffer.
Protect community amenity
and supplies during drought.
4 Mildura Pipelines MDA ME DN225 Merbein River Ave - Reily St to Charles
Rd (1,560 m)
1.36 Urban Water Expand/Improve - Growth
MDA ME DN300 Trunk Main 15th St Benetook -
Sandilong (1,265 m)
Urban Water Expand/Improve - Growth
5 Swan Hill North WTP SH North WTP 6 ML Ground Level Storage 4.70 Urban Water Expand/Improve - Growth
SH - North WTP Treated Water Pump Station (Stage 1) Expand/Improve - Growth
6 Kerang WTP Treated Water Pump Station
KER - Kerang Replace Treated Water Pump Station 1.50 Urban Water Maintain - Renewals Provide me with consistent,
safe, clean drinking water
Maintain safety and performance
of water system and minimise
critical asset failures
Replace major assets at Kerang
TWPS
Condition of current TPWS
7 Rehabilitation of Sewers Northern - Sewer Rehab Program 2018-19 5.25 Urban Sewerage Maintain - Renewals
Southern - Sewer Rehab Program 2018-19 Maintain - Renewals
Northern - Sewer Rehab Program 2019-20 Maintain - Renewals
Southern - Sewer Rehab Program 2019-20 Maintain - Renewals
Northern - Sewer Rehab Program 2020-21 Maintain - Renewals
Southern - Sewer Rehab Program 2020-21 Maintain - Renewals
Northern - Sewer Rehab Program 2021-22 Maintain - Renewals
Southern - Sewer Rehab Program 2021-22 Maintain - Renewals
Northern - Sewer Rehab Program 2022-23 Maintain - Renewals
Southern - Sewer Rehab Program 2022-23 Maintain - Renewals
8 Koorlong Wet Weather Storage KLG - WWTP Construct 400 ML Wet Weather Storage
No 1
4.50 Urban Sewerage Expand/Improve - Growth Be mindful of our
environment
Provide sufficient storage during
non-irrigation periods and prevent
emergency discharges
Construction of a 400ML winter
storage at the Koorlong WWTP
Insufficient ability to manage
treated effluent from
Koorlong WWTP, including a
third party irrigator
9 Merbein Divert Flows to Koorlong
MER - Merbein Decommission Waste Water Treatment
Plant
1.25 Urban Sewerage Expand/Improve - Growth
MER WWTP Divert to Koorlong Urban Sewerage Expand/Improve - Growth
10 Swan Hill Rising Main S/H - Replace WWTP Rising Main Stage 2 1.80 Urban Sewerage Maintain - Renewals Provide me with reliable
sewerage services
Address ongoing failures and
general age related condition
issues
Replace the final 3.5 km of the
Swan Hill outfall sewerage rising
main
Condition and performance of
sewerage network
Provide me with consistent,
safe, clean drinking water
Guarantee the security of water
supply at Swan Hill
Staged development of Swan Hill
North WTP site with initial works to
provide contingency storage.
Improve supply during peak
day demand and enable
supply during blackwater
events in the Murray River
Be mindful of our
environment
Divert flows to the Koorlong WWTP
to provide the required level of
service to the community
Upgrade of sewer network assets
and decommissioning of Merbein
WWTP
Odour issues at Merbein
WWTP and conditon of
existing outfall main
Implement UV treatment at all WTP
sites, and power supply upgrades
where required.
Comply with ADWG health-
based targets
Provide me with consistent,
safe, clean drinking water
Meet capacity requirements of
water network to match demand
and development
Installation of two new water mains
in Mildura
Modelling of water network
for growth and development,
and meeting minimum supply
pressures
Provide me with reliable
sewerage services
Maintain performance of sewerage
network and minimise critical
sewer failures
Replace or reline sewers in
accordance with condition
assessment and LMW prioritisation
process.
Condition and performance of
sewerage network
Provide me with consistent,
safe, clean drinking water
Maintain performance of water
network and minimise critical
water main failures
Replace water mains, irrigation
pipelines and drainage pipelines in
accordance with LMW water main
replacement model
Condition and performance of
water network
Provide me with consistent,
safe, clean drinking water
Meet health-based targets for
drinking water quality

Lower Murray Water Price Submission 2018-23 Urban| 77
77
Appendix D Miscellaneous Charges
MISCELLANEOUS CHARGES
Tariff and Price Component 1/1/18 Unit 2018/19 2019/20 2020/21 2021/22 2022/23
Trade WasteMiscellaneous Minor Trade Waste Flow Charge kL 0.8583 0.8583 0.8583 0.8583 0.8583 Septic Tank Effluent Disposal kL 6.09 6.09 6.09 6.09 6.09 Wimmera Mallee Pipeline (Back wash water discharging) kL 0.8457 0.8457 0.8457 0.8457 0.8457 Trade Waste Establishment Fees ML 4,296.07 4,296.07 4,296.07 4,296.07 4,296.07 Maintenance Fee ML 130.82 130.82 130.82 130.82 130.82
Provision of Services - UrbanSubdivision Processing Fee - Water/Sewerage Lot 18.49 18.49 18.49 18.49 18.49 Subdivision Processing Fee – Overall Lot 38.95 38.95 38.95 38.95 38.95
Day Labour Construction - WaterDesign & Supervision Lodgement Fee* or ha 1,500.00 1,500.00 1,500.00 1,500.00 1,500.00 10% of preliminary estimate if LMW considers that a closer approximation can be achievedDesign & Supervision Fee Cust 10% of Cost 10% of Cost 10% of Cost 10% of Cost 10% of CostSecurity Amount (Refundable if criteria meet) Cust 10% of Estimated Cost 10% of Estimated Cost 10% of Estimated Cost 10% of Estimated Cost 10% of Estimated Cost
Day Labour Construction - WastewaterDesign & Supervision Lodgement Fee (adjusted to 10% of final cost of works - non refundable if works do not proceed) Lower Limit ha 1,500.00 1,500.00 1,500.00 1,500.00 1,500.00 Design & Supervision Lodgement Fee (adjusted to 10% of final cost of works - non refundable if works do not proceed) Upper Limit ha 4,000.00 4,000.00 4,000.00 4,000.00 4,000.00 Design & Supervision Fee Cust 10% of actual cost 10% of actual cost 10% of actual cost 10% of actual cost 10% of actual costSecurity Amount (Refundable if criteria meet) Cust 10% of Estimated actual cost 10% of Estimated actual cost 10% of Estimated actual cost 10% of Estimated actual cost 10% of Estimated actual cost
Works by Contract Construction - WaterDesign & Supervision Lodgement Fee ha 1,500.00 1,500.00 1,500.00 1,500.00 1,500.00 Design & Supervision Fee Cust 10% of actual cost 10% of actual cost 10% of actual cost 10% of actual cost 10% of actual costContract Administration Lodgement Fee ha 500.00 500.00 500.00 500.00 500.00 Contract Administration Fee Cust 3.5% of actual cost 3.5% of actual cost 3.5% of actual cost 3.5% of actual cost 3.5% of actual costDetailed Supervision Lodgement Fee ha 400.00 400.00 400.00 400.00 400.00 Detailed Supervision Fee Cust 2.5% of actual cost 2.5% of actual cost 2.5% of actual cost 2.5% of actual cost 2.5% of actual cost
Works by Contract Construction - WastewaterDesign & Supervision Lodgement Fee ha 1,500.00 1,500.00 1,500.00 1,500.00 1,500.00 Design & Supervision Fee Cust 10% of actual cost 10% of actual cost 10% of actual cost 10% of actual cost 10% of actual costContract Administration Lodgement Fee ha 1,000.00 1,000.00 1,000.00 1,000.00 1,000.00 Contract Administration Fee Cust 3.5% of actual cost 3.5% of actual cost 3.5% of actual cost 3.5% of actual cost 3.5% of actual costDetailed Supervision Lodgement Fee ha 750.00 750.00 750.00 750.00 750.00 Detailed Supervision Fee Cust 2.5% of actual cost 2.5% of actual cost 2.5% of actual cost 2.5% of actual cost 2.5% of actual cost
Developer Design & Construct - WaterInitial Fee Cust 2% of Estimated actual cost 2% of Estimated actual cost 2% of Estimated actual cost 2% of Estimated actual cost 2% of Estimated actual costAdministrative/Review Charge Cust 4% of Estimated actual cost 4% of Estimated actual cost 4% of Estimated actual cost 4% of Estimated actual cost 4% of Estimated actual costDeveloper Processing and Investigation Fee Cust 350.00 350.00 350.00 350.00 350.00 Maintenance Security (Refundable if criteria meet) Cust 5% of Estimated actual cost 5% of Estimated actual cost 5% of Estimated actual cost 5% of Estimated actual cost 5% of Estimated actual cost
Developer Design & Construct - WastewaterInitial Fee Cust 2% of Estimated actual cost 2% of Estimated actual cost 2% of Estimated actual cost 2% of Estimated actual cost 2% of Estimated actual costAdministrative/Review Charge Cust 4% of Estimated actual cost 4% of Estimated actual cost 4% of Estimated actual cost 4% of Estimated actual cost 4% of Estimated actual costDeveloper Processing and Investigation Fee Cust 350.00 350.00 350.00 350.00 350.00 Maintenance Security (Refundable if criteria meet) Cust 5% of Estimated actual cost 5% of Estimated actual cost 5% of Estimated actual cost 5% of Estimated actual cost 5% of Estimated actual cost
Property ServicesSanitary Drainage Plans and/or Block Plans Supplied to Plumber 39.27 39.27 39.27 39.27 39.27 Supplied to someone other than a Plumber Plan 39.27 39.27 39.27 39.27 39.27 Shut Off Fee Cust 104.73 104.73 104.73 104.73 104.73 Plug Off Cust 196.29 196.29 196.29 196.29 196.29 Tappings 20 mm Meter Tapping 392.83 392.83 392.83 392.83 392.83 Tappings 25 mm Meter Tapping 589.27 589.27 589.27 589.27 589.27 Tappings 32 mm Meter Tapping 1,047.55 1,047.55 1,047.55 1,047.55 1,047.55 Tappings 40 mm Meter Tapping 1,178.53 1,178.53 1,178.53 1,178.53 1,178.53 Tappings 50 mm Meter Tapping 1,505.89 1,505.89 1,505.89 1,505.89 1,505.89 Inspection Fee (additional to tapping fee) Inspection 65.46 65.46 65.46 65.46 65.46 Tappings over 50 mm Tapping Actual Cost Actual Cost Actual Cost Actual Cost Actual CostRelocation Fee 20 mm Service Relocation 392.83 392.83 392.83 392.83 392.83 Restrictors Restrictor 19.81 19.81 19.81 19.81 19.81 Meter Price 20 mm Meter 75.47 75.47 75.47 75.47 75.47 Meter Price 25 mm Meter 161.41 161.41 161.41 161.41 161.41 Meter Price 32 mm Meter 340.95 340.95 340.95 340.95 340.95 Meter Price 40 mm Meter 453.90 453.90 453.90 453.90 453.90 Meter Price 50 mm Meter Actual Cost Actual Cost Actual Cost Actual Cost Actual CostMeter Price 80 mm Meter Actual Cost Actual Cost Actual Cost Actual Cost Actual CostMeter Price 100 mm Meter Actual Cost Actual Cost Actual Cost Actual Cost Actual CostMeter Price 20 mm Remote Meter - Radio Component Only Meter 150.99 150.99 150.99 150.99 150.99 Cost of 20 mm Meter for tenement Meter 75.47 75.47 75.47 75.47 75.47 Test Fee Test 91.35 91.35 91.35 91.35 91.35 Special Meter Read Read 45.65 45.65 45.65 45.65 45.65 New Connection Standard Residential Connection 144.00 144.00 144.00 144.00 144.00 New Connection Non Standard Residential Connection 196.39 196.39 196.39 196.39 196.39 New Connection Small Industrial/Commercial Connection 196.39 196.39 196.39 196.39 196.39 New Connection Large Industrial/Commercial Connection 392.83 392.83 392.83 392.83 392.83 As Constructed lodged by Plumber Cust 39.27 39.27 39.27 39.27 39.27 Alteration to as constructed plan Cust 39.27 39.27 39.27 39.27 39.27 Septic Tank Inside Sewerage District Cust 130.93 130.93 130.93 130.93 130.93 Alteration or Extension to Domestic/Com/Ind Cust 130.93 130.93 130.93 130.93 130.93 Backflow Prevention Annual Fee for Agreement Renewal pa 52.34 52.34 52.34 52.34 52.34 Backflow Prevention Device - Application Assessment Fee App 157.07 157.07 157.07 157.07 157.07 Building Over Agreement Cust 183.32 183.32 183.32 183.32 183.32
FOURTH REGULATORY PERIOD

Lower Murray Water Price Submission 2018-23 Urban| 78
78
MISCELLANEOUS CHARGES
Tariff and Price Component 1/1/18 Unit 2018/19 2019/20 2020/21 2021/22 2022/23
Fire ServicesFire Service Tapping 25 mm 100 Dia AC Pipe Cust 310.46 310.46 310.46 310.46 310.46 Fire Service Tapping 32 mm 100 Dia AC Pipe Cust 407.48 407.48 407.48 407.48 407.48 Fire Service Tapping 40 mm 100 Dia AC Pipe Cust 467.74 467.74 467.74 467.74 467.74 Fire Service Tapping 50 mm 100 Dia AC Pipe Cust 752.67 752.67 752.67 752.67 752.67 Fire Service Tapping 80 mm 100 Dia AC Pipe Cust 1,400.14 1,400.14 1,400.14 1,400.14 1,400.14 Fire Service Tapping 100 mm 100 Dia AC Pipe Cust 1,448.14 1,448.14 1,448.14 1,448.14 1,448.14 Fire Service Tapping 25 mm 150 Dia AC Pipe Cust 316.59 316.59 316.59 316.59 316.59 Fire Service Tapping 32 mm 150 Dia AC Pipe Cust 418.72 418.72 418.72 418.72 418.72 Fire Service Tapping 40 mm 150 Dia AC Pipe Cust 471.82 471.82 471.82 471.82 471.82 Fire Service Tapping 50 mm 150 Dia AC Pipe Cust 765.94 765.94 765.94 765.94 765.94 Fire Service Tapping 80 mm 150 Dia AC Pipe Cust 1,557.42 1,557.42 1,557.42 1,557.42 1,557.42 Fire Service Tapping 100 mm 150 Dia AC Pipe Cust 1,600.31 1,600.31 1,600.31 1,600.31 1,600.31 Fire Service Tapping 25 mm 100 Dia UPVC Pipe Cust 310.46 310.46 310.46 310.46 310.46 Fire Service Tapping 32 mm 100 Dia UPVC Pipe Cust 407.48 407.48 407.48 407.48 407.48 Fire Service Tapping 40 mm 100 Dia UPVC Pipe Cust 467.74 467.74 467.74 467.74 467.74 Fire Service Tapping 50 mm 100 Dia UPVC Pipe Cust 752.67 752.67 752.67 752.67 752.67 Fire Service Tapping 80 mm 100 Dia UPVC Pipe Cust 1,514.52 1,514.52 1,514.52 1,514.52 1,514.52 Fire Service Tapping 100 mm 100 Dia UPVC Pipe Cust 1,569.67 1,569.67 1,569.67 1,569.67 1,569.67 Fire Service Tapping 25 mm 150 Dia UPVC Pipe Cust 316.59 316.59 316.59 316.59 316.59 Fire Service Tapping 32 mm 150 Dia UPVC Pipe Cust 418.72 418.72 418.72 418.72 418.72 Fire Service Tapping 40 mm 150 Dia UPVC Pipe Cust 471.82 471.82 471.82 471.82 471.82 Fire Service Tapping 50 mm 150 Dia UPVC Pipe Cust 765.94 765.94 765.94 765.94 765.94 Fire Service Tapping 80 mm 150 Dia UPVC Pipe Cust 1,557.42 1,557.42 1,557.42 1,557.42 1,557.42 Fire Service Tapping 100 mm 150 Dia UPVC Pipe Cust 1,594.18 1,594.18 1,594.18 1,594.18 1,594.18 Fire Service Tapping Inspection Fee Cust 65.46 65.46 65.46 65.46 65.46 Fire Service Information Fee Cust 276.25 276.25 276.25 276.25 276.25 Fire Service Illegal Use Re-Sealing Fee 1st Reseal Cust 112.95 112.95 112.95 112.95 112.95 Fire Service Illegal Use Re-Sealing Fee 2nd Reseal Cust 169.43 169.43 169.43 169.43 169.43 Fire Service Illegal Use Re-Sealing Fee 3rd Reseal Cust 225.29 225.29 225.29 225.29 225.29 Fire Service Illegal Use Re-Sealing Fee 4th Reseal Cust 338.96 338.96 338.96 338.96 338.96 Fire Service Illegal Use Re-Sealing Fee 5th & Sub Reseal Cust 564.76 564.76 564.76 564.76 564.76
Portable Metered HydrantsCasual Use 25 mm Hydrant Administration Charge Cust 50.00 50.00 50.00 50.00 50.00 Casual Use 25 mm Hydrant Deposit Cust 50.00 50.00 50.00 50.00 50.00 Casual Use 25 mm Hydrant Daily Charge Per day 5.00 5.00 5.00 5.00 5.00 Casual Use 25 mm Hydrant Volume Charge kL 0.7586 0.7677 0.7768 0.7861 0.7956
Casual Use 50 mm Hydrant Administration Charge Cust 50.00 50.00 50.00 50.00 50.00 Casual Use 50 mm Hydrant Deposit Cust 100.00 100.00 100.00 100.00 100.00 Casual Use 50 mm Hydrant Daily Charge Per day 7.00 7.00 7.00 7.00 7.00 Casual Use 50 mm Hydrant Volume Charge kL 0.7586 0.7677 0.7768 0.7861 0.7956
Permanent Use 25 mm Hydrant Establishment Charge Cust 454.00 454.00 454.00 454.00 454.00 Permanent Use 25 mm Hydrant Yearly Charge Per year 172.00 172.00 172.00 172.00 172.00 Permanent Use 25 mm Hydrant Volume Charge kL 0.7586 0.7677 0.7768 0.7861 0.7956
Permanent Use 50 mm Hydrant Establishment Charge Cust 1,500.00 1,500.00 1,500.00 1,500.00 1,500.00 Permanent Use 50 mm Hydrant Yearly Charge Per year 688.00 688.00 688.00 688.00 688.00 Permanent Use 50 mm Hydrant Volume Charge kL 0.7586 0.7677 0.7768 0.7861 0.7956
Standpipe ChargesTruck Tanker Load Load 11.23 11.23 11.23 11.23 11.23 Spray Vat or Equivalent Load 5.51 5.51 5.51 5.51 5.51
Service Availability ChargesUnmetered Property Charge Property 2,000.00 2,000.00 2,000.00 2,000.00 2,000.00 Fire Service Availability Charge Cust 180.56 180.56 180.56 180.56 180.56
Information Statement FeeInformation Statement Fee Statement 90.38 90.38 90.38 90.38 90.38 (Includes one (1) meter reading)
New Customer ContributionsWater - All Districts - Lot < 750 sqm Lot 1,872.00 1,872.00 1,872.00 1,872.00 1,872.00 Water - All Districts - Lot > 750 sqm Lot 3,744.00 3,744.00 3,744.00 3,744.00 3,744.00 Sewer - All Districts - Lot < 750 sqm Lot 1,280.00 1,280.00 1,280.00 1,280.00 1,280.00 Sewer - All Districts - Lot > 750 sqm Lot 2,561.00 2,561.00 2,561.00 2,561.00 2,561.00
Other ChargesFinal Notice Fee Notice 6.03 6.03 6.03 6.03 6.03 Merchant Fee (for payments over $1,000) Cust Actual Cost Actual Cost Actual Cost Actual Cost Actual CostHireworks Cust Actual Cost Actual Cost Actual Cost Actual Cost Actual CostTender Document Charge Tender 133.27 133.27 133.27 133.27 133.27 Debt collection fees passed on to customers Cust Actual Cost Actual Cost Actual Cost Actual Cost Actual CostDishonoured Cheque Fees Cust Actual Cost Actual Cost Actual Cost Actual Cost Actual CostFire Plug Maintenance Cust Actual Cost Actual Cost Actual Cost Actual Cost Actual CostWater taken through a check meter kL 1.60 1.60 1.60 1.60 1.60 Wakool Meter Reading (GST excl) pa 1,333.46 1,333.46 1,333.46 1,333.46 1,333.46
NON PRESCRIBED CHARGESProperty Services (Non Prescribed)Measure & Draw (GST excl) Cust 90.38 90.38 90.38 90.38 90.38
Mulch (Non Prescribed)Mulch per m3 38.96 38.96 38.96 38.96 38.96 Mulch Delivery Fee within boundary Per Load 19.71 19.71 19.71 19.71 19.71 Mulch Delivery Fee outside boundary Per Load 26.25 26.25 26.25 26.25 26.25
Antenna Site Charges (Non Prescribed)
Access for Intermittent Use (GST excl) per antenna 324.35 324.35 324.35 324.35 324.35 Volunteer & Community Organisations (GST excl) per antenna 683.17 683.17 683.17 683.17 683.17 Organisations receiving at least some State Gvt Fund (GST excl) per antenna 716.51 716.51 716.51 716.51 716.51 Commercial Organisation (GST excl) per antenna 2,050.53 2,050.53 2,050.53 2,050.53 2,050.53
FOURTH REGULATORY PERIOD

Lower Murray Water Price Submission 2018-23 Urban| 79
79