2017 national preparedness report - fema.govand territories in their 2016 state preparedness report...
TRANSCRIPT
44
MitigationMission Area Overview
Focused on reducing loss of life and property by lessening the impact of disasters through increasing risk awareness and leveraging mitigation products, services, and assets
Core Capabilities in the Mitigation Mission Area
� Community Resilience
� Long-term Vulnerability Reduction
� Operational Coordination
� Planning
� Public Information and Warning
� Risk and Disaster Resilience Assessment
� Threats and Hazards Identification
Core Capabilities in PracticeThe National Mitigation Framework (“Mitigation Framework”) describes seven core capabilities, including how they interact to reduce loss of life and property and increase community resilience.
To effectively mitigate risks, a community begins with Threats and Hazards Identification, which includes understanding their frequency and magnitude. Next, Risk and Disaster Resilience Assessments help communities understand the consequences that these threats and hazards would have if they occurred. Based on this knowledge, community officials can begin Planning efforts to manage the risk, as well as provide Public Information and Warnings to residents. Once implemented, these plans enable Long-term Vulnerability Reduction to disasters through one or more of the following strategies:
▪ Risk avoidance – Preventing exposure to an event (e.g., using zoning rules to prevent home construction in high-risk areas)
▪ Risk reduction – Minimizing vulnerabilities (e.g., retrofitting buildings to be more resistant to earthquakes)
▪ Risk transfer – Eliminating or limiting liability for harm, without reducing vulnerability (e.g., purchasing insurance)
Since a community can rarely avoid risks completely, the Mitigation Framework encourages leadership, collaboration, partnership building, education, and skill building before an event through Community Resilience, with the goal of supporting other capabilities and building resilience. The Mitigation Framework also encourages communities to build and sustain capability in Operational Coordination in order to integrate critical stakeholders to support efforts during and after an incident.
The following are examples of actions taken in 2016 to improve preparedness that highlight the relationship among select core capabilities in the Mitigation Framework.
Community Resilience and Long-term Vulnerability ReductionMore than 1,100 community members from three towns in Massachusetts and two in New Hampshire started a project to restore native sand dunes. Sand dunes are a natural barrier to coastal winds, flooding, and erosion. Another benefit of this project, spearheaded by the University of New Hampshire, has been the establishment of a beachgrass community garden in Hampton, New Hampshire. The garden provides coastal homeowners in Hampton with free plants that they can transplant to their properties to protect against coastal storms.
Risk and Disaster Resilience Assessment and Community ResilienceThe Rhode Island Division of Planning partnered with the Environmental Protection Agency (EPA) to create a framework to help communities assess their economic vulnerability to extreme weather events and improve their economic resilience. The framework is flexible and easy to use. Communities of varying size and resources can use

45
it to identify threats from extreme weather events and assess the economic impacts. The framework also helps the business community develop creative solutions to enhance their resilience. One community in Rhode Island, North Kingstown, has already pilot-tested and provided refinements to the framework.
Planning and Long-term Vulnerability Reduction St. Tammany Parish, Louisiana, adopted an ordinance to address risks from storm surges. Floodwaters from heavy rains frequently trap residents and prevent emergency vehicle access. To address this vulnerability, parish officials approved an ordinance requiring roads constructed in new developments to be a minimum of six feet above sea level. Officials based the higher elevation on historical surge data and carefully weighed the benefits and costs to the environment and businesses. They determined that adopting the higher elevation requirement will reduce long-term maintenance costs in new coastal subdivisions and improve emergency response capabilities.
Risk and Disaster Resilience Assessment and Threats and Hazards Identification NOAA, the U.S. Geological Survey (USGS), and other Federal partners supported a project in California’s Sonoma and Mendocino Counties to develop a flood mapping and information tool, “Our Coast, Our Future.” The tool enables local decision-makers to identify, understand, and visualize anticipated vulnerabilities resulting from sea level rise and coastal storms (such as increased flooding, shoreline erosion, and degraded salmon habitats). The interactive map feature allows users to view wave heights and flood potentials in their geographic area.
Summary of ProgressThe Mitigation mission area continues to show progress in meeting the challenges posed by increasingly severe natural hazards. Scientific research and data collection, enhanced by advancements in technology, have improved the Nation’s ability to understand natural hazards and to avoid, reduce, and transfer the risks they pose. In 2016, states and territories reported the second-highest overall proficiency ratings for capabilities in the Mitigation mission area, and since 2012, they have reported a greater increase in proficiency for Mitigation core capabilities than those in any other mission area. However, 2016 is the first year that states and territories reported lower State Preparedness Report proficiency ratings in Mitigation than the previous year.
The key findings in this section explain how the Nation is building upon its Mitigation capabilities to address specific hazards. The persistence of drought conditions in the West, the rise of human-induced earthquakes in the central United States, and the nationwide threat of flooding have tested the Threats and Hazards Identification and Risk and Disaster Resilience Assessment core capabilities. Innovations in both of these capabilities, such as development of water forecast tools and flood maps, have helped refine estimates of the risks these natural hazards pose, as well as enhance early warning systems and inform mitigation efforts. However, the number of states and territories that consider themselves proficient in Threats and Hazards Identification has decreased more than any other core capability since 2015. Risk and Disaster Resilience Assessment is the only Mitigation core capability in which states and territories reported increased proficiency ratings since 2015.
Of the Mitigation core capabilities, Community Resilience has shown the most improvement since 2012, with the number of states and territories rating themselves proficient increasing by eight percent. Tribal communities and localities have taken Community Resilience into their own hands by either initiating their own risk-reduction projects or, in the case of some tribal communities, avoiding risks altogether by physically relocating. In addition, 81 percent of states and territories consider addressing Community Resilience capability gaps their own responsibility rather than the Federal Government’s. This is the fourth-highest percentage of any core capability.
The Federal Government’s efforts to encourage the adoption of more resilient building codes and to improve the efficacy of the NFIP, in addition to the formation of public-private partnerships to supplement funding for wildfire mitigation projects, have all contributed to Long-term Vulnerability Reduction. Despite these efforts, Long-term Vulnerability Reduction is the only Mitigation core capability with a lower than average proficiency rating (see Figure 9).
Mitigation
46
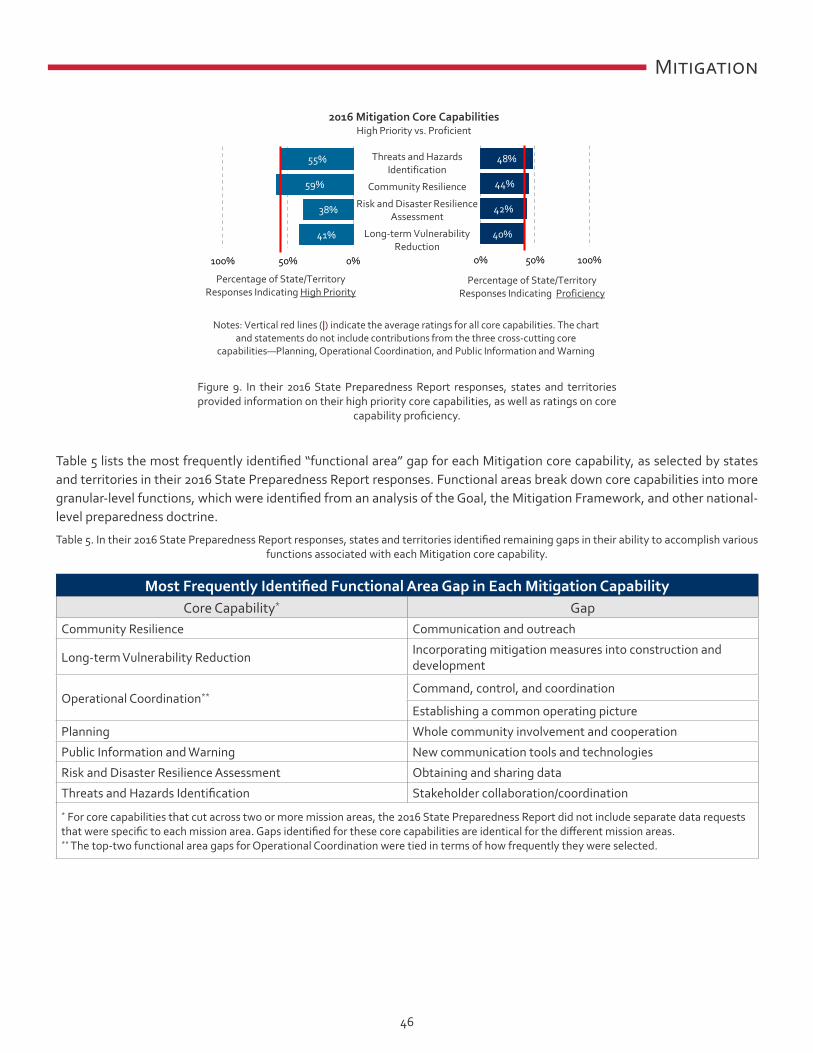
41%
38%
59%
55%
0%50%100%
40%
42%
44%
48%
0% 50% 100%
Threats and Hazards Identification
Community Resilience
Risk and Disaster Resilience Assessment
Long-term Vulnerability Reduction
Notes: Vertical red lines (|) indicate the average ratings for all core capabilities. The chart and statements do not include contributions from the three cross-cutting core
capabilities—Planning, Operational Coordination, and Public Information and Warning
Percentage of State/Territory Responses Indicating High Priority
Percentage of State/Territory Responses Indicating Proficiency
2016 Mitigation Core CapabilitiesHigh Priority vs. Proficient
Figure 9. In their 2016 State Preparedness Report responses, states and territories provided information on their high priority core capabilities, as well as ratings on core
capability proficiency.
Table 5 lists the most frequently identified “functional area” gap for each Mitigation core capability, as selected by states and territories in their 2016 State Preparedness Report responses. Functional areas break down core capabilities into more granular-level functions, which were identified from an analysis of the Goal, the Mitigation Framework, and other national-level preparedness doctrine.
Table 5. In their 2016 State Preparedness Report responses, states and territories identified remaining gaps in their ability to accomplish various functions associated with each Mitigation core capability.
Most Frequently Identified Functional Area Gap in Each Mitigation CapabilityCore Capability* Gap
Community Resilience Communication and outreach
Long-term Vulnerability ReductionIncorporating mitigation measures into construction and development
Operational Coordination**Command, control, and coordination
Establishing a common operating picture
Planning Whole community involvement and cooperation
Public Information and Warning New communication tools and technologies
Risk and Disaster Resilience Assessment Obtaining and sharing data
Threats and Hazards Identification Stakeholder collaboration/coordination* For core capabilities that cut across two or more mission areas, the 2016 State Preparedness Report did not include separate data requests that were specific to each mission area. Gaps identified for these core capabilities are identical for the different mission areas.** The top-two functional area gaps for Operational Coordination were tied in terms of how frequently they were selected.
Mitigation

47
By the NumbersA new study found that $4.80 in losses was avoided for every $1 spent on certain mitigation activitiesA 2016 study by the University of Pennsylvania Wharton School found that every $1 spent on new construction under the Florida Building Code over 10 years saved the state $4.80 in potential losses.
An ASPR and CDC working group issued 16 new preparedness objectivesIn May 2016, a working group by ASPR and CDC introduced 16 new preparedness objectives for Healthy People 2020. This initiative provides science-based, 10-year national objectives for improving the health of Americans by establishing benchmarks and monitoring progress. The new objectives use data from various sources, including CDC, FEMA, and Save the Children.
Community Development Block Grant Disaster Recovery assistance—totaling $2.3 billion—for 2016 disasters includes mitigation RequirementsIn January 2017, the U.S. Department of Housing and Urban Development (HUD) published a Federal Register Notice including additional language requiring long-term recovery and hazard mitigation planning to promote sound and sustainable long-term recovery.
Mitigation Snapshots
san francisco sea level rise action Plan
Sea level rise is one of San Francisco’s most pressing environmental threats. To address it, a task force comprising local agencies developed a plan for San Francisco to mitigate the impacts. Published in March 2016, the plan outlines goals and objectives, such as conducting a vulnerability and risk assessment. San Francisco intends to build upon the plan and fully develop an adaptation plan for sea level rise by 2018.
usgs interactive maP
In August 2016, USGS produced an interactive map that allows residents living in and around New Mexico’s Jemez Mountains to see where they are located in relation to post-wildfire areas that may present debris-flow hazards (e.g., fast-moving landslides). The map also provides land managers and decision-makers with the ability to pinpoint locations where mitigation activities would minimize both the threat of wildfires and the potential for debris flows.
rainreaDy miDlothian
Midlothian, Illinois, has faced chronic flooding in recent years. In response, Midlothian and its partners developed a flood plan, RainReady Midlothian, that establishes a common understanding of the village’s flood risk, describes methods of reducing flood impacts, and explains how to implement them. In addition, the plan emphasizes using green infrastructure not only to mitigate the negative impacts of floods, but also to preserve natural habitats, create jobs, and beautify neighborhoods.
Mitigation

48
Preparedness Indicators Percentage of U.S. population (excluding territories) covered by formal
mitigation strategies
Hazard mitigation strategies guide jurisdictional risk reduction efforts. DHS measures the percentage of the Nation’s population covered by formal mitigation strategies. Between fiscal years 2011 and 2015, this percentage has risen from 68.7 percent to 80.8 percent—an increase of more than 12 percentage points.
68.7% 71.0%76.7% 79.6% 80.8%
0%
20%
40%
60%
80%
100%
2011 2012 2013 2014 2015
Per
cent
age
of U
.S. P
opul
atio
n
Fiscal Year
Percentage of communities adopting disaster-resistant building codes
FEMA encourages the adoption and enforcement of disaster-resistant building codes to help communities increase their structural resilience. Adoption rates have shown an upward trend over the past five years. From fiscal year 2011 to fiscal year 2015, the percentage of communities adopting building codes with provisions that adequately address earthquake, flood, and wind hazards rose from 48 percent to 63 percent.
48%56% 57%
61% 63%
0%
20%
40%
60%
80%
100%
2011 2012 2013 2014 2015
Per
cent
age
of C
omm
unit
ies
Fiscal Year
Mitigation
49
MitigationKey Findings
Key Finding:
Recent innovations in early warning systems have the potential to improve the public- and private-sectors’ ability to forecast and communicate threats and hazards.
Federal agencies and academic institutions made advancements in earthquake early warning systems in 2016. In February, USGS announced that its prototype earthquake early warning system, “ShakeAlert,” entered the next phase of development, in which beta users can receive USGS ShakeAlert warnings on computers or smart devices. ShakeAlert has already detected thousands of earthquakes, including two that caused significant damage. Depending on the location of the earthquake’s epicenter and the density of seismic instrumentation, this early warning system provides anywhere from a few seconds to minutes of advanced warning before shaking begins, allowing public safety and key facilities’ personnel to take protective actions. In addition, the National Aeronautics and Space Administration (NASA) and Scripps Institute of Oceanography developed improved global positioning system (GPS) technology to estimate more accurate earthquake data, including location, magnitude, depth, and tsunami potential. By combining GPS data on the earth’s permanent displacement with seismic data, researchers can determine the magnitude of an earthquake more accurately and predict the likelihood of an ensuing tsunami. NASA started working with NOAA’s Tsunami Warning Centers to evaluate the new technology for potential additional application in NOAA’s tsunami early warning system.
Mission AreAC
Mitigation
onneCtions early warning systemsResponse
Becoming familiar with public information and warning systems is an essential activity in advancing mitigation. Receiving alerts ahead of an event enables people to take action to reduce the potential damage to themselves and their homes. Early warning systems also help first responders by giving them additional time to prepare and prioritize before an incident occurs.
The Federal Government has also made progress in developing new technologies for monitoring droughts and floods. In February 2016, NOAA’s National Integrated Drought Information System launched new drought early warning systems in the Pacific Northwest and the Midwest. NOAA worked with state, local, and tribal partners in each region to develop these systems, which make climate projections and drought forecasting data readily available to local decision-makers. NOAA also released the Nation’s first-ever national water forecast tool, which provides more accurate, detailed, and frequent information on water levels and the potential for areas to flood. The new tool models water movement in the Nation’s rivers and streams, improving the ability to predict extreme flooding events. Whereas previous capabilities confined NOAA’s water forecasting potential to 4,000 locations every few hours, this model extended that number by nearly seven-hundredfold. The tool provides hourly forecasts for the entire river network at 2.7 million locations. This can especially benefit emergency managers in flash-flood areas by giving them advance warning of at-risk areas to notify or evacuate.

50
Mitigation Case Study: FEMA App
In 2016, FEMA launched a new feature for the FEMA app that enables users to receive automatic notifications to their devices, reminding them to take steps to prepare their homes and families for disasters. The reminder feature allows users to receive pre-scheduled safety and preparedness tips, including updating emergency kits, testing smoking alarms, and practicing a fire escape plan. Additionally, the FEMA app—available in English and Spanish—provides emergency tips for what to do before, during, and after a disaster; interactive checklists for emergency kits; the ability to store emergency meeting locations; maps to nearby open shelters; and National Weather Service alerts for severe weather, flash flooding, and other hazards.
In October 2016 (the month when Hurricane Matthew made landfall in the United States ), Apple users downloaded the FEMA App more than 85,000 times, quadrupling the previous record of 20,000 downloads the week after Hurricane Sandy in 2012. Since its creation in 2011, more than 800,000 downloads of the FEMA app on Android and Apple devices have occurred (as of December 2016). Users have credited FEMA app alerts with helping them avoid flash flooding, as well as actively monitor hazards.
Key Finding:
Federal departments, the private sector, and industry groups have launched new efforts to improve understanding of the value of stronger building codes and to increase their adoption.
Throughout 2016, Federal departments and agencies developed new tools and policies to increase the adoption of building codes that lessen the impacts of natural hazard events. The U.S. Army Corps of Engineers (USACE) created a website promoting community resilience through the use of the latest standards, building codes, and climate science. The website is a comprehensive resource for planners and designers to learn how to improve building integrity and resilience. In addition, FEMA issued a new policy in 2016 that requires the use of hazard-resistant building codes as the minimum design standard for building restoration projects under the Public Assistance Program. Requiring recipients of this funding to incorporate hazard-resistant design standards for their building projects will enhance infrastructure resilience in jurisdictions that lack effective building codes. In September 2016, FEMA also issued a new disaster risk reduction policy that requires all FEMA offices and programs to encourage their stakeholders to adopt and enforce hazard-resistant building codes, standards, and provisions.
Building industry stakeholders have also taken steps to encourage the adoption of stronger building codes. For example, as part of its Urban Resilience Program, the Urban Land Institute created Returns on Resilience, an online resource that helps communities build more disaster-resistant homes and buildings. Additionally, the Insurance Institute for Business and Home Safety (IBHS) released a mobile application (“FORTIFIED Home On The Go”) to educate homeowners about how to build safer, stronger structures in the face of severe weather events. IBHS also launched incident-specific nationwide programs to help owners implement home improvement projects that increase the resilience of their houses against wind storms and hail storms.
Mitigation
51
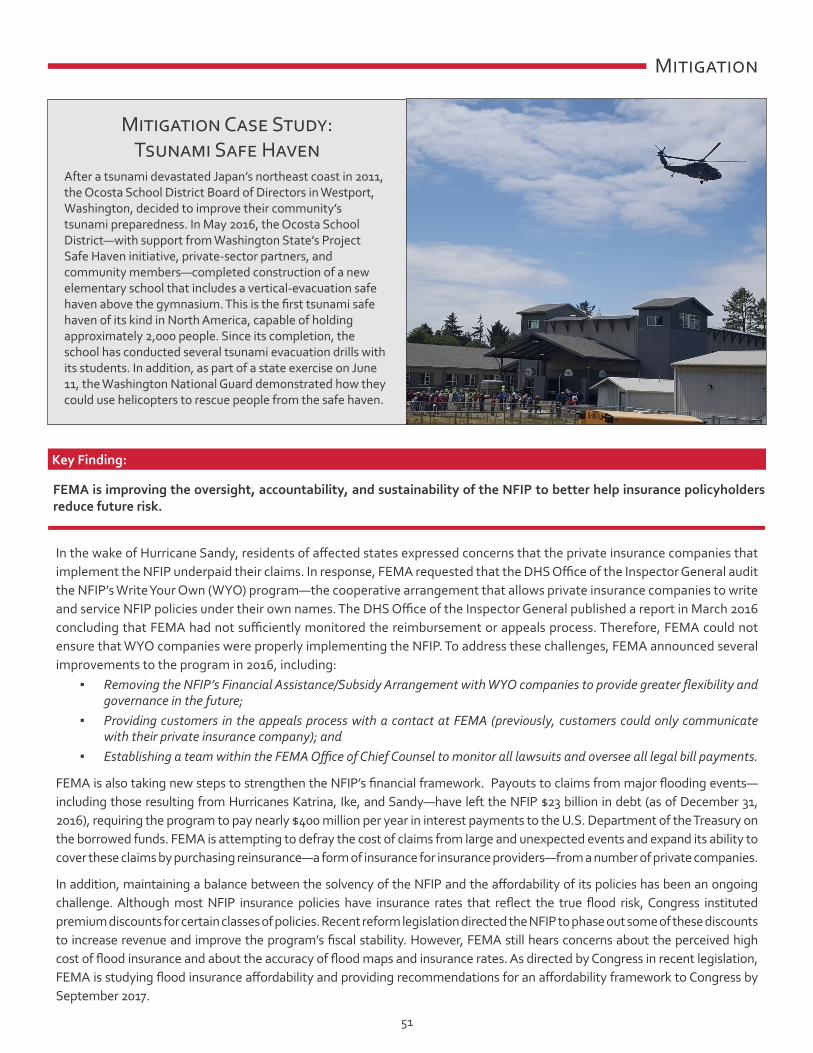
Mitigation Case Study: Tsunami Safe Haven
After a tsunami devastated Japan’s northeast coast in 2011, the Ocosta School District Board of Directors in Westport, Washington, decided to improve their community’s tsunami preparedness. In May 2016, the Ocosta School District—with support from Washington State’s Project Safe Haven initiative, private-sector partners, and community members—completed construction of a new elementary school that includes a vertical-evacuation safe haven above the gymnasium. This is the first tsunami safe haven of its kind in North America, capable of holding approximately 2,000 people. Since its completion, the school has conducted several tsunami evacuation drills with its students. In addition, as part of a state exercise on June 11, the Washington National Guard demonstrated how they could use helicopters to rescue people from the safe haven.
Key Finding:
FEMA is improving the oversight, accountability, and sustainability of the NFIP to better help insurance policyholders reduce future risk.
In the wake of Hurricane Sandy, residents of affected states expressed concerns that the private insurance companies that implement the NFIP underpaid their claims. In response, FEMA requested that the DHS Office of the Inspector General audit the NFIP’s Write Your Own (WYO) program—the cooperative arrangement that allows private insurance companies to write and service NFIP policies under their own names. The DHS Office of the Inspector General published a report in March 2016 concluding that FEMA had not sufficiently monitored the reimbursement or appeals process. Therefore, FEMA could not ensure that WYO companies were properly implementing the NFIP. To address these challenges, FEMA announced several improvements to the program in 2016, including:
▪ Removing the NFIP’s Financial Assistance/Subsidy Arrangement with WYO companies to provide greater flexibility and governance in the future;
▪ Providing customers in the appeals process with a contact at FEMA (previously, customers could only communicate with their private insurance company); and
▪ Establishing a team within the FEMA Office of Chief Counsel to monitor all lawsuits and oversee all legal bill payments.
FEMA is also taking new steps to strengthen the NFIP’s financial framework. Payouts to claims from major flooding events—including those resulting from Hurricanes Katrina, Ike, and Sandy—have left the NFIP $23 billion in debt (as of December 31, 2016), requiring the program to pay nearly $400 million per year in interest payments to the U.S. Department of the Treasury on the borrowed funds. FEMA is attempting to defray the cost of claims from large and unexpected events and expand its ability to cover these claims by purchasing reinsurance—a form of insurance for insurance providers—from a number of private companies.
In addition, maintaining a balance between the solvency of the NFIP and the affordability of its policies has been an ongoing challenge. Although most NFIP insurance policies have insurance rates that reflect the true flood risk, Congress instituted premium discounts for certain classes of policies. Recent reform legislation directed the NFIP to phase out some of these discounts to increase revenue and improve the program’s fiscal stability. However, FEMA still hears concerns about the perceived high cost of flood insurance and about the accuracy of flood maps and insurance rates. As directed by Congress in recent legislation, FEMA is studying flood insurance affordability and providing recommendations for an affordability framework to Congress by September 2017.
Mitigation
52
Despite these challenges, the NFIP successfully executed the flood insurance components of FEMA’s mission to support several flooding incidents in 2016. In addition to providing WYO companies further guidance through bulletins, FEMA website updates, and public fact sheets associated with each event, NFIP also issued advanced payments to provide expedited relief to survivors, coordinated with State Insurance Commissioners and WYO companies to ensure policyholder needs were being met, deployed staff to support field operations, and provided analytical support to stakeholders making resource decisions. In addition, the NFIP closed over three-quarters of claims resulting from three significant flood events—Hurricane Matthew, Hurricane Hermine, and the August Louisiana floods—within a few months. This demonstrates the progress that NFIP has made in more efficiently helping policyholders impacted by recent events recover.
Key Finding:
Federal and state actors are taking steps to address human-induced earthquakes, which are contributing to an overall increase in seismic hazards in the central United States and present threats to infrastructure and people.
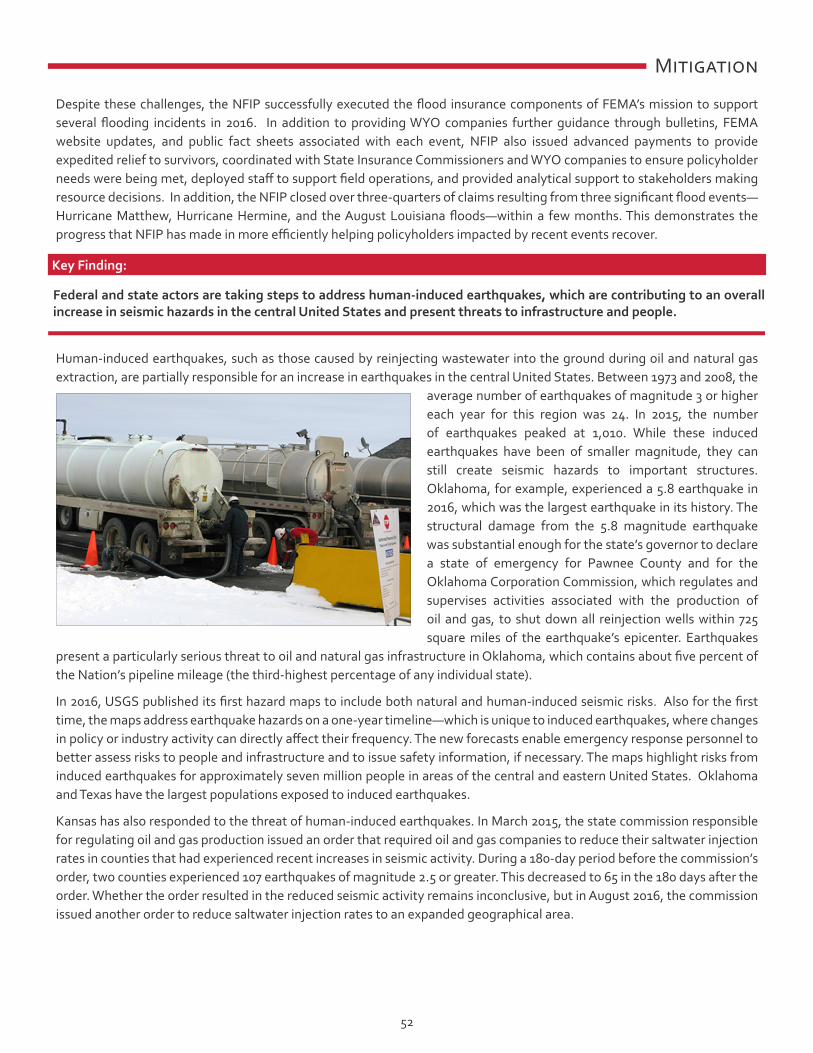
Human-induced earthquakes, such as those caused by reinjecting wastewater into the ground during oil and natural gas extraction, are partially responsible for an increase in earthquakes in the central United States. Between 1973 and 2008, the
average number of earthquakes of magnitude 3 or higher each year for this region was 24. In 2015, the number of earthquakes peaked at 1,010. While these induced earthquakes have been of smaller magnitude, they can still create seismic hazards to important structures. Oklahoma, for example, experienced a 5.8 earthquake in 2016, which was the largest earthquake in its history. The structural damage from the 5.8 magnitude earthquake was substantial enough for the state’s governor to declare a state of emergency for Pawnee County and for the Oklahoma Corporation Commission, which regulates and supervises activities associated with the production of oil and gas, to shut down all reinjection wells within 725 square miles of the earthquake’s epicenter. Earthquakes
present a particularly serious threat to oil and natural gas infrastructure in Oklahoma, which contains about five percent of the Nation’s pipeline mileage (the third-highest percentage of any individual state).
In 2016, USGS published its first hazard maps to include both natural and human-induced seismic risks. Also for the first time, the maps address earthquake hazards on a one-year timeline—which is unique to induced earthquakes, where changes in policy or industry activity can directly affect their frequency. The new forecasts enable emergency response personnel to better assess risks to people and infrastructure and to issue safety information, if necessary. The maps highlight risks from induced earthquakes for approximately seven million people in areas of the central and eastern United States. Oklahoma and Texas have the largest populations exposed to induced earthquakes.
Kansas has also responded to the threat of human-induced earthquakes. In March 2015, the state commission responsible for regulating oil and gas production issued an order that required oil and gas companies to reduce their saltwater injection rates in counties that had experienced recent increases in seismic activity. During a 180-day period before the commission’s order, two counties experienced 107 earthquakes of magnitude 2.5 or greater. This decreased to 65 in the 180 days after the order. Whether the order resulted in the reduced seismic activity remains inconclusive, but in August 2016, the commission issued another order to reduce saltwater injection rates to an expanded geographical area.
Mitigation
53
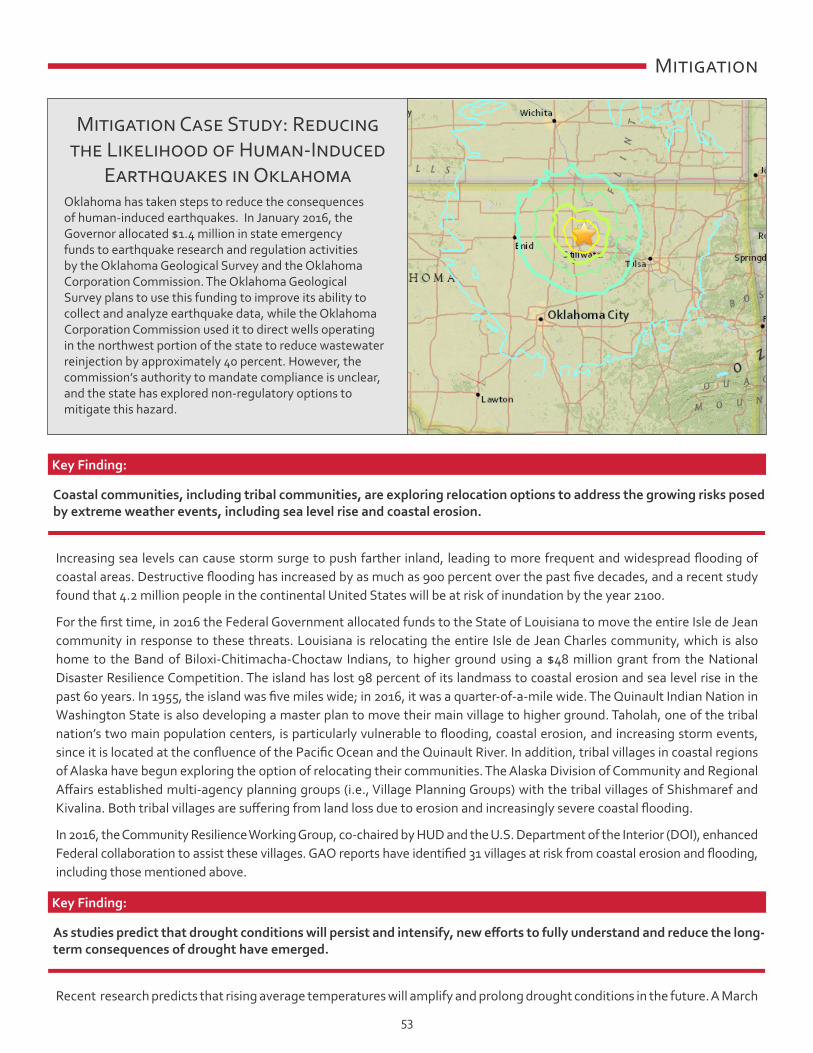
Mitigation Case Study: Reducing the Likelihood of Human-Induced
Earthquakes in OklahomaOklahoma has taken steps to reduce the consequences of human-induced earthquakes. In January 2016, the Governor allocated $1.4 million in state emergency funds to earthquake research and regulation activities by the Oklahoma Geological Survey and the Oklahoma Corporation Commission. The Oklahoma Geological Survey plans to use this funding to improve its ability to collect and analyze earthquake data, while the Oklahoma Corporation Commission used it to direct wells operating in the northwest portion of the state to reduce wastewater reinjection by approximately 40 percent. However, the commission’s authority to mandate compliance is unclear, and the state has explored non-regulatory options to mitigate this hazard.
Key Finding:
Coastal communities, including tribal communities, are exploring relocation options to address the growing risks posed by extreme weather events, including sea level rise and coastal erosion.
Increasing sea levels can cause storm surge to push farther inland, leading to more frequent and widespread flooding of coastal areas. Destructive flooding has increased by as much as 900 percent over the past five decades, and a recent study found that 4.2 million people in the continental United States will be at risk of inundation by the year 2100.
For the first time, in 2016 the Federal Government allocated funds to the State of Louisiana to move the entire Isle de Jean community in response to these threats. Louisiana is relocating the entire Isle de Jean Charles community, which is also home to the Band of Biloxi-Chitimacha-Choctaw Indians, to higher ground using a $48 million grant from the National Disaster Resilience Competition. The island has lost 98 percent of its landmass to coastal erosion and sea level rise in the past 60 years. In 1955, the island was five miles wide; in 2016, it was a quarter-of-a-mile wide. The Quinault Indian Nation in Washington State is also developing a master plan to move their main village to higher ground. Taholah, one of the tribal nation’s two main population centers, is particularly vulnerable to flooding, coastal erosion, and increasing storm events, since it is located at the confluence of the Pacific Ocean and the Quinault River. In addition, tribal villages in coastal regions of Alaska have begun exploring the option of relocating their communities. The Alaska Division of Community and Regional Affairs established multi-agency planning groups (i.e., Village Planning Groups) with the tribal villages of Shishmaref and Kivalina. Both tribal villages are suffering from land loss due to erosion and increasingly severe coastal flooding.
In 2016, the Community Resilience Working Group, co-chaired by HUD and the U.S. Department of the Interior (DOI), enhanced Federal collaboration to assist these villages. GAO reports have identified 31 villages at risk from coastal erosion and flooding, including those mentioned above.
Key Finding:
As studies predict that drought conditions will persist and intensify, new efforts to fully understand and reduce the long-term consequences of drought have emerged.
Recent research predicts that rising average temperatures will amplify and prolong drought conditions in the future. A March
Mitigation

54
2016 report from the DOI’s Bureau of Reclamation (USBR) estimates that by the end of the 21st century, the United States will experience a temperature increase of five to seven degrees Fahrenheit. Increasing temperatures diminish snowpack, reduce stream flows, and limit the availability of water, further intensifying drought conditions. In addition, the report found that the April to July stream flows of several major river basins in the West will decrease between seven and 27 percent.
The Federal Government has taken the lead on addressing the threat that drought poses to the Nation. In March 2016, Presidential Memorandum: Building National Capabilities for Long-Term Drought Resilience formally institutionalized the National Drought Resilience Partnership (NDRP), a Federal partnership of seven departments and agencies tasked with helping communities better prepare for future droughts and reduce the impact of drought events. An accompanying Federal Action Plan identifies specific goals and associated actions for the NDRP to improve resilience to drought. In response, the NDRP completed efforts and launched new ones in 2016 to understand the long-term impacts of drought:
▪ NDRP partners are working with The Ohio State University and other private and public partners to develop a national soil moisture monitoring network, which will facilitate more comprehensive and accurate drought impact assessments.
▪ A U.S. Department of Agriculture (USDA) Forest Service (USFS) study on the consequences of drought for forests found that more frequent droughts could lead to larger wildfires, a higher probability of large-scale insect outbreaks, and reduced forest growth. The report also includes data that land managers can use for measuring the effectiveness of and building upon their drought resilience and climate adaptation efforts.
▪ To help states understand the economic impacts of drought, DHS is developing three reports that explain drought’s effects on infrastructure operations that are critical to state economies. Two of the reports will identify how California’s drought affected data center and manufacturing operations. The third report will focus on how drought has affected thermoelectric power plant operations in California and Texas. DHS plans to develop the reports’ findings into decision-support guides for stakeholders making decisions on how to accommodate competing water needs during droughts.
▪ USGS, the Nature Conservancy, and the Wildlife Conservation Society formed the Ecological Drought Working Group to assess the ecological impacts of drought and its implications for human well-being, in order to help communities prepare for and adapt to the effects of drought.
NDRP members also reported recent activities that aim to strengthen drought resilience over the coming years: ▪ The USDA and USBR are investing $47 million to support local water management projects and agricultural water-use
efficiency across 11 states in the West. ▪ USDA’s Natural Resources Conservation Service (NRCS) allocated $1.1 million towards local drought mitigation projects
in the Missouri Headwaters Basin in Montana. ▪ The USBR began five pilot studies exploring how reservoir operations can adapt to the impacts of climate change. The
pilots, which will end in December 2017, study water sources in the Great Plains, the Mid-Pacific, the Pacific Northwest, and the Upper and Lower Colorado regions. Based on these pilots, USBR is developing guidance to identify and implement improvements to reservoir operations by considering improved scientific information, enhancing existing operational flexibility, and planning for changes to reservoir operations under drought conditions.
▪ The EPA and Montana’s Department of Natural Resources, in partnership with other Federal and state agencies and nongovernmental organizations, launched a three-year demonstration project to enhance long-term drought resiliency in the Missouri headwaters basin by providing tools for drought monitoring, assessing, and forecasting; developing local and regional capacity to plan for drought; and implementing local projects to build regional drought resilience. The results will enhance local drought resilience and demonstrate how communities across the country can also mitigate drought.
Mitigation
Key Finding:
As the costs of wildfire suppression rise, public and private initiatives to fund wildfire risk reduction projects are emerging.
55
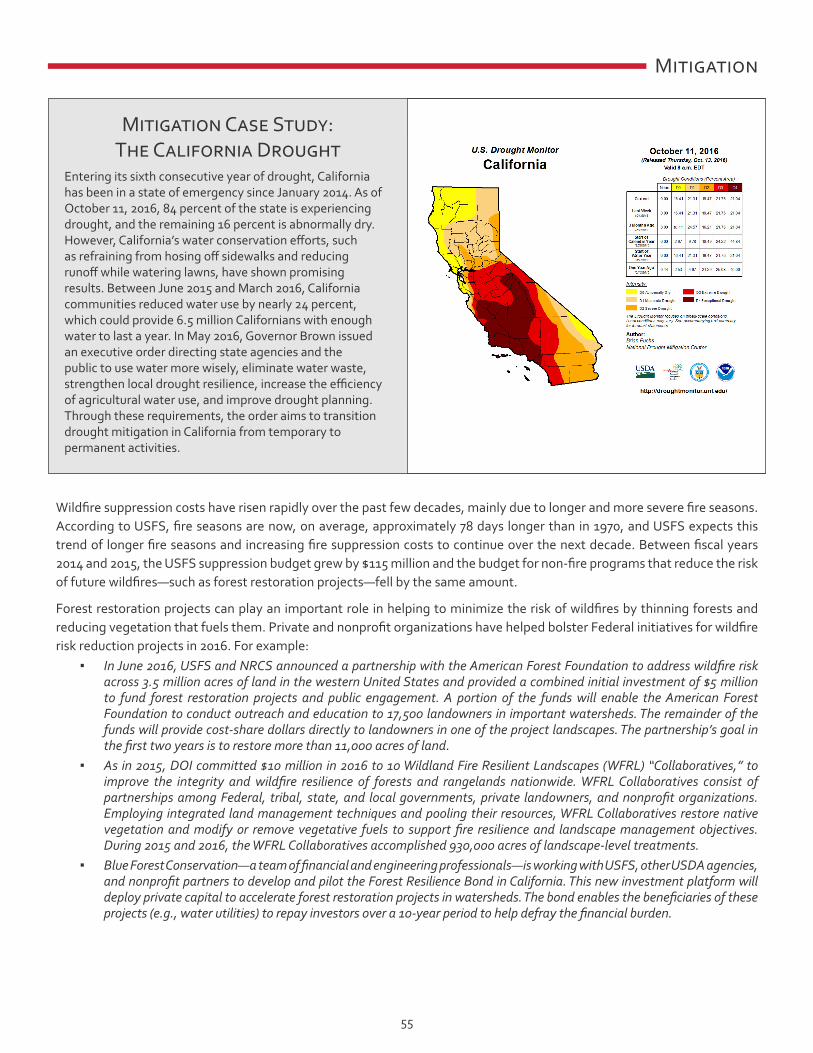
Mitigation Case Study: The California Drought
Entering its sixth consecutive year of drought, California has been in a state of emergency since January 2014. As of October 11, 2016, 84 percent of the state is experiencing drought, and the remaining 16 percent is abnormally dry. However, California’s water conservation efforts, such as refraining from hosing off sidewalks and reducing runoff while watering lawns, have shown promising results. Between June 2015 and March 2016, California communities reduced water use by nearly 24 percent, which could provide 6.5 million Californians with enough water to last a year. In May 2016, Governor Brown issued an executive order directing state agencies and the public to use water more wisely, eliminate water waste, strengthen local drought resilience, increase the efficiency of agricultural water use, and improve drought planning. Through these requirements, the order aims to transition drought mitigation in California from temporary to permanent activities.
Wildfire suppression costs have risen rapidly over the past few decades, mainly due to longer and more severe fire seasons. According to USFS, fire seasons are now, on average, approximately 78 days longer than in 1970, and USFS expects this trend of longer fire seasons and increasing fire suppression costs to continue over the next decade. Between fiscal years 2014 and 2015, the USFS suppression budget grew by $115 million and the budget for non-fire programs that reduce the risk of future wildfires—such as forest restoration projects—fell by the same amount.
Forest restoration projects can play an important role in helping to minimize the risk of wildfires by thinning forests and reducing vegetation that fuels them. Private and nonprofit organizations have helped bolster Federal initiatives for wildfire risk reduction projects in 2016. For example:
▪ In June 2016, USFS and NRCS announced a partnership with the American Forest Foundation to address wildfire risk across 3.5 million acres of land in the western United States and provided a combined initial investment of $5 million to fund forest restoration projects and public engagement. A portion of the funds will enable the American Forest Foundation to conduct outreach and education to 17,500 landowners in important watersheds. The remainder of the funds will provide cost-share dollars directly to landowners in one of the project landscapes. The partnership’s goal in the first two years is to restore more than 11,000 acres of land.
▪ As in 2015, DOI committed $10 million in 2016 to 10 Wildland Fire Resilient Landscapes (WFRL) “Collaboratives,” to improve the integrity and wildfire resilience of forests and rangelands nationwide. WFRL Collaboratives consist of partnerships among Federal, tribal, state, and local governments, private landowners, and nonprofit organizations. Employing integrated land management techniques and pooling their resources, WFRL Collaboratives restore native vegetation and modify or remove vegetative fuels to support fire resilience and landscape management objectives. During 2015 and 2016, the WFRL Collaboratives accomplished 930,000 acres of landscape-level treatments.
▪ Blue Forest Conservation—a team of financial and engineering professionals—is working with USFS, other USDA agencies, and nonprofit partners to develop and pilot the Forest Resilience Bond in California. This new investment platform will deploy private capital to accelerate forest restoration projects in watersheds. The bond enables the beneficiaries of these projects (e.g., water utilities) to repay investors over a 10-year period to help defray the financial burden.
Mitigation

56
FEMA estimates that as of 2016, less than a quarter of Americans have attended preparedness meetings or trainings. Eighteen percent of respondents to the 2015 National Household Survey re-ported attending a meeting on how to become better prepared for a disaster within the last year. This is a decrease of five percentage points from 2012. To improve this trend, both public and private stakeholders used more accessible media to promote individual and household preparedness in 2016.
2016 Preparedness Campaigns
Mitigation
The Oregon Office of Emergency Management worked with a graphic novel publishing company to produce a comic book touting tsunami preparedness targeted towards younger audiences.
20th Century Fox and Blue Sky Studios partnered with Save the Children to launch a new emergency preparedness public service announcement (PSA) campaign featuring characters from the feature film “Ice Age: Collision Course.”
The USFS, the Ad Council, and the National Association of State Foresters launched a new Smokey Bear PSA campaign to promote awareness about how to avoid accidentally starting a wildfire.
As part of National Preparedness Month, the popular video recipe website Tastemade partnered with FEMA to develop preparedness products designed to leverage the popularity of the online recipe video trend.
FEMA’s Ready Campaign and the Ad Council demonstrated how “Being Ready Can Be Scary Simple” in a seriesof videos that encourage families to prepare for emergencies by discussing emergency contacts and packing go bags.
For the first time, the Ready Campaign released their “Don’t Wait. Communicate. Make Your Emergency Plan Now” national PSA in Mandarin Chinese—the third most-spoken language in the United States.
57
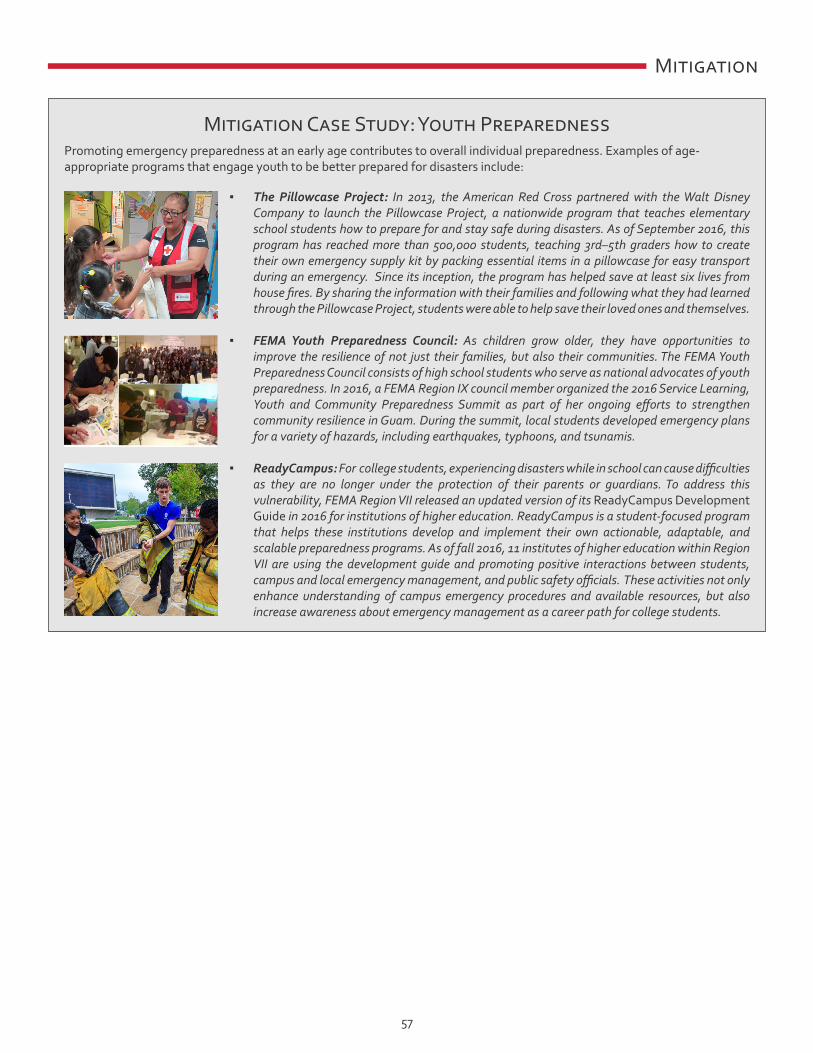
Mitigation Case Study: Youth PreparednessPromoting emergency preparedness at an early age contributes to overall individual preparedness. Examples of age-appropriate programs that engage youth to be better prepared for disasters include:
▪ The Pillowcase Project: In 2013, the American Red Cross partnered with the Walt Disney Company to launch the Pillowcase Project, a nationwide program that teaches elementary school students how to prepare for and stay safe during disasters. As of September 2016, this program has reached more than 500,000 students, teaching 3rd–5th graders how to create their own emergency supply kit by packing essential items in a pillowcase for easy transport during an emergency. Since its inception, the program has helped save at least six lives from house fires. By sharing the information with their families and following what they had learned through the Pillowcase Project, students were able to help save their loved ones and themselves.
▪ FEMA Youth Preparedness Council: As children grow older, they have opportunities to improve the resilience of not just their families, but also their communities. The FEMA Youth Preparedness Council consists of high school students who serve as national advocates of youth preparedness. In 2016, a FEMA Region IX council member organized the 2016 Service Learning, Youth and Community Preparedness Summit as part of her ongoing efforts to strengthen community resilience in Guam. During the summit, local students developed emergency plans for a variety of hazards, including earthquakes, typhoons, and tsunamis.
▪ ReadyCampus: For college students, experiencing disasters while in school can cause difficulties as they are no longer under the protection of their parents or guardians. To address this vulnerability, FEMA Region VII released an updated version of its ReadyCampus Development Guide in 2016 for institutions of higher education. ReadyCampus is a student-focused program that helps these institutions develop and implement their own actionable, adaptable, and scalable preparedness programs. As of fall 2016, 11 institutes of higher education within Region VII are using the development guide and promoting positive interactions between students, campus and local emergency management, and public safety officials. These activities not only enhance understanding of campus emergency procedures and available resources, but also increase awareness about emergency management as a career path for college students.
Mitigation