2017 nambucca heads public school annual report · nambucca heads public school has made positive...
TRANSCRIPT

Nambucca Heads Public SchoolAnnual Report
2017
2696
Printed on: 13 April, 2018Page 1 of 18 Nambucca Heads Public School 2696 (2017)

Introduction
The Annual Report for 2018 is provided to the community of Nambucca Heads Public School as an account of theschool's operations and achievements throughout the year.
It provides a detailed account of the progress the school has made to provide high quality educational opportunities forall students, as set out in the school plan. It outlines the findings from self–assessment that reflect the impact of keyschool strategies for improved learning and the benefit to all students from the expenditure of resources, including equityfunding.
Phillip Maunder
Principal
School contact details
Nambucca Heads Public SchoolRidge StNambucca Heads, 2448www.nambuccahd-p.schools.nsw.edu.aunambuccahd-p.School@det.nsw.edu.au6568 6411
Message from the Principal
Dear Numbucca Heads Public School Community,
Firstly, I would like to pay my respects to the Gumbaynggirr People who are the traditional owners of the land we havethe great pleasure of learning on.
What an enjoyable first 2 years I have had at our outstanding school, it is very satisfying to look back and reflect on whathas been achieved in that time. It is even more exciting to consider what is possible in the future. I absolutely believe thatyou will see your children achieve great success at our school. Every day, we see happy students at Nambucca HeadsPublic School and we are seeing our student achievement improving rapidly. What makes this so? Hard working,reflective, committed staff, respectful learners, great parents/carers and a strong proud culture.
A key part of what we have worked on with your children is the way they approach their learning, and in particular, howthey think and talk about learning. Education is changing, information is everywhere and accessible to everyone. Nolonger are we simply required to remember what we are told, we must have the ability to find out what we don’t knowindependently. When encountering new learning opportunities we need to have the ability to teach ourselves.
During learning sessions, we are now teaching our children to think, "I may not know the answers now, but I know how tofind them". A key change has been a strong focus on effort rather than results, results take care of themselves if youhave the right attitude and approach to learning. This is a hard concept to accept and work effectively with because ourworld is also very focused on “the results”.
In some ways this is a great challenge to understand, but it can actually be a big relief for our children. All they needto do... is "their best", to genuinely try their hardest each time they approach a new task. Our part in this as parents andteachers is to ensure that we are enabling children to do their best by giving them the right environment to take riskswithin. Perhaps the most important aspect of this environment is to feel “safe” as a learner. Safe to “have a go”, safe tomake mistakes, safe to be a risk taker.
Over these past two years, our school has developed our vision statement with all of this in mind. Our values create thelearning environment necessary to be a risk taker, we have a safe, positive, inclusive learning environment. This year wehave handed out more han 20 000 Win Bins. There has been more then 20 000 times in this year when a staff memberhas told a child they are trying hard to do well. What does this overwhelming positive approach do? It snowballs into aculture of positive behaviour for learning and I have no doubt that the results of this are evident when you walk throughour school.
In 2017, we also implemented our new value “Excellence” which sets our high expectations. During 2018, “Excellence”will continue to be a major focus for us. You will see your children be challenged to an even higher level in the coming
Printed on: 13 April, 2018Page 2 of 18 Nambucca Heads Public School 2696 (2017)

years at NHPS. Our vision statement, our Professional Learning Community, and our school values have created anenvironment focused on learning.
Phil Maunder
Principal
Nambucca Heads Public School
Printed on: 13 April, 2018Page 3 of 18 Nambucca Heads Public School 2696 (2017)

School background
School vision statement
Nambucca Heads Public School is an outstanding school, our team is proud of our strong culture, high expectationsand successful learners. We cater for the whole child and every single person in our learning community is welcomed,valued and included. Our future focused learning design enables students to be resilient, persistent and confidentlearners.
School context
Established in 1884, Nambucca Heads Public School is located on the Mid North Coast of NSW. We are a K–6 schoolwith an enrolment of 284 students. Students come from a range of socio–economic backgrounds, with approximately22% identifying as Aboriginal. We have 11 classes that are supported by a Principal, a Deputy Principal, three AssistantPrincipals and twenty six teaching, support and office staff. We have a strong culture and tradition of providing qualityeducation and offer a wide range of opportunities for children. NHPS Is an Early Action For Success School (EAfS). Wealso have a Professional Learning Community (PLC), Quicksmart and are a Positive Behaviour for Learning (PBL)school. Nambucca Heads Public School has a valued place within the traditions and culture of the community and enjoysloyal community support. The school fosters close relationships with four feeder pre–schools and Nambucca Heads HighSchool. Joint initiatives are undertaken with Nambucca Heads High School and others in the Valley 10 Community ofSchools. The school has an active Parents and Citizens Association and Aboriginal Advisory Group.
Self-assessment and school achievement
Self-assessment using the School Excellence Framework
This section of the Annual Report outlines the findings from self–assessment using the School Excellence Framework,school achievements and the next steps to be pursued.
This year, our school undertook self–assessment using the School Excellence Framework. The framework supportspublic schools throughout NSW in the pursuit of excellence by providing a clear description of high quality practiceacross the three domains of Learning, Teaching and Leading.
Nambucca Heads Public School has made positive progress across each of the three domains between 2016 and 2017through the development of our school vision statement. Our vision statement has led the development of 3 main foci inour school: Our Professional Learning Community, Our Future Focused Learning Design and School Wellbeing.
Our self–assessment process will assist the school to refine our school plan, leading to further improvements in thedelivery of education to our students.
For more information about the School Excellence Framework:
https://education.nsw.gov.au/teaching–and–learning/school–excellence–and–accountability/sef–evidence–guide
Printed on: 13 April, 2018Page 4 of 18 Nambucca Heads Public School 2696 (2017)

Strategic Direction 1
Excellence in teaching and learning
Purpose
To have a clear, coordinated, evidence based pedagogical approach to learning design.
Overall summary of progress
To have a clear, coordinated, evidence based pedagogical approach to learning design. To be able to measurestudent progress accurately, differentiate delivery and maximise learning progress for all students.
During 2016 we invited 4 Principal School Leader’s (PSL's) to complete a detailed self–assessment of the school usingthe School Excellence Framework (SEF). We conducted this more like a review than a self–assessment, looking closelyat student learning and speaking in depth with staff, students and parents .
The key action to come out of the process was our school wide Professional Learning Community (PLC). To implementthis focus on differentiated learning, consistent approach to learning design and collaborative teaching practice we:
• Restructured our timetable completely • Employed staff to the value of $150 000 to provide staff release and student intervention • Classified each of our students into Tiers 1,2,3 to enable identification of intervention students • Designed our pedagogical framework around DuFour's critical questions for learning design • Designed our PLC sequence structures • Developed our PLC communication tools and protocols
This PLC releases stages as Professional Learning Teams under the leadership of an Instructional Leader. We alsodeveloped a guiding pedagogical framework, reflection tool to measure our performance, an assessment schedule anddatabase, communication protocols, and a PLC sequence guide. All of these aspects of our PLC were completed in 2016and our PLC has been outstanding success. When using a the School Excellence Framework as a lense to evaluate ourprogress as a school through the design, development and implementation of our Professional Learning Community wehave seen a progression of at least one level in 11 of 14 areas of the Framework.
In particular through staff discussion using the descriptors within several areas of the framework we have self assessedas moving from "working towards delivering" to "sustaining and growing" as a direct result of the implementation of ourPLC in the following categories:
• Learning: assessment and reporting • Learning: student performance measures • Teaching: data skills and use • Teaching: learning and development • Leading: school planning and reporting • Leading: management practices and processes
The results of this work at a student outcome level are best represented by the student performance measures via theValue Added (VA) Reports from Scout which show a steady improvement for our school. VA K–3 is an experimentalmeasure that provides an indication of student progress from Kindergarten to Year 3 compared to similar schools withsimilar students. It does this by adjusting for the characteristics of the school and its students, including performance inKindergarten.
For Kindergarten performance, the measure uses estimates of literacy and numeracy from the Best Start assessment.These estimates are derived from a measurement analysis of students’ levels on each of the aspects of literacy andnumeracy, using the same methodology as for generating NAPLAN scores.
The Year 3 performance used for the measure is an average of NAPLAN reading and numeracy scores, as used in otherVA measures.
The analysis model used to generate VA K–3 results is very similar to that used for other VA measures. It takes accountof the following student and school contextual factors:
• Student SES • Student Aboriginality • Student gender
Printed on: 13 April, 2018Page 5 of 18 Nambucca Heads Public School 2696 (2017)

• School SES (FOEI)Nambucca Heads Public School has achieved the following Value Added evaluations:
Kindergarten to Year 3 – Excelling
Year 3 to 5 – Sustaining and Growing
Year 5 to 7 – Delivering
Progress towards achieving improvement measures
Improvement measures(to be achieved over 3 years)
Funds Expended(Resources)
Progress achieved this year
Parent and Student Survey $15000 PLP Data from School Surveys 2017: 89% of2017 parents strongly agree that they are moreaware of thier child's learning needs as a result ofthe PLP process. Surveys Collected 154(2016semester 2) ,195 (2017 Semester 1),239 (2017Semester 2).
Positive Behaviour for Learning(PBL) School Evaluation Tool(SET)
N/A The School Evaluation Tool has been rescheduledfor 2018 and identified within 2018 –2020 SchoolPlan.
Behaviour database N/A Tell Them from Me Surveys indicate that ourstudents have 92% score for positive behaviours.This is a strong result when compared to thegovernment norm of 83%. Between 2015 and 2017we have seen a reduction in bullying from 42% to29%. These results are representative of ourstrategic directions 1 and 2 with quality learningdesign and a positive framework for behaviour.
Next Steps
The followingsteps have been identified in our 2018–2020 School Plan:
Student Learning Goal: All students own their learning progress in literacy and numeracy and understand themselvesas learners
Parents and Students: Personalised Learning Plan Meetings for every child in our school will continue for the next3years, with greater than 90% of parents agreeing or strongly agreeing that they are better informed and can their child'slearning more at home as a result this has been an outstanding success.
Teachers: Effort Focused Feedback will be provided by teachers through the schools feedback model, which is tobe finalised in 2018. Our Professional Learning Community (PLC) designed around DuFour's "Critical Questions" is the schools evidencebased approach to differentiated learning design. Staff will continue to work together to ensure consistent application ofthe model, delivery of differentiated learning and high expectations of students and staff. This model is now embeddedafter 1.5 years or implementation and the key investment for teacher professional learning and maximised learningprogress. The PLC Model will be the core strategic goal for Nambucca Heads Public School within our 2018–2020School Plan. Additional to the above commitment we have been developing a "Learning Partnership" with South WestRocks Public School to expand our collaborative practices and get external feedback on our focus on improved teachingpedagogy.
Printed on: 13 April, 2018Page 6 of 18 Nambucca Heads Public School 2696 (2017)

Strategic Direction 2
Confident, Capable, Caring Citizens
Purpose
To improve student learning experiences by developing students’ resilience and persistence through explicit social andemotional learning (SEL) and cultural awareness.
Overall summary of progress
Throughout the 2015–2017 School Plan Nambucca Heads Public School has worked purposefully to improve studentlearning experiences by:
1. Strengthening and clarifying our school Positive Behaviour for Learning model2. Providing students with learning opportunities to develop resilience and persistence through explicit Social and
Emotional Learning (SEL)3. The celebration of Aboriginal Culture within our school
A calm and orderly learning environment continues to be evident within our school. Whilst we originally looked atmeasuring our behaviour communication slips as an indicator of success, our Wellbeing Team weekly data analysis ledus to the realisation that the number of communication slips was not directly proportionate nor was is indicative ofpositive behaviour and wellbeing. The number of communications had many variables including teacher time, perceptionand absence. In many cases our communication to staff was that an increase in communication slips was representativeof quality educational delivery. Our evaluations will continue to be led by the wellbeing database but decision and actionsare based around qualitative and quantitative feedback with students, parents and staff representatives present withinour weekly wellbeing meetings.
During the past three years all of our students have been provided with explicit learning opportunities through the KidsMatter Framework, Bounceback and now the Victorian Education FUSE Social and Emotional Learning Website. Ourschool has had a significant focus on Aboriginal Education and all students have been provided with opportunities tolearn Aboriginal history, local culture and Gumbaynggirr language.
Indigenous PLP Feedback Surveys conducted in 2016 Term 4 Indicated that in all areas staff and families feltrelationships were strong with 85% + in all areas. Sense of identity for students scored 83% and this this has beenidentified as the focus area which aligns with anecdotal feedback from the advisory team.
Progress towards achieving improvement measures
Improvement measures(to be achieved over 3 years)
Funds Expended(Resources)
Progress achieved this year
Indigenous Parental Survey $3000 Teacher Release toconduct interviews withfamilies to see feedback onrelationships and studentwellbeing.
Survey conducted with 29 families showed anaverage positive rating of 86% for engagement,relationship and behaviour.
Behaviour Data Collection $10000 Tell Them from Me Surveys indicate that ourstudents have 92% score for positive behaviours.This is a strong result when compared to thegovernment norm of 83%. Between 2015 and 2017we have seen a reduction in bullying from 42% to29%. These results are representative of ourstrategic directions 1 and 2 with quality learningdesign and a positive framework for behaviour ourschool is making strong progress.
PBL School Evaluation Tool N/A The SET Level 2 evaluation has been rescheduledfor 2018 within our 2018–2020 School Plan
Next Steps
Printed on: 13 April, 2018Page 7 of 18 Nambucca Heads Public School 2696 (2017)

When we evaluate our Tell Them From Me Data, parent anecdotal feedback, teacher feedback, People Matter Surveysand our school wellbeing data it is evdient that a continued focus on student wellbeing throgh Social and EmotionalLearnign and Mindfulness is as important as our focus on literacy and numeracy acquisition. Through our 2018 –2020School Plan Students will continue to be provided with explicit learning opportunities to develop SEL with a particularfocus on persistence, resilience and mindfulness. This action will result in improved positive relationships. All studentswill continue to be provided with more opportunities to learn Aboriginal history, local culture and Gumbaynggirr language.
Our Wellbeing Team will lead evidence an based decision making cycle which results in improved whole schoolwellbeing. This team will continue to include representatives from staff, parents and students.
School leaders will access Bounce Back resources, the Vic Education FUSE SEL Curriculum and Wellbeing Data toestablish school wide wellbeing focus each week. Staff will reflect on how the successful delivery of SEL will result inpositive relationships and wellbeing for individuals and the whole school.
Partnerships will be sought through the wellbeing meetings to enhance the delivery of Social and Emotional Learning(SEL) for students.
Our School Aboriginal Advisory Team will continue for the life of th 2018–2020 School Plan, meeting monthly to provideadvice on how we can best support our Indigenous Students at NHPS
Printed on: 13 April, 2018Page 8 of 18 Nambucca Heads Public School 2696 (2017)

Strategic Direction 3
Targeted and meaningful partnerships – Vision into Action
Purpose
We cater for the whole child and every single person in our learning community is welcomed, valued and included. Theentire school community plays an active role in the schools commitment to achieving our vision. There is a commonunderstand of the link from the vision to the key aspects of the school plan
Overall summary of progress
At Nambucca Heads Public School we cater for the whole child and every single person in our learning community iswelcomed, valued and included. The entire school community plays an active role in the schools commitment toachieving our vision. During 2017 we have actively worked towards a common understanding of the link from our SchoolVision Statement to the key aspects of the school plan.
The first action to take place was to communicate the vision until is became everyday language. The vision statementhas been placed on letterheads, displayed via multiple signs around the school and is referred to in conversationsregularly. The vision statement leads our decision making processes and we link the words within the vision statement toour everyday actions within the school.
As a result of our work in this area students can articulate the school values, their meaning and what this means for ourschool. Staff and Stage 3 students are able to articulate the key aspects of the school vision statement and can linkthese to the programs, actions and strategies within the School Plan.
The most signification work and actions that come from this vision statement within this area are the things we do tocater for the "whole child". The vision statement was developed with our school community over the course of full yearand a very important message was that we wanted to give our students opportunities to learn and grow within otherareas of the curriculum. As a result, during 2017 we funded the following programs within our school:
• Schoolwide Pedagogcial Approach (PLC) • Healthy Minds Healthy Bodies Morning Movement program • Rock Band and Woodwind Band • Indigenous Education Partnership • Language Program • ICT Focus – Embed ICT through curriculum (21st Century learning) • School wide specialist PE Delivery • Personalised Learning Plans (PLP's) for every single student
We are very proud of the actions that have taken place for our school around our school vision, we do believe that wework as "one" as a result of this vision. We feel that we are now led by our agreed commitment to our school communityrather than by the person with the biggest voice or the highest position.
Progress towards achieving improvement measures
Improvement measures(to be achieved over 3 years)
Funds Expended(Resources)
Progress achieved this year
Personalised Learning PlanSurveys
Visible signage andcommunication of school valuesand vision
TTFM Surveys
Behaviour and AcademicDatabase
$60000 All planned signage has been purchased anddisplayed.
Student participation in extra curricular activities isat 61% which is 5% above the government norm forNSW.
Student with a positive sense of belonging is at80% and the government norm is 81%.
Students with positive behaviour at school is at 92%whilst the government norm is 84%
Printed on: 13 April, 2018Page 9 of 18 Nambucca Heads Public School 2696 (2017)
Next Steps
Through our 2018–2020 School Plan all of the existing programs listed above will continue for the life of the plan. Ourfeedback data suggests to us that we are providing our students with the extra curricular activities that they require so weare aiming to continue this level of focus . Our third strategic direction will be adjusted to include a clear emphasis on"Future Focused" learning and mindfulness.
Teachers will create learning environments which will enable shared and innovative learning opportunities that prepareour children as independent learners for their future. Parents/carers, students and staff will partner with the school on our"Future Focused" learning journey. School staff and community will critically reflect on "Future Focused" learning designthrough PLC. We will improve our schools capacity to cater for 21st century learning needs. Students will be supportedfurther develop a learning mindset which is free from a fear of failure, is resilient and confident.
Printed on: 13 April, 2018Page 10 of 18 Nambucca Heads Public School 2696 (2017)

Key Initiatives Resources (annual) Impact achieved this year
Aboriginal background loading $67 280 Employment or SLSO staff for art, language2.5 days per week, employment of SLSO fortargeted students 5 days per week.Development communication of AboriginalPartnership Agreement, Development ofAboriginal Advisory Team, InstructionalRounds Focus on Aboriginal EducationImprovement.
Low level adjustment for disability $133196 Full time LAST position $104000
Full time SLSO support for 2 new Kindystudents during the period of access requestprocessing. $29196. these students are nowdepartmentally funded to this value.
Socio–economic background $152976 Implementation of PLC Model, associatedstaff release and intervention hours.
Printed on: 13 April, 2018Page 11 of 18 Nambucca Heads Public School 2696 (2017)

Student information
Student enrolment profile
Enrolments
Students 2014 2015 2016 2017
Boys 130 144 133 151
Girls 114 134 123 142
Student enrolment continue to increase despite strictpolicy implementation for out of zone enrolments,this has resulted in the addition of another classroom tothe school to begin 2018.
Student attendance profile
School
Year 2014 2015 2016 2017
K 94.3 94.7 92.1 94.6
1 91.9 92.7 93.1 94.8
2 92.9 91.5 92.6 93.1
3 92.9 93.2 92.1 92.7
4 91.8 92.7 93.7 92
5 92.9 91.7 92 92.2
6 89.3 90.5 92.1 92
All Years 92.4 92.4 92.6 93
State DoE
Year 2014 2015 2016 2017
K 95.2 94.4 94.4 94.4
1 94.7 93.8 93.9 93.8
2 94.9 94 94.1 94
3 95 94.1 94.2 94.1
4 94.9 94 93.9 93.9
5 94.8 94 93.9 93.8
6 94.2 93.5 93.4 93.3
All Years 94.8 94 94 93.9
Management of non-attendance
At Nambucca Heads Public School good attendance isacknowledged and rewards through the school rewardssystem. Attendance has been a focus for improvementat Nambucca Head Public School. At a school level wehave improved communication with teachers, parentsand clarified the expected follow up for attendanceissues.
Teachers or front office staff make contact with afamily: • When a student has had 2 un–notified absences
in a row or... • For any student who is below 85% attendance in
total, and has a high percentage of un–notifiedabsences.
The staff member who makes contact then enters thedetails and date into the communication document onthe school server. Principal letters are sent homefrom to any family who is not showing improvement inattendance, all letters are to sent via registered mail.
If attendance does not improve after this process hasbeen followed a letter a referral is made to thetruancy officer. If a students has had more that 30% absence and ahigh number of un–notified absences the schoolwill consider a mandatory report.As a result of these efforts our attendance hasimproved by .4 of a percent whilst the government normhas reduced by .1 percent. the equates to 6 additionaldays attended per week for our school in 2017.
Workforce information
Workforce composition
Position FTE*
Principal 1
Deputy Principal(s) 0
Assistant Principal(s) 3
Head Teacher(s) 0
Classroom Teacher(s) 9.15
Teacher of Reading Recovery 0.53
Learning & Support Teacher(s) 1
Teacher Librarian 0.6
Teacher of ESL 0
School Counsellor 0
School Administration & SupportStaff
2.62
Other Positions 0
*Full Time Equivalent
Additional to the table above Nambucca Heads PublicSchool employs 11 Student Learning Support Officers(SLSO), 4 of these 11 staff members identify asAboriginal.
Teacher qualifications
Printed on: 13 April, 2018Page 12 of 18 Nambucca Heads Public School 2696 (2017)
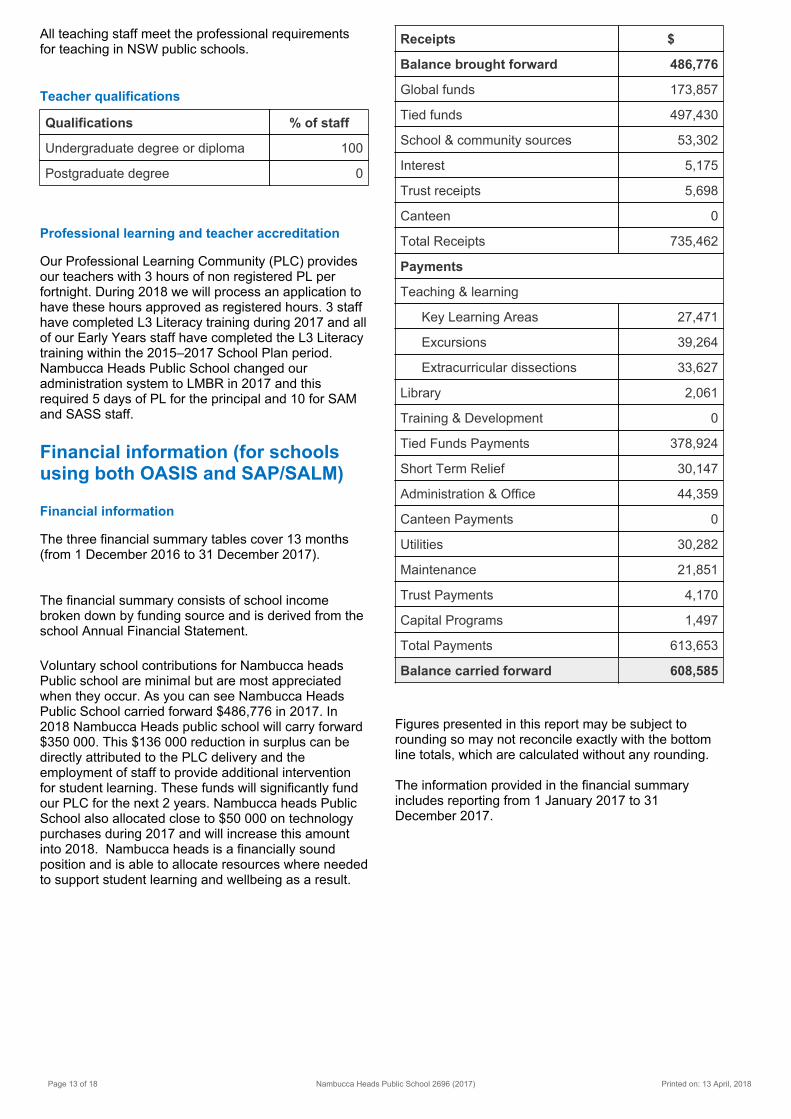
All teaching staff meet the professional requirementsfor teaching in NSW public schools.
Teacher qualifications
Qualifications % of staff
Undergraduate degree or diploma 100
Postgraduate degree 0
Professional learning and teacher accreditation
Our Professional Learning Community (PLC) providesour teachers with 3 hours of non registered PL perfortnight. During 2018 we will process an application tohave these hours approved as registered hours. 3 staffhave completed L3 Literacy training during 2017 and allof our Early Years staff have completed the L3 Literacytraining within the 2015–2017 School Plan period.Nambucca Heads Public School changed ouradministration system to LMBR in 2017 and thisrequired 5 days of PL for the principal and 10 for SAMand SASS staff.
Financial information (for schoolsusing both OASIS and SAP/SALM)
Financial information
The three financial summary tables cover 13 months(from 1 December 2016 to 31 December 2017).
The financial summary consists of school incomebroken down by funding source and is derived from theschool Annual Financial Statement.
Voluntary school contributions for Nambucca headsPublic school are minimal but are most appreciatedwhen they occur. As you can see Nambucca HeadsPublic School carried forward $486,776 in 2017. In2018 Nambucca Heads public school will carry forward$350 000. This $136 000 reduction in surplus can bedirectly attributed to the PLC delivery and theemployment of staff to provide additional interventionfor student learning. These funds will significantly fundour PLC for the next 2 years. Nambucca heads PublicSchool also allocated close to $50 000 on technologypurchases during 2017 and will increase this amountinto 2018. Nambucca heads is a financially soundposition and is able to allocate resources where neededto support student learning and wellbeing as a result.
Receipts $
Balance brought forward 486,776
Global funds 173,857
Tied funds 497,430
School & community sources 53,302
Interest 5,175
Trust receipts 5,698
Canteen 0
Total Receipts 735,462
Payments
Teaching & learning
Key Learning Areas 27,471
Excursions 39,264
Extracurricular dissections 33,627
Library 2,061
Training & Development 0
Tied Funds Payments 378,924
Short Term Relief 30,147
Administration & Office 44,359
Canteen Payments 0
Utilities 30,282
Maintenance 21,851
Trust Payments 4,170
Capital Programs 1,497
Total Payments 613,653
Balance carried forward 608,585
Figures presented in this report may be subject torounding so may not reconcile exactly with the bottomline totals, which are calculated without any rounding.
The information provided in the financial summaryincludes reporting from 1 January 2017 to 31December 2017.
Printed on: 13 April, 2018Page 13 of 18 Nambucca Heads Public School 2696 (2017)

2017 Actual ($)
Opening Balance 0
Revenue 650,906
Appropriation 613,657
Sale of Goods and Services 3,082
Grants and Contributions 34,007
Gain and Loss 0
Other Revenue 0
Investment Income 160
Expenses -248,113
Recurrent Expenses -248,113
Employee Related -178,213
Operating Expenses -69,899
Capital Expenses 0
Employee Related 0
Operating Expenses 0
SURPLUS / DEFICIT FOR THEYEAR
402,793
Balance Carried Forward 402,793
The Opening balance for the 2017 school financial yearis displayed in the OASIS table as Balance broughtforward. The financial summary table for the yearended 31 December 2017 shows the Opening balanceas $0.00 because the Opening balance for the 2017school financial year is reported in the OASIS table (asBalance brought forward).
The amount displayed in the Appropriation category ofthe financial summary table is drawn from the Balancecarried forward shown in the OASIS table and includesany financial transactions in SAP the school hasundertaken since migration from OASIS to SAP/SALM.For this reason the amount shown for Appropriation willnot equal the OASIS Balance carried forward amount.
Financial summary equity funding
The equity funding data is the main component of the'Appropriation' section of the financial summary above.
2017 Actual ($)
Base Total 1,950,445
Base Per Capita 39,124
Base Location 36,453
Other Base 1,874,868
Equity Total 357,100
Equity Aboriginal 67,280
Equity Socio economic 152,976
Equity Language 3,647
Equity Disability 133,196
Targeted Total 136,380
Other Total 230,370
Grand Total 2,674,295
Figures presented in this report may be subject torounding so may not reconcile exactly with the bottomline totals, which are calculated without any rounding.
A full copy of the school’s financial statement is tabledat the annual general meetings of the parent and/orcommunity groups. Further details concerning thestatement can be obtained by contacting the school.
School performance
NAPLAN
In the National Assessment Program, the results acrossthe Years 3, 5, 7 and 9 literacy andnumeracy assessments are reported on a scale fromBand 1 to Band 10. The achievement scalerepresents increasing levels of skillsand understandings demonstrated in theseassessments.
Printed on: 13 April, 2018Page 14 of 18 Nambucca Heads Public School 2696 (2017)
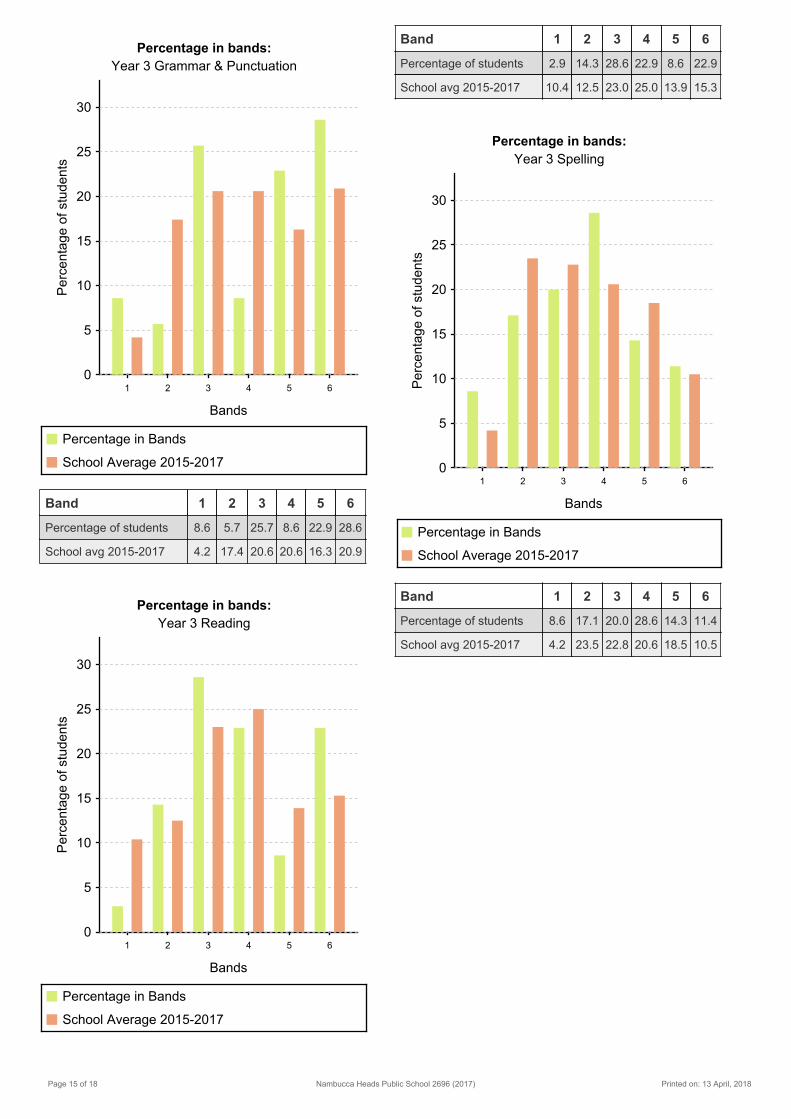
Band 1 2 3 4 5 6
Percentage of students 8.6 5.7 25.7 8.6 22.9 28.6
School avg 2015-2017 4.2 17.4 20.6 20.6 16.3 20.9
Band 1 2 3 4 5 6
Percentage of students 2.9 14.3 28.6 22.9 8.6 22.9
School avg 2015-2017 10.4 12.5 23.0 25.0 13.9 15.3
Band 1 2 3 4 5 6
Percentage of students 8.6 17.1 20.0 28.6 14.3 11.4
School avg 2015-2017 4.2 23.5 22.8 20.6 18.5 10.5
Printed on: 13 April, 2018Page 15 of 18 Nambucca Heads Public School 2696 (2017)

Band 1 2 3 4 5 6
Percentage of students 0.0 8.8 17.7 29.4 38.2 5.9
School avg 2015-2017 0.7 9.3 25.5 33.6 28.9 2.0
Band 3 4 5 6 7 8
Percentage of students 9.4 12.5 40.6 21.9 9.4 6.3
School avg 2015-2017 10.4 18.0 32.8 20.9 13.5 4.3
Band 3 4 5 6 7 8
Percentage of students 0.0 34.4 40.6 6.3 9.4 9.4
School avg 2015-2017 5.4 27.4 31.5 13.8 11.4 10.5
Printed on: 13 April, 2018Page 16 of 18 Nambucca Heads Public School 2696 (2017)

Band 3 4 5 6 7 8
Percentage of students 9.4 12.5 37.5 25.0 15.6 0.0
School avg 2015-2017 10.5 20.1 27.6 24.1 15.7 2.0
Band 3 4 5 6 7 8
Percentage of students 6.3 21.9 34.4 34.4 3.1 0.0
School avg 2015-2017 11.6 15.9 36.8 29.5 6.2 0.0
The My School website provides detailedinformation and data for national literacy and numeracytesting. Go to http://www.myschool.edu.au to accessthe school data.
Parent/caregiver, student, teachersatisfaction
Tell Them from Me data, People matters Surveydata, PLP Qualitative and Quantitative data,Aboriginal Family Surveys and anecdotal feedbackwould suggest that when compared to governmentnorms and similar schools our satisfaction ratings areabove average to outstanding. Some examples of thisare:
Within our People Matter Staff Survey Results wehad 16 of 19 respondents and our agreement was: • Employee Engagement 79% • Senior Managers 75% • Communication 81% • Engagement with Work 88% • High Performance 84% • Public Sector Values 83% • Diversity and Inclusion 75%
In each one of these circumstances our school hasachieved a higher rating than the Public Sector andfrom our Parent body.
In regards to student satisfaction when we compareour results in our TTFM surveys we see: • Students with positive behaviour at 92% which is
9 higher than the government norm. • Students who are interested and motivated at
83% which is 5%higher than the governmentnorm.
• Student who feel positive about their culture atschool 92%
Of the areas within student feedback that we haveidentified and will be addressed through 2018–2020school plan: • Student with positive relationships 80% which is
5% less than the government norm • Student with positive homework behaviours at
58% which is 5% below the government normParent Satisfaction was measured through PLPfeedback surveys, Aboriginal Parent Surveys andTTFM surveys.
PLP Data from School Surveys 2017: 89% of 2017parents strongly agree that they are more aware of thierchild's learning needs as a result of the PLP process.Surveys Collected 154(2016 semester 2) ,195 (2017
Printed on: 13 April, 2018Page 17 of 18 Nambucca Heads Public School 2696 (2017)

Semester 1),239 (2017 Semester 2).
Aboriginal Parent Survey: 29 families showed anaverage positive rating of 86% for engagement,relationship and behaviour.
Tell Them from Me Parent Surveys showed: Ahigher rating for Nambucca Heads Public School thanthe government norm in 6 out of 7 survey areas. Theonly area which was lower was "school supportslearning at home" and the significant factor within thisfeedback section was a distinct lo score for homework.this will be addressed within the 2018–2020 SchoolPlan. Areas to celebrate with significantly higher ratingsthan the Government norm were: • Parents support learning at home • Parents Feel Welcome • Inclusive School • Parents are Informed
Policy requirements
Aboriginal education
As you will have throughout this document NambuccaHeads Public School has achieved outstandingsuccess in this area through our Aboriginal AdvisoryTeam, commitment to ongoing celebration ofindigenous culture, our effective and proactivecommunication with our Aboriginal families and ourinclusive PBL school. Our work will be shared with theNSW Aboriginal Education Reference Group duringTerm 2 2018 in recognition of this success and to sharequality practice.
Multicultural and anti-racism education
Anti racism training will be undertaken in 2018.
Printed on: 13 April, 2018Page 18 of 18 Nambucca Heads Public School 2696 (2017)