2017 hotels in india trends & opportunities of black money ... 1 department of industrial policy...
TRANSCRIPT

Achin Khanna, MRICS
Managing Director
Sanaya JijinaAssociate
HVS | 2nd Floor, Paras Downtown Centre, Golf Course Road, Sector 53, Gurugram 122 002, INDIAHVS.com
2017
HOTELS IN INDIATRENDS & OPPORTUNITIES

PAGE 2 | 2017 HOTELS IN INDIA TRENDS & OPPORTUNITIES
SleepisSilver,butMoneyisGold!-CityofDjinns,WilliamDalrymple
Introduction
As the 6AM alarm blares at dawn, who doesn't finddelight in pressing the snooze button ever so often?After all, sleep is silver.However, brushing aside theslumber,theactivemindsketchestasksaheadandoneleaps into the daily bustle. Crafting ideas, plottingschedulesandplanningconquests,thebusinessoflifeand livelihood comes into play.While catching fortywinks every now and then may be acceptable, oneusuallywouldn'ttradethejobofmakingmoneywiththelibertytoindulgeindailyafternoonsiestas.Afterall,moneyisgold!
The Indian hospitality sector has woken up after alongishnapand,itisnowtimetosetthecashregistersringing. While an assortment of influences hadrepressedthesector'sendeavourstogrowfrom2009to2015,lastyearprovidedsufficientevidencethatthenextup-cyclewas in theoffing.Resultantly,2016/17playedwitnesstoayear,thathasinnouncertaintermsbeenpositiveonallfronts.Nationwideoccupancywasthe highest since 2008, countrywide average roomrates clocked a clear and measurable increase overseveralprecedingyearsandtheoverallsupply-demandscale is now tilted squarely in favour of growth indemandoutpacingnewsupply.The time to reaphasarrived and industry stakeholders must not losecognizanceofthefactthattheinherentcyclicalnatureofthehotelbusinesswouldallowthisopportunityonlyforafiniteperiod.Lestwechoosetodozeoffagain,itistime for us hoteliers to truly elevate the sectoralperformancetothenextlevel.Indeed,SleepisSilver,butMoneyisGold!
Number of Rooms (00's) Number of Hotels Average Number of Rooms Per Hotel
FIGURE 1: SURVEY PARTICIPATION (1995/96 – 2016/17)
Source: HVS Research
Forover20years,HVShasgathereddatapertainingtothe hotel performance of the country through theannualTrends&OpportunitiesSurvey.Theresultantreportdepictsandanalyseskeyhospitalitytrends,andpresentsHVS'outlook,withanemphasison13majorIndianmarkets.Itfurtheroutlinesexistingandfutureopportunities of specific interest to investors,developersandhoteloperators.
The survey participant base has registered amomentous growth since 1995/96 from 120 hotelswith 18,160 rooms to record 941 hotels with1,19,219roomsin2016/17,anincreaseof54hotelsand5,597roomsovertheprevioussurvey.
ThegrowingnumberofsurveyparticipantseachyeardemonstratesariseinbothHVS'penetrationintothemarket,aswellasthemarket'ssize.Moreover,wehavemademinoralterationstothesamplesetforthetwomostrecentyearsinanattempttoremoveunorganisedsupply. This in turn has led to the 2015/16 figuresundergoingaminorchangeacrossallparameters.
Additionally, like last year, we have weighted thenumberofroomnightstoaccountforthenewsupplythatwasnot operational for the entire fiscal year tocomputetheoveralloccupancyandaveragerate.Theweighted room count of the survey base for2016/17 is 1,15,044, up from 1,08,682 for2015/16.Figure1illustratesthesurveyparticipationforthefiscalyears1995/96to2016/17.
The Indian Economy – An Overview
Indiaisoneofthefastestgrowingmajoreconomiesinthe world. The acceleration of investment friendlypolicies,structuralreformsandlowcommoditypriceshasprovidedastrongimpetusforgrowth.Thecentral
18
2
18
3
21
4
23
2
21
6
25
5
25
6
27
1
28
9
31
2
33
5
34
8
39
7
42
4
49
5
58
6
69
8
86
1
99
3
1,0
85
1,1
36
1,1
92
12
0
12
2
16
3
18
0
17
4
19
9
19
9
21
5
21
1
23
5
25
2
26
8
31
6
34
9
40
7
46
2
55
1
71
7
81
4
87
2
88
7
94
1
151 150
131 129124 128 129 126
137 133 133 130126 122 122
127 127120 122 124 128 127
-
20
40
60
80
100
120
140
160
-
200
400
600
800
1,000
1,200
1,400
government, despite some criticisms, has introducedseveralprogrammesoverthepastyear,includingonesto augment the ease of doing business, encouragedigitalisation, reduce skill insufficiencies, fosterentrepreneurshipandboosturbandevelopment.Thesederegulation measures, both current as well asforeseeable,haveboostedForeignDirectInvestments(FDI),whichregisteredagrowthof8.0%in2016/17¹overtheprecedingyear.
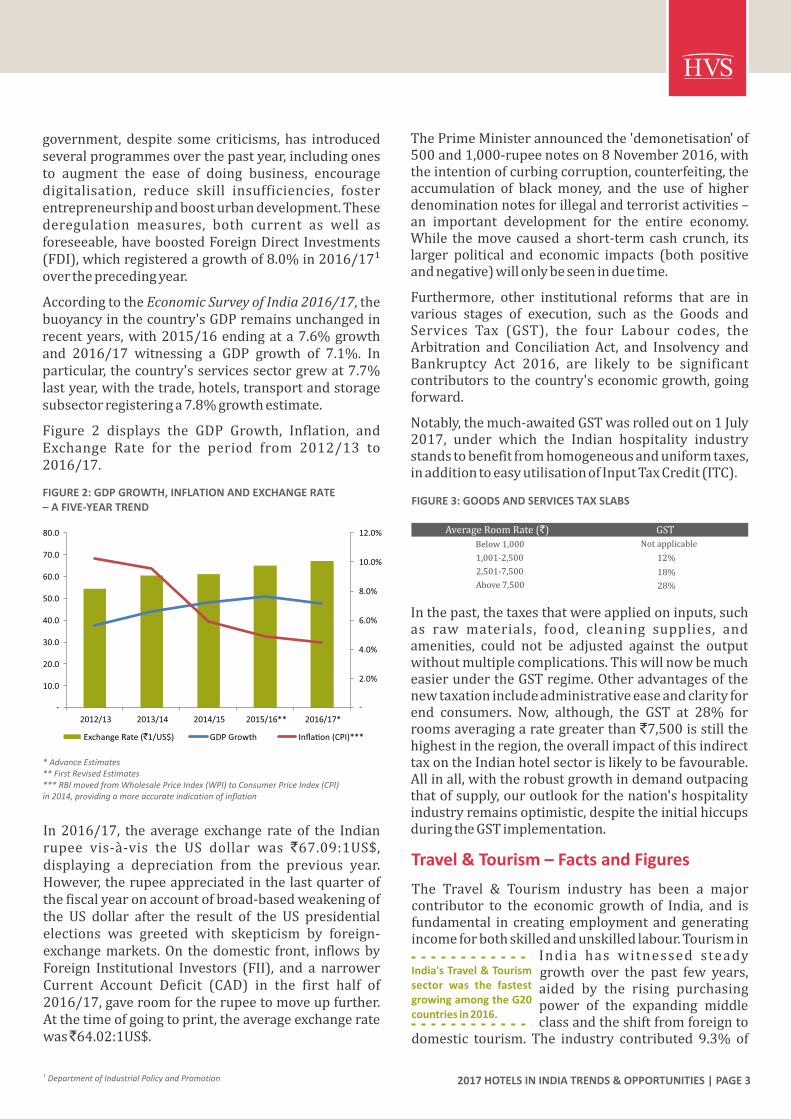
AccordingtotheEconomicSurveyofIndia2016/17,thebuoyancyinthecountry'sGDPremainsunchangedinrecentyears,with2015/16endingata7.6%growthand 2016/17 witnessing a GDP growth of 7.1%. Inparticular,thecountry'sservicessectorgrewat7.7%lastyear,withthetrade,hotels,transportandstoragesubsectorregisteringa7.8%growthestimate.
Figure 2 displays the GDP Growth, Inflation, andExchange Rate for the period from 2012/13 to2016/17.
-
10.0
20.0
30.0
40.0
50.0
60.0
70.0
80.0
2012/13 2013/14 2014/15 2015/16** 2016/17*
-
2.0%
4.0%
6.0%
8.0%
10.0%
12.0%
Exchange Rate (`1/US$) GDP Growth Infla�on (CPI)***
FIGURE 2: GDP GROWTH, INFLATION AND EXCHANGE RATE– A FIVE-YEAR TREND
* Advance Estimates** First Revised Estimates*** RBI moved from Wholesale Price Index (WPI) to Consumer Price Index (CPI) in 2014, providing a more accurate indication of inflation
In 2016/17, the average exchange rate of the Indianrupee vis-a-vis the US dollar was `67.09:1US$,displaying a depreciation from the previous year.However,therupeeappreciatedinthelastquarterofthefiscalyearonaccountofbroad-basedweakeningofthe US dollar after the result of the US presidentialelections was greeted with skepticism by foreign-exchangemarkets.On thedomestic front, inflowsbyForeign Institutional Investors (FII), and a narrowerCurrent Account Deficit (CAD) in the first half of2016/17,gaveroomfortherupeetomoveupfurther.Atthetimeofgoingtoprint,theaverageexchangeratewas 64.02:1US$.
ThePrimeMinisterannouncedthe'demonetisation'of500and1,000-rupeenoteson8November2016,withtheintentionofcurbingcorruption,counterfeiting,theaccumulation of blackmoney, and the use of higherdenominationnotesforillegalandterroristactivities–an important development for the entire economy.While themove causeda short-termcashcrunch, itslarger political and economic impacts (both positiveandnegative)willonlybeseeninduetime.
Furthermore, other institutional reforms that are invarious stages of execution, such as the Goods andServices Tax (GST), the four Labour codes, theArbitration and ConciliationAct, and Insolvency andBankruptcy Act 2016, are likely to be significantcontributorstothecountry'seconomicgrowth,goingforward.
Notably,themuch-awaitedGSTwasrolledouton1July2017, under which the Indian hospitality industrystandstobenefitfromhomogeneousanduniformtaxes,inadditiontoeasyutilisationofInputTaxCredit(ITC).
FIGURE 3: GOODS AND SERVICES TAX SLABS
AverageRoomRate(`) GST
Below1,000 Notapplicable
1,001-2,500 12%
2,501-7,500 18%
Above7,500 28%
Inthepast,thetaxesthatwereappliedoninputs,suchas raw materials, food, cleaning supplies, andamenities, could not be adjusted against the outputwithoutmultiplecomplications.ThiswillnowbemucheasierundertheGSTregime.Otheradvantagesofthenewtaxationincludeadministrativeeaseandclarityforend consumers. Now, although, the GST at 28% forroomsaveragingarategreaterthan`7,500isstillthehighestintheregion,theoverallimpactofthisindirecttaxontheIndianhotelsectorislikelytobefavourable.Allinall,withtherobustgrowthindemandoutpacingthatofsupply,ouroutlookforthenation'shospitalityindustryremainsoptimistic,despitetheinitialhiccupsduringtheGSTimplementation.
Travel & Tourism – Facts and Figures
The Travel & Tourism industry has been a majorcontributor to the economic growth of India, and isfundamental in creatingemployment andgeneratingincomeforbothskilledandunskilledlabour.Tourismin India has witnessed steady growth over the past few years, aided by the rising purchasing power of the expanding middle classandtheshiftfromforeigntodomestic tourism. The industry contributed 9.3% of
India's Travel & Tourism sector was the fastest growing among the G20 countries in 2016.
1 Department of Industrial Policy and Promotion 2017 HOTELS IN INDIA TRENDS & OPPORTUNITIES | PAGE 3

5.6%
7.8%
9.8%
8.5%
-
2.0%
4.0%
6.0%
8.0%
10.0%
12.0%
-
2,00,000
4,00,000
6,00,000
8,00,000
10,00,000
12,00,000
14,00,000
16,00,000
2012 2013 2014 2015 2016
Direct Contribu�on Total Contribu�on Percentage Change (Direct)
FIGURE 4: TRAVEL & TOURISM CONTRIBUTION TO INDIA'S GDP (2012 – 2016, ` CRORE)
Source: World Travel & Tourism Council's Economic Impact 2017 – India Report
88.0%
12.0%
Domes�c Spending Foreign Visitor Spending
² World Travel & Tourism Council's Economic Impact 2017 – India Report ³ World Travel & Tourism Council
FIGURE 5: SPENDING PATTERNS – CONTRIBUTION TO INDIA'S DIRECT TRAVEL & TOURISM GDP (2016)
5.4%
94.6%
Business SpendingLeisure Spending
FIGURE 7: FOREIGN TOURIST ARRIVALS AND DOMESTIC VISITATION TRENDS (2007 − 2016, IN LAKH)
Source: Ministry of Tourism, Government of India
2007 2008 2009 2010 2011 2012 2013 2014 2015 2016
Foreign Tourist Arrivals 50.8 52.8 51.7 57.8 63.1 65.8 69.7 76.8 80.3 88.0
% change 4.0% -2.2% 11.8% 9.2% 4.3% 5.9% 10.2% 4.5% 9.7%
Domestic Tourist Visits 5,267.0 5,630.3 6,688.0 7,477.0 8,645.3 10,450.5 11,425.3 12,828.0 14,319.7 16,135.5
% change 6.9% 18.8% 11.8% 15.6% 20.9% 9.3% 12.3% 11.6% 12.7%
FIGURE 8: FOREIGN TOURIST ARRIVALS BY SOURCE COUNTRIES (2016)
Bangladesh
15.7%
U.S.A.
14.7%
U.K.
10.7%
Canada
3.6%Malaysia
3.4%
Sri Lanka
3.4%
Germany
3.0%
France
2.7%
China (including
Taiwan)
3.4%
Australia
3.3%
Others
36.1%
Source: Ministry of Tourism, Government of India
FIGURE 9: TOP 15 BUSIEST AIRPORTS IN INDIA BY PASSENGER TRAFFIC(2015/16 – 2016/17, IN LAKH)
Delhi (DIAL)
Mumbai (MIAL)
Bengaluru (BIAL)
Chennai
Kolkata
Hyderabad (GHIAL)
Cochin (CIAL)
Ahmedabad
Goa
Pune
Source: Airports Authority of India
the total employment (both direct and indirect) in2016². India's Travel & Tourism sectorwas also thefastestgrowingamongtheG20countries,growingby8.5% in 2016³. The followingmatrices highlight theperformanceoftheTravel&TourismindustryinIndia.
FIGURE 6: INDIAN TRAVEL & TOURISM SECTOR – FOREIGN EXCHANGEEARNINGS (2012 – 2016, ` CRORE)
Foreign Exchange Earnings % Change
Source: India Tourism Statistics 2015 – Ministry of Tourism, Government of IndiaState/UT - Wise Domestic and Foreign Tourist Visits, 2015-2016, Ministry of TourismGovernment of India
14.0%
14.5%
9.6%
14.0%
-
2.0%
4.0%
6.0%
8.0%
10.0%
12.0%
14.0%
16.0%
-
20,000
40,000
60,000
80,000
1,00,000
1,20,000
1,40,000
1,60,000
2012 2013 2014 2015 2016
Lucknow
Thiruvananthapuram
Guwahati
Jaipur
Kozhikode
2015/16
484.2
416.7
189.7
152.2
127.6
123.9
77.5
64.8
53.8
54.2
32.4
34.7
27.8
28.9
23.1
2016/17
577.0
451.5
228.8
183.6
158.2
151.0
89.6
74.1
68.6
67.7
39.7
38.8
37.9
37.8
26.5
% Change
19.2%
8.4%
20.6%
20.7%
24.0%
21.9%
15.6%
14.3%
27.5%
25.0%
22.4%
11.8%
36.1%
31.0%
15.0%
PAGE 4 | 2017 HOTELS IN INDIA TRENDS & OPPORTUNITIES

Up, Up and A-Wait for it?On a nationwide basis, new branded and organisedsupply (when weighted for days open in 2016/17)grewbymerely5.9%overtheprecedingyear.Overalldemand increased by 9.6% in the same period.Marketwide occupancy of 65.6% was consequently3.5%higherthanthe2015/16performanceof63.3%.ItispertinenttonotethatthelasttimeIndiaregisteredanationwideoccupancythatwasnorthof65%wasin2007/08.
When viewed by positioning, Five-Star Deluxe andThree-Star hotels clocked66.5% occupancy each in2016/17, while Four-Starh o t e l s a c h i e ve d 6 5 . 6%occupancy. Five-Star hotelswerejustshyofthe65%markand closed at a nationwide
occupancy of 64.6%, whereas Two-Star hotelsmanaged62.7%.Therefore, it isapparentthathotelsacross all positioning benefited from the supply-demandgapthispastyear.Figure10,below,offersthe
nationwidesupplyanddemandperformancefora15-yearperiod.
AverageRoomRates(ARRs)toohaveshownpromiseasthe nationwide numbers appreciated by 2.4% in2016/17overlastfiscalandwerethehighestinfouryears.Thoughthisincreasewasexpectedtooccur,thedegree to which rates have grown continues to bemarginal. We have been analysing the average ratemovementcloselyforthepastseveraleditionsofthispublicationandhavecommentedat lengthaboutthesector'sinabilitytomovetheneedleontheARRfront.Wereiteratetheneedforrecognisingthefactthatthedemand-supplyequationtodayaswellas inthenext48-60 months is more than likely to present anopportunityforsubstantialaveragerateenhancementand,hoteloperatorsthatdraftstrategiestoseizethisoccasion will have a clear advantage. Indeed, theplanningforrateimprovementsmusthappennowandwhilesomemaychoosetoseekcomfortinthefactthattheirratesarenolongerdeclining,otherswillrealisethat a 2.4% nationwide increase in ARR is still sub-inflationarygrowth.Giventhealmostcertainelevationofoccupancyoverthenextfewyears,enhancingARRssignificantly only makes business sense. We hadmentionedlastyearthatonly2.5%ofIndia'sbrandedsupply averaged a year-round rate of more thanUS$200.Thatnumberwasat3.1%in2016/17.So,eventhoughtheneedleismovingintherightdirection,itspacecoulddowithsomeimprovement.Indiahassomeofthefinesthotelsinthispartoftheworld–bothinurbanaswellasleisuredestinations;theirinabilitytoearn a net room rate that is commensurate to theirproductandserviceofferingisunfortunate.
Available Room Nights Per Day Room Night Demand Per Day Occupancy
* 2015/16 data has been modified to remove the performance of irrelevant supplySource: HVS Research
Marketwide occupancy was r e c o r d e d a t 6 5 . 6 % i n 2016/17. It is pertinent to note that the last time India witnessed a nationwide occupancy that was north of 65% was in 2007/08!
FIGURE 10: ROOM NIGHT DEMAND VS AVAILABLE ROOM NIGHTS (2002/03 – 2016/17)
The Government of India has launched severalbrandingandmarketinginitiativessuchas'IncredibleIndia'and'AthitiDevoBhava',whichhaveprovidedafocuseddrivetogrowth.Ithasalsomadeseriouseffortstoboostinvestmentsinthetourismsectorbyallowing100% FDI through the automatic route. Moreover,'IncredibleIndia2.0'aimsatshowcasingthecountryasa spiritual and wellness destination; with this, thecountryispoisedtoemergeasanimportantwellnessdestinationinSouthAsia.
57.2%
64.8%
69.0%71.5% 71.4%
68.8%
59.5% 59.5% 60.6%
59.3% 57.8% 58.4%59.8%
63.3%65.6%
10.0%
20.0%
30.0%
40.0%
50.0%
60.0%
70.0%
80.0%
-
10,000
20,000
30,000
40,000
50,000
60,000
70,000
80,000
90,000
1,00,000
1,10,000
2017 HOTELS IN INDIA TRENDS & OPPORTUNITIES | PAGE 5
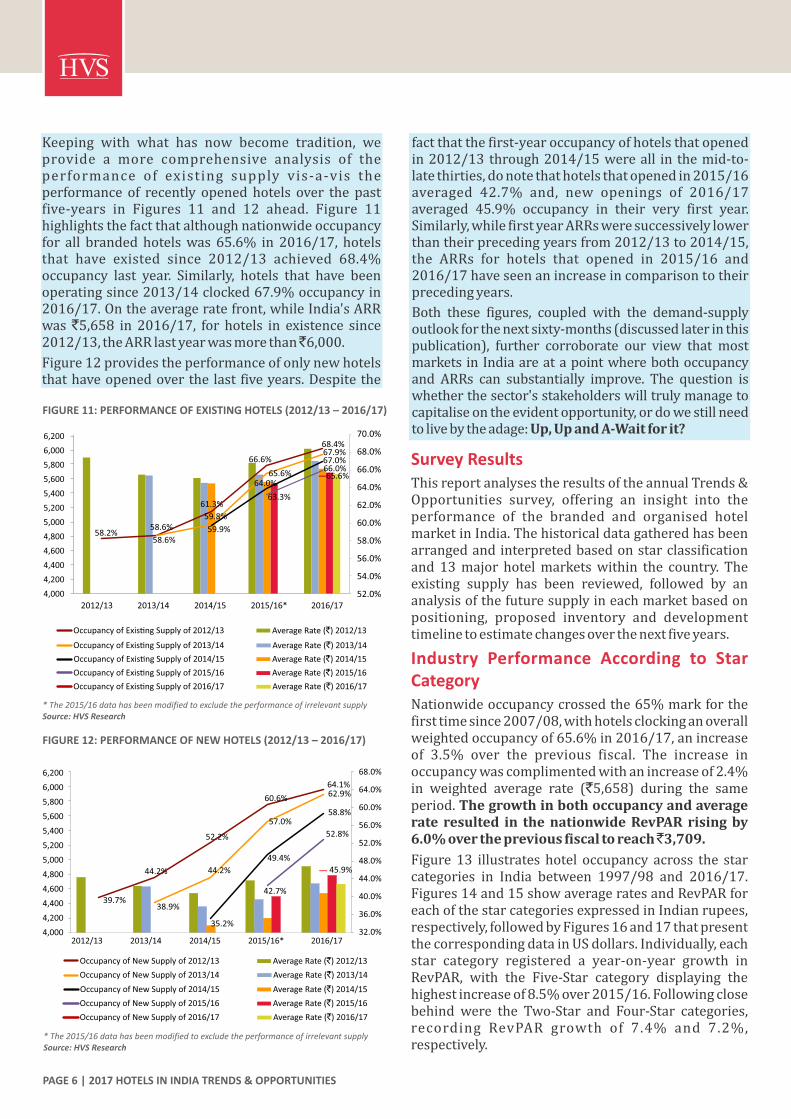
Keeping with what has now become tradition, weprovide a more comprehensive analysis of theperformance of existing supply vis-a-vis theperformance of recently openedhotels over the pastfive-years in Figures 11 and 12 ahead. Figure 11highlightsthefactthatalthoughnationwideoccupancyfor all brandedhotelswas 65.6% in 2016/17, hotelsthat have existed since 2012/13 achieved 68.4%occupancy last year. Similarly, hotels that have beenoperatingsince2013/14clocked67.9%occupancyin2016/17.Ontheaverageratefront,whileIndia'sARRwas`5,658 in 2016/17, for hotels in existence since2012/13,theARRlastyearwasmorethan 6,000.
Figure12providestheperformanceofonlynewhotelsthathaveopenedoverthelast fiveyears.Despitethe
FIGURE 11: PERFORMANCE OF EXISTING HOTELS (2012/13 – 2016/17)
* The 2015/16 data has been modified to exclude the performance of irrelevant supplySource: HVS Research
Survey ResultsThisreportanalysestheresultsoftheannualTrends&Opportunities survey, offering an insight into theperformance of the branded and organised hotelmarketinIndia.Thehistoricaldatagatheredhasbeenarrangedandinterpretedbasedonstarclassificationand 13major hotelmarketswithin the country. Theexisting supply has been reviewed, followed by ananalysisofthefuturesupplyineachmarketbasedonpositioning, proposed inventory and developmenttimelinetoestimatechangesoverthenextfiveyears.
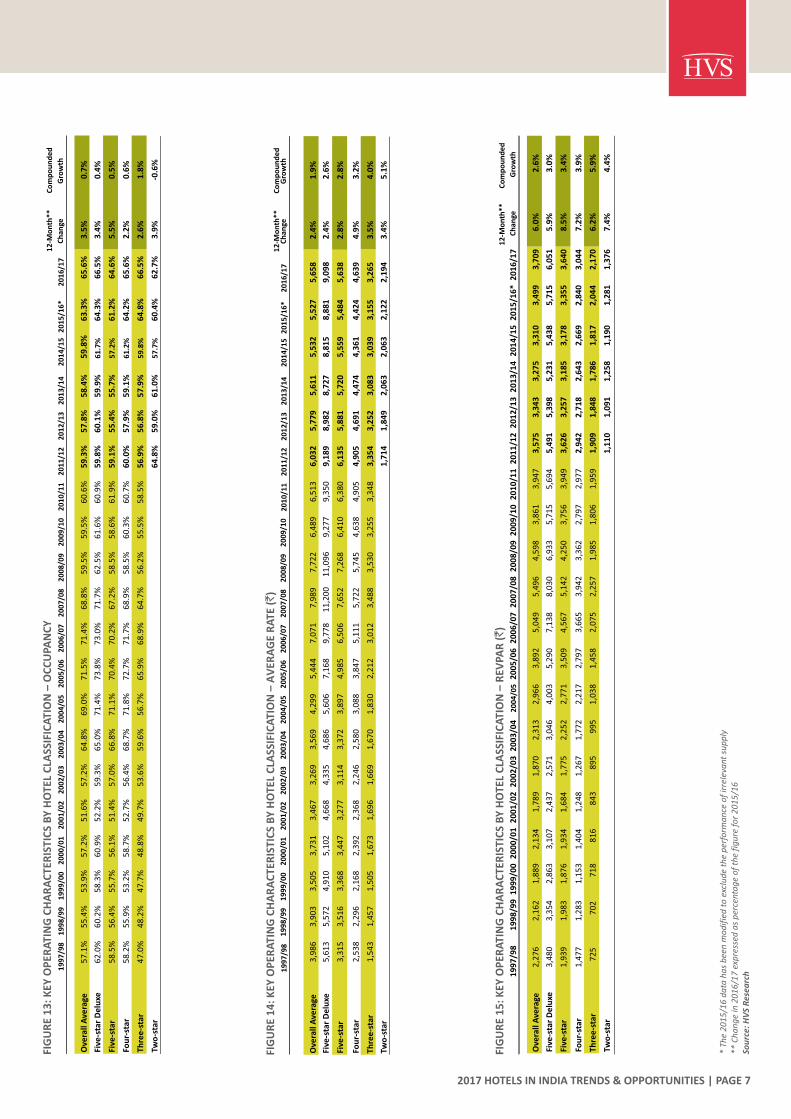
Industry Performance According to Star CategoryNationwideoccupancycrossedthe65%markforthefirsttimesince2007/08,withhotelsclockinganoverallweightedoccupancyof65.6%in2016/17,anincreaseof 3.5% over the previous fiscal. The increase inoccupancywascomplimentedwithanincreaseof2.4%in weighted average rate (`5,658) during the sameperiod.Thegrowthinbothoccupancyandaveragerate resulted in thenationwideRevPARrisingby6.0%overthepreviousfiscaltoreach 3,709.
Figure13 illustrateshotel occupancy across the starcategories in India between 1997/98 and 2016/17.Figures14and15showaverageratesandRevPARforeachofthestarcategoriesexpressedinIndianrupees,respectively,followedbyFigures16and17thatpresentthecorrespondingdatainUSdollars.Individually,eachstar category registered a year-on-year growth inRevPAR, with the Five-Star category displaying thehighestincreaseof8.5%over2015/16.Followingclosebehind were the Two-Star and Four-Star categories,recording RevPAR growth of 7.4% and 7.2%,respectively.
FIGURE 12: PERFORMANCE OF NEW HOTELS (2012/13 – 2016/17)
39.7%
44.2%
52.2%
60.6%
64.1%
38.9%
44.2%
57.0%
62.9%
35.2%
49.4%
58.8%
42.7%
52.8%
45.9%
32.0%
36.0%
40.0%
44.0%
48.0%
52.0%
56.0%
60.0%
64.0%
68.0%
4,000
4,200
4,400
4,600
4,800
5,000
5,200
5,400
5,600
5,800
6,000
6,200
2012/13 2013/14 2014/15 2015/16* 2016/17
* The 2015/16 data has been modified to exclude the performance of irrelevant supplySource: HVS Research
Average Rate (`) 2012/13
Average Rate (`) 2015/16
Average Rate (`) 2013/14
Average Rate (`) 2016/17
Average Rate (`) 2014/15
Occupancy of New Supply of 2013/14
Occupancy of New Supply of 2016/17
Occupancy of New Supply of 2014/15
Occupancy of New Supply of 2012/13
Occupancy of New Supply of 2015/16
Average Rate (`) 2012/13
Average Rate (`) 2015/16
Average Rate (`) 2013/14
Average Rate (`) 2016/17
Average Rate (`) 2014/15
Occupancy of Exis�ng Supply of 2013/14
Occupancy of Exis�ng Supply of 2016/17
Occupancy of Exis�ng Supply of 2014/15
Occupancy of Exis�ng Supply of 2012/13
Occupancy of Exis�ng Supply of 2015/16
factthatthefirst-yearoccupancyofhotelsthatopenedin2012/13through2014/15wereall inthemid-to-latethirties,donotethathotelsthatopenedin2015/16averaged 42.7% and, new openings of 2016/17averaged 45.9% occupancy in their very first year.Similarly,whilefirstyearARRsweresuccessivelylowerthantheirprecedingyearsfrom2012/13to2014/15,the ARRs for hotels that opened in 2015/16 and2016/17haveseenanincreaseincomparisontotheirprecedingyears.
Both these figures, coupled with the demand-supplyoutlookforthenextsixty-months(discussedlaterinthispublication), further corroborate our view that mostmarketsinIndiaareatapointwherebothoccupancyand ARRs can substantially improve. The question iswhetherthesector'sstakeholderswilltrulymanagetocapitaliseontheevidentopportunity,ordowestillneedtolivebytheadage:Up,UpandA-Waitforit?
PAGE 6 | 2017 HOTELS IN INDIA TRENDS & OPPORTUNITIES
52.0%
54.0%
56.0%
58.0%
60.0%
62.0%
64.0%
66.0%
68.0%
70.0%
4,000
4,200
4,400
4,600
4,800
5,000
5,200
5,400
5,600
5,800
6,000
6,200
2012/13 2013/14 2014/15 2015/16* 2016/17
58.2%58.6%
58.6%
61.3%
59.8%
59.9%
66.6%
65.6%64.0%
63.3%
68.4%67.9%67.0%66.0%65.6%
FIG
UR
E 1
4:
KEY
OP
ERA
TIN
G C
HA
RA
CTE
RIS
TIC
S B
Y H
OTE
L C
LASS
IFIC
ATI
ON
– A
VER
AG
E R
ATE
(`)
1
99
7/9
81
99
8/9
91
99
9/0
02
00
0/0
12
00
1/0
22
00
2/0
32
00
3/0
42
00
4/0
52
00
5/0
62
00
6/0
72
00
7/0
82
00
8/0
92
00
9/1
02
01
0/1
12
01
1/1
22
01
2/1
32
01
3/1
42
01
4/1
52
01
5/1
6*
20
16
/17
12
-Mo
nth
**
Ch
ange
Co
mp
ou
nd
ed
G
row
th
Ove
rall
Ave
rage
3,9
86
3,9
03
3,5
05
3,7
31
3,4
67
3,2
69
3,5
69
4,2
99
5,4
44
7,0
71
7,9
89
7,7
22
6,4
89
6,5
13
6,0
32
5,7
79
5,6
11
5,5
32
5,5
27
5,6
58
2.4
%1
.9%
Five
-sta
r D
elu
xe5
,61
35
,57
24
,91
05
,10
24
,66
84
,33
54
,68
65
,60
67
,16
89
,77
81
1,2
00
11
,09
69
,27
79
,35
09
,18
98
,98
28
,72
78
,81
58
,88
19
,09
82
.4%
2.6
%
Five
-sta
r 3
,31
53
,51
63
,36
83
,44
73
,27
73
,11
43
,37
23
,89
74
,98
56
,50
67
,65
27
,26
86
,41
06
,38
06
,13
55
,88
15
,72
05
,55
95
,48
45
,63
82
.8%
2.8
%
Fou
r-st
ar2
,53
82
,29
62
,16
82
,39
22
,36
82
,24
62
,58
03
,08
83
,84
75
,11
15
,72
25
,74
54
,63
84
,90
54
,90
54
,69
14
,47
44
,36
14
,42
44
,63
94
.9%
3.2
%
Thre
e-s
tar
1,5
43
1,4
57
1,5
05
1,6
73
1,6
96
1,6
69
1,6
70
1,8
30
2,2
12
3,0
12
3,4
88
3,5
30
3,2
55
3,3
48
3,3
54
3,2
52
3,0
83
3,0
39
3,1
55
3,2
65
3.5
%4
.0%
Two
-sta
r1
,71
41
,84
92
,06
32
,06
32
,12
22
,19
43
.4%
5.1
%
2017 HOTELS IN INDIA TRENDS & OPPORTUNITIES | PAGE 7
FIG
UR
E 1
5:
KEY
OP
ERA
TIN
G C
HA
RA
CTE
RIS
TIC
S B
Y H
OTE
L C
LASS
IFIC
ATI
ON
– R
EVPA
R (`)
Ove
rall
Ave
rage
Five
-sta
r D
elu
xe
Five
-sta
r
Fou
r-st
ar
Thre
e-s
tar
Two
-sta
r
12
-Mo
nth
**
Ch
ange
6.0
%
5.9
%
8.5
%
7.2
%
6.2
%
7.4
%
Co
mp
ou
nd
ed
Gro
wth
2.6
%
3.0
%
3.4
%
3.9
%
5.9
%
4.4
%
19
97
/98
2,2
76
3,4
80
1,9
39
1,4
77
72
5
19
98
/99
2,1
62
3,3
54
1,9
83
1,2
83
70
2
19
99
/00
1,8
89
2,8
63
1,8
76
1,1
53
71
8
20
00
/01
2,1
34
3,1
07
1,9
34
1,4
04
81
6
20
01
/02
1,7
89
2,4
37
1,6
84
1,2
48
84
3
20
02
/03
1,8
70
2,5
71
1,7
75
1,2
67
89
5
20
03
/04
2,3
13
3,0
46
2,2
52
1,7
72
99
5
20
04
/05
2,9
66
4,0
03
2,7
71
2,2
17
1,0
38
20
05
/06
3,8
92
5,2
90
3,5
09
2,7
97
1,4
58
20
06
/07
5,0
49
7,1
38
4,5
67
3,6
65
2,0
75
20
07
/08
5,4
96
8,0
30
5,1
42
3,9
42
2,2
57
20
08
/09
4,5
98
6,9
33
4,2
50
3,3
62
1,9
85
20
09
/10
3,8
61
5,7
15
3,7
56
2,7
97
1,8
06
20
10
/11
3,9
47
5,6
94
3,9
49
2,9
77
1,9
59
20
11
/12
3,5
75
5,4
91
3,6
26
2,9
42
1,9
09
1,1
10
20
12
/13
3,3
43
5,3
98
3,2
57
2,7
18
1,8
48
1,0
91
20
13
/14
3,2
75
5,2
31
3,1
85
2,6
43
1,7
86
1,2
58
20
14
/15
3,3
10
5,4
38
3,1
78
2,6
69
1,8
17
1,1
90
20
15
/16
*
3,4
99
5,7
15
3,3
55
2,8
40
2,0
44
1,2
81
20
16
/17
3,7
09
6,0
51
3,6
40
3,0
44
2,1
70
1,3
76
FIG
UR
E 1
3:
KEY
OP
ERA
TIN
G C
HA
RA
CTE
RIS
TIC
S B
Y H
OTE
L C
LASS
IFIC
ATI
ON
– O
CC
UPA
NC
Y
19
97
/98
19
98
/99
19
99
/00
20
00
/01
20
01
/02
20
02
/03
20
03
/04
20
04
/05
20
05
/06
20
06
/07
20
07
/08
20
08
/09
20
09
/10
20
10
/11
20
11
/12
20
12
/13
20
13
/14
20
14
/15
20
15
/16
*2
01
6/1
7
12
-Mo
nth
**
Ch
ange
Co
mp
ou
nd
ed
Gro
wth
Ove
rall
Ave
rage
57
.1%
55
.4%
53
.9%
57
.2%
51
.6%
57
.2%
64
.8%
69
.0%
71
.5%
71
.4%
68
.8%
59
.5%
59
.5%
60
.6%
59
.3%
57
.8%
58
.4%
59
.8%
63
.3%
65
.6%
3.5
%0
.7%
Five
-sta
r D
elu
xe6
2.0
%6
0.2
%5
8.3
%6
0.9
%5
2.2
%5
9.3
%6
5.0
%7
1.4
%7
3.8
%7
3.0
%7
1.7
%6
2.5
%6
1.6
%6
0.9
%5
9.8
%6
0.1
%5
9.9
%6
1.7
%6
4.3
%6
6.5
%3
.4%
0.4
%
Five
-sta
r 5
8.5
%5
6.4
%5
5.7
%5
6.1
%5
1.4
%5
7.0
%6
6.8
%7
1.1
%7
0.4
%7
0.2
%6
7.2
%5
8.5
%5
8.6
%6
1.9
%5
9.1
%5
5.4
%5
5.7
%5
7.2
%6
1.2
%6
4.6
%5
.5%
0.5
%
Fou
r-st
ar5
8.2
%5
5.9
%5
3.2
%5
8.7
%5
2.7
%5
6.4
%6
8.7
%7
1.8
%7
2.7
%7
1.7
%6
8.9
%5
8.5
%6
0.3
%6
0.7
%6
0.0
%5
7.9
%5
9.1
%6
1.2
%6
4.2
%6
5.6
%2
.2%
0.6
%
Thre
e-s
tar
47
.0%
48
.2%
47
.7%
48
.8%
49
.7%
53
.6%
59
.6%
56
.7%
65
.9%
68
.9%
64
.7%
56
.2%
55
.5%
58
.5%
56
.9%
56
.8%
57
.9%
59
.8%
64
.8%
66
.5%
2.6
%1
.8%
Two
-sta
r6
4.8
%5
9.0
%6
1.0
%5
7.7
%6
0.4
%6
2.7
%3
.9%
-0.6
%
* Th
e 2
01
5/1
6 d
ata
ha
s b
een
mo
dif
ied
to
exc
lud
e th
e p
erfo
rma
nce
of
irre
leva
nt s
up
ply
** C
ha
ng
e in
20
16
/17
exp
ress
ed a
s p
erce
nta
ge
of
the
fig
ure
fo
r 2
01
5/1
6So
urc
e: H
VS
Res
earc
h
FIG
UR
E 1
7:
KEY
OP
ERA
TIN
G C
HA
RA
CTE
RIS
TIC
S B
Y H
OTE
L C
LASS
IFIC
ATI
ON
– R
EVPA
R (
US$
)
* Th
e 2
01
5/1
6 d
ata
ha
s b
een
mo
dif
ied
to
exc
lud
e th
e p
erfo
rma
nce
of
irre
leva
nt s
up
ply
** C
ha
ng
e in
20
16
/17
exp
ress
ed a
s p
erce
nta
ge
of
the
fig
ure
fo
r 2
01
5/1
6So
urc
e: H
VS
Res
earc
h
Ove
rall
Ave
rage
Five
-sta
r D
elu
xe
Five
-sta
r
Fou
r-st
ar
Thre
e-s
tar
Two
-sta
r
12
-Mo
nth
**
Ch
ange
2.7
%
2.6
%
5.2
%
3.9
%
2.9
%
4.1
%
Co
mp
ou
nd
ed
G
row
th
-0.7
%
-0.3
%
0.1
%
0.6
%
2.6
%
-2.4
%
Exch
ange
Rat
e
19
97
/98 63
96 53
41
20
36
.3
19
98
/99
50 77
44
34 18
42
.2
19
99
/00 43
66 43
27
16
43
.5
20
00
/01
48 69 43
31
18
44
.9
20
01
/02
38 52
36
26
18
47
.2
20
02
/03
39 53
37
26 19
48
.2
20
03
/04 50
66 49
39
22
46
.0
20
04
/05
66 89
62
49 23
44
.9
20
05
/06 87
11
9
79 63
33
44
.5
20
06
/07
11
6
16
4
10
5
84 48
43
.6
20
07
/08
13
7
20
0
12
8
98
56
40
.2
20
08
/09
10
0
15
1
93
73
43
45
.9
20
09
/10 81
12
0 79
59
38
47
.7
20
10
/11
87
12
5
87 65
43
45
.6
20
11
/12
75
11
4 76 61
40 23
48
.0
20
12
/13
61
99
60
50
34 20
54
.5
20
13
/14
54
87
53
43
29
21
60
.7
20
14
/15
54 89
52
44 30 19
61
.2
20
15
/16
*
54
88
52
44
31
20
65
.0
20
16
/17
55
90
54 45
32
21
67
.1
PAGE 8 | 2017 HOTELS IN INDIA TRENDS & OPPORTUNITIES
Existing Supply – 2016/17
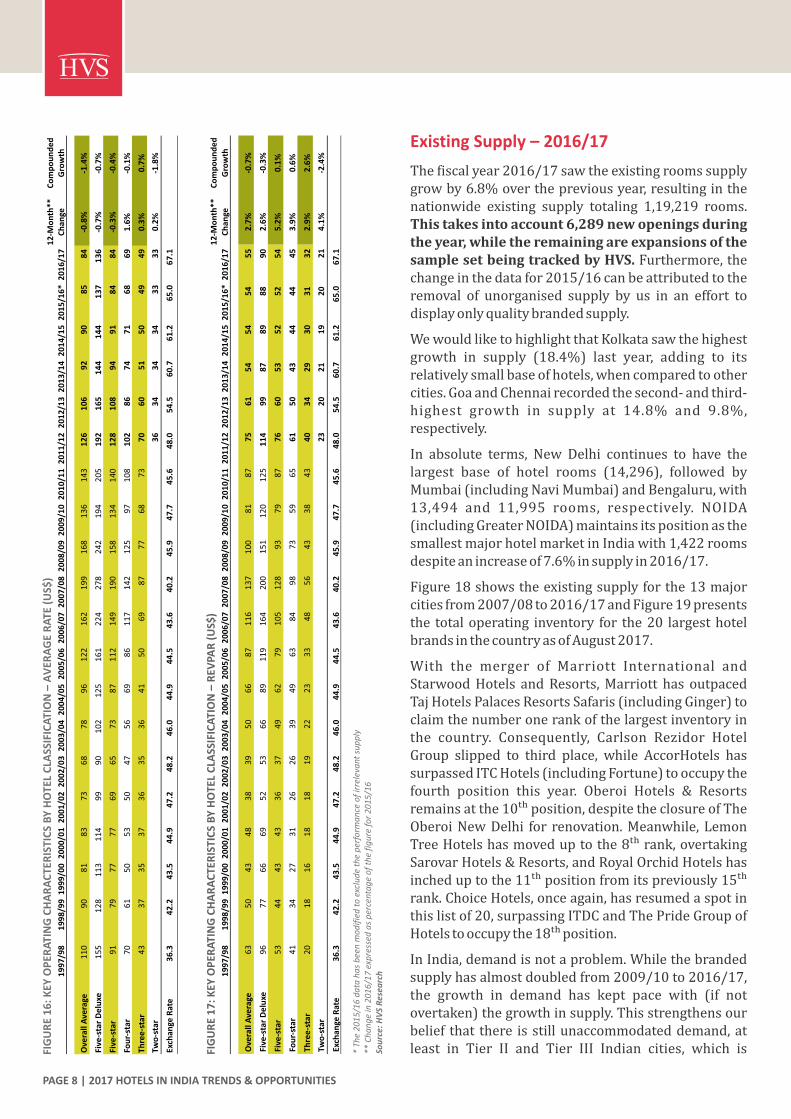
Thefiscalyear2016/17sawtheexistingroomssupplygrowby6.8%overthepreviousyear,resultinginthenationwide existing supply totaling 1,19,219 rooms.Thistakesintoaccount6,289newopeningsduringtheyear,whiletheremainingareexpansionsofthesamplesetbeingtrackedbyHVS.Furthermore,thechangeinthedatafor2015/16canbeattributedtotheremoval of unorganised supply by us in an effort todisplayonlyqualitybrandedsupply.
WewouldliketohighlightthatKolkatasawthehighestgrowth in supply (18.4%) last year, adding to itsrelativelysmallbaseofhotels,whencomparedtoothercities.GoaandChennairecordedthesecond-andthird-highest growth in supply at 14.8% and 9.8%,respectively.
In absolute terms, New Delhi continues to have thelargest base of hotel rooms (14,296), followed byMumbai(includingNaviMumbai)andBengaluru,with13,494 and 11,995 rooms, respectively. NOIDA(includingGreaterNOIDA)maintainsitspositionasthesmallestmajorhotelmarketinIndiawith1,422roomsdespiteanincreaseof7.6%insupplyin2016/17.
Figure18showstheexistingsupplyforthe13majorcitiesfrom2007/08to2016/17andFigure19presentsthe totaloperating inventory for the20 largesthotelbrandsinthecountryasofAugust2017.
With the merger of Marriott International andStarwoodHotels andResorts,Marriott has outpacedTajHotelsPalacesResortsSafaris(includingGinger)toclaimthenumberonerankofthelargestinventoryinthe country. Consequently, Carlson Rezidor HotelGroup slipped to third place, while AccorHotels hassurpassedITCHotels(includingFortune)tooccupythefourth position this year. Oberoi Hotels & Resortsremainsatthe10��position,despitetheclosureofTheOberoiNewDelhi for renovation.Meanwhile,LemonTreeHotelshasmoveduptothe8��rank,overtakingSarovarHotels&Resorts,andRoyalOrchidHotelshasincheduptothe11��positionfromitspreviously15��rank.ChoiceHotels,onceagain,hasresumedaspotinthislistof20,surpassingITDCandThePrideGroupofHotelstooccupythe18��position.
InIndia,demandisnotaproblem.Whilethebrandedsupplyhasalmostdoubledfrom2009/10to2016/17,the growth in demand has kept pace with (if notovertaken)thegrowthinsupply.Thisstrengthensourbelief that there isstillunaccommodateddemand,atleast in Tier II and Tier III Indian cities, which isFI
GU
RE
16
: K
EY O
PER
ATI
NG
CH
AR
AC
TER
ISTI
CS
BY
HO
TEL
CLA
SSIF
ICA
TIO
N –
AV
ERA
GE
RA
TE (
US$
)
Ove
rall
Ave
rage
Five
-sta
r D
elu
xe
Five
-sta
r
Fou
r-st
ar
Thre
e-s
tar
Two
-sta
r
12
-Mo
nth
**
Ch
ange
-0.8
%
-0.7
%
-0.3
%
1.6
%
0.3
%
0.2
%
Co
mp
ou
nd
ed
G
row
th
-1.4
%
-0.7
%
-0.4
%
-0.1
%
0.7
%
-1.8
%
Exch
ange
Rat
e
19
97
/98
11
0
15
5
91
70 43
36
.3
19
98
/99
90
12
8 79
61
37
42
.2
19
99
/00 81
11
3
77
50 35
43
.5
20
00
/01 83
11
4 77 53
37
44
.9
20
01
/02 73
99
69
50
36
47
.2
20
02
/03
68
90 65
47 35
48
.2
20
03
/04 78
10
2
73
56
36
46
.0
20
04
/05
96
12
5
87
69
41
44
.9
20
05
/06
12
2
16
1
11
2
86
50
44
.5
20
06
/07
16
2
22
4
14
9
11
7
69
43
.6
20
07
/08
19
9
27
8
19
0
14
2
87
40
.2
20
08
/09
16
8
24
2
15
8
12
5
77
45
.9
20
09
/10
13
6
19
4
13
4 97
68
47
.7
20
10
/11
14
3
20
5
14
0
10
8 73
45
.6
20
11
/12
12
6
19
2
12
8
10
2
70
36
48
.0
20
12
/13
10
6
16
5
10
8
86
60
34
54
.5
20
13
/14 92
14
4
94
74 51
34
60
.7
20
14
/15
90
14
4 91
71
50
34
61
.2
20
15
/16
*
85
13
7
84 68 49
33
65
.0
20
16
/17
84
13
6
84 69
49
33
67
.1

currentlybeingtappedbytheunbranded/unorganisedinventory.
Going forward, brands must be cognizant of themarkets they are entering. Over the past few years,duetothesurgeindomestictourism,hotelcompanieshaveshiftedtheirfocustowardbudgetandmidmarketpositionedhotelsinTierIIandTierIIIcitiestocatertothe lower paying domestic traveler and to capturethe previously untapped demand that exists inthesecities.
Future Supply
Given thedynamicnatureof thehospitality industryandtheever-changingproposedsupplylandscape,itisimpossible to determinewith absolute certainty theexacttimelineforhotelopenings.Thereareanumberofexternalforceswhichcandelayprojectsforvariousreasons.Overtheyears,HVShas followedacautiousand comprehensive approach for tracking newhoteldevelopmentsthatarelikelytoentermarketsoverthenextfiveyears.Theinformation,thatissystematically
12-Month* Compounded
2007/08 2008/09 2009/10 2010/11 2011/12 2012/13 2013/14 2014/15 2015/16** 2016/17 Change Growth
Agra 1,336 1,419 1,439 1,439 1,739 1,299 1,293 1,755 2,036 2,092 2.8% 5.1%
Ahmedabad 675 800 1,521 1,785 1,975 2,477 2,777 2,944 3,054 3,117 2.1% 18.5%
Bengaluru 3,456 3,889 5,597 5,947 7,713 8,536 10,162 11,117 11,539 11,995 4.0% 14.8%
Chennai 2,826 3,307 3,806 4,066 4,904 6,330 7,105 7,444 7,585 8,332 9.8% 12.8%
New Delhi*** 9,019 8,625 8,129 9,111 10,697 11,338 12,370 13,193 14,142 14,296 1.1% 5.3%
Gurugram 1,980 3,246 3,782 4,559 5,190 5,323 5,117 5,263 2.9% 15.0%
NOIDA 300 351 527 841 1,239 1,322 1,322 1,422 7.6% 24.9%
Goa 2,768 2,795 3,288 3,375 3,885 4,406 4,703 5,298 5,574 6,400 14.8% 9.8%
Hyderabad 2,554 2,761 3,782 4,036 4,797 5,411 5,734 5,954 5,992 6,254 4.4% 10.5%
Jaipur 1,556 1,683 2,472 2,554 3,054 4,129 4,523 4,822 4,931 5,058 2.6% 14.0%
Kolkata 1,396 1,373 1,520 1,588 1,787 2,163 2,243 2,701 2,701 3,199 18.4% 9.7%
Mumbai 8,454 7,948 9,877 11,303 12,052 12,807 13,022 12,865 13,054 13,494 3.4% 5.3%
Pune 1,346 1,518 2,672 4,691 5,672 5,317 6,159 6,137 6,108 6,445 5.5% 19.0%
Other Ci�es**** 11,596 12,357 15,412 18,039 21,729 24,642 24,657 26,820 28,445 31,852 12.0% 11.9%
FIGURE 18: EXISTING SUPPLY ACROSS MAJOR CITIES (2007/08 – 2016/17)
* Change in 2016/17 expressed as percentage of the figure for 2015/16** Supply tracked in 2015/16 has been modified due to the removal of irrelevant supply*** Delhi NCR data (Shaded Portion), rest New Delhi (excluding Gurugram, NOIDA and Greater NOIDA) data**** Other Cities includes all other hotel markets across India
, , , , , , , , , , , , , ,
FIGURE 19: TOP 20 HOTEL BRANDS BY EXISTING INVENTORY (AUGUST 2017)
Source: HVS Research
-
2,000
4,000
6,000
8,000
10,000
12,000
14,000
16,000
Number of Rooms
2017 HOTELS IN INDIA TRENDS & OPPORTUNITIES | PAGE 9
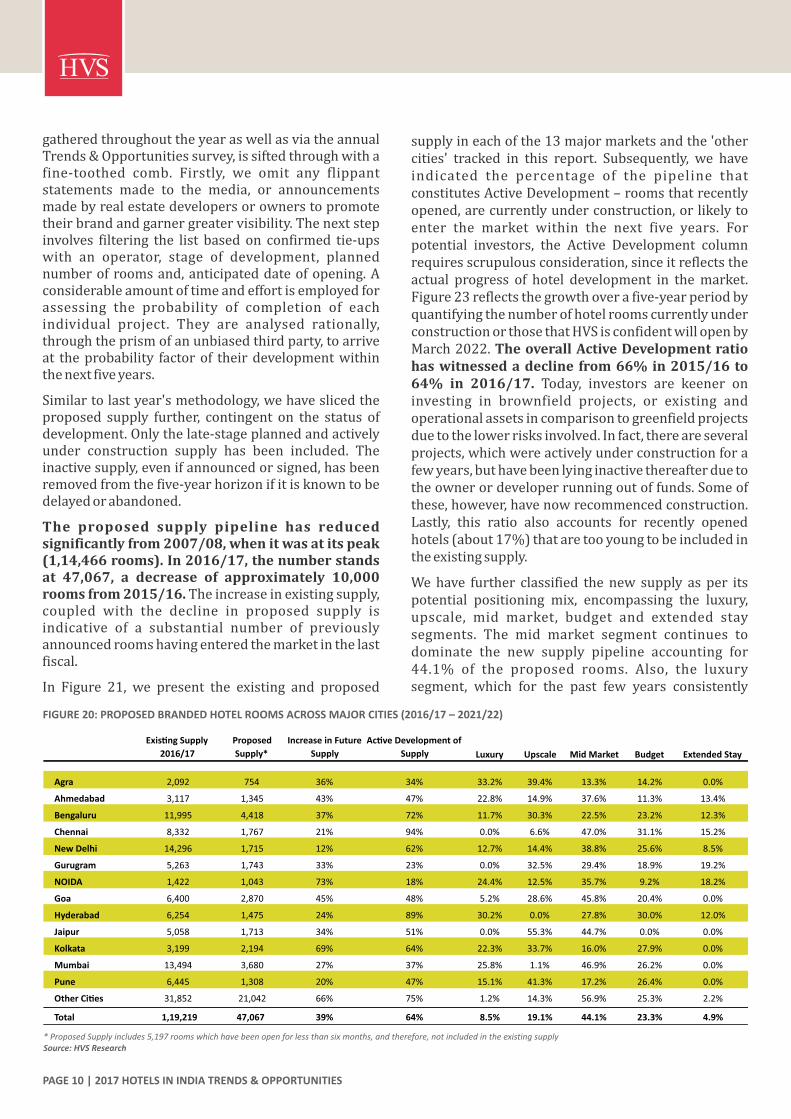
FIGURE 20: PROPOSED BRANDED HOTEL ROOMS ACROSS MAJOR CITIES (2016/17 – 2021/22)
* Proposed Supply includes 5,197 rooms which have been open for less than six months, and therefore, not included in the existing supplySource: HVS Research
Exis�ng Supply
2016/17
Proposed
Supply*
Increase in Future
Supply
Ac�ve Development of
Supply Luxury Upscale Mid Market Budget Extended Stay
Agra 2,092 754 36% 34% 33.2% 39.4% 13.3% 14.2% 0.0%
Ahmedabad 3,117 1,345 43% 47% 22.8% 14.9% 37.6% 11.3% 13.4%
Bengaluru 11,995 4,418 37% 72% 11.7% 30.3% 22.5% 23.2% 12.3%
Chennai 8,332 1,767 21% 94% 0.0% 6.6% 47.0% 31.1% 15.2%
New Delhi 14,296 1,715 12% 62% 12.7% 14.4% 38.8% 25.6% 8.5%
Gurugram 5,263 1,743 33% 23% 0.0% 32.5% 29.4% 18.9% 19.2%
NOIDA 1,422 1,043 73% 18% 24.4% 12.5% 35.7% 9.2% 18.2%
Goa 6,400 2,870 45% 48% 5.2% 28.6% 45.8% 20.4% 0.0%
Hyderabad 6,254 1,475 24% 89% 30.2% 0.0% 27.8% 30.0% 12.0%
Jaipur 5,058 1,713 34% 51% 0.0% 55.3% 44.7% 0.0% 0.0%
Kolkata 3,199 2,194 69% 64% 22.3% 33.7% 16.0% 27.9% 0.0%
Mumbai 13,494 3,680 27% 37% 25.8% 1.1% 46.9% 26.2% 0.0%
Pune 6,445 1,308 20% 47% 15.1% 41.3% 17.2% 26.4% 0.0%
Other Ci�es 31,852 21,042 66% 75% 1.2% 14.3% 56.9% 25.3% 2.2%
Total 1,19,219 47,067 39% 64% 8.5% 19.1% 44.1% 23.3% 4.9%
gatheredthroughouttheyearaswellasviatheannualTrends&Opportunitiessurvey,issiftedthroughwithafine-toothed comb. Firstly, we omit any flippantstatements made to the media, or announcementsmadebyrealestatedevelopersorownerstopromotetheirbrandandgarnergreatervisibility.Thenextstepinvolves filtering the list based on confirmed tie-upswith an operator, stage of development, plannednumberofroomsand,anticipateddateofopening.Aconsiderableamountoftimeandeffortisemployedforassessing the probability of completion of eachindividual project. They are analysed rationally,throughtheprismofanunbiasedthirdparty,toarriveat theprobability factorof theirdevelopmentwithinthenextfiveyears.
Similartolastyear'smethodology,wehaveslicedtheproposed supply further, contingent on the status ofdevelopment.Onlythelate-stageplannedandactivelyunder construction supply has been included. Theinactivesupply,evenifannouncedorsigned,hasbeenremovedfromthefive-yearhorizonifitisknowntobedelayedorabandoned.
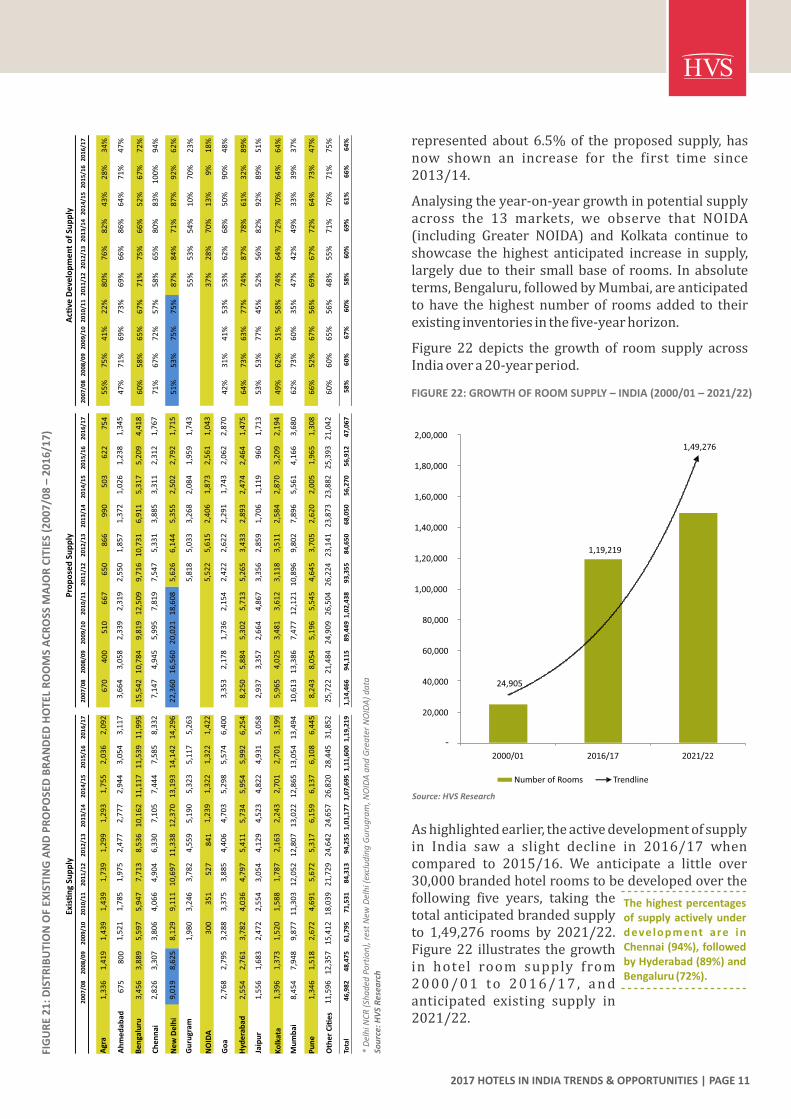
The proposed supply pipeline has reducedsignificantlyfrom2007/08,whenitwasatitspeak(1,14,466rooms).In2016/17,thenumberstandsat 47,067, a decrease of approximately 10,000roomsfrom2015/16.Theincreaseinexistingsupply,coupled with the decline in proposed supply isindicative of a substantial number of previouslyannouncedroomshavingenteredthemarketinthelastfiscal.
In Figure 21, we present the existing and proposed
supplyineachofthe13majormarketsandthe'othercities' tracked in this report. Subsequently, we haveindicated the percentage of the pipeline thatconstitutesActiveDevelopment–roomsthatrecentlyopened,arecurrentlyunderconstruction,orlikelytoenter the market within the next five years. Forpotential investors, the Active Development columnrequiresscrupulousconsideration,sinceitreflectstheactual progress of hotel development in themarket.Figure23reflectsthegrowthoverafive-yearperiodbyquantifyingthenumberofhotelroomscurrentlyunderconstructionorthosethatHVSisconfidentwillopenbyMarch2022.TheoverallActiveDevelopmentratiohaswitnessedadecline from66%in2015/16to64% in 2016/17. Today, investors are keener oninvesting in brownfield projects, or existing andoperationalassetsincomparisontogreenfieldprojectsduetothelowerrisksinvolved.Infact,thereareseveralprojects,whichwereactivelyunderconstructionforafewyears,buthavebeenlyinginactivethereafterduetotheownerordeveloperrunningoutoffunds.Someofthese,however,havenowrecommencedconstruction.Lastly, this ratio also accounts for recently openedhotels(about17%)thataretooyoungtobeincludedintheexistingsupply.
Wehave further classified the new supply as per itspotential positioning mix, encompassing the luxury,upscale, mid market, budget and extended staysegments. The mid market segment continues todominate the new supply pipeline accounting for44.1% of the proposed rooms. Also, the luxurysegment, which for the past few years consistently
PAGE 10 | 2017 HOTELS IN INDIA TRENDS & OPPORTUNITIES
FIG
UR
E 2
1:
DIS
TRIB
UTI
ON
OF
EXIS
TIN
G A
ND
PR
OP
OSE
D B
RA
ND
ED H
OTE
L R
OO
MS
AC
RO
SS M
AJO
R C
ITIE
S (2
00
7/0
8 –
20
16
/17
)
* D
elh
i NC
R (
Sha
ded
Po
rtio
n),
res
t N
ew D
elh
i (ex
clu
din
g G
uru
gra
m, N
OID
A a
nd
Gre
ate
r N
OID
A)
da
taSo
urc
e: H
VS
Res
earc
h
Exis
�n
g Su
pp
lyP
rop
ose
d S
up
ply
Ac�
ve D
eve
lop
me
nt
of
Sup
ply
FIGURE 22: GROWTH OF ROOM SUPPLY – INDIA (2000/01 – 2021/22)
Source: HVS Research
Number of Rooms Trendline
Agr
a1
,29
91
,29
31
,75
52
,03
62
,09
26
70
40
05
10
66
76
50
1,3
36
1,4
19
86
69
90
1,4
39
50
31
,43
96
22
75
41
,73
95
5%
75
%4
1%
22
%8
0%
76
%8
2%
43
%2
8%
34
%
Ah
me
dab
ad2
,47
72
,77
72
,94
43
,05
43
,11
73
,66
43
,05
82
,33
92
,31
92
,55
06
75
80
01
,85
71
,37
21
,52
11
,02
61
,78
51
,23
81
,34
51
,97
54
7%
71
%6
9%
73
%6
9%
66
%8
6%
64
%7
1%
47
%
Be
nga
luru
8,5
36
10
,16
21
1,1
17
11
,53
91
1,9
95
15
,54
21
0,7
84
9,8
19
12
,50
99
,71
63
,45
63
,88
91
0,7
31
6,9
11
5,5
97
5,3
17
5,9
47
5,2
09
4,4
18
7,7
13
60
%5
8%
65
%6
7%
71
%7
5%
66
%5
2%
67
%7
2%
Ch
en
nai
6,3
30
7,1
05
7,4
44
7,5
85
8,3
32
7,1
47
4,9
45
5,9
95
7,8
19
7,5
47
2,8
26
3,3
07
5,3
31
3,8
85
3,8
06
3,3
11
4,0
66
2,3
12
1,7
67
4,9
04
71
%6
7%
72
%5
7%
58
%6
5%
80
%8
3%
10
0%
94
%
Ne
w D
elh
i1
1,3
38
12
,37
01
3,1
93
14
,14
21
4,2
96
22
,36
01
6,5
60
20
,02
11
8,6
08
5,6
26
9,0
19
8,6
25
6,1
44
5,3
55
8,1
29
2,5
02
9,1
11
2,7
92
1,7
15
10
,69
75
1%
53
%7
5%
75
%8
7%
84
%7
1%
87
%9
2%
62
%
Gu
rugr
am4
,55
95
,19
05
,32
35
,11
75
,26
35
,81
85
,03
33
,26
81
,98
02
,08
43
,24
61
,95
91
,74
33
,78
25
5%
53
%5
4%
10
%7
0%
23
%
NO
IDA
84
11
,23
91
,32
21
,32
21
,42
25
,52
25
,61
52
,40
63
00
1,8
73
35
12
,56
11
,04
35
27
37
%2
8%
70
%1
3%
9%
18
%
Go
a4
,40
64
,70
35
,29
85
,57
46
,40
03
,35
32
,17
81
,73
62
,15
42
,42
22
,76
82
,79
52
,62
22
,29
13
,28
81
,74
33
,37
52
,06
22
,87
03
,88
54
2%
31
%4
1%
53
%5
3%
62
%6
8%
50
%9
0%
48
%
Hyd
era
bad
5,4
11
5,7
34
5,9
54
5,9
92
6,2
54
8,2
50
5,8
84
5,3
02
5,7
13
5,2
65
2,5
54
2,7
61
3,4
33
2,8
93
3,7
82
2,4
74
4,0
36
2,4
64
1,4
75
4,7
97
64
%7
3%
63
%7
7%
74
%8
7%
78
%6
1%
32
%8
9%
Jaip
ur
4,1
29
4,5
23
4,8
22
4,9
31
5,0
58
2,9
37
3,3
57
2,6
64
4,8
67
3,3
56
1,5
56
1,6
83
2,8
59
1,7
06
2,4
72
1,1
19
2,5
54
96
01
,71
33
,05
45
3%
53
%7
7%
45
%5
2%
56
%8
2%
92
%8
9%
51
%
Ko
lkat
a2
,16
32
,24
32
,70
12
,70
13
,19
95
,96
54
,02
53
,48
13
,61
23
,11
81
,39
61
,37
33
,51
12
,58
41
,52
02
,87
01
,58
83
,20
92
,19
41
,78
74
9%
62
%5
1%
58
%7
4%
64
%7
2%
70
%6
4%
64
%
Mu
mb
ai1
2,8
07
13
,02
21
2,8
65
13
,05
41
3,4
94
10
,61
31
3,3
86
7,4
77
12
,12
11
0,8
96
8,4
54
7,9
48
9,8
02
7,8
96
9,8
77
5,5
61
11
,30
34
,16
63
,68
01
2,0
52
62
%7
3%
60
%3
5%
47
%4
2%
49
%3
3%
39
%3
7%
Pu
ne
5,3
17
6,1
59
6,1
37
6,1
08
6,4
45
8,2
43
8,0
54
5,1
96
5,5
45
4,6
45
1,3
46
1,5
18
3,7
05
2,6
20
2,6
72
2,0
05
4,6
91
1,9
65
1,3
08
5,6
72
66
%5
2%
67
%5
6%
69
%6
7%
72
%6
4%
73
%4
7%
Oth
er
Ci�
es
24
,64
22
4,6
57
26
,82
02
8,4
45
31
,85
22
5,7
22
21
,48
42
4,9
09
26
,50
42
6,2
24
11
,59
61
2,3
57
23
,14
12
3,8
73
15
,41
22
3,8
82
18
,03
92
5,3
93
21
,04
22
1,7
29
60
%6
0%
65
%5
6%
48
%5
5%
71
%7
0%
71
%7
5%
20
08
/09
20
12
/13
20
13
/14
20
14
/15
20
15
/16
20
16
/17
20
07
/08
20
08
/09
20
09
/10
20
10
/11
20
11
/12
20
07
/08
20
12
/13
20
13
/14
20
09
/10
20
14
/15
20
10
/11
20
15
/16
20
16
/17
20
11
/12
20
07
/08
20
08
/09
20
09
/10
20
10
/11
20
11
/12
20
12
/13
20
13
/14
20
14
/15
20
15
/16
20
16
/17
Tota
l9
4,2
55
1,0
1,1
77
1,0
7,6
95
1,1
1,6
00
1,1
9,2
19
1,1
4,4
66
94
,11
58
9,4
49
1,0
2,4
38
93
,35
54
6,9
82
48
,47
58
4,6
50
68
,05
06
1,7
95
56
,27
07
1,5
31
56
,91
24
7,0
67
84
,31
35
8%
60
%6
7%
60
%5
8%
60
%6
9%
61
%6
6%
64
%
24,905
1,19,219
1,49,276
40,000
60,000
80,000
1,00,000
1,20,000
1,40,000
1,60,000
1,80,000
2,00,000
20,000
2000/01 2016/17 2021/22
-
represented about 6.5%of theproposed supply, hasnow shown an increase for the first time since2013/14.
Analysingtheyear-on-yeargrowthinpotentialsupplyacross the 13 markets, we observe that NOIDA(including Greater NOIDA) and Kolkata continue toshowcase the highest anticipated increase in supply,largelydue to their smallbaseof rooms. Inabsoluteterms,Bengaluru,followedbyMumbai,areanticipatedtohave thehighestnumberof roomsadded to theirexistinginventoriesinthefive-yearhorizon.
Figure 22 depicts the growth of room supply acrossIndiaovera20-yearperiod.
Ashighlightedearlier,theactivedevelopmentofsupplyin India saw a slight decline in 2016/17 whencompared to 2015/16. We anticipate a little over30,000brandedhotelroomstobedevelopedoverthefollowing five years, taking thetotalanticipatedbrandedsupplyto 1,49,276 rooms by 2021/22.Figure22 illustrates thegrowthin hotel room supply from2000/01 to 2016/17 , andanticipated existing supply in2021/22.
The highest percentages of supply actively under development are in Chennai (94%), followed by Hyderabad (89%) and Bengaluru (72%).
2017 HOTELS IN INDIA TRENDS & OPPORTUNITIES | PAGE 11
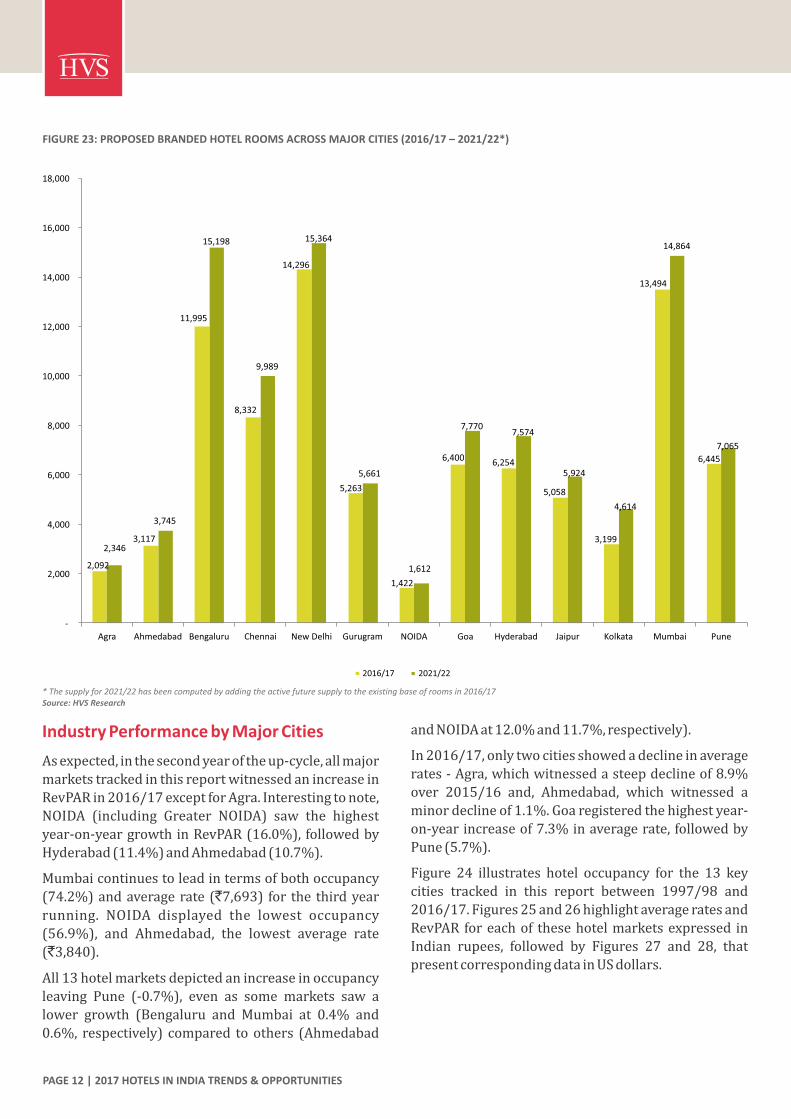
FIGURE 23: PROPOSED BRANDED HOTEL ROOMS ACROSS MAJOR CITIES (2016/17 – 2021/22*)
* The supply for 2021/22 has been computed by adding the active future supply to the existing base of rooms in 2016/17Source: HVS Research
2016/17 2021/22
2,092
3,117
11,995
8,332
14,296
5,263
1,422
6,400 6,254
5,058
3,199
13,494
6,445
2,346
3,745
15,198
9,989
15,364
5,661
1,612
7,770 7,574
5,924
4,614
14,864
7,065
-
2,000
4,000
6,000
8,000
10,000
12,000
14,000
16,000
18,000
Agra Ahmedabad Bengaluru Chennai New Delhi Gurugram NOIDA Goa Hyderabad Jaipur Kolkata Mumbai Pune
Industry Performance by Major Cities
Asexpected,inthesecondyearoftheup-cycle,allmajor
marketstrackedinthisreportwitnessedanincreasein
RevPARin2016/17exceptforAgra.Interestingtonote,
NOIDA (including Greater NOIDA) saw the highest
year-on-yeargrowthinRevPAR(16.0%),followedby
Hyderabad(11.4%)andAhmedabad(10.7%).
Mumbaicontinuestoleadintermsofbothoccupancy
(74.2%)andaveragerate (`7,693) for the thirdyear
running. NOIDA displayed the lowest occupancy
(56.9%), and Ahmedabad, the lowest average rate
(`3,840).
All13hotelmarketsdepictedanincreaseinoccupancy
leaving Pune (-0.7%), even as some markets saw a
lower growth (Bengaluru and Mumbai at 0.4% and
0.6%, respectively) compared toothers (Ahmedabad
andNOIDAat12.0%and11.7%,respectively).
In2016/17,onlytwocitiesshowedadeclineinaverage
rates-Agra,whichwitnessedasteepdeclineof8.9%
over 2015/16 and, Ahmedabad, which witnessed a
minordeclineof1.1%.Goaregisteredthehighestyear-
on-yearincreaseof7.3%inaveragerate,followedby
Pune(5.7%).
Figure 24 illustrates hotel occupancy for the 13 key
cities tracked in this report between 1997/98 and
2016/17.Figures25and26highlightaverageratesand
RevPARforeachof thesehotelmarketsexpressed in
Indian rupees, followed by Figures 27 and 28, that
presentcorrespondingdatainUSdollars.
PAGE 12 | 2017 HOTELS IN INDIA TRENDS & OPPORTUNITIES

FIG
UR
E 2
4:
KEY
OP
ERA
TIN
G C
HA
RA
CTE
RIS
TIC
S B
Y M
AJO
R C
ITIE
S −
OC
CU
PAN
CY
* Th
e 2
01
5/1
6 d
ata
ha
s b
een
mo
dif
ied
to
exc
lud
e th
e p
erfo
rma
nce
of
irre
leva
nt s
up
ply
** C
ha
ng
e in
20
16
/17
exp
ress
ed a
s p
erce
nta
ge
of
the
fig
ure
fo
r 2
01
5/1
6�
Del
hi N
CR
da
ta (
Sha
ded
Po
rtio
n),
res
t N
ew D
elh
i (ex
clu
din
g G
uru
gra
m, N
OID
A a
nd
Gre
ate
r N
OID
A)
da
ta�
NO
IDA
da
ta in
clu
des
Gre
ate
r N
OID
A�
Mu
mb
ai d
ata
incl
ud
es N
avi
Mu
mb
ai
Sou
rce:
HV
S R
esea
rch
12
-Mo
nth
**
Ch
ange
Agr
a6
.1%
1.5
%
Ah
me
dab
ad1
2.0
%-0
.7%
Be
nga
luru
0.4
%0
.4%
Ch
en
nai
4.3
%-0
.2%
Ne
w D
elh
ia5
.5%
0.8
%
Gu
rugr
am4
.5%
0.1
%
NO
IDAb
11
.7%
-3.7
%
Go
a3
.0%
1.1
%
Hyd
era
bad
7.2
%0
.9%
Jaip
ur
6.9
%1
.2%
Ko
lkat
a1
.4%
0.7
%
Mu
mb
aic
20
01
/02
33
.7%
53
.2%
64
.3%
56
.5%
53
.3%
53
.6%
68
.0%
48
.3%
66
.4%
52
.0%
0.6
%0
.7%
Pu
ne
19
97
/98
46
.1%
71
.8%
61
.2%
68
.4%
60
.2%
59
.2%
53
.4%
51
.7%
61
.8%
65
.3%
19
98
/99
46
.4%
58
.0%
59
.0%
64
.7%
54
.1%
58
.6%
66
.0%
45
.6%
57
.8%
67
.6%
19
99
/00
40
.1%
50
.8%
64
.4%
65
.3%
52
.9%
53
.3%
61
.3%
47
.0%
54
.8%
64
.5%
20
00
/01
42
.5%
55
.8%
69
.8%
64
.6%
58
.9%
60
.6%
69
.1%
55
.0%
62
.9%
64
.6%
20
02
/03
30
.7%
53
.8%
72
.0%
58
.3%
60
.4%
60
.5%
68
.9%
44
.9%
65
.4%
63
.4%
71
.0%
20
03
/04
50
.0%
63
.2%
78
.5%
66
.6%
73
.1%
59
.3%
75
.9%
58
.8%
62
.8%
69
.7%
68
.9%
20
04
/05
57
.1%
68
.3%
81
.4%
72
.9%
79
.1%
62
.5%
78
.7%
67
.2%
69
.0%
72
.0%
86
.4%
20
05
/06
56
.0%
69
.1%
76
.7%
78
.2%
80
.8%
67
.8%
82
.0%
65
.7%
76
.4%
76
.2%
83
.1%
20
06
/07
58
.9%
67
.9%
72
.5%
74
.7%
76
.9%
72
.8%
72
.1%
65
.5%
75
.5%
77
.9%
83
.4%
20
07
/08
58
.3%
73
.3%
65
.3%
72
.8%
73
.9%
72
.2%
65
.7%
64
.7%
73
.9%
74
.6%
69
.5%
20
08
/09
52
.4%
61
.2%
54
.6%
63
.1%
67
.3%
61
.1%
55
.8%
54
.1%
69
.5%
60
.6%
62
.2%
20
09
/10
55
.9%
58
.2%
53
.2%
62
.1%
68
.3%
66
.0%
74
.0%
65
.1%
53
.3%
57
.3%
67
.5%
62
.5%
50
.9%
20
10
/11
60
.2%
54
.3%
58
.4%
67
.2%
68
.7%
66
.5%
80
.7%
67
.7%
57
.1%
57
.7%
68
.3%
62
.4%
46
.7%
20
11
/12
57
.1%
59
.9%
56
.6%
65
.7%
63
.8%
62
.0%
56
.2%
68
.5%
54
.0%
55
.2%
70
.0%
63
.7%
51
.3%
20
12
/13
58
.9%
53
.7%
55
.6%
60
.0%
61
.7%
58
.0%
44
.4%
68
.9%
49
.3%
54
.7%
71
.5%
64
.3%
58
.2%
20
13
/14
60
.4%
52
.7%
57
.7%
55
.4%
60
.9%
58
.8%
53
.5%
68
.7%
51
.7%
54
.3%
70
.2%
67
.0%
57
.4%
20
14
/15
61
.5%
53
.9%
58
.1%
58
.9%
61
.7%
61
.1%
48
.0%
69
.7%
57
.1%
54
.5%
67
.8%
71
.8%
61
.3%
20
15
/16
*
57
.7%
55
.6%
65
.7%
62
.7%
66
.7%
63
.7%
51
.0%
70
.2%
59
.3%
60
.8%
69
.3%
73
.7%
65
.6%
20
16
/17
61
.2%
62
.3%
65
.9%
65
.4%
70
.3%
66
.6%
56
.9%
72
.3%
63
.6%
65
.0%
70
.2%
74
.2%
65
.2%
-0.7
%-0
.6%
Co
mp
ou
nd
ed
Gro
wth
FIG
UR
E 2
5:
KEY
OP
ERA
TIN
G C
HA
RA
CTE
RIS
TIC
S B
Y M
AJO
R C
ITIE
S –
AV
ERA
GE
RA
TE (`)
12
-Mo
nth
**C
om
po
un
de
d
Ch
ange
Gro
wth
Agr
a-8
.9%
5.4
%A
hm
ed
abad
-1.1
%4
.0%
Be
nga
luru
3.8
%2
.6%
Ch
en
nai
0.4
%1
.0%
Ne
w D
elh
ia1
.9%
1.3
%
Gu
rugr
am2
.4%
-3.5
%
NO
IDA
b3
.9%
-4.4
%
Go
a7
.3%
6.4
%
Hyd
era
bad
3.9
%5
.9%
Jaip
ur
2.4
%3
.6%
Ko
lkat
a3
.8%
2.1
%
Mu
mb
aic
19
97
/98
2,0
27
1,8
33
3,4
51
3,9
77
4,9
13
2,3
03
1,6
46
2,4
73
3,9
51
6,1
69
20
01
/02
1,8
40
2,3
54
3,7
35
3,5
35
4,3
38
2,6
76
2,4
14
2,9
49
3,4
09
4,9
32
4.6
%1
.2%
Pu
ne
19
98
/99
1,9
06
2,2
20
3,2
54
3,6
00
4,6
26
2,8
63
1,5
79
2,5
33
3,8
88
6,2
97 1
99
9/0
0
1,6
38
2,7
05
3,0
25
3,4
24
4,1
15
2,7
27
1,8
67
2,5
14
3,5
57
5,6
61
20
00
/01
1,5
86
2,7
36
3,6
02
3,7
96
4,5
26
2,9
14
2,3
16
2,9
02
3,6
98
5,5
55
20
02
/03
1,9
54
2,1
64
3,7
52
3,2
24
4,0
89
2,7
54
2,5
41
2,7
28
2,9
17
4,1
84
2,6
03
20
03
/04
2,4
31
2,4
10
4,8
32
3,3
23
4,2
69
3,0
86
2,7
74
2,9
80
3,0
21
4,3
56
2,8
05
20
04
/05
3,0
12
2,7
87
7,4
70
3,7
14
5,1
03
3,9
85
3,7
72
3,4
61
3,2
40
4,8
22
3,5
21
20
05
/06
3,6
22
3,1
11
8,7
62
4,3
57
6,9
09
4,8
04
4,8
70
4,4
07
3,8
87
6,0
41
4,9
15
20
06
/07
4,7
15
3,5
26
10
,40
6
5,3
78
9,1
92
5,8
01
5,9
62
5,2
85
5,2
88
8,7
38
6,5
23
20
07
/08
5,2
62
4,3
51
9,8
27
6,3
40
10
,42
9
6,2
55
6,2
71
5,6
64
6,5
75
10
,93
2
7,9
46
20
08
/09
5,3
22
4,7
54
9,4
95
6,6
77
9,8
11
6,2
71
6,2
97
5,9
82
6,6
86
10
,67
9
7,4
93
20
09
/10
5,7
73
4,5
40
6,5
97
5,7
10
8,8
34
8,2
47
7,4
96
5,6
13
5,1
46
4,5
39
6,0
87
8,4
28
5,8
10
20
10
/11
6,2
43
4,2
85
6,7
76
5,6
32
8,6
34
7,5
54
7,7
52
6,0
56
5,1
73
4,7
18
6,4
08
8,1
94
4,9
49
20
11
/12
5,9
58
3,9
17
6,2
93
5,5
24
8,1
74
7,6
39
7,4
16
6,1
62
5,0
26
4,7
27
6,0
49
7,9
23
4,1
63
20
12
/13
6,1
26
3,9
04
5,9
60
5,4
40
7,3
87
6,8
31
6,7
24
6,5
13
4,8
54
4,8
43
6,0
93
7,5
50
3,8
61
20
13
/14
6,3
38
3,7
34
5,3
79
5,0
50
6,9
41
6,5
69
5,9
64
6,6
92
4,5
56
4,7
43
5,7
39
7,1
58
3,9
08
20
14
/15
6,4
88
3,7
53
5,3
68
4,8
25
6,5
68
6,2
41
5,4
29
6,8
19
4,5
35
4,7
43
5,7
34
7,2
30
3,8
46
20
15
/16
*
6,0
83
3,8
84
5,3
92
4,7
67
6,2
11
6,2
53
5,2
81
7,0
20
4,7
41
4,7
21
5,6
07
7,3
53
3,9
22
20
16
/17
5,5
41
3,8
40
5,5
96
4,7
85
6,3
32
6,4
04
5,4
84
7,5
34
4,9
27
4,8
35
5,8
18
7,6
93
4,1
47
5.7
%3
.4%
FIG
UR
E 2
6:
KEY
OP
ERA
TIN
G C
HA
RA
CTE
RIS
TIC
S B
Y M
AJO
R C
ITIE
S –
REV
PAR
(`)
12
-Mo
nth
**
20
02
/03
20
03
/04
20
04
/05
20
05
/06
20
06
/07
20
07
/08
20
08
/09
20
09
/10
20
10
/11
20
11
/12
20
12
/13
20
13
/14
20
14
/15
20
15
/16
*C
han
geG
row
th
Agr
a6
00
1,2
16
1,7
20
2,0
28
2,7
77
3,0
68
2,7
90
3,2
27
3,7
58
3,4
00
3,6
05
3,8
27
3,9
88
3,5
10
-3.3
%7
.0%
Ah
me
dab
ad1
,16
41
,52
31
,90
42
,15
02
,39
43
,18
92
,90
82
,64
22
,32
72
,34
72
,09
81
,96
72
,02
42
,15
91
0.7
%3
.2%
Be
nga
luru
2,7
01
3,7
93
6,0
81
6,7
20
7,5
44
6,4
17
5,1
81
3,5
09
3,9
57
3,5
62
3,3
14
3,1
04
3,1
17
3,5
40
4.2
%3
.0%
Ch
en
nai
1,8
80
2,2
13
2,7
08
3,4
07
4,0
17
4,6
16
4,2
10
3,5
46
3,7
85
3,6
29
3,2
63
2,7
95
2,8
44
2,9
90
4.7
%0
.7%
Ne
w D
elh
ia2
,47
03
,12
14
,03
65
,58
27
,06
97
,70
76
,60
06
,03
45
,93
25
,21
24
,56
14
,22
54
,05
24
,14
07
.5%
2.2
%
Gu
rugr
am5
,44
35
,02
34
,73
63
,95
83
,86
13
,81
53
,98
67
.0%
-3.4
%
NO
IDA
b5
,54
76
,25
64
,16
42
,98
53
,19
32
,60
42
,69
21
6.0
%-7
.9%
Go
a1
,66
61
,83
02
,49
13
,25
74
,22
34
,51
63
,82
93
,65
44
,10
04
,22
04
,48
84
,60
14
,75
24
,92
81
0.6
%7
.6%
Hyd
era
bad
1,7
51
2,1
05
2,9
69
3,9
93
4,2
99
4,1
20
3,5
15
2,7
43
2,9
54
2,7
14
2,3
94
2,3
54
2,5
89
2,8
12
11
.4%
6.9
%
Jaip
ur
1,2
25
1,7
52
2,3
26
2,8
95
3,4
62
3,6
65
3,2
34
2,6
01
2,7
22
2,6
09
2,6
49
2,5
75
2,5
86
2,8
72
9.4
%4
.8%
Ko
lkat
a1
,90
81
,89
72
,23
62
,97
03
,99
24
,85
94
,64
84
,10
84
,37
74
,23
24
,35
64
,03
13
,88
93
,88
55
.2%
2.7
%
Mu
mb
aic
20
00
/01
67
4
1,5
27
2,5
14
2,4
52
2,6
66
1,7
66
1,6
00
1,5
96
2,3
26
3,5
89
20
01
/02
62
0
1,2
52
2,4
02
1,9
97
2,3
12
1,4
34
1,6
42
1,4
24
2,2
64
2,5
65
2,6
53
3,0
36
3,4
72
4,6
03
6,8
07
8,1
55
6,4
73
5,2
68
5,1
13
5,0
50
4,8
56
4,7
95
5,1
94
5,4
20
5.3
%1
.8%
Pu
ne
19
97
/98
93
4
1,3
16
2,1
12
2,7
20
2,9
58
1,3
63
87
9
1,2
79
2,4
42
4,0
28
19
98
/99
88
4
1,2
88
1,9
20
2,3
29
2,5
03
1,6
78
1,0
42
1,1
55
2,2
47
4,2
57
1
99
9/0
0
65
7
1,3
74
1,9
48
2,2
36
2,1
77
1,4
53
1,1
44
1,1
82
1,9
49
3,6
51
1,8
48
1,9
33
3,0
42
4,0
84
5,4
40
5,5
22
4,6
61
2,9
57
2,3
11
2,1
35
2,2
48
2,2
43
2,3
59
2,5
73
20
16
/17
3,3
93
2,3
90
3,6
89
3,1
30
4,4
51
4,2
64
3,1
23
5,4
49
3,1
33
3,1
43
4,0
85
5,7
05
2,7
02
5.0
%2
.7%
Co
mp
ou
nd
ed
2017 HOTELS IN INDIA TRENDS & OPPORTUNITIES | PAGE 13

12
-Mo
nth
**C
om
po
un
de
d
Ch
ange
Gro
wth
Agr
a-6
.3%
3.6
%
Ah
me
dab
ad7
.3%
0.0
%
Be
nga
luru
1.0
%-0
.3%
Ch
en
nai
1.5
%-2
.5%
Ne
w D
elh
ia
4.2
%-1
.1%
Gu
rugr
am3
.7%
-8.0
%
NO
IDA
b1
2.4
%-1
2.3
%
Go
a7
.2%
4.2
%
Hyd
era
bad
8.0
%3
.6%
Jaip
ur
6.1
%1
.5%
Ko
lkat
a1
.9%
-0.5
%
Mu
mb
aic
2.0
%-1
.4%
Pu
ne
1.8
%0
.4%
Exch
ange
Rat
e
19
97
/98 26
36
58 75
81
37
24 35
67
11
1
36
.3
19
98
/99 23
31
48
58
60 43
26
28 51 93
42
.2
19
99
/00 15
31
45
52
50
34 26 21
45
84
43
.5
20
00
/01 15
34 56 55
59
39
36
36 52
80
44
.9
20
01
/02 13
27
51
42
49
31
35
30
48
54
47
.2
20
02
/03 13
24 56 39
51
34 37
26
40 55
38
48
.2
20
03
/04 27 33
82
48
68
40
46
38 41
66 42
46
.0
20
04
/05
38 42
13
5
61
90
56
66 52
50 77
67
44
.9
20
05
/06 45
48
15
1
77
12
5
73
89 65
66
10
4 91
44
.5
20
06
/07
64 55
17
3
92
16
2
97
99
79
91
15
6
12
54
3.6
20
07
/08 76 79
15
9
11
5
19
2
11
2
10
2
91
12
1
20
3
13
74
0.2
20
08
/09 61
64
11
3
91
14
4
84 76
70
10
1
14
1
10
14
5.9
20
09
/10 68 55
74
74
12
6
11
4
11
6
77
58 55
86
11
0 62
47
.7
20
10
/11 82
51
87 83
13
0
11
0
13
7
90 65
60
96
11
2
51
45
.6
20
11
/12
71
49
74 76
10
9
99
87
88 57
54 88
10
5
45
48
.0
20
12
/13
66 39 61
60
84 73
55
82
44 49
80 89 41
54
.5
20
13
/14 62
33
51
46
70
64 53
76 39
42
66 79
37
60
.7
20
14
/15
65
33
51
47
66 62
43
78 42
42
64 85
39
61
.2
20
15
/16
*
54 33
54 46
64 61
41
76 43
44
60 83
40
65
.0
20
16
/17
51
36 55
47
66
64 47
81
47
47
61
85
40
67
.1
FIG
UR
E 2
8:
KEY
OP
ERA
TIN
G C
HA
RA
CTE
RIS
TIC
S B
Y M
AJO
R C
ITIE
S –
REV
PAR
(U
S$)
* Th
e 2
01
5/1
6 d
ata
ha
s b
een
mo
dif
ied
to
exc
lud
e th
e p
erfo
rma
nce
of
irre
leva
nt s
up
ply
** C
ha
ng
e in
20
16
/17
exp
ress
ed a
s p
erce
nta
ge
of
the
fig
ure
fo
r 2
01
5/1
6�
Del
hi N
CR
da
ta (
Sha
ded
Po
rtio
n),
res
t N
ew D
elh
i (ex
clu
din
g G
uru
gra
m, N
OID
A a
nd
Gre
ate
r N
OID
A)
da
ta�
NO
IDA
da
ta in
clu
des
Gre
ate
r N
OID
A�
Mu
mb
ai d
ata
incl
ud
es N
avi
Mu
mb
ai
Sou
rce:
HV
S R
esea
rch
FIG
UR
E 2
7:
KEY
OP
ERA
TIN
G C
HA
RA
CTE
RIS
TIC
S B
Y M
AJO
R C
ITIE
S –
AV
ERA
GE
RA
TES
(US$
)1
2-M
on
th**
Co
mp
ou
nd
ed
19
97
/98
19
98
/99
19
99
/00
20
00
/01
20
01
/02
20
02
/03
20
03
/04
20
04
/05
20
05
/06
20
06
/07
20
07
/08
20
08
/09
20
09
/10
20
10
/11
20
11
/12
20
12
/13
20
13
/14
Ch
ange
Gro
wth
Agr
a5
65
03
83
53
94
15
36
78
11
08
13
11
16
12
11
37
12
41
12
10
4-1
1.7
%2
.1%
Ah
me
dab
ad5
05
36
26
15
04
55
26
27
08
11
08
10
49
59
48
27
26
2-4
.2%
0.7
%
Be
nga
luru
95
81
70
80
79
78
10
51
66
19
72
39
24
42
07
13
81
49
13
11
09
89
0.6
%-0
.7%
Ch
en
nai
11
08
97
98
57
56
77
28
39
81
23
15
81
45
12
01
24
11
51
00
83
-2.7
%-2
.3%
Ne
w D
elh
ia1
35
11
19
51
01
92
85
93
11
41
55
21
12
59
21
41
85
18
91
70
13
61
14
-1.2
%-1
.9%
Gu
rugr
am1
73
16
61
59
12
51
08
-0.7
%-8
.1%
NO
IDA
b1
57
17
01
55
12
39
80
.7%
-8.9
%
Go
a6
37
36
36
55
75
76
78
91
08
13
31
55
13
71
18
13
31
28
12
01
10
4.0
%3
.1%
Hyd
era
bad
45
39
43
52
51
53
60
84
10
91
37
15
61
37
10
81
14
10
58
97
50
.7%
2.6
%
Jaip
ur
68
62
45
65
62
57
65
77
99
12
11
41
13
09
51
04
99
89
78
-0.7
%0
.3%
Ko
lkat
a1
09
88
82
82
72
61
66
72
87
12
11
63
14
61
28
14
11
26
11
29
50
.6%
-1.2
%
Mu
mb
aic
17
01
38
13
01
24
10
48
79
51
07
13
62
00
27
22
33
17
71
80
16
51
39
11
81
.4%
-2.1
%
Pu
ne
54
61
78
11
01
50
19
71
63
12
21
09
87
71
64
2.5
%1
.0%
Exch
ange
Rat
e3
6.3
42
.24
3.5
44
.94
7.2
48
.24
6.0
44
.94
4.5
43
.64
0.2
45
.94
7.7
45
.64
8.0
54
.56
0.7
20
14
/15
10
6 61
88 79
10
7
10
2
89
11
2
74 78
94
11
8 63
61
.2
20
15
/16
*
94 60 83
73
96
96 81
10
8 73
73
86
11
3
60
65
.0
20
16
/17
83
57
83
71
94 95
82
11
2
73
72
87
11
5
62
67
.1
PAGE 14 | 2017 HOTELS IN INDIA TRENDS & OPPORTUNITIES
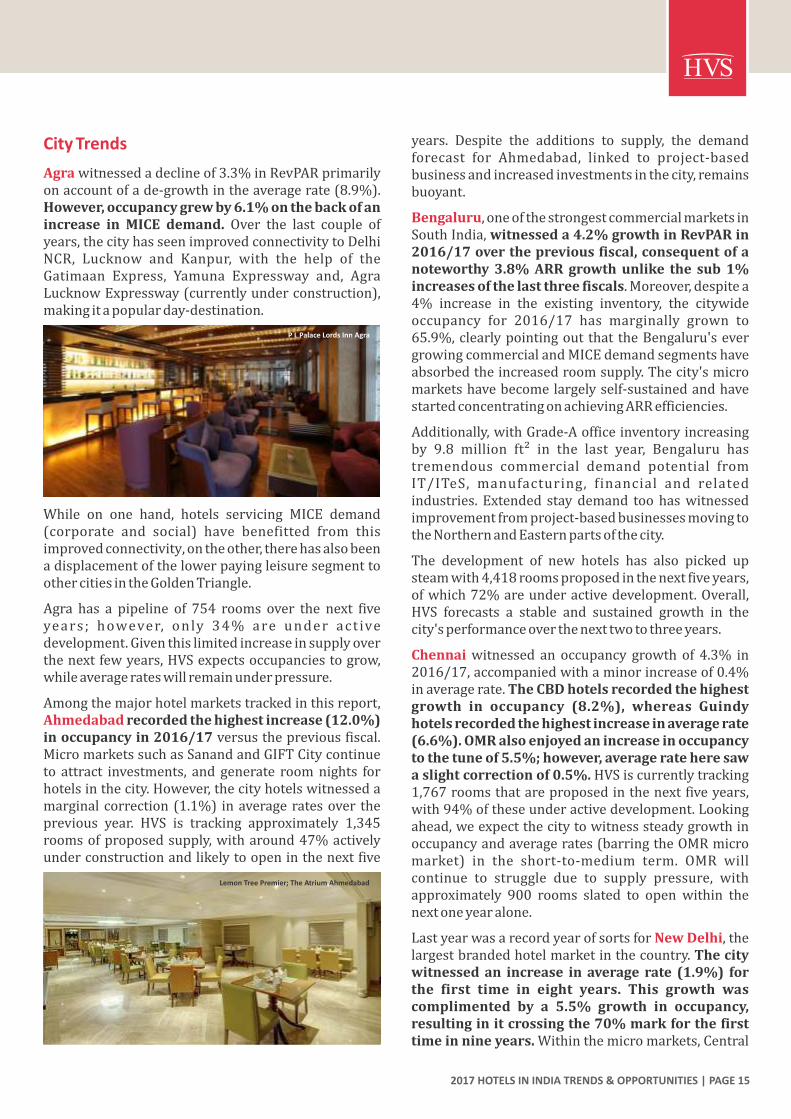
City Trends
Agrawitnessedadeclineof3.3%inRevPARprimarilyonaccountofade-growthintheaveragerate(8.9%).However,occupancygrewby6.1%onthebackofanincrease in MICE demand. Over the last couple ofyears,thecityhasseenimprovedconnectivitytoDelhiNCR, Lucknow and Kanpur, with the help of theGatimaan Express, Yamuna Expressway and, AgraLucknowExpressway(currentlyunderconstruction),makingitapopularday-destination.
While on one hand, hotels servicing MICE demand(corporate and social) have benefitted from thisimprovedconnectivity,ontheother,therehasalsobeenadisplacementofthelowerpayingleisuresegmenttoothercitiesintheGoldenTriangle.
Agra has a pipeline of 754 rooms over the next fiveyears ; however, only 34% are under act ivedevelopment.Giventhislimitedincreaseinsupplyoverthenextfewyears,HVSexpectsoccupanciestogrow,whileaveragerateswillremainunderpressure.
Amongthemajorhotelmarketstrackedinthisreport,Ahmedabadrecordedthehighestincrease(12.0%)inoccupancyin2016/17versusthepreviousfiscal.MicromarketssuchasSanandandGIFTCitycontinueto attract investments, and generate roomnights forhotelsinthecity.However,thecityhotelswitnessedamarginalcorrection(1.1%) inaverageratesover theprevious year. HVS is tracking approximately 1,345roomsofproposedsupply,witharound47%activelyunderconstructionandlikelytoopeninthenextfive
years. Despite the additions to supply, the demandforecast for Ahmedabad, linked to project-basedbusinessandincreasedinvestmentsinthecity,remainsbuoyant.
Bengaluru,oneofthestrongestcommercialmarketsinSouthIndia,witnesseda4.2%growthinRevPARin2016/17overthepreviousfiscal,consequentofanoteworthy3.8%ARRgrowthunlike the sub1%increasesofthelastthreefiscals.Moreover,despitea4% increase in the existing inventory, the citywideoccupancy for 2016/17 has marginally grown to65.9%,clearlypointingoutthattheBengaluru'severgrowingcommercialandMICEdemandsegmentshaveabsorbedtheincreasedroomsupply.Thecity'smicromarketshavebecomelargelyself-sustainedandhavestartedconcentratingonachievingARRefficiencies.
Additionally,withGrade-Aofficeinventoryincreasingby 9.8 million ft² in the last year, Bengaluru hastremendous commercial demand potential fromIT/ITeS, manufacturing, financial and relatedindustries. Extended staydemand toohaswitnessedimprovementfromproject-basedbusinessesmovingtotheNorthernandEasternpartsofthecity.
The development of new hotels has also picked upsteamwith4,418roomsproposedinthenextfiveyears,ofwhich72%areunderactivedevelopment.Overall,HVS forecasts a stable and sustained growth in thecity'sperformanceoverthenexttwotothreeyears.
Chennaiwitnessed an occupancy growthof 4.3% in2016/17,accompaniedwithaminorincreaseof0.4%inaveragerate.TheCBDhotelsrecordedthehighestgrowth in occupancy (8.2%), whereas Guindyhotelsrecordedthehighestincreaseinaveragerate(6.6%).OMRalsoenjoyedanincreaseinoccupancytothetuneof5.5%;however,averagerateheresawaslightcorrectionof0.5%.HVSiscurrentlytracking1,767roomsthatareproposedinthenextfiveyears,with94%oftheseunderactivedevelopment.Lookingahead,weexpectthecitytowitnesssteadygrowthinoccupancyandaveragerates(barringtheOMRmicromarket) in the short-to-medium term. OMR willcontinue to struggle due to supply pressure, withapproximately 900 rooms slated to open within thenextoneyearalone.
Lastyearwasarecordyearofsortsfor ,theNewDelhilargestbrandedhotelmarketinthecountry.Thecitywitnessedan increase in average rate (1.9%) forthe first time in eight years. This growth wascomplimented by a 5.5% growth in occupancy,resultinginitcrossingthe70%markforthefirsttimeinnineyears.Withinthemicromarkets,Central
Lemon Tree Premier; The Atrium Ahmedabad
2017 HOTELS IN INDIA TRENDS & OPPORTUNITIES | PAGE 15
P L Palace Lords Inn Agra

Delhi hotels witnessed the highest growth inoccupancy (7.2%), whereas the Aerocity hotelswitnessedthehighestgrowthinaveragerate(15.4%).HVS believes that average rate and occupancy willfurthergrowinconjunctionwitheachother,owingtoan overall increase in corporate, transient andMICEdemandinthecity.
Going forth, the capital is expected to see supplyadditionsofapproximately1,715roomsoverthenextthreetofiveyears,withthemajorityspreadacrossthemid market and budget categories (64.4%). Robustdemandcoupledwithmoderatesupplygrowth,makesouroutlookfortheNewDelhihotelmarketpositive.
The hotelmarketdisplayedanupwardGurugramperformance trend in 2016/17 for the thirdconsecutive year, with occupancy growing to66.6%,averageraterisingto`6,404,andRevPARcrossing the`4,000mark for the first time since2011/12. Whi le the c i ty 's south-westwarddevelopment toward Golf-Course Extension Road,Sohna Road and Manesar continues, the pace ofdevelopment of hotels in Gurugramhaswitnessed adecline.In2015/16,approximately1,370roomsoftheproposed supply were under active development.However,duetocontinuousdelaysofnumeroushotelprojects, in 2016/17, only around 400 rooms arerealistically expected to achieve completionwithin afive-year horizon. Improving market performance,bolstered by a dwindling supply pipeline, poses anopportunityforhotelsinthecitytotakeadvantageoftheindustryup-cyclefearlessly.Thus,ouroutlookforthemarketremainspositive,goingforward.
NOIDA(includingGreaterNOIDA),whichdisplayedalamentableperformanceoverthepastyears,witnessedamodestrecoveryin2016/17.Themarkethasseengrowth across all parameters this past fiscal(occupancy at 11.7%, average rate at 3.9% andRevPAR at 16.0%), resulting in the increase inRevPARtobethehighestamongthemajormarketstracked in this survey. This positive change can beattributed to the large-scale Automobile Exposition
Andaz Delhi
thatwashostedbythecityin2016,togetherwiththecommercialdemandarisingfromSector18,Sector62andtheborderingareasofGhaziabadandEastDelhi.
HVSistracking1,043roomsthatareplannedtoenterthemarketinthenextfiveyears;however,only18%ofth is supply i s act ive ly under construct ion .Nevertheless, looking ahead, one must be cautiousabout developing more hotels in NOIDA, as themarketwideoccupancyandaverageratewillcontinueto remain under pressure given the price sensitivenatureof themarket and the continuous increase indemandoverlapwithneighbouringareas.
Riding thewave of the industry up-cycle, – the Goacountry's leading leisure destination, recorded anoccupancyof72.3%andanARRof`7,534,yieldingaRevPARof`5,449–secondonlytoMumbai.Despitea14.8% increase in supply, a noteworthy 10.6%RevPARgrowthover2015/16wasachievedonthebackofboomingdomestic tourism, coupledwithimproved spending capacities of the aspiringmiddle class.Over thenext fiveyears, anestimated2,870roomsareexpectedtoenterthemarketofwhich48% are currently under active development.Construction of new supply haswitnessed a declinefrom 90% in 2015/16, due to the addition ofapproximately 830 rooms in 2016/17. In fact, theresilience Goa has exhibited with year-on-yearperformance improvements despite additions tosupply,isindicativeofthebuoyancyofthismarketand,we remain positive that it will continue its upwardtrend,goingforward.
Hyderabad city hotels recorded a double-digitincrease in RevPAR (11.4%) in 2016/17 over thepreviousyearasaresultofrobustgrowthindemandand,aslowdowninnewsupply.Hotelslocatedinmicromarkets,suchasGachibowliandHITECCity,continuetoreapbenefitsof thehighabsorptionrateandnewdevelopmentofcommercialspaces,inadditiontothesurging investments in IT, e-commerce and digitalindustries established in the area. Furthermore, theHyderabad International Convention Centre had its
W Goa
PAGE 16 | 2017 HOTELS IN INDIA TRENDS & OPPORTUNITIES
P L Palace Lords Inn Agra

onoccupancyislikely.
In 2016/17, Mumbai (including Navi Mumbai)recorded the highest occupancy (74.3%) for thethirdconsecutiveyear,andthehighestaveragerate(`7,693) and RevPAR (`5,705) for the fifthconsecutiveyearamongallmajormarketstrackedinthissurvey.Thiscontinualuptickinperformanceistestamenttotheinherentstrengthandrobustnatureofthemarket,fuelledbystronggrowthincorporatetravelandpromisingMICEandextendedstaysegments.
HVSistrackingapproximately3,680proposedrooms,withonly37%underactivedevelopment.Themajorityof the supply is expected to be at the mid marketpositioningand isplannedwithin theNorthMumbaimicromarket.
The Mumbai International Airport Limited (MIAL)landsidedevelopmentthatincludesseveralnewhotels,commercial and retail complexes in addition to theproposed convention centre in BKC, are expected tochange the faceofMumbaiat large.Moving forward,ouroutlookforthecityremainsoptimistic.
The ho te l marke t exh ib i tedNavi Mumbaiapproximately 6.6% drop in occupancy, althoughaverage rate grew by 6.3% in 2016/17. This can beattributedtotheslowingoflarge-scaleprojectrelatedtravel,whichwasreplacedbyhigherpayingdemandarising from Reliance Technology Park and othercommercialdevelopmentslocatedinAiroli,RabaleandMahape.TherecentlyopenedL&TSeawoodscomplexisexpectedtofurtherfueldemandforthecity.
Moreover,afterseveralyearsofmutedsupplygrowth,Navi Mumbai is expected to witness an addition ofapproximately300roomswithinthenext24months,whichislikelytoputpressureontheperformanceofthehotels.However,thefutureoutlookofthismarketmajorly hinges on the development of the newinternationalairportinPanvel,phaseddevelopmentsattheJawaharlalNehruPortTrust(JNPT)inadditiontodevelopmentofITparksandcommercialcomplexesinandaroundareassuchasCBDBelapur.Thus,ourlong-
Alila Fort Bishangarh Jaipur
best year in 2016/17, playing host to 29 large-scaleevents,withover34,000delegates.ThehotelslocatedintheCBDwitnessedmoderategrowth,withdemandfor room nights driven mainly by pharmaceuticals,banking and public-sector companies.With adwindlingsupplypipelineofapproximately1,500rooms, and no indication of deceleration incommercialactivity,theoutlookfortheHyderabadhotelmarketisencouraging.
The hotelmarketwitnesseda9.4%riseinJaipurRevPARoverthepreviousfiscal.Assupplygrewbyonly 2.6% in 2016/17, the city's hotels clocked aweighted average occupancy of 65.0%, reaching thisthreshold for the first time in a decade. Moreover,Jaipur, which continues to be one of the country'sleading leisure markets and a popular MICEdestination, is seeing a gradual slowdown in supply,withapproximately1,713roomsexpectedtoenterthemarketinthenextfiveyears(ofwhich51%areactivelyunder construction). Looking ahead, HVS forecastssteadygrowthinthecity’sperformanceoverthenextthreetofiveyears.
Kolkata, exhibiting a 5.2% RevPAR growth in2016/17, witnessed its first positive RevPARgrowth in four years following the industryup-cycle.Despitean18.4%increaseinsupply,thecityregisteredanoccupancyof70.2%andanaveragerateof`5,818. Kolkata's eastward expansion has enabledthecreationofdistinctmicromarkets,dividingroomsupplybetweentheCBDatoneendand,SaltLakeCity,Rajarhat and the EM Bypass at the other, leading toredistributionofdemandwithinthecity.Consequently,marketperformance,inthefaceofnewsupply,hasbeenshielded. The next five years are set to witness theadditionofapproximately2,200rooms,ofwhich64%are under active development. Going forward, asconnectivity to and within the city improves, micromarketdistinctionstreamlinesdemandpatternsand,developments l ike the Kolkata InternationalConventionCentreestablishthemselves,weanticipatethecitytoachievesomebalancebetweendemandandsupply.Thatbeingsaid,shorttomediumtermpressure
Alila Fort Bishangarh Jaipur
2017 HOTELS IN INDIA TRENDS & OPPORTUNITIES | PAGE 17
JW Marrio� Hotel Kolkata

termoutlookforNaviMumbairemainspositive.
Oftenregardedasthe'comebackcity', achievedPuneanoccupancyof65.2%in2016/17,recordingaCAGRof 5.7% in demand over the last seven years.Additionally, Pune witnessed an average rateincreaseof5.7%in2016/17.Themannerinwhichthe city has endured persistently, is not onlydemonstrativeof itsstrengthandresilience,butalsoindicatesitspotentialgoingforth.Furthermore,alongwithservingasamajorIT/ITeSandmanufacturinghubof the country, Pune now, is also an attractiveMICEdestinationofWesternIndia.
Going forward,weare tracking1,308newrooms,ofwhich47%areunderactivedevelopment.Consideringthediminishingsupplypipeline,anticipatedcontinualgrowth in demand and, further emergence of hotelmicro markets across the city, we believe hotelperformances shall witness sustainable growth inPune.
Future Trends & Opportunities
We conclude the 2017 edition of the Trends &Opportunities report with a look to the future. Thehospitality industry is now in its second year of themuch-awaited up-cycle and, it is time for industrystakeholdersandinvestorstograbtheopportunityandboost performance. To this effect, we would like tohighlighttheprevalenttrendsintheindustryaswellastheopportunitiestheybringforth.
Ashighlightedinthepreviousedition,hotelsinleisuremarketscommandsomeofthehighestaverageratesin the country. True to this, the top fifteen ARRs in2016/17 were achieved by hotels located in leisuredestinations.TherisingpurchasingpoweroftheIndianmiddle class has aided the exponential growth ofdomestic tourism, and helped in narrowing the gapbetween lean and peak seasons. Further, today'sdiscerningtravellersdonotshyawayfromspendingonupscaleorluxuryhotelsinsuchdestinations.However,themindsetofdevelopersandownerspresumesthatleisurehotelsarerarelyprofitable,whichisclearlynotthecase.Leisuremarketsdohavetheabilitytomakemoney,andalotofit;thegrowingdemandforthesamehas been reflected in key leisure hotels witnessingstableoccupanciesandyear-on-yeargrowthinaverageratesoverthepastfiveyears.
Indiaishometoamyriadoftouristdestinationswhichoffer scenic beauty, forts, palaces, temples, assortedfloraandfauna,festivals,artandculture.Theindividualstateshaveexecutedspecificmarketingcampaignsthathighlight their strengths and attract a number of
tourists.However,thereisalackofacomprehensivemarketing campaign at the central level, whichcapturestheessenceofthecountryandallitsuniqueofferings. In order to appeal to the internationalaudiences,thecountryneedstodevelopawholesomebrand,andleveragethediverseexperiencesavailable.IncredibleIndia2.0,whichwillbelaunchedlaterthisyear, focuses on India as a wellness and spiritualdestination.Whilethiswillprovideafilliptoaselectfewdestinationsinthecountry,itdoesnotdojusticetoseveralothersthathaveahostofotherattractionstooffer.Aconcerted,organisedandwell-strategised'go-to-market' strategy is sorely needed and it wouldperhapsbeagoodideatodrawfromtheexperiencesofother regional nations such as UAE, Malaysia andSingapore,allofwhomhaveverysuccessfullymanagedtobecomegloballyrecogniseddestinationsinthepastmanyyears.
Cities such as Chennai, Bengaluru, Pune, andHyderabad, housing primarily project, training andresearch-based businesses, regularly witness largevolumesofextendedstaydemandatlowerpricepoints.Yet, there is a dearth of suitable extended stayhotels/servicedapartments in thebrandedspaceat the budget/economy level in these cities.Consequently,thishighvolumeofroomnightdemandisbeingcapturedbytheunbrandedguesthousesandapartments.Thus,anopportunityclearlyexistsinthesecities for development of budget hotels, with anextendedstayproducttoaccommodateguestsstayingforlongerperiodsoftime.Inthesamevein,long-stayproductsattheuppermidscaleandupscalepositioningtoohaveroomforgrowthinIndia.Overall,itisourviewthat both, developers and brands, should give thissegmentmoreseriousconsideration.
Anothernotable trend is the increasinguseofHotelProjectPlannersfromtheconceptdesignstageoftheprojectitself.Hoteldevelopmentiscomplexinnatureand solid expertise is needed, especially in the earlystagesofplanninganddevelopment,thelackofwhichcan result in cost over-runs and ultimately poor
PAGE 18 | 2017 HOTELS IN INDIA TRENDS & OPPORTUNITIES
The Gateway Resort Corbe�

sales, revenue management, online and offlinemarketing,realestatefinance,costcentreoptimisation,working relationship with operator, managementagreements,annualbudgetingexerciseandmanpowerallocation.Theassetmanager'ssingularobjectiveistoachieveoptimisedreturnsfromtheinvestment.We,atHVS, are cognizant of a void in themarket thatwashitherto being fulfilled by independent consultants,retired hoteliers and generic finance professionals.HVSAssetManagementhassetupadedicatedteam,which has beenworking for its clients to transformunder-performingassetsintoperformingones.
In Closing
Themarketsarelookingstrong;theproposedsupplyisminimaland,demandismorethanlikelytocontinuegrowing.We are in an up-cycle!While the irrationalexuberanceofthelastup-cycleinthemid-2000smayhavetaughtusallthattreadingwithcautionisavirtue,itisequallyimportanttokeepremindingourselvesthatthe basic nature of our business is cyclical and thesectormustusethistimetoelevateitsrevenue.Specificmicro market sensitivities and anomalies aside, thenationwidehotelsectorwouldbewelladvisedtomakehaywhilethesunshines.
financialreturnsfortheproject.Severalprojectpost-mortemdiscussions highlight that complex and longprojects,suchashoteldevelopment, requireasoundunderstandingoftheendproduct.Theabsenceofthisleads to certain key aspects inevitably beingoverlooked,whicharedifficulttoknittogetheroncetheprojectiscompleted.Overthepastdecade,theindustryhas witnessed many failed hotel projects due to anumberofreasonsrangingfrominadequatefunding,poor design, to being overtly leveraged and horriblymismanaged. Insufficient planning is singlehandedlythemostcommonreasonbehindthesefailures.Itwillbeimprudenttoexpectthatonewillbeabletoplantoperfection and, unanticipated changeswill not occurduringthelifecycleoftheproject.Nonetheless,havingateamthathasthe foresight toplanandbuild insuchcontingences, will position the project to deliver,despite unforeseen events. Shockingly,most projectsstartconstructionwithoutcompletingthedesignandbudgetphase.The reckoningof 'costover-runs'onlytakes place later in the construction process, whenmost of the costs have alreadybeen allocated in theareasdesigned.Thislate'wake-upcall'typicallyleadsto a hurried re-design of interior spaces, delays inawardofworks,idlecontractorsforlackofdrawings,purchase of sub-standard materials, and mostimportantlyawardofworkstounqualifiedcontractorsatunsustainablerates.Theprojectbeginstowitnessadownwardspiralofpoorqualityanddelays.Asaresult,theownerisleftwithanassetwithexorbitantinterestduring construction (IDC) that it cannot service,leadingtoapotentiallynon-performingasset(NPA).Itis, therefore, time that developers take notice of thebenefitsofcohesiveprojectplanninganddesigningtolimit the number of unfeasible projects that havealreadybeenfloatinginthemarket.
Sub-optimalperformanceofhotelassetsinthelastfewyearshas frustratedowners across variousproductsand positioning. Consequently, a growing number ofhotels, especially in the luxury and upscale brandedspace,withlessthanfiveyearsofoperatinghistory,areoptingtousetheservicesofprofessionalHotelAssetManagementcompanies.Hotelownersarerealisingthatwhiletroubledhotelsdoneedfocusedon-groundassistance, even profitable and well-managed hotelscould benefit from a fresh perspective coming fromexperts. Institutional capital invested into hotel realestate is already conversant with the model of'sweating'theassetwithexternalassistance.So,whatshouldahotelownerexpectfromanAssetManager?That they would get someone to look out for theirinterestwhenitcomestoareaslikehoteloperations,
2017 HOTELS IN INDIA TRENDS & OPPORTUNITIES | PAGE 19

For participation, please write to [email protected] OR log on to www.HICSAconference.com
TH14 HOTEL INVESTMENT CONFERENCE - SOUTH ASIA (HICSA) 2018
GRAND HYATT MUMBAI
BLOCK YOUR DATES | 4-5 APRIL, 2018HOSTED BY
HVS.com
About HVSHVS, the world's leading consulting and services organisation focused on the hotel, mixed-use, shared ownership, gaming, and leisure industries, celebrated its 35�� anniversary in 2015. Established in 1980, the company performs 4,500+ assignments each year for hotel and real estate owners, operators, and developers worldwide. HVS principals are regarded as the leading experts in their respective regions of the globe. Through a network of more than 40 offices and more than 350 professionals, HVS provides an unparalleled range of complementary services for the hospitality industry. HVS.com
Superior Results through Unrivalled Hospitality Intelligence.
Everywhere.
Over the last decade, division has HVS South Asia’s Consulting and Valuationestablished itself as the market leader, expanding its services to include a wide range of consulting activities, all geared to enhance economic returns and asset value for our clients.
The Consulting and Valuation team comprises of highly experienced industry professionals offering the utmost level of expertise and credibility. Our consultants understand the hotel business and have received qualifications from leading hospitality schools across the world, while also possessing actual hotel operating experience.
As part of our Consulting and Valuation services, we offer the following:
• Valuations (Single Asset and Portfolio)
• Market Studies
• Feasibility Studies and Return-on-Investment Analyses
• Operator Selection and Management Contract Negotiations
• Market Entry Strategy Studies
• Operating Budget Reviews
• Asset Management
• Investment Advisory
HVS South Asia plays host to the annual Hotel Investment Conference - South Asia (HICSA), the leading hotel investment conference in the region, and Hotel Operations Summit India (HOSI), the only dedicated forum for hotel operational leaders of today and tomorrow. HVS also hosts a number of premier industry events across the larger region, namely the Tourism, Hotel Investment & Networking Conference (THINC) Indonesia THINC Sri Lanka THINC Innovate , , and the inaugural – to be held in Bangkok, in May 2018.
About the Authors
S a n aya J i j i n a i s a nAssociate – Consulting &Valuation with the HVSNew Delhi office and haswo r k e d o n m u l t i p l efeasibility studies, marketarea analyses and hotel
valuations in India. She holds aBachelorofArts(Hons.)inHospitalityManagementfromtheInstituteofHotelManagement, Aurangabad (Universityof Huddersfield, UK). Prior to joiningHVS, she gained hotel operations andSales and Marketing experience byworking with Starwood Hotels &Resorts Worldwide and The LeelaPalacesHotelsandResortsinIndia.
[email protected] [email protected]
Ach i n Kh anna i s t h eMan a g i n g D i r e c t o r o fConsulting andValuation atHVS South Asia. He is aM emb e r o f t h e R o y a lInstitution of CharteredSurveyors(MRICS).Overthe
pasttenyearsatHVS,Achinhasdirectedalarge number of assignments, performedeconomic feasibility analyses and largescale portfolio valuations, successfullyconduc ted opera tor searches andmanagementcontractnegotiations.Hehasextensive experience in conducting hotelv a l u a t i o n s , b o t h i n I n d i a a n dinternationally.PriortojoiningHVS,AchinspenttenyearsintheUnitedStatesworkingacross various roles in hotel operations,revenue management, franchise relationsand business development. Achin holds aBachelor of Sc ience in Hospita l i tyManagement from Widener University,Chester,PA,andaMBAfromtheUniversityofPhoenix,Arizona,USA.
Notable contributions were made byKaranSahani,ShunitRoy,DikshaChopra,KaranRahan,HemangiBhandari,ShreyaSenandSaurabhGuptaofHVSNewDelhi.
EditingsupportwasprovidedbyJuieS.MobarandoverallguidanceanddirectionwasofferedbyManavThadani.
HVS | 2nd Floor, Paras Downtown Centre, Golf Course Road, Sector 53, Gurugram 122 002, INDIA