2017 full year financial results - australian gold company · 2017 full year financial results ....
TRANSCRIPT

17 August 2017
Jake Klein – Executive Chairman
Lawrie Conway – Finance Director and CFO
2017 Full Year Financial
Results
Forward looking statement
These materials prepared by Evolution Mining Limited (or “the Company”) include forward looking statements. Often, but not always, forward looking statements can
generally be identified by the use of forward looking words such as “may”, “will”, “expect”, “intend”, “plan”, “estimate”, “anticipate”, “continue”, and “guidance”, or other
similar words and may include, without limitation, statements regarding plans, strategies and objectives of management, anticipated production or construction
commencement dates and expected costs or production outputs.
Forward looking statements inherently involve known and unknown risks, uncertainties and other factors that may cause the Company’s actual results, performance
and achievements to differ materially from any future results, performance or achievements. Relevant factors may include, but are not limited to, changes in
commodity prices, foreign exchange fluctuations and general economic conditions, increased costs and demand for production inputs, the speculative nature of
exploration and project development, including the risks of obtaining necessary licenses and permits and diminishing quantities or grades of reserves, political and
social risks, changes to the regulatory framework within which the Company operates or may in the future operate, environmental conditions including extreme
weather conditions, recruitment and retention of personnel, industrial relations issues and litigation.
Forward looking statements are based on the Company and its management’s good faith assumptions relating to the financial, market, regulatory and other relevant
environments that will exist and affect the Company’s business and operations in the future. The Company does not give any assurance that the assumptions on
which forward looking statements are based will prove to be correct, or that the Company’s business or operations will not be affected in any material manner by
these or other factors not foreseen or foreseeable by the Company or management or beyond the Company’s control.
Although the Company attempts and has attempted to identify factors that would cause actual actions, events or results to differ materially from those disclosed in
forward looking statements, there may be other factors that could cause actual results, performance, achievements or events not to be as anticipated, estimated or
intended, and many events are beyond the reasonable control of the Company. Accordingly, readers are cautioned not to place undue reliance on forward looking
statements. Forward looking statements in these materials speak only at the date of issue. Subject to any continuing obligations under applicable law or any
relevant stock exchange listing rules, in providing this information the Company does not undertake any obligation to publicly update or revise any of the forward
looking statements or to advise of any change in events, conditions or circumstances on which any such statement is based.
2
The Company results are reported under International Financial Reporting Standards (IFRS). This presentation also includes non-IFRS information including
EBITDA and Underlying profit. The non-IFRS information has not been subject to audit or review by the Company’s external auditor and should be used in addition
to IFRS information.
Non-IFRS Financial Information

Continued delivery
3
Record profit
Increasing fully franked dividends
A global leader in low-cost production
Investing in the future
Very strong cash generation
Six consecutive years of meeting production and cost guidance

Safety
4
A continuous improvement culture driving positive initiatives
to keep our people safe
FY17 focus on assurance reviews of critical control plans
Significant reduction in vehicle incidents achieved
NSW Mining HSEC award winner for Project Arrive Alive
Queensland Mining Industry highly commended award for
Evolution’s Health and Wellbeing program
24.4
19.9
12.0 9.6 9.7
8.0
FY12 FY13 FY14 FY15 FY16 FY17
Total Recordable Injury Frequency Rate (TRIFR)
5.3
3.7
2.1
1.0
1.8
0.4
FY12 FY13 FY14 FY15 FY16 FY17
Lost Time Injury Frequency Rate (LTIFR)

Highlights
FY17 financial highlights Units FY17 FY16 Change
Statutory Profit after tax A$M 217.6 (24.3) -
Underlying Profit after tax1 A$M 206.6 134.5 54%
EBITDA A$M 713.9 607.6 17%
Operating Cash flow A$M 706.5 628.4 12%
Group Cash flow A$M 382.0 365.0 5%
EBITDA Margin2 % 49% 46% 7%
AIC Margin A$/oz 568 463 23%
Gearing % 15.9% 15.1% 5%
Final dividend3 cps 3 2 50%
1. FY16 underlying profit after tax restated. Refer to “Underlying net profit reconciliation” on slide 20 for full details
2. FY17 excludes Pajingo
3. FY17 fully franked; FY16 unfranked 5

393 427 438
803 844
FY13 FY14 FY15 FY16 FY17
Group gold production (koz)
Operational performance and asset quality
6
168 245 306
628 707
FY13 FY14 FY15 FY16 FY17
Operating cash flow (A$M)
Record production up 5%
Consistent year on year delivery to guidance
Active portfolio management to improve quality
FY13: Development of low cost Mt Carlton operation
FY16: Acquisition of Cowal, Mungari and Phoenix Gold
FY17: Investment in Ernest Henry and disposal of Pajingo
Leader in low cost production at A$907/oz (US$684/oz)
Captured benefits of favourable market in recent years
Reduction since FY13 – 26% in AUD and 46% in USD
Operating cash flow up 12% (only 3% higher gold price)
Portfolio approach generating record results
Introduction of long life, low cost assets
No dependence any single asset to drive cash flow
Exposure to copper revenue in Ernest Henry investment
1,228 1,083 1,036 1,014
907
FY13 FY14 FY15 FY16 FY17
Group AISC (A$/oz)

Changes to the portfolio in past couple of years has delivered favorable reductions in costs
Realising the benefit of introducing additional copper by-product into portfolio
Leverage of combined group volumes delivering lower input costs (e.g. grinding media, chemicals, explosives)
Starting to experience upwards movements in some cost areas
Current energy market pushing up Group power cost by 20-30%
Increasing Group All in Sustaining Cost by ~A$10-20 per ounce
Biggest impact is at Cowal where power cost will increase by approximately 80%
Improved cost profile
7
722
625
FY16 FY17 FY18 guidance
C1 Cash Cost (A$/oz)
590-650
1,014
907
FY16 FY17 FY18 guidance
AISC (A$/oz)
850-900

607.6
37.3
35.5 7.3 3.5
(28.6)
0.7
99.2
(48.5)
713.9
EBITDA June2016
Gold Volume Gold Price By ProductVolume
By Product Price Mine OperatingCosts
Exploration,Corporate &
Other
Ernest Henry(Part-year)
Pajingo(Sold Sep 2016)
EBITDA June2017
FY17 EBITDA A$M
Group EBITDA Record group EBITDA (cash profit) up 17% to A$713.9M
Sustained performance from existing assets improved EBITDA by 9.3%
Immediate and significant impact from investment in Ernest Henry with A$99.2M contribution
2016 continuing operations 8
FY17 EBITDA (A$M)

Longest life assets generating highest margins
Benefits of diverse portfolio – no dependence on any single asset
EBITDA margins
59% 58%
48% 49% 47%
11%
59% 61% 64%
55%
39%
49%
18%
Cowal Ernest Henry Mt Carlton Mt Rawdon Mungari Cracow Edna May
Site EBITDA Margin
10+ years(2) 6-8 years(2) 3-6 years(2)
*FY17 Excludes Pajingo
(1) FY17 excludes Pajingo
(2) Indicative reserve life based on FY17
production level
33%
40%
46% 49%
Group*
Group EBITDA Margin
FY14 FY15 FY16 FY17(1)
Group margin up
50% from FY14
Delivered by mix of
cost reductions; gold
price and change in
asset portfolio
EBITDA Contribution
10+ years 47%
EBITDA Contribution
6-8 years 29%
EBITDA Contribution
3-6 years 24%
9
FY16
FY17(1)
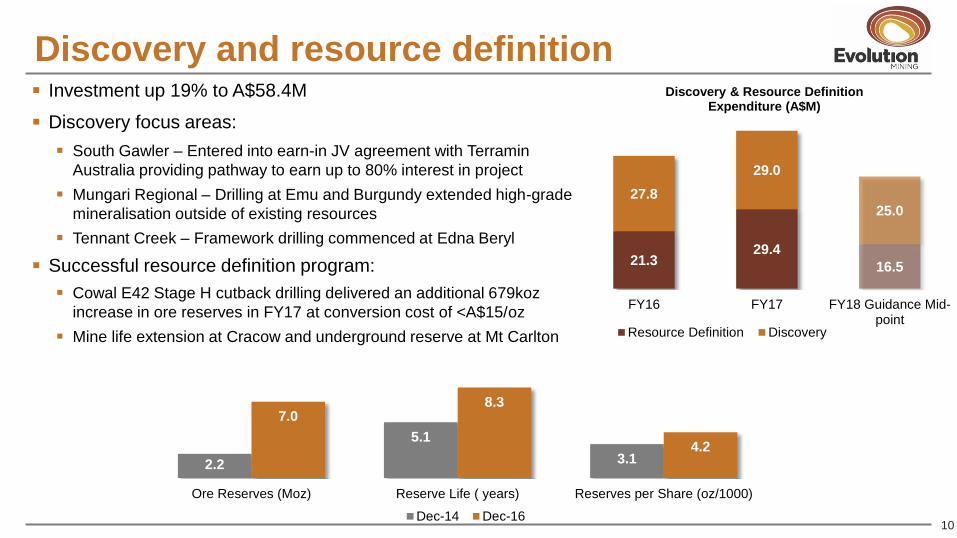
Investment up 19% to A$58.4M
Discovery focus areas:
South Gawler – Entered into earn-in JV agreement with Terramin
Australia providing pathway to earn up to 80% interest in project
Mungari Regional – Drilling at Emu and Burgundy extended high-grade
mineralisation outside of existing resources
Tennant Creek – Framework drilling commenced at Edna Beryl
Successful resource definition program:
Cowal E42 Stage H cutback drilling delivered an additional 679koz
increase in ore reserves in FY17 at conversion cost of <A$15/oz
Mine life extension at Cracow and underground reserve at Mt Carlton
Discovery and resource definition
2.2
5.1
3.1
7.0 8.3
4.2
Ore Reserves (Moz) Reserve Life ( years) Reserves per Share (oz/1000)
Dec-14 Dec-1610
21.3 29.4
16.5
27.8
29.0
25.0
FY16 FY17 FY18 Guidance Mid-point
Discovery & Resource Definition Expenditure (A$M)
Resource Definition Discovery

Group cash flow
Mandatory Debt
A$100M
Dividends Paid1
A$52M Free Cash
A$229M 60%
Net Cash (A$M) 16% of revenue
Record cash flow from operations underpinning Group strategy
Sustaining and major capital in line with guidance
Surplus cash used to accelerate debt reduction
Higher dividend payout rate approved
Operating Costs
A$773M
Ops Cash
A$707M 48%
Operating Cash Flow (A$M) 48% of revenue
Capital A$245M
Corporate A$28M
Interest A$23M
Discovery A$29M
Surplus A$382M
54%
Cash after investing (A$M) 26% of revenue
1. Dividends paid stated on a post-DRP basis 11

Significant improvement in liquidity Cash and undrawn debt of A$337.4M
Repayment of A$325.0M of debt during the year
Syndicated debt at 30 June 2017 of A$435.0M Term Facility B: A$40.0M
Term Facility D: A$395.0M
No debt payment obligations until April 2018
Gearing at a manageable level of 15.9%
Adequate hedging in place out to June 2020
Total of 458,495oz at A$1,645/oz average
FY18 hedge 208,495oz at A$1,563/oz average
Restricted tax loss asset of A$20.0M available for
use to offset future profits
Balance sheet in good shape
322 325
50
155 120
80 30
FY16 FY17 FY18 FY19 FY20 FY21 FY22
Debt Repayments and Commitments (A$M)
Repayments Commitments
12
32.0%
15.1% 15.9%
1.56
0.45 0.56
-1.0
-0.5
0.0
0.5
1.0
1.5
2.0
0%
10%
20%
30%
40%
50%
60%
Jul-15 Jun-16 Jun-17
Net Debt to EBITDA
Gearing Gearing and Leverage Ratio
Gearing Leverage Ratio (Net Debt to EBITDA)

1 2 2
3
5
FY13(Final Only)
FY14 FY15 FY16 FY17*
Dividends Declared Cents per Share Dividend policy changed to payout of 50% of earnings
Final franked dividend up 50% to 3 cents per share
Commencement of franked dividends
Total FY17 dividend of A$84.1M (Pre-DRP)
7 21 43
87
171
FY13 FY14 FY15 FY16 FY17*
Cumulative Dividends Declared A$M (Pre-DRP)
7 7 15
34
7 7
14
29
50
FY13 FY14 FY15 FY16 FY17*
Dividends Declared A$M (Pre-DRP)
Interim Final
Dividends
*FY17 final dividend to be paid on 29 September 2017 13

FY18 Guidance Gold production C1 cash costs1
All-in sustaining
cost1
Sustaining
Capital Major Capital
(oz) (A$/oz) (A$/oz) (A$M) (A$M)
Cowal 235,000 - 245,000 660 – 720 950 – 1,000 52.5 – 57.5 85 – 100
Mungari 120,000 - 130,000 860 – 910 990 – 1,050 10 – 15 32.5 – 40
Mt Carlton 100,000 - 110,000 420 – 470 680 – 730 5 – 10 17.5 – 22.5
Mt Rawdon 105,000 - 115,000 670 – 720 850 – 900 5 – 10 20 – 22.5
Edna May 90,000 - 100,000 1,100 – 1,150 1,250 – 1,300 2.5 – 5 10 – 15
Cracow 85,000 - 90,000 810 – 860 1,150 – 1,200 10 – 12.5 10 – 15
Ernest Henry 85,000 - 90,000 (500) – (300) (200) – (150) 10 – 15 0
Corporate 32 – 37
Group 820,000 - 880,000 590 – 650 850 – 900 95 – 125 175 – 215
FY18 guidance
14 1. A copper price assumption of A$7,700/t has been used for by-product credits

Results align to strategy
A$207M UP 54%
UNDERLYING PROFIT
A$218M UP A$242M
STATUTORY PROFIT
A$714M UP 17%
EBITDA
C1 A$625/oz DOWN 13%
AISC A$907/oz DOWN 11%
AIC MARGIN A$568/oz UP 23%
A$707M UP 12%
MINE OPERATING
CASH FLOW
A$382M UP 5%
GROUP CASH FLOW
16% A$325M DEBT
REPAYMENTS
GEARING
3 CENTS FULLY FRANKED
UP 50%
FINAL DIVIDEND PRODUCTION 844k oz UP 5%
RECORD PROFIT QUALITY PORTFOLIO STRONG BALANCE SHEET
15

Attributes of a sustainable gold business
16
High quality, low cost, long life assets
Financial discipline
Strong vision, values and sense of purpose
Counter-cyclical investment
Discovery success
Building a business that prospers through the cycle

www.evolutionmining.com.au
ASX code: EVN
Appendix

FY18 guidance: discovery and non-cash items
1. Depreciation & Amortisation FY18 guidance includes fair value unwind at Cowal & Mungari and amortisation of Ernest Henry prepayment (10-12%).
2. Resource definition is included in the Sustaining Capital guidance on Slide 14
18
FY18 Guidance
Depreciation &
Amortisation1 Fair Value Unwind
Resource
Definition2 Discovery
A$/oz A$M
A$M A$M
Cowal 370 – 410 15.0 – 20.0
2.0 – 3.5 2.5 – 4.5
Mungari 530 – 570 17.0 – 22.0 6.0 – 7.0 10.0 – 12.0
Mt Carlton 400 – 440
1.0 – 2.5 0.0 – 1.0
Mt Rawdon 430 – 470 0.0 – 1.0 0.0 – 1.0
Edna May 270 – 310 0.0 0.0
Cracow 320 – 350 4.0 – 6.0 2.5 – 4.5
Ernest Henry 1,300 – 1,360
0.0 0.0
Corporate
0.0 5.0 – 7.0
Group 480 – 520 32.0 – 42.0 13.0 – 20.0 20.0 – 30.0
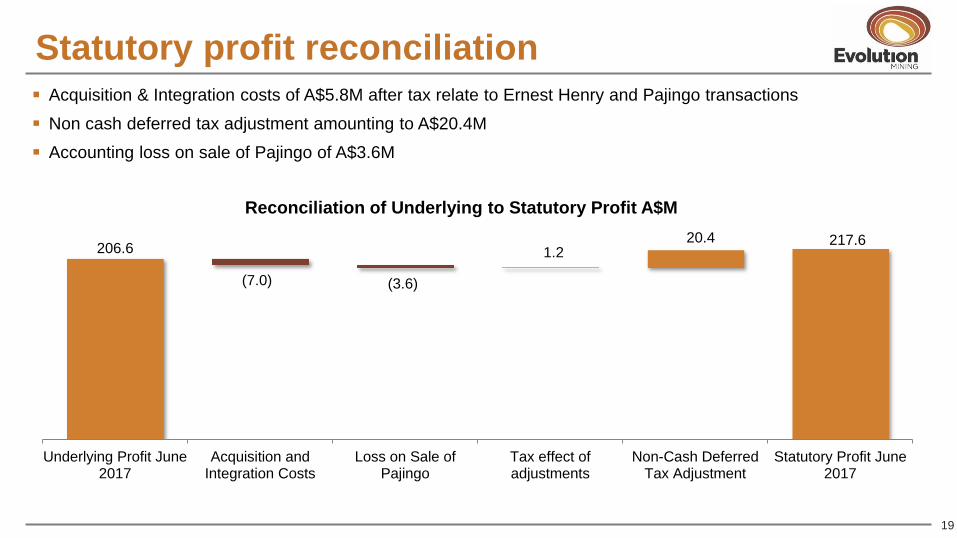
Acquisition & Integration costs of A$5.8M after tax relate to Ernest Henry and Pajingo transactions
Non cash deferred tax adjustment amounting to A$20.4M
Accounting loss on sale of Pajingo of A$3.6M
Statutory profit reconciliation
206.6
(7.0) (3.6)
20.4 1.2
217.6
Underlying Profit June2017
Acquisition andIntegration Costs
Loss on Sale ofPajingo
Tax effect ofadjustments
Non-Cash DeferredTax Adjustment
Statutory Profit June2017
Reconciliation of Underlying to Statutory Profit A$M
19

Underlying net profit reconciliation
134.5 2.8
36.0
108.9 3.5
(45.7)
(53.4)
0.6 8.8 14.7
(4.2)
206.6
UnderlyingProfit June
2016*
Gold Volume Gold Price By ProductVolume
By ProductPrice
MineOperating
Costs
D&A Exploration,Corporate &
Interest
Other Fair valueCowal /Mungari
Tax UnderlyingProfit June
2017
Underlying Net Profit After Tax A$M
* As presented in the 30 June 2016 financial statements, underlying profit excluded the fair value adjustments related to the acquisition of Cowal and Mungari. Following
the completion of the purchase price allocation the fair value amortisation is included in underlying profit. All changes were non-cash items. For consistency, the 2016
underlying profit has been amended to reflect this treatment. No change to statutory profit was required. Underlying profit is a non-IFRS measure. If the fair value
amortisation was excluded in 2017, underlying profit after tax would have been $238.1 million.
2016
A$M
Underlying profit after income tax as presented at 30 June 2016 226.9
Fair value amortisation included in underlying profit (58.2)
Tax effect of adjustments (34.2)
Underlying profit after income tax 2016 134.5
20

Taxation All unrestricted tax losses utilised during the year to June 2017
Tax liability of A$36.2M at 30 June 2017, payable in December 2017 with tax instalments thereafter
Restricted tax losses recorded on balance sheet as an asset amount to A$20.4M.
A$1.5M for Conquest acquired tax losses restricted by an available fraction of 7.8%
A$16.4M of La Mancha acquired tax losses restricted by an available fraction of 16.5%
A$2.5M of Phoenix Gold acquired tax losses restricted by an available fraction of 2.7%
1. The available fraction limits the annual rate at which losses may be recouped against taxable income. 21
71.2 2.3
(37.3)
36.2
(20.4)
3.9 19.7
Prima facie tax (30% ofprofit)
Tax - timing andpermanent
Tax losses utilised Tax payable Tax loss assetrecognised
Deferred tax liability Income tax expense
Income Tax Expense Reconciliation (A$M)