2016 sap financial information report - lni.wa.gov · ii state of washington industrial insurance...
TRANSCRIPT
State of Washington Industrial Insurance Fund Statutory Financial Information ReportFor the Fiscal Years Ended June 30, 2016 and 2015


i
State of Washington Industrial Insurance Fund Statutory Financial Information Report For the Fiscal Years Ended June 30, 2016 and 2015 Prepared by: Department of Labor and Industries Joel Sacks, Director Ernie LaPalm, Deputy Director Randi Warick, Deputy Director for Financial Management Actuarial Services Bill Vasek, FCAS, Senior Actuary Mark Mercier, ACAS, MAAA Joshua Ligosky, FCAS, MAAA Administrative Services David Marty, Assistant Director Financial Services Sharon Elias, Chief Accounting Officer Rob Cotton, MBA, CPA, CMA, CGAP, Workers’ Compensation Accounting Manager Margo Driver, CPA, Revenue Accounting Manager Linda Tilson, Accounting Services Manager Teena Minning, Workers’ Compensation Accountant Cathy Mowlds, Workers’ Compensation Accountant Mariya Rohde, Workers’ Compensation Accountant Yvonne Quijano, Workers’ Compensation Accountant Financial Services Program Personnel Insurance Services Division Personnel Additional assistance provided by: Washington State Office of Financial Management Washington State Investment Board
Picture from Cover page to be inserted by
Communications
i
ii

iii
State of Washington Industrial Insurance Fund
Statutory Financial Information Report
For the Fiscal Years Ended June 30, 2016 and 2015
Table of Contents
Page
INTRODUCTORY SECTION
Letter of Transmittal ................................................................................................................3
Organization Chart ...................................................................................................................8
FINANCIAL SECTION
Independent Auditor’s Report ..............................................................................................11
Management’s Discussion and Analysis ...............................................................................15
Consolidated Statutory Financial Statements
Consolidated Statutory Statement of Admitted Assets,
Liabilities, and Contingency Reserve ..................................................................................31
Consolidated Statutory Statement of Operations and
Changes in Contingency Reserve ........................................................................................32
Consolidated Statutory Statement of Cash Flows ................................................................33
Notes to the Consolidated Statutory Financial Statements .................................................35
Supplementary Information
Schedule of Undiscounted Claims Development Information ............................................83
Supplemental Investment Risk Interrogatories ....................................................................84
Summary Investment Schedule............................................................................................88
INDEPENDENT ACTUARIAL OPINION
Statement of Actuarial Opinion .............................................................................................89

St a t e o f W ash in g t on In d u s t r i a l In s u r an ce Fu nd
iv

St a t e o f W ash in g t on In d u s t r i a l In s u r an ce Fu nd
1
Introductory Section

St a t e o f W ash in g t on In d u s t r i a l In s u r an ce Fu nd
2

3
December 9, 2016
The Honorable Jay Inslee, Governor Honorable Members of the Legislature Director of Office of Financial Management Washington State Citizens Olympia, Washington 98504
RE: Statutory Financial Information Report
The Revised Code of Washington 51.44.115 requires the Department of Labor and Industries (L&I) to publish a Statutory Financial Information Report for the Industrial Insurance Fund (State Fund) in conformity with statutory accounting practices and principles promulgated by the National Association of Insurance Commissioners within six months of the close of each fiscal year. This report is published to fulfill that requirement for the fiscal year ended June 30, 2016.
L&I is fully responsible for the completeness and reliability of the information contained in this report, based upon a comprehensive framework of internal controls established for this purpose. Because the cost of internal controls should not exceed anticipated benefits, the objective is to provide reasonable, rather than absolute, assurance that the financial statements are free of any material misstatements.
The independent certified public accounting firm, Eide Bailly, LLP, has issued an unmodified (“clean”) opinion on the Statutory Financial Information Report for the fiscal years ended June 30, 2016 and 2015. The independent auditor’s report is located at the front of the financial section of this report.
Management’s Discussion and Analysis (MD&A) immediately follows the independent auditor’s report and provides a narrative introduction, overview, and analysis of the Consolidated Statutory Financial Statements. The MD&A complements the information provided in this letter of transmittal and should be read together with it.
DEPARTMENT OF LABOR AND INDUSTRIESSTATE OF WASHINGTON
P.O. Box 44000 • Olympia Washington 98504-4000

4
PROFILE OF THE INDUSTRIAL INSURANCE FUND
The Industrial Insurance Fund is part of the Workers’ Compensation Program and is made up of the Accident, Medical Aid, and Pension Reserve Accounts. The activities within the Industrial Insurance Fund are financed and operated in a manner similar to private business entities. Premiums collected from employers and workers and investment earnings finance the cost of providing medical coverage, time-loss payments, disability benefits, Stay at Work reimbursements, and structured settlements. L&I prepares a Statutory Financial Information Report for the Washington State Industrial Insurance Fund of the Workers’ Compensation Program annually, based on a fiscal year beginning July 1 and ended June 30.
L&I, an agency of Washington State, is responsible for managing the state’s workers’ compensation system; enforcing the Washington Industrial Safety and Health Act; providing safety and health consultations and information; enforcing wage and hour, child labor and family leave requirements; managing the state’s Crime Victims’ Compensation Program; registering contractors and apprentices; inspecting electrical work, elevators, boilers and factory-assembled structures; and issuing licenses for certain skilled trades.
L&I headquarters is located at 7273 Linderson Way SW in Tumwater, Washington. There are 18 additional L&I field offices across Washington State that enable us to respond to specific needs in different localities.
The workers’ compensation system has existed in Washington State for 105 years. Washington was one of the first states to enact workers’ compensation laws. Our state’s Workmen’s Compensation Act, established on July 28, 1911, was designed to protect workers and employers from injustice and financial hardship arising from work-related injuries in extremely hazardous work. In 1923, Washington became one of only two states where workers pay a portion of the insurance premiums.
Washington’s workers’ compensation insurance was provided solely through the State Fund until 1971, when the Legislature expanded the scope of coverage to virtually all workers and created an option for qualified employers to self-insure. The Self-Insurance Program allows employers with sufficient financial resources to pay the cost of claims for their injured workers from their own funds and assume significant responsibility for their own claims administration. The workers of self-insured employers are entitled to the same rights and benefits as those workers insured by the State Fund managed by L&I. There are approximately 355 employers who are self-insured, covering close to one-quarter of all workers in Washington.
The State Fund has an optional financial incentive program, called Retrospective Rating, to help qualifying employers reduce their industrial insurance costs through safety and return-to-work efforts. Employers who join the Retrospective Rating Program receive partial refunds if their claim costs are lower than expected, but must pay additional premiums if their claim costs are higher than expected.
The Industrial Insurance Fund covers approximately 177,000 employers and 2.8 million workers statewide. Total premiums assessed during fiscal year 2016, including both the employer and

5
worker portions, were $2.12 billion. Over 95,000 claims were accepted in fiscal year 2016; about82 percent of the accepted claims were for medical treatment only and received no compensation for time off work or disability-related benefits. Approximately 38,164 claims are active in any given month, of which about 16,741 are receiving time-loss benefits, many of which involve long-term disability and complex medical issues. In fiscal year 2016, retraining plans were completed by 438 injured workers who were not able to return to any type of work at the employer of injury.
MAJOR INITIATIVES
The Department of Labor & Industries covers many workplace and safety issues, all of which fall within two primary lines of business: prevention and recovery, each requiring support.
Prevention: L&I works to prevent the things that threaten the lives and livelihoods of the people who live and work in Washington from ever happening. That means preventing workplace injuries and fatalities, the failure of equipment we regulate, violations of worker’s wage and labor rights, and fraud.
Recovery: When something does go wrong on the job, L&I strives to ensure remediation and recovery – working to make individuals, workplaces, and communities whole again. Success in recovery means that those who are injured get reconnected to the workforce as quickly as possible, those who are wronged get speedy relief and those who wronged them pay the right penalty or make restitution.
These two lines of business provide key guidance and direction as the agency prepares to better serve its customers of the future through its Business Transformation initiative. The goal is to project the needs and service preferences of future customers in technology, accessibility, and service, and then adapt in advance to prepare for those needs.
L&I also measures specific categories of its work. Governor Jay Inslee directed state agencies to measure performance, improvements, innovation, engagement, transparency and accountability in state government. In response, L&I is focused on five goals:
1. Make workplaces safe.
2. Help injured workers heal and return to work.
3. Make it easy to do business with L&I.
4. Help honest workers and businesses by cracking down on the dishonest ones.
5. Ensure L&I is an employer of choice.
L&I has made great strides in its goal to make workplaces safe by reducing the rate of injury and fostering a culture of safety. Over the last decade, L&I has been instrumental in reducing the occupational illness and injury rate in Washington by almost one third. L&I conducted more than

6
7,200 workplace safety and health inspections and consultations in 2015. In the most recent year for which complete data is available (2014), Washington had the nation’s ninth lowest workplace fatality rate, more than 20 percent lower than the national average.
L&I is a national leader in helping injured workers heal and return to work, with innovative incentives and return-to-work programs. The agency strives to create a culture in which employers, workers, medical providers, vocational experts, and L&I staff focus on maintaining the workers’ connection to the workforce, along with their motivation to return to work. This culture, combined with quality medical services and operational efficiencies, saves employers money — an estimated $742 million in reduced benefit liabilities over the past three fiscal years. Through these programs and initiatives, long-term disability has been avoided for 560 injured workers each year; and 4,200 employers received more than $4 million to keep 18,000 workers on light duty while healing. L&I promotes high-quality, evidence-based care and is a national leader in reducing chronic opioid use, which is down to about one percent of incoming time-loss claims. These and other measures help to control health care cost growth, which is about 4.5 percent for 2016.
In late 2015, L&I began offering direct deposit and debit card options for injured workers and crime victims as part of our efforts to make it easier to do business with L&I. In the first full month, we made 1,218 electronic payments. A paper check remains an option, yet in today’s world, we expect to see rapid growth in the use of direct deposit and debit card payments. Doing business with L&I also got much easier with our new “My L&I” dashboard for employers that puts the information they want most in plain view. In addition, our agency-wide initiative to better serve limited English proficiency customers includes mandatory eLearning for all staff on how to use a telephone interpreter service when they get a call from a person who speaks limited English.
L&I is cracking down on unscrupulous business practices with improved methods of identifying illegal activities. The agency is working with the Washington State Attorney General’s Office to step up criminal and civil enforcement, especially cases of wage theft. L&I investigations resulted in returning more than $4.4 million in wages to workers last fiscal year ($2.8 million in unpaid wages and $1.6 million in prevailing wage). L&I also is continuing efforts to identify and hold accountable workers, providers and businesses that defraud the workers’ compensation system. For every dollar spent on combatting workers’ compensation fraud in fiscal year 2015, $8.93 was recovered by L&I. In the past two years, the agency referred a total of 28 fraud cases to the Attorney General for consideration of criminal prosecution, 14 in fiscal year 2015 and another 14 in fiscal year 2016.
Ensuring L&I is an employer of choice focuses on providing a culture of trust while developing opportunities for workplace flexibility, such as alternative schedules and telework options. L&I continues to encourage and promote safety and well-being, as well as to provide employees with opportunities to grow and learn. L&I continues to use Lean to empower employees to make decisions that affect their work. Employee-led Lean projects have reduced time for claim processing, improved relationships with customers, streamlined our collections process, and reduced burden on staff. Participation in wellness initiatives is brisk among the agency’s employees, with more than 3,000 participants in agency-wide wellness campaigns in fiscal year
2016. L&I also added a lactation room, expanded onsite nutritional food options, and increased engagement in the SmartHealth wellness platform to 60 percent of the workforce.
ACKNOWLEDGEMENTS
As in the work and service we provide every day, this Statutory Financial Information Report represents our commitment to maintain excellence in financial reporting, and the financial statements are in conformance with the highest standards of financial accountability.
The preparation of this report could not have been accomplished without the professionalism and dedication demonstrated by the financial and management personnel of L&I, the Washington State Office of Financial Management, and the Washington State Investment Board.
Sincerely,
Joel Sacks Director
Randi Warick Deputy Director forFinancial Management
Victoria Kennedy Assistant Director for Insurance Services
7

St a t e o f W ash in g t on In d u s t r i a l In s u r an ce Fu nd
8
Organization Chart
June 30, 2016
Governor
Director
-------------------
Deputy Director
Communication &
Web Services
Occupational
Safety and Health
Government
Affairs & Policy
Division
Human Resources
Information
Services
Insurance Services
Fraud Prevention &
Labor Standards
Field Services &
Public Safety
Health Services
Analysis
Employer Services
Return to Work
Partnerships
Claims
Administration
Office of the
Medical Director
Self-Insurance
Support Services
Legal Services
Integrated Claims
Services
Deputy Director
for Financial
Management
Office of the
Attorney General
Administrative
Services
Actuarial Services
Crime Victims
Lean
Transformation
Ofice
Risk Management
& Internal Safety
SHARP
Strategy &
Performance
Internal
Auditor
Executive
Assistant
St a t e o f W ash in g t on In d u s t r i a l In s u r an ce Fu nd
9
Financial Section

St a t e o f W ash in g t on In d u s t r i a l In s u r an ce Fu nd
10

11
w w w . e i d e b a i l l y . c o m
4310 17th Ave. S. | P.O. Box 2545 | Fargo, ND 58108-2545 | T 701.239.8500 | F 701.239.8600 | EOE 11
Independent Auditor’s Report
Mr. Joel Sacks Director Washington State Department of Labor and Industries Industrial Insurance Fund Olympia, Washington
Report on the Financial Statements We have audited the accompanying consolidated statutory financial statements (referred to as the financial statements) of Washington State Department of Labor and Industries Industrial Insurance Fund (Fund), which comprise the consolidated statutory statement of admitted assets, liabilities, and contingency reserve as of June 30, 2016 and 2015, and the related consolidated statutory statements of operations and changes in contingency reserve, and consolidated statutory cash flows for the years then ended, and the related notes to the consolidated statutory financial statements.
Management’s Responsibility for the Financial Statements Management is responsible for the preparation and fair presentation of these statutory financial statements in accordance with the accounting practices prescribed or permitted by the Insurance Department of the State of Washington. Management is also responsible for the design, implementation, and maintenance of internal control relevant to the preparation and fair presentation of statutory financial statements that are free from material misstatement, whether due to fraud or error.
Auditor’s Responsibility Our responsibility is to express an opinion on these statutory financial statements based on our audits. We conducted our audits in accordance with auditing standards generally accepted in the United States of America. Those standards require that we plan and perform the audit to obtain reasonable assurance about whether the financial statements are free from material misstatement.
An audit involves performing procedures to obtain audit evidence about the amounts and disclosures in the financial statements. The procedures selected depend on the auditor’s judgment, including the assessment of the risks of material misstatement of the financial statements, whether due to fraud or error. In making those risk assessments, the auditor considers internal control relevant to the entity’s preparation and fair presentation of the financial statements in order to design audit procedures that are appropriate in the circumstances, but not for the purpose of expressing an opinion on the effectiveness of the entity’s internal control. Accordingly, we express no such opinion. An audit also includes evaluating the appropriateness of accounting policies used and the reasonableness of significant accounting estimates made by management, as well as evaluating the overall presentation of the financial statements.
We believe that the audit evidence we have obtained is sufficient and appropriate to provide a basis for our audit opinions.

1212
Basis for Adverse Opinion on U.S. Generally Accepted Accounting Principles As described in Note 1 to the financial statements, the statutory financial statements are prepared using accounting practices prescribed or permitted by the Insurance Department of the State of Washington, which is a basis of accounting other than accounting principles generally accepted in the United States of America. The effects on the financial statements of the variances between the statutory basis of accounting described in Note 1 and accounting principles generally accepted in the United States of America, although not reasonably determinable, are presumed to be material.
Adverse Opinion on U.S. Generally Accepted Accounting Principles In our opinion, because of the significance of the matter described in the Basis for Adverse Opinion on U.S. Generally Accepted Accounting Principles paragraph, the financial statements referred to above do not present fairly, in accordance with accounting principles generally accepted in the United States of America, the financial position of the Fund as of June 30, 2016 and 2015, or the results of its operations or its cash flows for the years then ended.
Opinion on Regulatory Basis of Accounting In our opinion, the financial statements referred to above present fairly, in all material respects, the admitted assets, liabilities, and contingency reserve of the Fund as of June 30, 2016 and 2015, and the results of its operations and its cash flows for the years then ended, on the basis of accounting described in Note 1.
Other Matters
Required Supplementary Information Our audits were conducted for the purpose of forming an opinion on the statutory-basis financial statements taken as a whole. The accompanying supplementary information included in the Supplemental Schedule of Investment Risk Interrogatories and the Summary Investment Schedule on pages 85 through 89 are required to be presented to comply with the National Association of Insurance Commissioners’ Annual Statement Instructions and the National Association of Insurance Commissioners’ Accounting Practices and Procedures Manual and are not a required part of the basic statutory financial statements. Such information included in the schedules referred to above is the responsibility of management, is presented for purposes of additional analysis and was derived from and relates directly to the underlying accounting and other records used to prepare the financial statements. The information has been subjected to the auditing procedures applied in the audit of the financial statements and certain additional procedures, including comparing and reconciling such information directly to the underlying accounting and other records used to prepare the financial statements or to the financial statements themselves, and other procedures in accordance with the auditing standards generally accepted in the United States of America. In our opinion, the information is fairly stated in all material respects in relation to the financial statements taken as a whole.
Other Information Our audit was conducted for the purpose of forming opinions on the financial statements. The Introductory Section, Management’s Discussion and Analysis, the Statement of Actuarial Opinion Section, and Schedule of Undiscounted Claims Development are presented for purposes of additional analysis and are not a required part of the financial statements.

1313
The Schedule of Undiscounted Claims Development is the responsibility of management and was derived from and relate directly to the underlying accounting and other records used to prepare the financial statements. Such information has been subjected to the auditing procedures applied in the audit of the financial statements and certain additional procedures, including comparing and reconciling such information directly to the underlying accounting and other records used to prepare the financial statements or to the financial statements themselves, and other additional procedures in accordance with auditing standards generally accepted in the United States of America. In our opinion, the information is fairly stated in all material respects in relation to the financial statements taken as a whole.
The information contained in the Introductory Section, Management Discussion and Analysis and the Statement of Actuarial Opinion sections have not been subjected to the auditing procedures applied in the audit of the financial statements and, accordingly, we do not express an opinion or provide any assurance on them.
Fargo, North Dakota December 9, 2016

St a t e o f W ash in g t on In d u s t r i a l In s u r an ce Fu nd
14

St a t e o f W ash in g t on In d u s t r i a l In s u r an ce Fu nd
15
Management’s Discussion and Analysis
Our management’s discussion and analysis of the state of Washington Industrial Insurance Fund’s
(State Fund) Statutory Financial Information Report provides an overview of the Industrial
Insurance Fund’s financial performance for the fiscal years ended June 30, 2016 and 2015. The
information included here should be considered along with the transmittal letter, which can be
found on pages 3-7 of this report, and the accompanying Consolidated Statutory Financial
Statements and notes to the Consolidated Statutory Financial Statements, which follow this
narrative.
History and Information that Makes the State of Washington’s Industrial Insurance Fund
Unique
Washington was one of the first states to enact workers’ compensation laws. The state of
Washington’s Workmen’s Compensation Act established the industrial insurance system in 1911,
covering only extremely hazardous work. Washington’s workers’ compensation insurance was
provided solely through the State Fund until 1971, when the system underwent a major overhaul.
It was then that the legislature expanded the scope of coverage to virtually all workers and created
an option for qualified employers to self-insure, thus paying the cost of claims for their injured
workers from their own funds and also assuming responsibility for their own claims
administration.
Washington State, through Title 51 of the Revised Code of Washington (RCW), requires all
employers, unless exempted, to secure coverage for job-related injuries and illnesses, either by
paying insurance premiums to the Industrial Insurance Fund or by self-insuring. Direct private
insurance is not authorized, although self-insurers are permitted to reinsure up to 80 percent of
their obligations. The state of Washington’s Department of Labor and Industries (L&I) operates
as an exclusive workers’ compensation fund, one of only four remaining in the United States.
In Washington, employers and workers agreed in the 1930s to base premiums on the workers’
exposure to risk (hours on the job). Also, Washington requires both the employers and workers to
contribute to the cost of Medical Aid premiums.
Under statute RCW 51.16.035, L&I is required to have the lowest possible rates while maintaining
solvency of the system. L&I is also required to limit rate fluctuations, follow recognized insurance
principles, and stimulate and encourage accident prevention.
St a t e o f W ash in g t on In d u s t r i a l In s u r an ce Fu nd
16
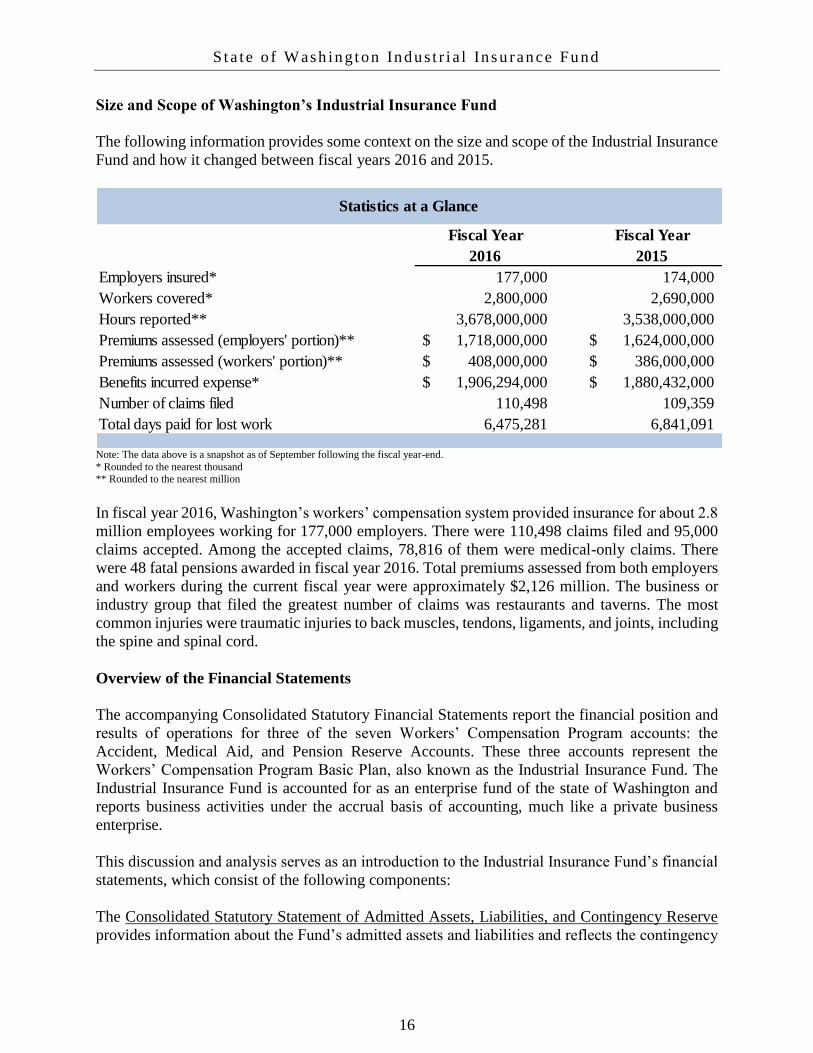
Size and Scope of Washington’s Industrial Insurance Fund
The following information provides some context on the size and scope of the Industrial Insurance
Fund and how it changed between fiscal years 2016 and 2015.
Fiscal Year Fiscal Year
2016 2015
Employers insured* 177,000 174,000
Workers covered* 2,800,000 2,690,000
Hours reported** 3,678,000,000 3,538,000,000
Premiums assessed (employers' portion)** 1,718,000,000$ 1,624,000,000$
Premiums assessed (workers' portion)** 408,000,000$ 386,000,000$
Benefits incurred expense* 1,906,294,000$ 1,880,432,000$
Number of claims filed 110,498 109,359
Total days paid for lost work 6,475,281 6,841,091
Statistics at a Glance
Note: The data above is a snapshot as of September following the fiscal year-end.
* Rounded to the nearest thousand ** Rounded to the nearest million
In fiscal year 2016, Washington’s workers’ compensation system provided insurance for about 2.8
million employees working for 177,000 employers. There were 110,498 claims filed and 95,000
claims accepted. Among the accepted claims, 78,816 of them were medical-only claims. There
were 48 fatal pensions awarded in fiscal year 2016. Total premiums assessed from both employers
and workers during the current fiscal year were approximately $2,126 million. The business or
industry group that filed the greatest number of claims was restaurants and taverns. The most
common injuries were traumatic injuries to back muscles, tendons, ligaments, and joints, including
the spine and spinal cord.
Overview of the Financial Statements
The accompanying Consolidated Statutory Financial Statements report the financial position and
results of operations for three of the seven Workers’ Compensation Program accounts: the
Accident, Medical Aid, and Pension Reserve Accounts. These three accounts represent the
Workers’ Compensation Program Basic Plan, also known as the Industrial Insurance Fund. The
Industrial Insurance Fund is accounted for as an enterprise fund of the state of Washington and
reports business activities under the accrual basis of accounting, much like a private business
enterprise.
This discussion and analysis serves as an introduction to the Industrial Insurance Fund’s financial
statements, which consist of the following components:
The Consolidated Statutory Statement of Admitted Assets, Liabilities, and Contingency Reserve
provides information about the Fund’s admitted assets and liabilities and reflects the contingency

St a t e o f W ash in g t on In d u s t r i a l In s u r an ce Fu nd
17
reserve as of June 30, 2016 and 2015. The Consolidated Statutory Statement of Admitted Assets,
Liabilities, and Contingency Reserve can be found on page 31 of this report.
The Consolidated Statutory Statement of Operations and Changes in Contingency Reserve shows
how the Fund’s contingency reserve changed during the fiscal year. It presents revenues and
expenses for fiscal years 2016 and 2015. The Consolidated Statutory Statement of Operations and
Changes in Contingency Reserve can be found on page 32 of this report.
The Consolidated Statutory Statement of Cash Flows reflects cash collections and cash payments
to arrive at the net increase or decrease in cash and cash equivalents during fiscal years 2016 and
2015. The Consolidated Statutory Statement of Cash Flows can be found on page 33 of this report.
The Notes to the Consolidated Statutory Financial Statements are an integral part of the financial
statements and are essential to a full understanding of the Industrial Insurance Fund’s financial
position and results of operations presented in the financial statements. The Notes to the
Consolidated Statutory Financial Statements can be found on pages 37-80 of this report.
These financial statements have been prepared in conformity with the Statutory Accounting
Principles (SAP), as promulgated by the National Association of Insurance Commissioners. The
main purpose of SAP-based information is to determine solvency. Solvency is defined as “the
availability of the Industrial Insurance Fund’s admitted assets to satisfy its obligations to injured
workers and beneficiaries.” The Notes to the Consolidated Statutory Financial Statements provide
additional information that is essential to a full understanding of the data provided in the
Consolidated Statutory Financial Statements.
Elimination for Consolidated Financial Statements
It is important to the readers of the Consolidated Statutory Statement of Admitted Assets,
Liabilities, and Contingency Reserve that we include details of each account, report the true
contingency reserve balance, and show compliance with the statutory Pension Reserve Account
transfer requirement. Each year, the Pension Reserve Account’s assets and liabilities are evaluated,
and a transfer is made between the Accident, Pension Reserve, and Second Injury Accounts, as
required by law. In fiscal year 2016, the receivable and the accrued liability of $123,411 million
resulting from the transfer from the Accident Account to the Pension Reserve Account was
eliminated in order to arrive at an accurate consolidated Industrial Insurance Fund balance.

St a t e o f W ash in g t on In d u s t r i a l In s u r an ce Fu nd
18
Financial Position
The Industrial Insurance Fund’s financial position at June 30, 2016 and 2015 was as follows:
June 30, 2016
June 30, 2015 $ Change % Change
Admitted Assets
Fixed income investments 12,665,856$ 12,008,655$ 657,201$ 5.5%
Equities investments 1,766,364 1,895,746 (129,382) (6.8%)
Short-term investments 161,305 108,857 52,448 48.2%
Receivable for securities 5 5 - 0.0%
Total Investments 14,593,530 14,013,263 580,267 4.1%
Securities lending collateral 114,835 68,406 46,429 67.9%
Interest receivable 109,871 112,021 (2,150) (1.9%)
Cash and cash equivalents 12,526 11,385 1,141 10.0%
Premiums receivable, net 558,249 531,231 27,018 5.1%
Other assets 81,716 83,796 (2,080) (2.5%)
Total Admitted Assets 15,470,727$ 14,820,102$ 650,625$ 4.4%
Liabilities and Contingency Reserve
Benefit liabilities 12,978,157$ 12,660,158$ 317,999$ 2.5%
Claims administration liabilities 622,547 580,764 41,783 7.2%
Retrospective rating adjustments 162,367 184,980 (22,613) (12.2%)
OPEB liabilities 53,077 42,573 10,504 24.7%
Other liabilities 46,822 61,661 (14,839) (24.1%)
Collateral from securities lending activities 114,835 68,406 46,429 67.9%
Total Liabilities 13,977,805 13,598,542 379,263 2.8%
- Contingency Reserve 1,492,922 1,221,560 271,362 22.2%
Total Liabilities and Contingency Reserve 15,470,727$ 14,820,102$ 650,625$ 4.4%
Summary of Financial Position
As of June 30, 2016 and 2015
(dollars in thousands)
Total admitted assets of $15,471 million increased by $651 million, or 4.4 percent, as compared
to the end of fiscal year 2015, primarily due to increases of $580 million in total investments, $46
million in securities lending collateral, and $27 million in premiums receivable.
The most significant changes in the investment balances are from increases of $657 million in
fixed income investments and $52 million in short term investments. The increases were partially
offset by a $129 million decrease in equities.
Additional fixed income investments were purchased with the proceeds from rebalancing
the equity portfolio. Also, cash collected from operations and net investment income
received was reinvested within the fixed income portfolio.
The increase in short-term investments for fiscal year 2016 is mainly due to timing of
investment activities.

St a t e o f W ash in g t on In d u s t r i a l In s u r an ce Fu nd
19
A decrease of $129 million in equities is mainly due to selling $205 million to rebalance
the equity portfolio in July 2015 and June 2016 and a decline in the stock market during
the first quarter of fiscal year 2016 resulting from uncertainty of global markets due to the
economic slowdown in China, as well as other emerging markets, and historically low oil
prices. Equities have recovered during the second, third, and fourth quarters of fiscal year
2016, but not enough to offset the larger first quarter loss.
Both assets and liabilities from securities lending activities increased by $46 million as compared
to June 30, 2015, due to an increased demand for borrowing securities. The June 30, 2016, balance
of cash collateral held for securities lending transactions was $115 million. Additional information
on securities lending collateral is included in Note 9 - Sale, Transfer and Servicing of Financial
Assets and Extinguishments of Liabilities of this report.
Most of the premiums receivable balance represents the estimated premiums due for the quarter
ended June 30, 2016. The estimated receivables have increased by $27 million as compared to
June 30, 2015, mostly as a result of an increase in the number of hours reported by employers and
premium rate increases in the Medical Aid Account, effective January 1, 2015, and in the Accident
Account, effective January 1, 2016.
Total benefit liabilities increased $318 million, or 2.5 percent, to $12,978 million during fiscal
year 2016, as shown by the following table:
Fiscal Year 2016 Fiscal Year 2015
Benefit liabilities, beginning 12,660,158$ 12,372,673$
New liabilities incurred, current year 1,621,358 1,662,520
Development on prior years
Change in reserve discount 353,097 236,214
Other development on prior liabilities (102,592) (55,220)
Change in discount rate 34,431 36,918
Claim payments (1,588,295) (1,592,947)
Change in benefit liabilities 317,999 287,485
Benefit liabilities, ending 12,978,157$ 12,660,158$
Benefit Liabilities
(in thousands)
It is expected that benefit liabilities will change every year due to normal activities, such as adding
the current accident year liabilities, discounting existing liabilities, and paying claims. In addition,
benefit liabilities also changed due to favorable development on prior liabilities and the following
managerial decision that had no direct relationship to claim operations: L&I has a plan to reduce
the pension discount rate from 6.5 to 4.5 percent by 2023. During fiscal year 2016, the pension
discount rate was reduced from 6.4 to 6.3 percent, which increased liabilities by $34 million.

St a t e o f W ash in g t on In d u s t r i a l In s u r an ce Fu nd
20
The net increases in benefit liabilities explained above were partially offset by the other
development on prior liabilities of $103 million from new information on previously-estimated
liabilities. A reduction in the number of anticipated active time-loss claims based on recent data
is the main reason for the other development on prior liabilities decrease. Detailed changes in the
benefit liabilities are explained in Note 10 - Changes in Benefit and Claims Administration
Liabilities of this report.
The Retrospective Rating Program is a voluntary financial incentive program offered by L&I to
reduce workplace injuries and costs associated with workers’ compensation claims. The program
provides an economic incentive to employers by refunding a portion of their workers’
compensation premiums if injury claims are below estimates during three annual evaluations. If
employer claims are above estimates, an additional premium is assessed to the employer’s account.
The Retrospective Rating Adjustments liability includes the estimated return of earned premiums,
net any additional premiums expected to be assessed through the final adjustment for all current
participants. This liability decreased $23 million as compared to June 30, 2015. The decrease was
largely due to reduced expected average retrospective rating refund percentages.
Other liabilities decreased $15 million, mainly due to a decrease of $10 million in the payable for
securities. The payable for securities had a balance of $10 million as of June 30, 2015, but there
were no payables for securities as of June 30, 2016. The payable for securities represents the
amount owed for the purchase of investment securities as of the end of the fiscal year that will not
be paid until July of the following fiscal year and fluctuates based on investment transaction
timing. The remaining decrease is mainly due to an increase in fiscal year 2015, other liabilities,
due to the accounting change described in Note 2.
The contingency reserve increased by $271 million due to greater premiums collected than current
accident year benefits incurred, investment income, and prior year benefit liabilities that increased
less than expected.

St a t e o f W ash in g t on In d u s t r i a l In s u r an ce Fu nd
21
Results of Operations
Industrial Insurance Fund operating results and certain key financial ratios are presented in the
following table:
Fiscal Year
2016
Fiscal Year
2015 $ Change % Change
Net premiums earned 1,963,909$ 1,808,152$ 155,757$ 8.6%
Net investment income earned 498,499 493,408 5,091 1.0%
Net investment realized gains 137,988 58,660 79,328 135.2%
Self-insured reimbursements 117,441 117,987 (546) (0.5%)
Other income 53,434 54,853 (1,419) (2.6%)
Total Revenue Earned 2,771,271 2,533,060 238,211 9.4%
Net benefits (losses) incurred 1,906,294 1,880,432 25,862 1.4%
Claims administration expenses (LAE) incurred 212,754 205,310 7,444 3.6%
Premium administration expenses incurred 46,983 42,349 4,634 10.9%
Other administration expenses incurred 41,708 42,474 (766) (1.8%)
Self-insured administration expenses incurred 28,267 27,901 366 1.3%
Non-insurance administration expenses incurred 55,597 56,433 (836) (1.5%)
Total Administration Expenses Incurred 385,309 374,467 10,842 2.9%
Total Expenses Incurred 2,291,603 2,254,899 36,704 1.6%
Net Income 479,668 278,161 201,507 72.4%
Other changes in contingency reserve (208,306) (2,540) (205,766) 8101.0%
Changes in contingency reserve, net 271,362 275,621 (4,259) (1.5%)
Beginning contingency reserve, July 1 1,221,560 945,939 275,621 29.1%
Ending Contingency Reserve, June 30 1,492,922$ 1,221,560$ 271,362$ 22.2%
(dollars in thousands)
Summary of Operations and Changes in Contingency Reserve
For the Fiscal Years Ended June 30, 2016 and 2015
Net premiums earned for the current period is the sum of net premiums collected and the changes
in premiums receivable and retrospective rating adjustments liability between June 30, 2015, and
June 30, 2016. Net premiums earned increased $156 million, mainly due to an increase in the
number of hours reported by employers and premium rate increases in the Medical Aid and
Accident Accounts. In fiscal year 2016, employers reported 3,695 million hours worked; this
figure increased from 3,538 million hours for fiscal year 2015. There has been a steady growth of
quarterly standard premiums for 21 quarters since March 31, 2011.
Net investment income earned of $498 million was $5 million higher during fiscal year 2016 than
fiscal year 2015. Despite continued low interest rates, interest income from bonds increased,
because there were more fixed income investments, as previously discussed.

St a t e o f W ash in g t on In d u s t r i a l In s u r an ce Fu nd
22
Net realized capital gains from the sale of fixed income and equity investments added $138 million
to net income in fiscal year 2016. Realized gains were higher in fiscal year 2016, mostly due to
the sale of fixed income and equity securities as a result of investment rebalancing activities.
In fiscal year 2016, benefits incurred increased $26 million from the prior year to $1,906 million.
Benefits incurred includes $1,588 million in benefits paid and a $318 million increase in benefit
liabilities. The increase in net benefits incurred resulted from the increase in the change in benefit
liabilities between fiscal year 2016 and fiscal year 2015.
Total administration expenses incurred increased $10.8 million over the prior year as a result of
the following: 1) increases in salaries and benefits due to the 3.0 percent increase in state employee
salaries, effective July 1, 2015, as approved by the legislature; 2) increase to the employer’s
contribution rate for employee retirement plans; 3) increase to the employer’s cost for employee
health insurance; 4) hiring of additional staff for new programs; and 5) changes in the way that
nonadmitted assets are accounted for.
The following chart provides detail on total expenses incurred in fiscal year 2016:
Other changes in the contingency reserve decreased $206 million due to unrealized losses on
equities and bonds. The stock market declined and the investment portfolio was rebalanced, as
previously mentioned, which resulted in $105 million of unrealized losses in equities. The $77
million of fixed income unrealized losses was due to a decrease in the market value of 36 lower
credit quality bonds in the portfolio. It is the Industrial Insurance Fund’s investment policy to
purchase only investment grade bonds. However, due to unforeseen circumstances, investment
grade bonds that were purchased are sometimes downgraded at a later date. Highly-leveraged
companies (e.g., oil and mining) that had a reduction in their sales, cash flow, and liquidity due to
Benefits Expense83.0%
Insurance Expenses
13.0%
Non-Insurance Expenses
3.0%
Self-Insured Expenses
1.0%
Fiscal Year 2016 Total Expenses Incurred

St a t e o f W ash in g t on In d u s t r i a l In s u r an ce Fu nd
23
various factors, such as prolonged low oil prices, the slowdown in China’s economy, or Brazil’s
recession, now have higher debt ratios and have been downgraded.
The biggest contributors to the unrealized loss are Brazil’s oil giant, Petrobras, as well as banks
and other companies impacted by Brazil’s recession. These unrealized losses account for $182
million of the $206 million decrease.
The following ratios, expressed as a percentage of total net premiums earned, are recognized
industry measures used to compare one insurance company to another:
Fiscal Year
2016
Fiscal Year
2015
Fiscal Year 2016
Excluding One-
time Adjustments
Loss ratio 97.1% 104.0% 88.2%
Loss adjustment expense (LAE) ratio 10.8% 11.4% 10.8%
Loss and LAE Ratio 107.9% 115.4% 99.0%
Underwriting and other expense ratio 4.5% 4.7% 4.5%
Combined Ratio 112.4% 120.1% 103.5%
Less: Net investment income ratio 25.4% 27.3% 25.4%
Operating Ratio 87.0% 92.8% 78.1%
Key Financial Ratios
The benefit (loss) and loss adjustment expense (LAE) ratios represent the total costs for
processing claims and benefits as a percentage of total net premiums earned. There are
many factors that impact loss and LAE ratios, including legislative decisions and claim
frequency, severity, and exposure.
The combined ratio expresses total insurance costs, including benefits and administration
expenses incurred, as a percentage of total net premiums earned. When the total insurance
costs exceed net premium revenues, the combined ratio is above 100 percent. The Industrial
Insurance Fund’s rates are set based on the anticipated breakeven rate. Income earned on
investments supplements premium revenues to cover expenses so that the lowest possible
rates can be set. As a result, it is expected that the Industrial Insurance Fund’s combined
ratio will exceed 100 percent.
The operating ratio reflects the combined ratio less the net investment income ratio and is
another industry measure of overall financial performance. Ratios above 100 percent
indicate that expenses are greater than the sum of premiums and net investment income
earned. The operating ratio does not include realized or unrealized investment gains.
Insurance companies are motivated to make profits and, therefore, work toward an
operating ratio below 100 percent. Unlike other insurance companies, the Industrial
Insurance Fund is operated as a part of state government, and in most years, its goal is to
break even rather than make a profit. However, the Industrial Insurance Fund has a 10-year

St a t e o f W ash in g t on In d u s t r i a l In s u r an ce Fu nd
24
plan to increase the contingency reserve to 14 percent of liabilities. The contingency
reserve was 10.8 percent of liabilities as of June 30, 2016.
In fiscal year 2016, benefit liabilities increased $34 million as a result of managerial
decisions that have no direct relationship to claim operations as discussed above. If these
one-time adjustments had not been made, the loss ratio would have been 99.0 percent and
the operating ratio would have been 78.1 percent.
The combined ratio decreased from 120.1 percent in fiscal year 2015 to 112.4 percent in
fiscal year 2016. The combined ratio decreased due to an increase in premiums earned.
The operating ratio decreased from 92.8 percent in fiscal year 2015 to 87.0 percent in fiscal
year 2016 as a result of the decrease in the combined ratio for the reasons stated above.
The LAE ratio of 10.8 percent and the underwriting and other expense ratio of 4.5 percent
remain consistently lower when compared to the workers’ compensation insurance
industry.
Cash Flows and Liquidity
Cash Flows - The primary sources of cash were from premiums collected and investment income.
The primary uses of cash were for benefit payments, administration expenses, and purchases of
investments.

St a t e o f W ash in g t on In d u s t r i a l In s u r an ce Fu nd
25
Cash flows of the Industrial Insurance Fund are summarized as follows:
Fiscal Year
2016
Fiscal Year
2015 $ Change % Change
Operations
Net premiums collected $ 1,902,084 $ 1,813,743 88,341$ 4.9%
Other reimbursements and income 146,092 108,949 37,143 34.1%
Net benefits paid (1,588,295) (1,592,947) 4,652 (0.3%)
Insurance administration expenses paid (244,508) (241,079) (3,429) 1.4%
Self-insured administration expenses paid (27,449) (26,480) (969) 3.7%
Non-insurance administration expenses paid (53,449) (51,532) (1,917) 3.7%
Operating Cash Flow In (Out) 134,475 10,654 123,821 1162.2%
Investment Activities
Investment income 499,812 487,010 12,802 2.6%
Net realized gains 137,988 58,660 79,328 135.2%
Purchases, net (766,608) (550,922) (215,686) 39.2%
Investment management expenses (4,526) (4,317) (209) 4.8%
Investment Cash Flow In (Out) (133,334) (9,569) (123,765) 1293.4%
Net increase in cash $ 1,141 $ 1,085 $ 56 5.2%
Cash Flow Summary
For the Fiscal Years Ended June 30, 2016 and 2015
(dollars in thousands)
Net premiums collected increased $32 million in the Accident Account and $56 million in the
Medical Aid Account over the prior year, for a total increase of $88 million. This increase was
mainly due to a higher number of hours reported by employers and premium rate increases in the
Medical Aid Account, effective January 2015, and in the Accident Account, effective January
2016.
Other reimbursements and income collected increased $37 million, mainly due to fiscal year 2015
experting, which determined that the Second Injury Account needed to transfer $33.5 million to
the Pension Reserve Account. During fiscal year 2015, pension liabilities for self-insured second
injuries were high due to a shortfall in investment income, an increase in liabilities due to the new
mortality table, and an increase in liabilities due to the reduction in the discount rate from 6.5 to
6.4%. In fiscal year 2014, only $3.5 million was transferred from the Second Injury Account to
the Pension Reserve Account.
Net benefits paid decreased $5 million when compared to the prior year, as explained below:
The Accident Account’s $18 million decrease in net benefits paid is mainly due to a decline
in current active time-loss claims.

St a t e o f W ash in g t on In d u s t r i a l In s u r an ce Fu nd
26
The Medical Aid Account’s $4 million decrease in net benefits paid resulted mainly from
fewer active medical claims, two fewer days paid during the fiscal year, and relatively low
medical inflation during the year.
The Pension Account’s net benefits paid increased $17 million, mainly because of higher
numbers of pensioners receiving benefits, together with higher average monthly benefits.
Insurance administration expenses paid have increased $3 million, or 1.4 percent, primarily due to
the increases in salaries and benefits and the 3.0 percent increase in state employee salaries
effective July 1, 2015, as approved by the legislature, increases to the employer contribution rate
for retirement and employer’s cost for health insurance, as well as the hiring of additional staff for
new programs.
The increase of $13 million in net investment income collected was mainly due to an increase in
bond investment income, because there were additional fixed income securities in fiscal year 2016.
There was $138 million in net realized gains in fiscal year 2016, an increase of $79 million from
the previous year. The increase is due to the sale of equities and fixed income investments as a
result of rebalancing activities, as discussed above.
Investment purchases exceeded sales by $216 million, mainly due to reinvesting investment
income and net income.
Liquidity - The Industrial Insurance Fund’s operations require sufficient liquidity to meet both
short-term and long-term requirements. Resources to ensure short-term liquidity come from two
basic factors:
L&I may increase rates in order to increase its contingency reserve, resulting in positive
cash flow.
Premiums are paid to L&I every three months.
The Industrial Insurance Fund has generally met its operating requirements by maintaining
appropriate levels of liquidity in its investment portfolio and through reinvesting positive cash
flow. The Industrial Insurance Fund is able to match projected cash inflows from premiums and
investment income from its portfolio with projected cash outflows for payment of benefits.
Future Plan
In 2012, L&I adopted a 10-year plan to increase the contingency reserve to a level between 13 and
15 percent of liabilities, while reducing the rate used to discount pension liabilities from 6.5 to 4.5
percent by 2023. L&I took the first step to reduce the pension discount rate in April 2015, moving
from 6.5 to 6.4 percent. The second step to reduce the pension discount rate occurred in April
2016, moving from 6.4 to 6.3 percent.

St a t e o f W ash in g t on In d u s t r i a l In s u r an ce Fu nd
27
L&I’s goal for fiscal year 2016 was to increase the contingency reserve balance from $1,222
million to $1,293 million by increasing premium rates and reducing benefit costs by $35 to $70
million. The fiscal year 2016 goal was met with the contingency reserve balance increasing to
$1,493 million.
L&I plans to increase the contingency reserve to a range between $1,493 million to $1,583 million,
while reducing the discount rate to a range between 6.3 and 5.75 percent during fiscal year 2017.
The final goal amounts will be based on discussions with the Workers’ Compensation Finance
Committee. There is additional information in Note 17 - Subsequent Events that will impact the
fiscal year 2017 contingency reserve.
Requests for Information
This report is designed to provide a general overview of the Industrial Insurance Fund and to
illustrate the Fund’s financial position and results of operations to interested parties. If you have
any questions about this report or need additional financial information, please contact the Chief
Accounting Officer at the Department of Labor & Industries, P.O. Box 44833, Olympia,
Washington 98504-4833.
In accordance with the Revised Code of Washington (RCW) 51.44.115, L&I also publishes a
Comprehensive Annual Financial Report (CAFR) for the Workers’ Compensation Program. This
report is prepared in compliance with Generally Accepted Accounting Principles (GAAP).
The Industrial Insurance Fund Statutory Financial Information Report and the Workers’
Compensation Program CAFR are available at L&I’s website at:
http://www.lni.wa.gov/ClaimsIns/Insurance/Learn/StateFund/Reports.

St a t e o f W ash in g t on In d u s t r i a l In s u r an ce Fu nd
28
St a t e o f W ash in g t on In d u s t r i a l In s u r an ce Fu nd
29
Consolidated Statutory Financial Statements

St a t e o f W ash in g t on In d u s t r i a l In s u r an ce Fu nd
30

St a t e o f W ash in g t on In d u s t r i a l In s u r an ce Fu nd
31
Consolidated Statutory Statement of Admitted Assets, Liabilities, and Contingency Reserve
As of June 30, 2016 and 2015 (rounded to the nearest thousand)
Elimination for
Accident Medical Aid Pension Reserve Consolidated Total Total
Account Account Account Statements June 30, 2016 June 30, 2015
Admitted Assets
Cash and Investments
Investments, net
Fixed income 4,716,417,000$ 4,298,570,000$ 3,650,869,000$ -$ 12,665,856,000$ 12,008,655,000$
Equities 563,654,000 762,931,000 439,779,000 - 1,766,364,000 1,895,746,000
Short-term 53,420,000 45,472,000 62,413,000 - 161,305,000 108,857,000
Receivable for securities 2,000 2,000 1,000 - 5,000 5,000
Total Investments 5,333,493,000 5,106,975,000 4,153,062,000 - 14,593,530,000 14,013,263,000
Securities lending collateral 88,568,000 254,000 26,013,000 - 114,835,000 68,406,000
Interest receivable 43,863,000 34,086,000 31,922,000 - 109,871,000 112,021,000
Cash and cash equivalents 6,835,000 3,597,000 2,094,000 - 12,526,000 11,385,000
Total Cash and Investments 5,472,759,000 5,144,912,000 4,213,091,000 - 14,830,762,000 14,205,075,000
Other Assets
Premiums receivable, net, incl. earned but-unbilled 346,453,000 211,796,000 - - 558,249,000 531,231,000
Real estate and improvements
(less $0 encumbrances) 18,589,000 18,588,000 - - 37,177,000 34,501,000
Self-insurance receivables, net 3,690,000 3,612,000 6,763,000 - 14,065,000 14,300,000
Miscellaneous receivables, net 1,508,000 608,000 151,769,000 (123,411,000) 30,474,000 34,995,000
Total Other Assets 370,240,000 234,604,000 158,532,000 (123,411,000) 639,965,000 615,027,000
Total Admitted Assets 5,842,999,000$ 5,379,516,000$ 4,371,623,000$ (123,411,000)$ 15,470,727,000$ 14,820,102,000$
Liabilities and Contingency Reserve
Liabilities
Benefits 4,708,421,000$ 3,927,450,000$ 4,342,286,000$ -$ 12,978,157,000$ 12,660,158,000$
Other Liabilities
Claim administration 218,746,000 403,801,000 - - 622,547,000 580,764,000
Retrospective rating adjustments 162,367,000 - - - 162,367,000 184,980,000
Accrued liabilities
OPEB claim administration 11,840,000 16,017,000 - - 27,857,000 22,838,000
OPEB other administration 15,114,000 10,106,000 - - 25,220,000 19,735,000
Other accrued liabilities 148,101,000 18,319,000 3,324,000 (123,411,000) 46,333,000 51,207,000
Deferred revenue 325,000 164,000 - - 489,000 493,000
Payable for securities - - - - - 9,961,000
Collateral from securities lending activities 88,568,000 254,000 26,013,000 - 114,835,000 68,406,000
Total Other Liabilities 645,061,000 448,661,000 29,337,000 (123,411,000) 999,648,000 938,384,000
Total Liabilities 5,353,482,000 4,376,111,000 4,371,623,000 (123,411,000) 13,977,805,000 13,598,542,000
Contingency Reserve 489,517,000 1,003,405,000 - - 1,492,922,000 1,221,560,000
Total Liabilities and Contingency Reserve 5,842,999,000$ 5,379,516,000$ 4,371,623,000$ (123,411,000)$ 15,470,727,000$ 14,820,102,000$
The Notes to the Statutory Financial Statements are an integral part of this statement.
The source of this financial information is the Washington State Agency Financial Reporting System with adjustments for statutory basis of accounting.

St a t e o f W ash in g t on In d u s t r i a l In s u r an ce Fu nd
32
Consolidated Statutory Statement of Operations and Changes in Contingency Reserve
For the Fiscal Years Ended June 30, 2016 and 2015 (rounded to the nearest thousand)
Total Total
Accident Medical Aid Pension Reserve Fiscal Year Fiscal Year
Account Account Account 2016 2015
Revenues
Net standard premiums earned 1,299,794,000$ 820,453,000$ -$ 2,120,247,000$ 1,995,759,000$
Less net retrospective rating adjustments (156,338,000) - - (156,338,000) (187,607,000)
Net premiums earned 1,143,456,000 820,453,000 - 1,963,909,000 1,808,152,000
Net investment income earned 197,326,000 155,543,000 145,630,000 498,499,000 493,408,000
Net fixed income investment realized gains 23,023,000 20,582,000 19,886,000 63,491,000 40,573,000
Net equity investment realized gains 40,028,000 34,233,000 236,000 74,497,000 18,087,000
Self-insured administration expense assessments 14,737,000 14,159,000 - 28,896,000 23,937,000
Self-insured second injury pension reserve assessments - - 65,459,000 65,459,000 72,169,000
Self-insured cash funded & bonded pension reimbursements - - 23,086,000 23,086,000 21,881,000
Fines, penalties, and interest 41,907,000 2,003,000 63,000 43,973,000 46,645,000
Other income 7,651,000 1,810,000 - 9,461,000 8,208,000
Total Revenues Earned 1,468,128,000 1,048,783,000 254,360,000 2,771,271,000 2,533,060,000
Expenses
Benefits incurred 598,498,000 704,355,000 603,441,000 1,906,294,000 1,880,432,000
Administration expenses incurred:
Insurance expenses incurred:
Claims administration expenses incurred 76,341,000 136,413,000 - 212,754,000 205,310,000
Premium administration expenses incurred 23,191,000 23,792,000 - 46,983,000 42,349,000
General insurance administration expenses incurred 13,427,000 5,968,000 - 19,395,000 20,894,000
Other agencies insurance expenses incurred 11,057,000 11,256,000 - 22,313,000 21,580,000
Total insurance expenses incurred 124,016,000 177,429,000 - 301,445,000 290,133,000
Self-insured administration expenses incurred 14,853,000 13,414,000 - 28,267,000 27,901,000
Non-insurance administration expenses incurred 39,562,000 16,035,000 - 55,597,000 56,433,000
Total administration expenses incurred 178,431,000 206,878,000 - 385,309,000 374,467,000
Total Expenses Incurred 776,929,000 911,233,000 603,441,000 2,291,603,000 2,254,899,000
Net Income (Loss) Before Transfers 691,199,000 137,550,000 (349,081,000) 479,668,000 278,161,000
Transfers In (Out)
Pension funding transfers (380,833,000) - 380,833,000 - -
Net Transfers In (Out) (380,833,000) - 380,833,000 - -
Net Income (Loss) 310,366,000 137,550,000 31,752,000 479,668,000 278,161,000
Other Changes in Contingency Reserve
Fixed income unrealized gains (losses) (35,358,000) (21,225,000) (20,004,000) (76,587,000) (5,132,000)
Equities unrealized gains (losses) (41,823,000) (51,789,000) (11,631,000) (105,243,000) 28,823,000
Change in nonadmitted assets (23,584,000) (2,775,000) (117,000) (26,476,000) (26,231,000)
Change in Contingency Reserve, Net 209,601,000 61,761,000 - 271,362,000 275,621,000
Beginning contingency reserve, July 1 279,916,000 941,644,000 - 1,221,560,000 945,939,000
Ending Contingency Reserve, June 30 489,517,000$ 1,003,405,000$ -$ 1,492,922,000$ 1,221,560,000$
The Notes to the Consolidated Statutory Financial Statements are an integral part of this statement.
The source of this financial information is the Washington State Agency Financial Reporting System with adjustments for statutory basis of accounting.

St a t e o f W ash in g t on In d u s t r i a l In s u r an ce Fu nd
33
Consolidated Statutory Statement of Cash Flows
For the Fiscal Years Ended June 30, 2016 and 2015 (rounded to the nearest thousand)
Total Total
Accident Medical Aid Pension Fiscal Year Fiscal Year
Account Account Reserve Account 2016 2015
Standard premiums collected 1,270,917,000$ 810,118,000$ -$ 2,081,035,000$ 1,957,968,000$
Less retrospective rating adjustments (178,951,000) - - (178,951,000) (144,225,000)
Net premiums collected 1,091,966,000 810,118,000 - 1,902,084,000 1,813,743,000
Self-insured administration expense reimbursements 14,148,000 13,593,000 - 27,741,000 24,129,000
Self-insured second injury pension reserve reimbursements - - 70,571,000 70,571,000 42,258,000
Self-insured cash funded and bonded pension reimbursements - - 24,558,000 24,558,000 15,065,000
Fines, penalties, and interest 24,775,000 1,673,000 - 26,448,000 26,622,000
Other income (expenses) 676,000 (3,881,000) (21,000) (3,226,000) 875,000
Fund transfers in (out) (391,378,000) - 391,378,000 - -
Operating Cash Flow In 740,187,000 821,503,000 486,486,000 2,048,176,000 1,922,692,000
Benefits paid 578,087,000 571,303,000 438,905,000 1,588,295,000 1,592,947,000
Administration expenses
Insurance expenses
Claims administration expenses 60,502,000 99,914,000 - 160,416,000 159,506,000
Premium administration expenses 21,638,000 22,593,000 - 44,231,000 40,453,000
General insurance administration expenses 12,904,000 5,791,000 - 18,695,000 20,270,000
Other agencies insurance expenses 10,617,000 10,549,000 - 21,166,000 20,850,000
Total insurance expenses 105,661,000 138,847,000 - 244,508,000 241,079,000
Self-insured administration expenses 14,341,000 13,108,000 - 27,449,000 26,480,000
Non-insurance administration expenses 37,871,000 15,578,000 - 53,449,000 51,532,000
Total Administration Expenses Paid 157,873,000 167,533,000 - 325,406,000 319,091,000
Operating Cash Flow Out 735,960,000 738,836,000 438,905,000 1,913,701,000 1,912,038,000
Net Operating Cash Flow In (Out) 4,227,000 82,667,000 47,581,000 134,475,000 10,654,000
Investment income - fixed income 197,791,000 155,033,000 145,625,000 498,449,000 484,741,000
Investment income - equities 449,000 600,000 314,000 1,363,000 2,269,000
Net realized gains on investments 63,051,000 54,815,000 20,122,000 137,988,000 58,660,000
Net (purchases) sales of investments (264,313,000) (290,541,000) (211,754,000) (766,608,000) (550,922,000)
Investment expenses (1,678,000) (1,576,000) (1,272,000) (4,526,000) (4,317,000)
Total Investment Cash Flow In (Out) (4,700,000) (81,669,000) (46,965,000) (133,334,000) (9,569,000)
Net Cash Flow In (Out) (473,000) 998,000 616,000 1,141,000 1,085,000
Beginning Cash, July 1 7,308,000 2,599,000 1,478,000 11,385,000 10,300,000
End of Period Cash 6,835,000$ 3,597,000$ 2,094,000$ 12,526,000$ 11,385,000$
The Notes to the Consolidated Statutory Financial Statements are an integral part of this statement.
The source of this financial information is Washington State's Agency Financial Reporting System (AFRS) with adjustments for statutory basis of accounting.

St a t e o f W ash in g t on In d u s t r i a l In s u r an ce Fu nd
34

St a t e o f W ash in g t on In d u s t r i a l In s u r an ce Fu nd
35
Notes to the Consolidated Statutory Financial Statements For the Fiscal Years Ended June 30, 2016 and 2015
Index Page
Note 1 - Summary of Significant Accounting Policies ...............................................................37
Note 2 - Accounting and Reporting Changes ..............................................................................48
Note 3 - Investments ....................................................................................................................49
Note 4 - Real Estate and Improvements ......................................................................................61
Note 5 - Investment Income .......................................................................................................62
Note 6 - Retirement Plans, Compensated Absences, Deferred Compensation
Plan, and Other Postemployment Benefits ....................................................................63
Note 7 - Commitments and Contingencies ..................................................................................67
Note 8 - Leases ............................................................................................................................68
Note 9 - Sale, Transfer and Servicing of Financial Assets
and Extinguishments of Liabilities ................................................................................69
Note 10 - Changes in Benefit and Claims Administration Liabilities ...........................................72
Note 11 - Retrospectively-Rated Contracts and Contracts
Subject to Redetermination ...........................................................................................74
Note 12 - Discounting of Liabilities for Unpaid Benefits or
Unpaid Claims Administration Expenses ......................................................................74
Note 13 - Related Party Transactions ............................................................................................77
Note 14 - Income Taxes ................................................................................................................77
Note 15 - Capital and Contingency Reserve .................................................................................78
Note 16 - Asbestos and Environmental Reserves ..........................................................................79
Note 17 - Subsequent Events .........................................................................................................79

St a t e o f W ash in g t on In d u s t r i a l In s u r an ce Fu nd
36

St a t e o f W ash in g t on In d u s t r i a l In s u r an ce Fu nd
37
Note 1 - Summary of Significant Accounting Policies
1.A. Nature of Operations
The state of Washington’s Department of Labor & Industries (L&I) administers the state’s
Workers’ Compensation Program. Through Title 51 of the Revised Code of Washington (RCW),
Washington State requires all employers, unless excluded or exempt, to secure coverage for job-
related injuries and illnesses, either by paying insurance premiums to the Industrial Insurance Fund
or by self-insuring. L&I is the exclusive writer of workers’ compensation insurance in the state of
Washington for all businesses except the self-insured. Direct private insurance is not authorized,
although self-insurers are permitted to reinsure up to 80 percent of their obligations.
Chapter 51.44 RCW provides six benefit accounts: the Accident, Medical Aid, Pension Reserve,
Supplemental Pension, Second Injury, and the Self-Insured Employer Overpayment
Reimbursement Accounts, primarily to make compensation payments to injured workers or to
medical providers for rehabilitation services to injured workers. A seventh account, called the
Industrial Insurance Rainy Day Fund Account, was created to receive transfers of funds from the
Accident and Medical Aid Accounts when assets for those accounts combined are between 10 and
30 percent in excess of their funded liabilities. The funds are then set aside to reduce a rate increase
or aid businesses during or recovering from economic recessions. The Industrial Insurance Rainy
Day Fund Account did not have any activity during fiscal year 2016 or balance on June 30, 2016.
These seven accounts are known collectively as the Workers’ Compensation Program.
The Accident, Medical Aid, and Pension Reserve Accounts are referred to as “the Industrial
Insurance Fund” and are the focus of this report. The Supplemental Pension, Second Injury, Self-
Insured Employer Overpayment Reimbursement, and Industrial Insurance Rainy Day Fund
Accounts are not part of the Industrial Insurance Fund and are not included in this report.
The Industrial Insurance Fund is self-sustaining through the ability to assess the appropriate rates
of insurance premiums and prudent investment management. The three accounts are maintained
on an actuarially solvent basis, except that a cash-flow basis is used for the components of the
Pension Reserve Account in which self-insured employers guarantee related benefits with a surety
bond. The accompanying consolidated statutory statements report on the financial position and
results of operations of the Industrial Insurance Fund.
1.A.1. Description of the Industrial Insurance Fund
There are three accounts making up the Industrial Insurance Fund: the Accident, Medical Aid, and
Pension Reserve Accounts.
The Accident Account was established on July 1, 1947, per RCW 51.44.010, and pays
compensation directly to injured workers for lost wages during temporary disability and permanent
partial disability awards. It also pays costs for vocational retraining and for structured settlements.
Pursuant to RCW 51.44.070, funds from the Accident Account are to be transferred to the Pension
Reserve Account for the present value of pensions awarded to survivors of fatally injured workers
and to workers who have a permanent total disability.

St a t e o f W ash in g t on In d u s t r i a l In s u r an ce Fu nd
38
Revenues for this account come from employer-paid premiums based on individual employers’
reported payroll hours and are reported net of refunds. Employers may elect to have their premiums
retrospectively rated with an annual adjustment for actual benefits incurred. The retrospective
adjustment calculation considers both the Accident and Medical Aid Accounts’ experience and
premiums together and may result in either a rebate of premiums paid or an assessment of
additional premiums due. All retrospective premium adjustments are financed entirely through the
Accident Account.
On behalf of injured workers, the Medical Aid Account, established on July 1, 1917, per RCW
51.44.020, pays for the cost of medical, vocational rehabilitation services, and Stay at Work
reimbursements. Equal contributions from employers and employees fund this account. It is the
employer’s responsibility to collect the employee portion of the medical aid premium and submit
the employee and employer contributions to L&I quarterly.
The Pension Reserve Account pays benefits to the surviving spouse or dependent of fatally injured
workers and to all permanently and totally disabled workers. This includes benefits for pensions
awarded to employees of self-insured employers.
Funding for pension payments is generated by transfers from the Accident and Second Injury
Accounts and cash-funded or bonded pension payments from self-insured employers. Funding
required to cover the estimated present cash value of monthly pension payments is calculated on
the basis of an annuity; such annuity values are based upon L&I’s experience as to rates of
mortality, disability, remarriage, and interest, according to RCW 51.44.070.
1.B. Accounting Practices and Basis of Presentation
The Industrial Insurance Fund follows the Statutory Accounting Principles (SAP), which include
the Statements of Statutory Accounting Principles (SSAP), as promulgated by the National
Association of Insurance Commissioners (NAIC), as directed by RCW 51.44.115. The SAP are
very conservative in nature and are designed to protect injured workers to ensure that, in the event
of liquidation, sufficient amounts have been set aside to provide for outstanding claims. This
accounting basis is used to present solvency and the adequacy of premium rates.
The SAP are required to be used by property and casualty insurance enterprises in the United
States (U.S.) when reporting their financial position to state insurance regulators, subject to any
differences prescribed or permitted by each state’s law. The NAIC defines prescribed accounting
practices as “… those practices that are incorporated directly or by reference by state laws,
regulations and general administrative rules applicable to all insurance enterprises domiciled in a
particular state. The NAIC Accounting Practices and Procedures Manual (AP&P) is not intended
to preempt states’ legislative and regulatory authority.”1 Washington’s prescribed differences
from the NAIC are addressed in RCW 48.13.071, which provides limits on investments. The
NAIC defines permitted practices as “…practices specifically requested by an insurer that depart
from NAIC SAP and state prescribed accounting practices, and have received approval from the
1 NAIC AP&P Manual as of March 2016, Section: Preamble Questions and Answers, Question 2, page P-13.

St a t e o f W ash in g t on In d u s t r i a l In s u r an ce Fu nd
39
insurer’s domiciliary state regulatory authority.”2 Financial reporting, operating and other
guidance that is codified in statute that relates to a statutory reporting entity and departs from
NAIC SAP is also generally accepted as prescribed practices.
In accordance with Title 51 RCW and Title 296 of the Washington Administrative Code (WAC),
the Industrial Insurance Fund is administered by L&I. Pursuant to Title 48 RCW and Title 284
WAC, L&I is not required to file annual statements with the Washington State Office of the
Insurance Commissioner (OIC). The Industrial Insurance Fund is not required to report to the OIC
or complete an annual statement in accordance with the NAIC annual statement filing instructions.
Title 51 directs the industrial insurance fund to establish reserving methodologies considering rates
of mortality, disability, remarriage and interest. Accordingly the Fund established a practice of
discounting on a non-tabular basis in a manner that complies with the guidance supplied in the
Title. SSAP No. 65 allows discounting fixed and reasonably-determinable payments on a tabular-
only basis. Non-tabular discounting is only permitted in certain instances in which states have
prescribed or permitted practices to allow it, which is the case for the Fund. (See Note 1.C.3 and
Note 12.B for additional information on discounting methodology and non-tabular discounting.)
In addition, the Industrial Insurance Fund recognizes a liability for the net Other
Postemployment Benefit (OPEB) obligation which includes the unfunded actuarial accrued
liability amortized over thirty years. The Industrial Insurance Fund participates in a
multiemployer OPEB plan. SSAP No. 92 states that employers with multiemployer plans are not
required to recognize the unfunded status of the OPEB plan, but are only required to recognize
the required contribution to the plan for the period reported. The Fund has elected to record this
liability given the basis for conservatism within statutory accounting principles and in
consideration that the impact of this election does not have a material impact on the financial
statements taken as a whole.
2 NAIC AP&P Manual as of March 2016, Section: Preamble Questions and Answers, Question 2, page P-13.

St a t e o f W ash in g t on In d u s t r i a l In s u r an ce Fu nd
40
The following table reconciles the Industrial Insurance Fund’s net income and contingency reserve
as reported on the accompanying financial statements and what they would have been if they were
recorded under NAIC SAP requirements:
SSAP # F/S Page F/S Line #
As of and For the
Fiscal Year Ended
June 30, 2016
As of and For the
Fiscal Year Ended
June 30, 2015
Net Income, WA Basis 479,668,000$ 278,161,000$
Prescribed Non-tabular discounting 65 31 Benefits (115,377,000) 46,125,000
Permitted OPEB administration liability 92 31 OPEB 10,504,000 10,274,000
Net Income, NAIC SAP Basis 374,795,000$ 334,560,000$
Contingency Reserve, WA Basis 1,492,922,000$ 1,221,560,000$
Prescribed Non-tabular discounting 65 31 Benefits (1,801,253,000) (1,685,876,000)
Permitted OPEB administration liability 92 31 OPEB 53,077,000 42,573,000
Contingency Reserve, NAIC SAP Basis (255,254,000)$ (421,743,000)$
* F/S Page 31 means that Liabilities and the Contingency Reserve are primarily impacted
Effect of Prescribed and Permitted Practices
The financial statement layout and terminology were selected based on the terminology and
formatting customary to governmental insurance funds. The Industrial Insurance Fund refers to
losses as “benefits” and loss adjustment expenses as “claims administration expenses.” Any
surplus remaining in the Fund is referred to as “contingency reserve.”
1.B.1. Use of Estimates
The preparation of financial information in conformity with SAP requires management to make
estimates and assumptions that affect the reported amounts of admitted assets, liabilities, and
contingency reserve at the date of the financial information and the reported amounts of revenues
and expenses during the reporting period. Material estimates that are susceptible to significant
changes include benefit and claims administration liabilities, premium receivables, self-insurance
receivables, retrospective rating adjustment liabilities, and accrued liabilities for other
postemployment benefits. Actual results could differ materially from those estimates.
Management’s estimates are based on its knowledge of and experience with past and current events
and circumstances and its assumptions about conditions it expects will exist in the future. The most
significant estimates made in these statutory financial statements are the benefit and claims
administration liabilities at the date of the financial information. Factors relevant to the estimation
of these liabilities include the estimation of the ultimate frequency and severity of losses, the level
of inflation of future medical costs over long periods of time, the future legal environment, and the
amount of future expenses required to investigate and settle claims. Management’s estimates are
reviewed after the fiscal year-end by a nationally recognized, qualified consulting actuarial firm.
The independent actuarial firm’s opinion is included at the end of this report.

St a t e o f W ash in g t on In d u s t r i a l In s u r an ce Fu nd
41
1.B.2. Differences between SAP and GAAP
The SAP followed by the Industrial Insurance Fund vary in some respects from Generally
Accepted Accounting Principles (GAAP) as promulgated by GASB. Some of the most significant
differences between SAP and GAAP are as follows:
Investments in bonds are reported for SAP at amortized cost or market value based on their
NAIC designation; for GAAP, investments in bonds are reported at fair value.
For SAP, all mortgage-backed and other loan-backed securities are adjusted for the effects
of changes in prepayment assumptions using the retrospective method, which equates the
present value of the actual and anticipated cash flows with the original cost of the
investment. The current balance is then increased or decreased to the amount that would
have resulted had the revised yield been applied since inception, and investment income is
correspondingly decreased or increased. Under GAAP, all mortgage-backed and other
loan-backed securities are reported at fair value.
SAP assets designated as nonadmitted assets are defined as “assets having economic value
other than those which can be used to fulfill policyholder obligations and assets unavailable
due to encumbrances or third party interests” and are excluded from total admitted assets.
These assets consist primarily of premium receivables in collection that have been
outstanding for over ninety days, office furniture, equipment, internally developed
software, and prepaid expenses. Nonadmitted assets are charged against the contingency
reserve unless otherwise specifically addressed within the NAIC’s AP&P Manual. Under
GAAP, premium receivables are presented net of allowance for doubtful accounts,
furniture, equipment and internally developed software are presented net of accumulated
depreciation, and prepaid expenses are presented at full cost.
SAP limits the aggregate amount of admitted electronic data processing equipment and
operating system software, net of accumulated depreciation, to 3 percent of the reporting
entity’s capital and surplus. Under GAAP, computer equipment and software purchases
meeting the state’s capitalization criteria are recorded as assets, net of accumulated
depreciation, with no limitations.
The focus of SAP accounting is solvency; therefore, it is concerned with assets that can be
used immediately to cover benefit liabilities. GAAP accounting is focused on “going
concern,” which assumes that an entity has the ability to survive, and therefore, assets and
liabilities are presented in the order of liquidity and classified as current and non-current.
The Consolidated Statutory Statement of Operations and Changes in Contingency Reserve
presents premiums earned and investment income as the primary revenue sources, and
expenses are presented as activities. GAAP presentations separate operating income from
investment income, since investment activity is not normally a primary revenue source.
GAAP also presents expenses by character rather than by the purpose of the item purchased
or service obtained and the net effect of revenues and expenses as a change in net position.

St a t e o f W ash in g t on In d u s t r i a l In s u r an ce Fu nd
42
Both SAP and GAAP require the statement of cash flows to be prepared using the direct
method. However, the statutory statement of cash flows differs in certain aspects from the
presentation required by GAAP. On the SAP Consolidated Statement of Cash Flows, “Cash
Flows In” includes operating transfers and other income. “Cash Flows Out” is categorized
by benefits paid and administration expenses. The GAAP statement of cash flows includes
a reconciliation between operating income from the statement of operations and cash flows
from operating activities.
1.C. Significant Accounting Policies
1.C.1. Recognition of Premiums
Workers’ compensation insurance premiums are determined by individual employers’ reported
payroll hours and insurance rates based on each employer’s risk classification(s) and past
experience. In addition to its regular premium plans, the Industrial Insurance Fund offers a
Retrospective Premium Rating Plan, under which an employer’s premiums are adjusted annually
for up to three years following the plan year, based on the employer’s actual loss experience.
Premiums are due within 30 days following each calendar quarter in which payroll hours are
reported. Net premiums receivable reported in the financial statement is an actuarial estimate of
the two most recent quarters’ uncollected premium balances, based on past collection statistics,
growth projection, observed development of premiums reported, statistical analysis, and other
factors, including actuarial judgment. This amount represents the estimated premiums that will
ultimately be collected. All premium receivables exceeding 90 days in age are adjusted as
nonadmitted assets in the current period and are not included in the net premiums receivable
amount. For premium receivables over 90 days in age, collection efforts are continued until the
premiums are collected or all legal means are exhausted.
According to SSAP No. 53, a premium deficiency reserve is recognized “…when the anticipated
losses, loss adjustment expenses, and maintenance costs exceed the recorded unearned premium
reserve and any future installment premiums on existing policies.” Because the Industrial
Insurance Fund has sufficient anticipated investment income and no unearned premium reserves
or installment premium contracts, no premium deficiency reserve is recorded.
1.C.2. Benefit and Claims Administration Liabilities
The Industrial Insurance Fund establishes benefit and claims administration liabilities arising from
its workers’ compensation coverage based on estimates of the ultimate cost of benefits that have
been reported but not resolved and claims that have been incurred but not reported. The length of
time for which such costs must be estimated varies depending on the type of benefit involved.
Since actual claim costs depend on complex factors such as inflation, changes in doctrines of legal
liabilities, claim adjudication, and judgments, the actual ultimate claim costs may differ from the
estimates.
Benefit and claims administration liabilities are recomputed quarterly using a variety of actuarial
and statistical techniques. These techniques are used to produce current estimates that reflect recent
settlements, claim frequency, expected inflation, and other economic, legal, and social factors. A

St a t e o f W ash in g t on In d u s t r i a l In s u r an ce Fu nd
43
provision for inflation in the calculation of estimated future benefits is implicit in the calculation,
because reliance is placed both on actual historical data that reflects past inflation and on other
factors that are considered to be appropriate modifiers of past experience.
Future premium income is not offset against benefit liabilities, because benefit liabilities come
from coverage periods for which premiums have, in general, already been fully earned. The
obligation to pay benefit and claims administration liabilities is not contingent upon any future
premiums for future coverage periods.
Adjustments to benefit and claims administration liabilities are charged or credited to benefit and
claims administration expense in the periods in which they are made. Unpaid benefits and claims
administration expenses include amounts based on past experience for claims development on
reported claims and benefits incurred but not reported. Such liabilities are necessarily based on
assumptions and estimates, and while management believes the amount is adequate, the ultimate
liability may be in excess of or less than the amount provided. The methods for making such
estimates and for establishing the resulting liabilities are continually reviewed, and any
adjustments are reflected in the period affected.
1.C.3. Discounting Methodology
The Industrial Insurance Fund discounts benefit and claims administration expense reserves to
reflect the time value of money. The Industrial Insurance Fund uses both tabular and non-tabular
discounting. Non-tabular discounting is an accounting practice that departs from SSAP No. 65 as
disclosed in 1.B. of this note. The bullets below discuss the discount method and rate applied to
each discounted liability category.
The benefit liabilities in the Pension Reserve Account are discounted on a tabular basis at
6.3 percent.
Liabilities in the Accident Account for pensions incurred but not-yet-awarded are
discounted on both a tabular and non-tabular basis. For each future pension award, the
estimated future pension payments are discounted from the anticipated payment dates back
to the anticipated date of the pension award on a tabular basis from 4.5 to 6.3 percent. The
payments are then discounted from the anticipated date of the pension award back to the
evaluation date on a non-tabular basis at 1.5 percent.
All other Accident and Medical Aid Account benefit and claims administration liabilities
are discounted on a non-tabular basis at 1.5 percent.
The discount rate is typically carried at long-term yield rates for risk-free assets, and the investment
term is set equal to the average duration of the benefit and claims administration expense payments.
Per L&I policy, the non-pension discount rate is equal to the Benchmark Rate less the Risk
Adjustment, rounded to the nearest one-half of a percentage point. The Benchmark Rate is the
five-year moving average of the U.S. 20-Year Treasury yield. The Risk Adjustment equals two
percentage points until the Benchmark Rate reaches 4.0 percent. Below 4.0 percent, the Risk
Adjustment is half the Benchmark Rate.

St a t e o f W ash in g t on In d u s t r i a l In s u r an ce Fu nd
44
1.C.4. Cash and Cash Equivalents
Cash includes cash in banks, cash on deposit with the Office of the State Treasurer (OST), and
cash on hand. It also consists of cash equivalents invested by the OST which are short-term, highly-
liquid investments that are readily convertible to known amounts of cash and so near their maturity
that they present insignificant risk of changes in value due to interest rate fluctuations. Under RCW
43.08.015, the OST has the statutory responsibility to ensure the effective cash management of
state public funds. RCW 43.84.080 authorizes the Treasurer to invest available cash and includes
a list of eligible investments.
The beginning and ending cash and cash equivalent amounts on the Consolidated Statutory
Statement of Cash Flows do not include short-term investments. It is not practical to include short-
term investments because of the volume of transactions and complexity involved in reporting, as
they are managed by the Washington State Investment Board (WSIB), a separate Washington State
agency.
1.C.5. Investments
The Industrial Insurance Fund uses the following accounting policies to value investments:
Investment grade bonds are stated at amortized cost using the scientific interest method.
Non-investment grade bonds with NAIC designations of 3-6 are stated at the lower of
amortized cost or fair value. Fair values are reported using pricing sources approved by the
NAIC.
Short-term investments are stated at amortized cost using the scientific interest method.
Per SSAP No. 2, accounting for short-term investments should follow guidance for similar
long-term investments (see discussion above on investment grade bonds). Therefore, any
short-term bond premiums and discounts are amortized using the scientific interest method.
Common stocks are stated at fair value.
Investment grade mortgage-backed and other loan-backed securities are stated at amortized
cost. Non-investment grade mortgage-backed and other loan-backed securities with NAIC
designations of 3-6 are stated at the lower of amortized cost or fair value. Fair values are
reported using pricing sources approved by the NAIC. In compliance with SSAP No. 43R,
changes in currently-estimated cash flows are reviewed quarterly using the State Street
Corporation’s investment valuation model for prepayment assumptions in valuing
mortgage-backed and other loan-backed securities. These securities are revalued using the
retrospective adjustment method. See Note 3.H. for other-than-temporary impairment
analysis of mortgage-backed and other loan-backed securities.
Securities Lending Collateral - Cash received as collateral on securities lending
transactions and investments made with that cash are reported as assets. Securities received
as collateral are reported as assets if the Industrial Insurance Fund has the ability to pledge
or sell them without a borrower default. Liabilities resulting from these transactions are
also reported in the Consolidated Statutory Statement of Admitted Assets, Liabilities, and

St a t e o f W ash in g t on In d u s t r i a l In s u r an ce Fu nd
45
Contingency Reserve. Securities lending transactions collateralized by securities that the
Industrial Insurance Fund does not have the ability to pledge or sell unless the borrower
defaults are not reported as assets or liabilities.
1.C.6. Unusual Items and Other Disclosures
The U.S. Department of Energy has contracted with L&I to pay benefits to the Industrial Insurance
Fund for workers injured on the job at the Hanford nuclear production complex. The Industrial
Insurance Fund has received amounts, including trust cash and trust investments, in advance from
the U.S. Department of Energy to cover the pension liability for these injured workers. These
amounts are not reported in the financial statements.
As of June 30, 2016, trust cash amounted to $210,003 and is available to reimburse the Industrial
Insurance Fund for monthly pension payments. In addition, trust investments totaling $2,477,539
were invested in U.S. Treasury Notes and are also available to reimburse the Industrial Insurance
Fund for future expenses. At June 30, 2015, trust cash and trust investment balances were $202,942
and $2,473,560, respectively.
The following tables summarize restricted assets at June 30, 2016 and 2015:
Restricted Asset Category
Total General
Account (G/A)
Restricted Assets
Restricted G/A
Assets Supporting
S/A Activity
Total Separate
Account (S/A)
Restricted Assets
Restricted S/A
Assets Supporting
G/A Activity
Total
Restricted Total Assets
% Restricted to
Total Assets
Total
Admitted
Assets
% Restricted to
Total Admitted
Assets
Collateral held under security
lending agreements $ 114,835 $ - $ - $ - $ 114,835 $ 114,835 100.00% $ 15,470,727 0.74%
Restricted Assets
June 30, 2016
(dollars in thousands)
Restricted Asset Category
Total General
Account (G/A)
Restricted Assets
Restricted G/A
Assets Supporting
S/A Activity
Total Separate
Account (S/A)
Restricted Assets
Restricted S/A
Assets Supporting
G/A Activity
Total
Restricted Total Assets
% Restricted to
Total Assets
Total
Admitted
Assets
% Restricted to
Total Admitted
Assets
Collateral held under security
lending agreements $ 68,406 $ - $ - $ - $ 68,406 $ 68,406 100.00% $ 14,820,102 0.46%
Restricted Assets
June 30, 2015
(dollars in thousands)

St a t e o f W ash in g t on In d u s t r i a l In s u r an ce Fu nd
46
The following tables summarize collateral at June 30, 2016 and 2015:
Restricted Asset
Category
Total General
Account
Collateral
G/A Collateral
Supporting S/A
Activity
Total Separate
Account
Collateral
S/A Collateral
Supporting G/A
Activity
Total
Collateral
% Collateral
to Total
Assets
Total Admitted
Assets
% Restricted to
Total Admitted
AssetsAssets received as
collateral for
security lending
agreements $ 114,835 $ - $ - $ - $ 114,835 100.00% $ 15,470,727 0.74%Liability to return
collateral from
security lending
agreements $ 114,835 $ - $ - $ - $ 114,835 100.00% $ 15,470,727 0.74%
Collateral
(dollars in thousands)
June 30, 2016
Restricted Asset
Category
Total General
Account
Collateral
G/A Collateral
Supporting S/A
Activity
Total Separate
Account
Collateral
S/A Collateral
Supporting G/A
Activity
Total
Collateral
% Collateral
to Total
Assets
Total Admitted
Assets
% Restricted to
Total Admitted
AssetsAssets received as
collateral for
security lending
agreements $ 68,406 $ - $ - $ - $ 68,406 100.00% $ 14,820,102 0.46%Liability to return
collateral from
security lending
agreements $ 68,406 $ - $ - $ - $ 68,406 100.00% $ 14,820,102 0.46%
Collateral
(dollars in thousands)
June 30, 2015
1.C.7. Capital Assets
Capital assets are tangible or intangible assets held and used in the Industrial Insurance Fund
operations that have a service life of more than one year and meet the state’s capitalization policy.
In accordance with the Washington State Office of Financial Management’s (OFM) policy, it is
the Industrial Insurance Fund’s policy to capitalize:
All land
Buildings, building improvements, improvements other than buildings, and leasehold
improvements with a cost of $100,000 or greater
All capital assets with a unit cost (including ancillary costs) of $5,000 or greater, unless
otherwise noted
Infrastructure with a cost of $100,000 or greater
Intangible assets, either purchased or internally developed, with a cost of $1,000,000 or
greater, that are “identifiable” by meeting either of the following conditions:
The asset is capable of being separated or divided and sold, transferred, licensed,
rented, or exchanged; or

St a t e o f W ash in g t on In d u s t r i a l In s u r an ce Fu nd
47
The asset arises from contractual or other legal rights, regardless of whether those
rights are transferable or separable.
All capital assets acquired with a Certificate of Participation
Capital assets are recorded at cost. Capital asset costs include the purchase price plus those costs
necessary to place the asset in its intended location and condition for use. Normal maintenance
and repair costs that do not materially add to the value or extend the life of capital assets are not
capitalized. The cost and related accumulated depreciation of disposed of capital assets are
removed from the accounting records.
The value of assets constructed for use in the Industrial Insurance Fund includes all direct
construction costs and indirect costs that are related to the construction. Net interest costs incurred
during the period of construction, if material, are capitalized.
Depreciation and amortization expenses are calculated using the straight-line method over the
estimated useful lives of the assets. Total depreciation and amortization expense for capital assets
was $10.2 million and $7.2 million at June 30, 2016 and 2015, respectively.
Generally, estimated useful lives are as follows:
Buildings and building components 5 to 50 years
Furnishings, equipment, and collections 3 to 50 years
Other improvements 3 to 50 years
Infrastructure 20 to 50 years
Intangible assets with definite useful lives 3 to 50 years
In accordance with SAP, not all capitalized assets are admitted for reporting purposes. Common
examples of nonadmitted capital assets are equipment, furniture, and internally developed
software. These nonadmitted assets are adjusted from the respective account’s contingency
reserve, and current purchases are immediately expensed. SSAP No. 16 allows electronic data
processing (EDP) equipment and operating system software to be admitted, up to three percent of
the contingency reserve. However, the Industrial Insurance Fund takes a more conservative
approach and does not admit any EDP equipment or operating system software.
1.C.8. Risk Management
The state of Washington operates a self-insurance liability program pursuant to RCW 4.92.130.
The state’s policy is generally not to purchase commercial insurance for the risk of losses to which
it is exposed. Instead, the state’s management believes it is more economical to manage its risks
internally and set aside assets for claims settlement in the Risk Management Fund, an internal
service fund. Commercial insurance is purchased for certain liabilities and to limit the exposure to

St a t e o f W ash in g t on In d u s t r i a l In s u r an ce Fu nd
48
catastrophic losses. Settled claims resulting from these risks have not exceeded commercial
insurance coverage in any of the past ten fiscal years. Otherwise, the self-insurance liability
program services all claims against the state for injuries and property damage to third parties.
The Industrial Insurance Fund participates in the state’s self-insurance liability program, in
proportion to its anticipated exposure to liability losses, to manage its various risks of loss related
to torts; theft of, damage to, and destruction of assets; errors and omissions; and natural disasters.
Note 2 - Accounting and Reporting Changes
Reclassifications
Certain reclassifications of amounts previously reported have been made to the accompanying
financial statements to maintain consistency between periods presented. Prior to fiscal year 2016,
claims administration expenses incurred were calculated by adding claims administration expenses
paid to the change in claims administration expense liabilities. Any excess accrued administration
expenses were reported as a nonadmitted asset. Beginning in fiscal year 2016, L&I decided to
change the method for reporting nonadmitted assets to be more consistent with the insurance
industry. The accrued administration expenses are now recorded as claim administration expenses,
and no adjustments are made on the balance sheet.
The reclassification was made in accordance with SSAP No. 3 Accounting Changes and
Correction of Errors. The cumulative effect was a $3,582,000 decrease in contingency reserve as
of July 1, 2015 , as shown in the table below. The total liabilities at July 1, 2015, increased by the
same amount. This change has no impact on net income or total admitted assets in the 2016 and
2015 fiscal years.
June 30, 2016 June 30, 2015
Contingency reserve at June 30, 2015 and 2014, as previously reported 1,225,142,000$ 949,521,000$
Cumulative effect of change in accounting principles - Change in Nonadmitted Assets (3,582,000) (3,582,000)
Contingency reserve at July 1, 2015 and 2014, as reclassified 1,221,560,000$ 945,939,000$
Total liabilities at June 30, 2016 and 2015, as previously reported 13,977,805,000$ 13,594,960,000$
Cumulative effect of change in accounting principles - Change in Nonadmitted Assets* - 3,582,000
Total liabilities at June 30, 2016 and 2015, as reclassified 13,977,805,000$ 13,598,542,000$
Change in Nonadmitted Assets
* Change reflected in other liabilities on the Statement of Admitted Assets, Liabilities, and Contingency Reserve

St a t e o f W ash in g t on In d u s t r i a l In s u r an ce Fu nd
49
Change in Estimate
Prior to fiscal year 2016, the liability for one of the self-insured employer’s pensions was estimated
on a cash-funded basis. Cash-funded pensions are included in the pension benefit liability estimate,
because the agency has the fiduciary responsibility to pay these benefits. In September of fiscal
year 2016, new information was obtained that changed the basis upon which the estimates were
formed from cash-funded to bonded. The pension liabilities associated with bonded pensions are
not included in the agency’s pension benefit liabilities, because the employer is guaranteeing the
payment. As a result, the claims payable liability estimate as of June 30, 2016, was reduced by
$24,129,000, which decreased claims expense and decreased the net position deficit by the same
amount.
Note 3 - Investments
3.A. Summary of Investment Policies
Under RCW 43.33A.030, trusteeship over the Industrial Insurance Fund’s investments is vested in
the voting members of the WSIB. The legislature established a standard of care for investment of
these funds in RCW 43.33A.140. Additionally, the WSIB and its staff must comply with other
state laws, such as the Ethics in Public Service Act, chapter 42.52 RCW, as it makes investment
decisions and seeks to meet its investment objectives.
In accordance with RCW 43.33A.110, Industrial Insurance Fund investments are to be managed
to limit fluctuations in the industrial insurance premiums and, subject to this purpose, achieve a
maximum return at a prudent level of risk. Based on this requirement, the strategic objectives are
to:
Maintain the solvency of the accounts.
Maintain premium rate stability.
Ensure sufficient assets are available to fund the expected liability payments.
Subject to the objectives above, achieve a maximum return at a prudent level of risk.
Performance objectives are intended to provide the WSIB and the Industrial Insurance Fund with
a way to measure the success of this investment policy, the overall asset allocation strategy, and
the implementation of that strategy over time. First and foremost, the performance of the
investment portfolios shall be judged relative to the strategic objectives. With the first three criteria
met, the actual rates of return of the portfolios will be compared to the Comparable Market Index
(CMI) for each account. The CMIs are developed and calculated with the goal to construct a
hypothetical passive portfolio, with the duration, asset allocation, and appropriate mix of fixed
income sectors based on the individual targets for each Industrial Insurance Fund account. The
return for each account’s portfolio should not be significantly different from that of its CMI over
the long-term.
St a t e o f W ash in g t on In d u s t r i a l In s u r an ce Fu nd
50
Eligible Investments - Eligible investments are securities and deposits that are in accordance with
the Industrial Insurance Fund’s investment policy and chapter 43.33A RCW. Eligible investments
include:
U.S. equities.
International equities.
U.S. Treasuries and government agencies.
Credit bonds.
Mortgage-backed securities rated investment grade, as defined by Barclays Capital Global
Family of Fixed Income Indices.
Asset-backed securities rated investment grade, as defined by Barclays Capital Global
Family of Fixed Income Indices.
Commercial mortgage-backed securities rated investment grade, as defined by Barclays
Capital Global Family of Fixed Income Indices.
Investment grade non-U.S. dollar bonds.
Investment Restrictions - To meet stated objectives, investments of the Industrial Insurance Fund
are subject to the following constraints:
All assets under the management of the WSIB are to be invested to maximize return at a
prudent level of risk, in accordance with RCW 43.33A.110 and RCW 43.33A.140.
Asset allocations will be reviewed every three to four years or sooner if there are significant
changes in funding levels or the liability durations.
Assets will be rebalanced across asset classes when the fair value of the assets falls outside
the policy ranges. The timing of any rebalancing will be based on market opportunities,
cash flows, and the consideration of transaction costs; therefore, they need not occur
immediately.
Sector allocation for U.S. equities should be within a range of 55 to 65 percent. Allocation
for international equities should be within a range of 35 to 45 percent.
No corporate fixed income issue cost shall exceed 3 percent of the Fund’s fair value at the
time of purchase, nor shall its fair value exceed 6 percent of the Fund’s fair value at any
time. This rule applies to any specific corporate bond relative to all of the Fund’s assets in
aggregate, across all accounts and all their asset class holdings.
The benchmark and structure for U.S. equities will be the broad U.S. stock market as
defined by the Morgan Stanley Capital International (MSCI) U.S. Investable Market Index.
St a t e o f W ash in g t on In d u s t r i a l In s u r an ce Fu nd
51
The benchmark and structure for international equities will be the MSCI All Country World
Ex U.S. Investable Market Index. Both portfolios will be 100 percent passively managed
in commingled index funds. The commingled funds may use futures for hedging or
establishing a long position.
The fixed income portfolios’ structures vary depending upon the required duration target.
The duration targets will be reviewed every three years or sooner if there are significant
changes in the funding levels or the liability durations.
Sector allocation of fixed income investments must be managed within the following
prescribed ranges:
U.S. Treasuries and government agencies 5 to 25 percent
Credit bonds 20 to 80 percent
Asset-backed securities 0 to 10 percent
Commercial mortgage-backed securities 0 to 10 percent
Mortgage-backed securities 0 to 25 percent
These targets are long-term in nature. Deviations may occur in the short-term as a result of
interim market conditions; however, if a range is exceeded, the portfolios must be
rebalanced to the target allocations as soon as it is practical.
Total market value of below-investment-grade credit bonds, as defined by Barclays Capital
Global Family of Fixed Income Indices, shall not exceed 5 percent of the total market value
of the funds. Although below-investment-grade mortgage-backed, asset-backed, and
commercial mortgage-backed securities may not be purchased, portfolio holdings that are
downgraded to those levels or are no longer rated may continue to be held. Total market
value of below-investment-grade mortgage-backed, asset-backed and commercial-
mortgage-backed securities shall not exceed 5 percent of total market value of the funds.
3.B. Interest Rate Risk
Interest rate risk is the risk that changes in interest rates over time will adversely affect the fair
value of an investment. The risk is managed within the portfolios using effective duration, which
is the measure of a debt investment’s exposure to fair value changes arising from changes in
interest rates. Increases in prevailing interest rates generally translate into decreases in fair values
of fixed income investments. The Industrial Insurance Fund does not have a formal policy
specifically for interest rate risk.
St a t e o f W ash in g t on In d u s t r i a l In s u r an ce Fu nd
52
As of June 30, 2016, the Industrial Insurance Fund’s portfolio was within the duration targets
below:
Accident Account – within plus or minus 20 percent of an effective duration target of seven
years
Medical Aid Account – within plus or minus 20 percent of an effective duration target of
six years
Pension Reserve Account – within plus or minus 20 percent of an effective duration target
of seven years
It is the goal of the fixed income portfolios to match the target durations. Although there may be
differences from the targets due to market conditions, over any extended period of time, those
differences should not be material.
3.C. Credit Risk
Credit risk is the risk that an issuer or other counterparty to an investment will not fulfill its
obligations. The Industrial Insurance Fund’s investment policies limit the fixed income securities
to investment grade or higher at the time of purchase. Investment grade securities are those fixed
income securities with a Moody’s rating of Aaa to Baa or a Standard and Poor’s rating of AAA to
BBB. The rated debt investments of the Industrial Insurance Fund as of June 30, 2016, were rated
by Moody’s and/or an equivalent national rating organization.
Concentration of Credit Risk - Concentration of credit risk is the risk of loss attributed to the
magnitude of an investment in a single issuer. The Industrial Insurance Fund’s policy states that
the corporate fixed income issues cost shall not exceed 3 percent of the Fund’s fair value at the
time of purchase, nor shall its fair value exceed 6 percent of the Fund’s fair value at any time.
There was no concentration of credit risk as of June 30, 2016.
Custodial Credit Risk - Custodial credit risk is the risk that in the event a depository institution
or counterparty fails, the Industrial Insurance Fund would not be able to recover the value of its
deposits, investments, or collateral securities. As of June 30, 2016, investment securities
(excluding cash, cash equivalents and repurchase agreements held as securities lending collateral)
are registered and held in the name of the WSIB for the benefit of the Industrial Insurance Fund
and are not exposed to custodial credit risk. There are no general policies relating to custodial
credit risk.
3.D. Foreign Currency Risk
Foreign currency risk is the risk that changes in exchange rates will adversely affect the fair value
of an investment or a deposit. The Industrial Insurance Fund does not have a formal policy to limit
foreign currency risk. The Industrial Insurance Fund had $671.6 million and $695.0 million
invested in an international commingled equity index fund at June 30, 2016 and 2015, respectively.
As such, no currency denomination risk is present at June 30, 2016.

St a t e o f W ash in g t on In d u s t r i a l In s u r an ce Fu nd
53
3.E. Derivatives
To manage its exposure to fluctuations in interest and currency rates while increasing portfolio
returns, the Industrial Insurance Fund is authorized to utilize various derivative financial
instruments, including collateralized mortgage obligations, financial futures, forward contracts,
interest rate and equity swaps, and options.
Derivative transactions involve, to varying degrees, market and credit risk. The Industrial
Insurance Fund mitigates market risks arising from derivative transactions by requiring collateral
in cash and investments to be maintained in an amount equal to the securities positions outstanding
and, thereby, prohibiting the use of leverage or speculation. Credit risks arising from derivative
transactions are mitigated by selecting and monitoring creditworthy counterparties and collateral
issuers.
Domestic and foreign passive equity index fund managers may also utilize various derivative
securities to manage exposure to risk and increase portfolio returns. Information on the extent of
use and holdings of derivative securities by passive equity index fund managers is unavailable.
The only derivative securities held directly by the Industrial Insurance Fund were collateralized
mortgage obligations (CMOs) of $922.5 million and $1.30 billion at June 30, 2016 and 2015,
respectively.
3.F. Reverse Repurchase Agreements
State law permits the Industrial Insurance Fund to enter into reverse repurchase agreements, i.e., a
sale of securities with a simultaneous agreement to repurchase them in the future at the same price
plus a contract rate of interest. The fair value of the securities underlying reverse repurchase
agreements normally exceeds the cash received, providing the dealers a margin against a decline
in fair value of the securities. If the dealers default on their obligations to resell these securities to
the state or provide securities or cash of equal value, the Industrial Insurance Fund would suffer
an economic loss equal to the difference between the fair value, plus accrued interest, of the
underlying securities and the agreement obligation, including accrued interest. There were no
reverse repurchase agreements during fiscal year 2016 or 2015, and there were no liabilities
outstanding as of June 30, 2016 or 2015.
3.G. Wash Sales Transactions
Wash sales are any transfers that occur when an asset is sold and the proceeds are reinvested within
30 days in the same or substantially the same security. These transactions involve unrated
securities or those with NAIC designations of 3 or below. There were no wash sale transactions in
the Industrial Insurance Fund during fiscal year 2016 or 2015.
3.H. Bonds
At June 30, 2016 and 2015, bonds were comprised of U.S. government, other governments,
corporate, mortgage-backed, and other loan-backed securities, with an aggregate book adjusted
carrying value (BACV) of $12,665,856,000 and $12,008,655,000 and fair value of

St a t e o f W ash in g t on In d u s t r i a l In s u r an ce Fu nd
54
$13,561,443,000 and $12,502,439,000, respectively, as shown in the following tables:
Book Adjusted
Carrying Value
Fair Value Excess
over BACV
BACV Excess
over Fair Value Fair Value
U.S. government obligations - excluding
mortgage-backed securities 2,008,377$ 99,474$ (42)$ 2,107,809$
All other government obligations 1,205,391 63,623 (1,341) 1,267,673
Mortgage-backed and other
loan-backed securities 1,359,978 99,818 (804) 1,458,992
Industrial and miscellaneous - excluding
mortgage-backed and other
loan-backed securities 7,978,367 681,828 (50,176) 8,610,019
Hybrid securities 113,743 3,207 - 116,950
Total 12,665,856$ 947,950$ (52,363)$ 13,561,443$
Book Adjusted Carrying Values and Fair Values
June 30, 2016
(in thousands)
Book Adjusted
Carrying Value
Fair Value Excess
over BACV
BACV Excess
over Fair Value Fair Value
U.S. government obligations - excluding
mortgage-backed securities 1,165,527$ 5,116$ (11,937)$ 1,158,705$
All other government obligations 1,300,556 59,458 (14,762) 1,345,252
Mortgage-backed and other
loan-backed securities 1,800,133 127,225 (3,424) 1,923,934
Industrial and miscellaneous - excluding
mortgage-backed and other
loan-backed securities 7,637,471 432,925 (103,362) 7,967,035
Hybrid securities 104,968 3,036 (491) 107,513
Total 12,008,655$ 627,760$ (133,976)$ 12,502,439$
Book Adjusted Carrying Values and Fair Values
June 30, 2015
(in thousands)
The following tables present the Industrial Insurance Fund’s bond investments by type and by
stated contractual maturity in years, and provide the BACV and fair value of bonds as of June 30,
2016 and 2015. Expected maturities may differ from contractual maturities, because borrowers
may have the right to call or prepay obligations with or without call or prepayment penalties.
Book Adjusted 1 year
Over 1 year
through
Over 5 years
through Over
Investment Type Fair Value Carrying Value or less 5 years 10 years 10 years
U.S. government obligations - excluding
mortgage-backed securities 2,107,809$ 2,008,377$ 79,939$ 699,130$ 694,100$ 535,208$
All other government obligations 1,267,673 1,205,391 233,968 459,761 344,827 166,835
Mortgage-backed and other
loan-backed securities 1,458,992 1,359,978 3 177,102 42,608 1,140,265
Industrial and miscellaneous - excluding
mortgage-backed and other
loan-backed securities 8,610,019 7,978,367 935,032 1,926,473 2,290,732 2,826,130
Hybrid securities 116,950 113,743 - 45,016 68,727 -
Total 13,561,443$ 12,665,856$ 1,248,942$ 3,307,482$ 3,440,994$ 4,668,438$
Schedule of Maturities
June 30, 2016
(in thousands)
Maturity

St a t e o f W ash in g t on In d u s t r i a l In s u r an ce Fu nd
55
Book Adjusted 1 year
Over 1 year
through
Over 5 years
through Over
Investment Type Fair Value Carrying Value or less 5 years 10 years 10 years
U.S. government obligations - excluding
mortgage-backed securities 1,158,705$ 1,165,527$ -$ 818,655$ 54,933$ 291,939$
All other government obligations 1,345,252 1,300,556 163,932 510,500 357,645 268,478
Mortgage-backed and other
loan-backed securities 1,923,934 1,800,133 20,953 189,619 83,253 1,506,308
Industrial and miscellaneous - excluding
mortgage-backed and other
loan-backed securities 7,967,035 7,637,471 306,456 2,519,104 1,944,262 2,867,649
Hybrid securities 107,513 104,968 - 4,988 99,981 -
Total 12,502,439$ 12,008,655$ 491,342$ 4,042,866$ 2,540,073$ 4,934,374$
Schedule of Maturities
June 30, 2015
(in thousands)
Maturity
The following additional tables are included to summarize the different classes of investments held
by the Industrial Insurance Fund as they are rated by the NAIC. There were no securities with an
NAIC designation higher than 4 at the fiscal years ended June 30, 2016 and 2015.
1 2 3 4 Total
U.S. government obligations - excluding
mortgage-backed securities 2,107,809$ -$ -$ -$ 2,107,809$
All other government obligations 1,061,957 154,588 24,597 26,531 1,267,673
Mortgage-backed and other
loan-backed securities 1,458,992 - - - 1,458,992
Industrial and miscellaneous - excluding
mortgage-backed and other
loan-backed securities 5,105,419 3,177,066 179,341 148,193 8,610,019
Hybrid securities 10,174 9,510 92,399 4,867 116,950
Total 9,744,351$ 3,341,164$ 296,337$ 179,591$ 13,561,443$
NAIC Designation
Fair Value of Securities by NAIC Designation
(in thousands)
June 30, 2016
1 2 3 4 Total
U.S. government obligations - excluding
mortgage-backed securities 1,158,705$ -$ -$ -$ 1,158,705$
All other government obligations 1,111,220 225,644 8,388 - 1,345,252
Mortgage-backed and other
loan-backed securities 1,923,934 - - - 1,923,934
Industrial and miscellaneous - excluding
mortgage-backed and other
loan-backed securities 4,627,784 3,256,155 83,096 - 7,967,035
Hybrid securities 20,304 82,304 4,905 - 107,513
Total 8,841,947$ 3,564,103$ 96,389$ -$ 12,502,439$
NAIC Designation
Fair Value of Securities by NAIC Designation
(in thousands)
June 30, 2015

St a t e o f W ash in g t on In d u s t r i a l In s u r an ce Fu nd
56
Gross unrealized losses on bonds, the fair value of the related bonds aggregated by investment
category, and length of time that individual bonds have been in a continuous unrealized loss
position at June 30, 2016 and 2015, were as follows:
Fair value Unrealized Losses Fair value Unrealized Losses Fair value Unrealized Losses
U.S. government obligations -
excluding mortgage-backed
securities 20,811$ (42)$ -$ -$ 20,811$ (42)$
All other government obligations 9,020 (109) 120,065 (14,585) 129,085 (14,694)
Mortgage-backed and other
loan-backed securities 12,223 (19) 30,403 (756) 42,626 (775)
Industrial and miscellaneous -
excluding mortgage-backed and
other loan-backed securities 79,593 (2,648) 735,613 (117,384) 815,206 (120,032)
Hybrid securities - - 24,766 (201) 24,766 (201)
Total 121,647$ (2,818)$ 910,847$ (132,926)$ 1,032,494$ (135,744)$
June 30, 2016
Bonds with Unrealized Losses
(in thousands)
Less than 12 Months 12 Months or Longer Total
Fair value Unrealized Losses Fair value Unrealized Losses Fair value Unrealized Losses
U.S. government obligations -
excluding mortgage-backed
securities 246,216$ (7,187)$ 488,603$ (4,914)$ 734,819$ (12,101)$
All other government obligations 91,710 (3,693) 131,960 (12,522) 223,670 (16,215)
Mortgage-backed and other
loan-backed securities 120,453 (831) 68,442 (2,117) 188,895 (2,948)
Industrial and miscellaneous -
excluding mortgage-backed and
other loan-backed securities 2,213,231 (86,207) 331,914 (24,494) 2,545,145 (110,701)
Hybrid securities 24,426 (537) - - 24,426 (537)
Total 2,696,036$ (98,455)$ 1,020,919$ (44,047)$ 3,716,955$ (142,502)$
June 30, 2015
Bonds with Unrealized Losses
(in thousands)
Less than 12 Months 12 Months or Longer Total
In compliance with SSAP No. 26, management has looked at all bonds in an unrealized loss
position and used several categories of information to determine whether any impairment is other-
than-temporary. The information considered included general market conditions, industry or
company financial prospects, an issuer’s fundamental credit difficulties, and the length of time and
the extent to which the fair value had been below cost. Management has no intention of selling
these securities and does not believe these impairments are other-than-temporary.
Similarly, in compliance with SSAP No. 43R, management has looked at mortgage-backed and
other loan-backed securities with unrealized losses and has used several categories of information
to determine whether any impairment is other-than-temporary. State Street Corporation’s
investment valuation model for prepayment assumptions and determining currently estimated cash
flows in valuing mortgage-backed and other loan-backed securities was used. The factors that are
considered include discounted cash flow on an investment, the length of time and amount of
impairment, forecasts, market data, and financial condition of the issuer(s). As of June 30, 2016,

St a t e o f W ash in g t on In d u s t r i a l In s u r an ce Fu nd
57
no mortgage-backed or other loan-backed securities have been determined to be other-than-
temporarily impaired.
The following tables summarize realized gains or losses of bonds that were redeemed or sold
during fiscal years 2016 and 2015:
Sales
Proceeds Realized Gains Realized Losses
Net Realized
Gains (Losses)
U.S. government obligations - excluding
mortgage-backed securities 175,472$ 137$ (294)$ (157)$
All other government obligations 320,193 15,700 - 15,700
Mortgage-backed securities 393,998 19,046 - 19,046
Industrial and miscellaneous - excluding
mortgage-backed and other
loan-backed securities 1,188,278 32,320 (3,460) 28,860
Hybrid securities 1,034 42 - 42
Total 2,078,975$ 67,245$ (3,754)$ 63,491$
Bonds Redeemed or Sold
(in thousands)June 30, 2016
Sales
Proceeds Realized Gains Realized Losses
Net Realized
Gains (Losses)
U.S. government obligations - excluding
mortgage-backed securities 333,494$ 2,238$ (71)$ 2,167$
All other government obligations 229,635 8,743 - 8,743
Mortgage-backed securities 223,574 - - -
Industrial and miscellaneous - excluding
mortgage-backed and other
loan-backed securities 541,775 29,831 (168) 29,663
Hybrid securities - - - -
Total 1,328,478$ 40,812$ (239)$ 40,573$
Bonds Redeemed or Sold
(in thousands)June 30, 2015
In compliance with SSAP No. 26, paragraph 20.l, the following tables show the details of the
structured notes held by the Industrial Insurance Fund at June 30, 2016 and 2015:
CUSIP Identification Actual Cost Fair Value
Book/Adjusted
Carry Value
Mortgage-
Referenced
Security (Y/N)
064159CR5 20,000$ 20,003$ 20,000$ N
136069FV8 25,000 25,007 25,000 N
172967GV7 20,000 20,009 20,000 N
63254AAH1 10,000 10,005 10,000 N
Total 75,000$ 75,024$ 75,000$
Structured Notes
June 30, 2016
(in thousands)

St a t e o f W ash in g t on In d u s t r i a l In s u r an ce Fu nd
58
CUSIP Identification Actual Cost Fair Value
Book/Adjusted
Carry Value
Mortgage-
Referenced
Security (Y/N)
064159CR5 20,000$ 20,076$ 20,000$ N
136069FV8 25,000 25,088 25,000 N
172967GV7 20,000 20,057 20,000 N
63254AAH1 10,000 10,049 10,000 N
045167CL5 25,000 24,996 25,000 N
Total 100,000$ 100,266$ 100,000$
Structured Notes
June 30, 2015
(in thousands)
3.I. Common Stocks
The gross unrealized losses on common stocks, fair value of the common stocks, and length of
time that individual common stocks had been in a continuous unrealized loss position, at June 30,
2016 and 2015, were as follows:
Fair value Unrealized Losses Fair value Unrealized Losses Fair value Unrealized Losses
Commingled index funds 173,361$ (11,196)$ 99,148$ (22,710)$ 272,509$ (33,906)$
Total 173,361$ (11,196)$ 99,148$ (22,710)$ 272,509$ (33,906)$
Common Stocks with Unrealized Losses
(in thousands)
Less than 12 Months 12 Months or Longer Total
June 30, 2016
Fair value Unrealized Losses Fair value Unrealized Losses Fair value Unrealized Losses
Commingled index funds 145,009$ (6,219)$ 36,059$ (5,651)$ 181,068$ (11,870)$
Total 145,009$ (6,219)$ 36,059$ (5,651)$ 181,068$ (11,870)$
Common Stocks with Unrealized Losses
(in thousands)
Less than 12 Months 12 Months or Longer Total
June 30, 2015
In compliance with SSAP No. 30, management has looked at all commingled index funds in an
unrealized loss position and used several categories of information to determine whether any
impairment is other-than-temporary. The information considered for broad equity funds included
general market conditions and prospects for the economy as a whole in the short term. Management
has no intention of selling these commingled index funds and does not believe these impairments
are other-than-temporary.
3.J. Fair Value Measurements
The Industrial Insurance Fund has categorized its investments that are reported on the Consolidated
Statutory Statement of Admitted Assets, Liabilities, and Contingency Reserve at fair value into a

St a t e o f W ash in g t on In d u s t r i a l In s u r an ce Fu nd
59
three-level hierarchy that prioritizes the inputs to valuation techniques used to measure fair value.
The three-level hierarchy is based on the degree of subjectivity inherent in the valuation method
by which fair value was determined. The three levels are defined as follows:
Level 1 - Quoted prices in active markets for identical assets or liabilities
Level 2 - Inputs other than Level 1 that are observable, either directly or indirectly, such as
quoted prices for similar assets or liabilities, quoted prices in markets that are not active,
or other inputs that can be corroborated by observable market data for substantially the full
term of the assets or liabilities
Level 3 - Unobservable inputs that are supported by little or no market activity and that are
significant to the fair value of the assets or liabilities
The asset’s or liability’s fair value measurement level within the hierarchy is based on the lowest
level of any input that is significant to the fair value measurement. Valuation techniques used need
to maximize the use of observable inputs and minimize the use of unobservable inputs.
The following is a description of the valuation methodologies used for assets measured at fair
value:
Industrial and miscellaneous bonds - value is based on market values approved by the
NAIC
Equities – value is based on the underlying equity
Other invested assets – value is based on the underlying equity
The preceding methods described may produce a fair value calculation that may not be indicative
of net realizable value or reflective of the future fair values. The Industrial Insurance Fund has
determined that its valuation methods are appropriate and consistent with other market
participants; however, the use of different methodologies or assumptions to determine the fair
value of certain financial instruments could result in a different fair value measurement at the
reporting date.

St a t e o f W ash in g t on In d u s t r i a l In s u r an ce Fu nd
60
The following tables present the financial instruments related to the Fund’s assets carried at fair
value as of June 30, 2016 and 2015, by the SSAP No. 100 valuation hierarchy:
Level 1 Level 2 Level 3 Total
Fixed income -$ 419,605$ -$ 419,605$
Equities - 1,766,364 - 1,766,364
Total -$ 2,185,969$ -$ 2,185,969$
Investment Assets Carried at Fair Value
June 30, 2016
(in thousands)
Level 1 Level 2 Level 3 Total
Fixed income -$ 95,696$ -$ 95,696$
Equities - 1,895,746 - 1,895,746
Total -$ 1,991,442$ -$ 1,991,442$
Investment Assets Carried at Fair Value
June 30, 2015
(in thousands)
Only bonds with an NAIC designation of 3-6 and a fair value lower than the book adjusted value
are carried at fair value on the financial statements. On June 30, 2016, there were thirty-six bonds
in this category, with fair values totaling $419,605,191. On June 30, 2015, there were nine bonds
in this category, with fair values totaling $95,696,266.
At the end of each reporting period, the Industrial Insurance Fund evaluates whether or not any
event has occurred or circumstances have changed that would cause an instrument to be transferred
between Levels 1 and 2. This policy also applies to transfers into or out of Level 3. During the
current year, no transfers between Levels 1, 2 or 3 were required.
The fair values of bonds categorized as Level 2 were valued using a market approach. These
valuations were determined to be Level 2 valuations, as quoted markets prices for similar
instruments in an active market were utilized. This was accomplished by the use of matrix pricing.
Matrix pricing takes quoted prices of bonds with similar features and applies analytic methods to
determine the fair value of bonds held.
The following tables reflect the fair values and admitted values of all admitted assets and liabilities.
The fair values are also categorized into the three-level fair value hierarchy as described above.
Fair Value Admitted Value Level 1 Level 2 Level 3 Total
Fixed income 13,561,443$ 12,665,856$ -$ 13,561,443$ -$ 13,561,443$
Equities 1,766,364 1,766,364 - 1,766,364 - 1,766,364
Short-term investments 161,305 161,305 - 161,305 - 161,305
Total 15,489,112$ 14,593,525$ -$ 15,489,112$ -$ 15,489,112$
June 30, 2016
Investment Assets at Fair Value
(in thousands)

St a t e o f W ash in g t on In d u s t r i a l In s u r an ce Fu nd
61
Fair Value Admitted Value Level 1 Level 2 Level 3 Total
Fixed income 12,502,439$ 12,008,655$ -$ 12,502,439$ -$ 12,502,439$
Equities 1,895,746 1,895,746 - 1,895,746 - 1,895,746
Short-term investments 108,857 108,857 - 108,857 - 108,857
Total 14,507,042$ 14,013,258$ -$ 14,507,042$ -$ 14,507,042$
June 30, 2015
Investment Assets at Fair Value
(in thousands)
Note 4 - Real Estate and Improvements
At June 30, 2016 and 2015, the Accident and Medical Aid Accounts admitted only land, buildings,
and improvements, net of accumulated depreciation and encumbrances.
SSAP No. 40R requires that buildings more than 50 percent occupied by the reporting entity be
categorized as a real estate investment and that depreciation and interest expense be classified as
investment expenses. The building occupied by the Industrial Insurance Fund’s employees is
financed through general obligation bonds of the state of Washington. The remaining balance due
on the bonds was paid October 1, 2015. Due to indirect ownership by the state of Washington, the
land, building, and improvements are not shown as a real estate investment of the Industrial
Insurance Fund. The related depreciation and interest expenses are allocated between
administrative and non-insurance expenses based on percentage of use by employees.
June 30, 2016 June 30, 2015
Land 3,204$ 3,204$
Building occupied by Industrial Insurance Fund 65,134 65,134
Improvements, other than buildings 1,020 1,020
Encumbrances - (4,050)
Accumulated depreciation - building (31,702) (30,348)
Accumulated depreciation - improvements (479) (459)
Total 37,177$ 34,501$
Real Estate and Improvements
(in thousands)

St a t e o f W ash in g t on In d u s t r i a l In s u r an ce Fu nd
62
Note 5 - Investment Income
The Industrial Insurance Fund does not admit investment income due and accrued if amounts are
over 90 days past due. As of June 30, 2016 and 2015, all investment income due and accrued was
admitted, with balances accrued by security type, as summarized in the following table:
June 30, 2016 June 30, 2015
U.S. government obligations - excluding
mortgage-backed securities 7,618$ 4,133$
All other government obligations 10,966 13,461
Mortgage-backed and other loan-backed securities 5,005 8,066
Industrial and miscellaneous - excluding
mortgage-backed and other loan-backed securities 84,395 84,641
Hybrid securities 1,841 1,719
Other interest 46 1
Total 109,871$ 112,021$
Interest Income Admitted Due and Accrued
(in thousands)
The following table provides details for net investment income by security type for the fiscal years
ended June 30, 2016 and 2015:
June 30, 2016 June 30, 2015
U.S. government obligations - excluding
mortgage-backed securities 27,073$ 15,634$
All other government obligations 40,760 46,238
Mortgage-backed and other loan-backed securities 64,311 83,036
Industrial and miscellaneous - excluding
mortgage-backed and other loan-backed securities 357,937 339,098
Hybrid securities 5,502 5,502
Total Bond Interest 495,583 489,508
Equities dividends 1,363 2,269
Net securities lending income 9 (182)
Other interest and litigation income 629 571
Amortization 5,446 5,461
Gross investment income 503,030 497,627
Investment expenses (4,531) (4,219)
Total Net Investment Income Earned 498,499$ 493,408$
Net Investment Income Earned
(in thousands)

St a t e o f W ash in g t on In d u s t r i a l In s u r an ce Fu nd
63
Note 6 - Retirement Plans, Compensated Absences, Deferred Compensation Plan, and
Other Postemployment Benefits
6.A. Retirement Plans
The Industrial Insurance Fund is administered by L&I, an agency of the state of Washington and
part of the primary government. Industrial Insurance Fund employees participate in the
Washington State Public Employees’ Retirement System (PERS), administered by the Washington
State Department of Retirement Systems (DRS).
The PERS is a multiemployer retirement system comprised of three separate plans for membership
purposes: Plans 1 and 2 are defined benefit plans, and Plan 3 is a combination defined
benefit/defined contribution plan. PERS participants who joined the system by
September 30, 1977, are Plan 1 members. Those who joined on or after October 1, 1977, and by
February 28, 2002, are Plan 2 members, unless they exercised an option to transfer their
membership to Plan 3. PERS participants joining the system on or after March 1, 2002, have the
irrevocable option of choosing membership in either Plan 2 or Plan 3.
PERS defined benefit retirement benefits are financed from a combination of investment earnings
and employer and employee contributions. Under the PERS rules, the employee and employer
each contribute a percentage of the employee’s compensation.
Each biennium, the state Pension Funding Council adopts Plan 1 employer contribution rates, Plan
2 employer and employee contribution rates, and Plan 3 employer contribution rates. Contribution
requirements are established and amended by state statute. All employers are required to contribute
at the level established by the legislature. The methods used to determine the contribution
requirements are established under state statute in accordance with chapters 41.40 and 41.45 RCW.
The employer contribution rates for the Industrial Insurance Fund at June 30, 2016 and 2015, for
each of Plans 1, 2, and 3 were 11.18 and 9.21 percent of the employee’s annual covered salary,
respectively. The Industrial Insurance Fund contributed $17,823,173 and $13,991,371 to the PERS
during the fiscal years ended June 30, 2016 and 2015, respectively. The Industrial Insurance
Fund’s contribution was 1.5 percent of total employer contributions to the plans in fiscal years
ended June 30, 2016 and 2015. The employer contribution rate from July 1, 2016, through June
30, 2017, has already been established by the legislature to be 11.18 percent for each of Plans 1,
2, and 3.
Employee contribution rates for Plan 1 are established by statute at 6 percent for state agencies
employees. Contributions for Plan 2 members are determined by the aggregate method and may
vary over time. The contribution rate for Plan 2 state agency employees for fiscal years ended June
30, 2016 and 2015, was 6.12 percent of the employee’s annual covered salary. Under Plan 3,
employer contributions finance the defined benefit portion of the plan, and member contributions
finance the defined contribution portion. The Director of the DRS sets Plan 3 employee
contribution rate options. Members can choose from six rate options ranging from 5 to 15 percent.
Two of the options are graduated rates dependent on the employee’s age.

St a t e o f W ash in g t on In d u s t r i a l In s u r an ce Fu nd
64
The Industrial Insurance Fund’s proportionate share of the collective pension liability for fiscal
year ended June 30, 2016, was $124,027,174 for the plans in which its employees participate. The
proportion is based on the Industrial Insurance Fund’s contributions relative to the contributions
of all participating employers. In accordance with SSAP No. 102, the unfunded status of the
pension plan is not required to be recognized because it is considered a multiemployer plan,
therefore it has not been accrued in the State Fund’s financials.
Additional information regarding the PERS may be obtained from the stand-alone financial report
prepared by the DRS. A copy of the report may be obtained by contacting the Washington State
Department of Retirement Systems, P.O. Box 48380, Olympia, WA 98504-8380 or online at
http://www.drs.wa.gov/administration/annual-report.
6.B. Compensated Absences
Industrial Insurance Fund employees accrue vested annual leave at a variable rate based on years
of service. In general, accrued annual leave cannot exceed 240 hours at the employee’s anniversary
date.
Employees accrue sick leave at the rate of one day per month without limitation on the amount
that can be accumulated. Sick leave is not vested; i.e., the Industrial Insurance Fund does not pay
employees for unused sick leave upon termination except upon employee death or retirement, at
which time the Industrial Insurance Fund is liable for 25 percent of the employee’s accumulated
sick leave. In addition, the Industrial Insurance Fund has a “sick leave buyout option” in which,
each January, employees who have accumulated sick leave in excess of 480 hours may redeem
sick leave earned but not taken during the previous year at the rate of one day’s pay in exchange
for each four days of sick leave.
It is the Industrial Insurance Fund’s policy to liquidate unpaid compensated absence balances
outstanding at June 30 with future resources, rather than advance funding it with currently
available expendable financial resources.
The Industrial Insurance Fund recognizes the expense and accrues a liability for annual leave and
estimated sick leave buyout, including related payroll taxes and benefits as applicable, as the leave
is earned. The annual leave and sick leave accrued liability was $14,175,947 and $13,690,150 at
June 30, 2016 and 2015, respectively.
6.C. Deferred Compensation Plan
Industrial Insurance Fund employees have the option to participate in the state of Washington’s
Deferred Compensation Plan (DCP). There are no contributions made on behalf of employees to
the DCP by the Industrial Insurance Fund. The DRS administers the DCP and contracts with a
third party (currently Empower Retirement) for recordkeeping and other administrative services.
The WSIB selects and monitors DCP’s investment options based on advice and recommendations
provided by the Employee Retirement Benefits Board.
St a t e o f W ash in g t on In d u s t r i a l In s u r an ce Fu nd
65
6.D. Other Postemployment Benefits
Employees of the Industrial Insurance Fund are eligible to participate in the state of Washington’s
defined benefit Other Postemployment Benefit (OPEB) plan, a multiemployer plan, as
administered by the state through the Washington State Health Care Authority (HCA).
Plan Description and Funding Policy
Per RCW 41.05.065, the Public Employees Benefits Board (PEBB), created within the HCA, is
authorized to design benefits and determine the terms and conditions of employee and retiree
participation and coverage, including establishment of eligibility criteria for both active and retired
employees. PEBB programs include medical, dental, life, and long-term disability insurance.
The relationship between the PEBB OPEB plan and its member employers and their employees
and retirees is not formalized in a contract or plan document. Rather, the benefits are provided in
accordance with a substantive plan. A substantive plan is one in which the plan terms are
understood by the employers and plan members. This understanding is based on communications
between the HCA, employers and plan members, and the historical pattern of practice with regard
to the sharing of benefit costs.
The PEBB retiree OPEB plan is available to employees who elect to continue coverage and pay
the administratively-established premiums at the time they retire, under the provisions of the
retirement system to which they belong. Retirees’ access to PEBB plans depends on the retirement
eligibility of their respective retirement systems. PEBB members are covered in the following
retirement systems: Public Employees’ Retirement System, Public Safety Employees’ Retirement
System, Teachers’ Retirement System, School Employees’ Retirement System, Washington State
Patrol Retirement System, and Higher Education.
Per RCW 41.05.022, retirees who are not yet eligible for Medicare benefits may continue
participation in the state’s non-Medicare community-rated health insurance risk pool on a self-pay
basis. Retirees in the non-Medicare risk pool receive an implicit subsidy. The implicit subsidy
exists, because retired members pay a premium based on a claims experience for active employees
and other non-Medicare retirees. The subsidy is valued using the difference between the age-based
claim costs and the premium. In calendar year 2015, the average weighted implicit subsidy was
valued at $308 per member per month, and in calendar year 2016, the average weighted implicit
subsidy is projected to be $304 per member per month.
Retirees who are enrolled in both Parts A and B of Medicare may participate in the state’s Medicare
community-rated health insurance risk pool. Medicare retirees receive an explicit subsidy in the
form of reduced premiums. Annually, the HCA administrator recommends an amount for the next
calendar year’s explicit subsidy for inclusion in the Governor’s budget. In calendar year 2015, the
explicit subsidy was up to $150 per member per month, and it remained at up to $150 per member
per month in calendar year 2016.
Administrative costs, as well as implicit and explicit subsidies, are funded by required
contributions from participating employers. The subsidies provide monetary assistance for medical
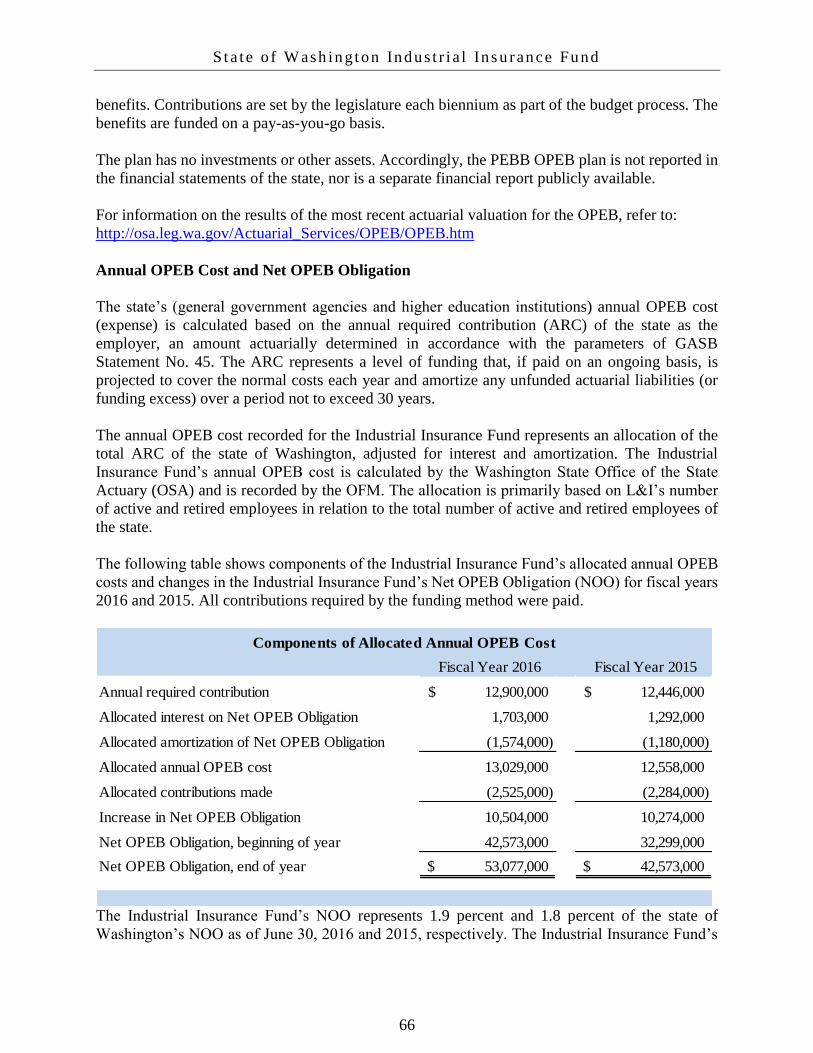
St a t e o f W ash in g t on In d u s t r i a l In s u r an ce Fu nd
66
benefits. Contributions are set by the legislature each biennium as part of the budget process. The
benefits are funded on a pay-as-you-go basis.
The plan has no investments or other assets. Accordingly, the PEBB OPEB plan is not reported in
the financial statements of the state, nor is a separate financial report publicly available.
For information on the results of the most recent actuarial valuation for the OPEB, refer to:
http://osa.leg.wa.gov/Actuarial_Services/OPEB/OPEB.htm
Annual OPEB Cost and Net OPEB Obligation
The state’s (general government agencies and higher education institutions) annual OPEB cost
(expense) is calculated based on the annual required contribution (ARC) of the state as the
employer, an amount actuarially determined in accordance with the parameters of GASB
Statement No. 45. The ARC represents a level of funding that, if paid on an ongoing basis, is
projected to cover the normal costs each year and amortize any unfunded actuarial liabilities (or
funding excess) over a period not to exceed 30 years.
The annual OPEB cost recorded for the Industrial Insurance Fund represents an allocation of the
total ARC of the state of Washington, adjusted for interest and amortization. The Industrial
Insurance Fund’s annual OPEB cost is calculated by the Washington State Office of the State
Actuary (OSA) and is recorded by the OFM. The allocation is primarily based on L&I’s number
of active and retired employees in relation to the total number of active and retired employees of
the state.
The following table shows components of the Industrial Insurance Fund’s allocated annual OPEB
costs and changes in the Industrial Insurance Fund’s Net OPEB Obligation (NOO) for fiscal years
2016 and 2015. All contributions required by the funding method were paid.
Fiscal Year 2016 Fiscal Year 2015
Annual required contribution 12,900,000$ 12,446,000$
Allocated interest on Net OPEB Obligation 1,703,000 1,292,000
Allocated amortization of Net OPEB Obligation (1,574,000) (1,180,000)
Allocated annual OPEB cost 13,029,000 12,558,000
Allocated contributions made (2,525,000) (2,284,000)
Increase in Net OPEB Obligation 10,504,000 10,274,000
Net OPEB Obligation, beginning of year 42,573,000 32,299,000
Net OPEB Obligation, end of year 53,077,000$ 42,573,000$
Components of Allocated Annual OPEB Cost
The Industrial Insurance Fund’s NOO represents 1.9 percent and 1.8 percent of the state of
Washington’s NOO as of June 30, 2016 and 2015, respectively. The Industrial Insurance Fund’s

St a t e o f W ash in g t on In d u s t r i a l In s u r an ce Fu nd
67
contribution was 1.5 percent of total employer contributions to the plan in each of the fiscal years
ended June 30, 2016 and 2015, respectively.
The Industrial Insurance Fund’s annual OPEB cost, the percentage of annual OPEB cost
contributed to the plan, and the NOO for fiscal years 2016, 2015, and 2014 were as follows:
2016 2015 2014
Allocated annual OPEB cost 13,029,000$ 12,558,000$ 8,732,000$
Percentage of annual OPEB cost contributed 19.4% 18.2% 25.1%
Net OPEB Obligation 53,077,000$ 42,573,000$ 32,299,000$
Net OPEB Obligation
by Fiscal Year
A complete description of the funded status and actuarial assumptions of the state of Washington’s
OPEB plan is included in the Comprehensive Annual Financial Report for the state of Washington.
A copy of this report may be obtained by contacting the Accounting Division of the Office of
Financial Management at P.O. Box 43127, Olympia, Washington 98504-3127, or online at
http://www.ofm.wa.gov/cafr.
Note 7 - Commitments and Contingencies
7.A. Commitments
Effective July 1, 1992, the Washington State Legislature required the Industrial Insurance Fund,
under RCW 48.22.070, to participate in an assigned risk pool providing workers’ compensation
coverage under the United States Longshoreman and Harbor Workers’ Act. The Industrial
Insurance Fund is obligated to participate 50 percent in the underwriting losses or surpluses of the
assigned risk pool. This participation is scheduled to continue indefinitely, due to amending
legislation passed in 1997. In the history of this program, no assessments or distributions have
been declared since enactment of this indefinite commitment.
7.B. Contingencies
The Industrial Insurance Fund is party to numerous routine legal proceedings that normally occur
in operations. At any given point, there may be numerous lawsuits that could financially impact
the Fund. Although the outcome of these lawsuits is not currently determinable, the resolution of
these matters is not likely to have a material impact on the Industrial Insurance Fund’s financial
position, revenues, or expenses.
7.C. Current Litigation
The Industrial Insurance Fund has received a demand for certain funds under its retrospective
rating program. The dispute is being proceeding through the statutory appeals process at the

St a t e o f W ash in g t on In d u s t r i a l In s u r an ce Fu nd
68
Board of Industrial Insurance Appeals under Title 51 RCW. The Fund believe the claim is
without merit and intends the vigorously defend its position. No amounts are reflected in the
statutory financial statements as the cost of defense or result of the dispute is not probable or
reasonably determinable at this time.
7.D. Exposure
The lack of diversity of exposure by line of business and by state could be a risk factor for benefit
liability and claims administration expense (CAE) reserves. By statute, the Fund’s direct exposure
is limited to one line of business (workers’ compensation) in one state (Washington). Therefore,
any adverse trends affecting this line of business and/or state could have a material effect on the
Fund’s benefit liability and CAE reserves. Such trends would include legislative benefit level
changes that may have an effect on all open workers’ compensation claims.
Note 8 - Leases
The Industrial Insurance Fund leases office facilities, office and computer equipment, and other
assets under a variety of operating lease agreements. Although lease terms vary, most leases are
subject to appropriation from the state legislature to continue the obligation. Since the possibility
of not receiving funding from the legislature is remote, leases are considered non-cancelable for
financial reporting purposes. Certain operating leases are renewable for specified periods.
Management expects the leases to be renewed or replaced by other leases.
The total operating lease rental expenses for fiscal years 2016 and 2015 were $11,061,621 and
$10,748,463, respectively. There are no contingent rental payments or unusual renewal options,
escalation clauses or restrictions. During fiscal year 2016, the Industrial Insurance Fund reduced
the number of laptops leased by 18 units which resulted in a decrease in lease payments of $941
per month. In addition, there was an increase of $1,788 in one month’s lease payment due to the
theft of two laptops.
Certain rental commitments have renewal options extending through the year 2021. Some of these
renewals are subject to adjustments in future periods.
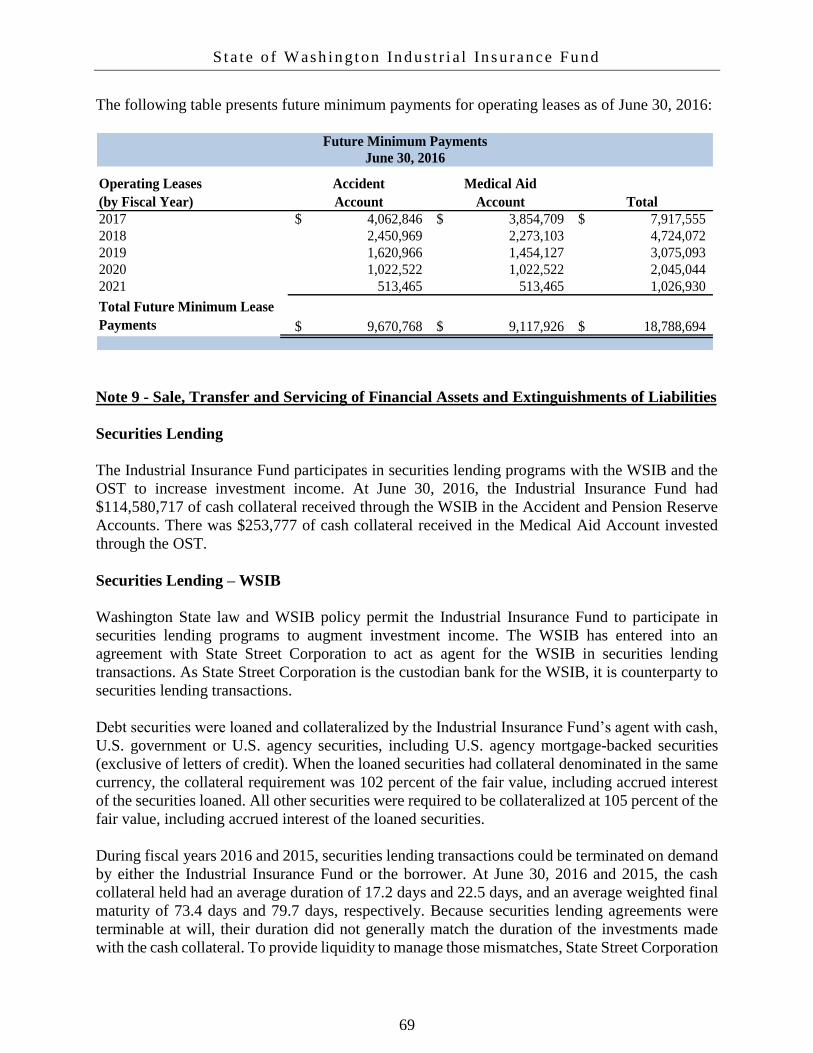
St a t e o f W ash in g t on In d u s t r i a l In s u r an ce Fu nd
69
The following table presents future minimum payments for operating leases as of June 30, 2016:
Operating Leases
(by Fiscal Year)
Accident
Account
Medical Aid
Account Total
2017 4,062,846$ 3,854,709$ 7,917,555$
2018 2,450,969 2,273,103 4,724,072
2019 1,620,966 1,454,127 3,075,093
2020 1,022,522 1,022,522 2,045,044
2021 513,465 513,465 1,026,930
Total Future Minimum Lease
Payments 9,670,768$ 9,117,926$ 18,788,694$
Future Minimum Payments
June 30, 2016
Note 9 - Sale, Transfer and Servicing of Financial Assets and Extinguishments of Liabilities
Securities Lending
The Industrial Insurance Fund participates in securities lending programs with the WSIB and the
OST to increase investment income. At June 30, 2016, the Industrial Insurance Fund had
$114,580,717 of cash collateral received through the WSIB in the Accident and Pension Reserve
Accounts. There was $253,777 of cash collateral received in the Medical Aid Account invested
through the OST.
Securities Lending – WSIB
Washington State law and WSIB policy permit the Industrial Insurance Fund to participate in
securities lending programs to augment investment income. The WSIB has entered into an
agreement with State Street Corporation to act as agent for the WSIB in securities lending
transactions. As State Street Corporation is the custodian bank for the WSIB, it is counterparty to
securities lending transactions.
Debt securities were loaned and collateralized by the Industrial Insurance Fund’s agent with cash,
U.S. government or U.S. agency securities, including U.S. agency mortgage-backed securities
(exclusive of letters of credit). When the loaned securities had collateral denominated in the same
currency, the collateral requirement was 102 percent of the fair value, including accrued interest
of the securities loaned. All other securities were required to be collateralized at 105 percent of the
fair value, including accrued interest of the loaned securities.
During fiscal years 2016 and 2015, securities lending transactions could be terminated on demand
by either the Industrial Insurance Fund or the borrower. At June 30, 2016 and 2015, the cash
collateral held had an average duration of 17.2 days and 22.5 days, and an average weighted final
maturity of 73.4 days and 79.7 days, respectively. Because securities lending agreements were
terminable at will, their duration did not generally match the duration of the investments made
with the cash collateral. To provide liquidity to manage those mismatches, State Street Corporation
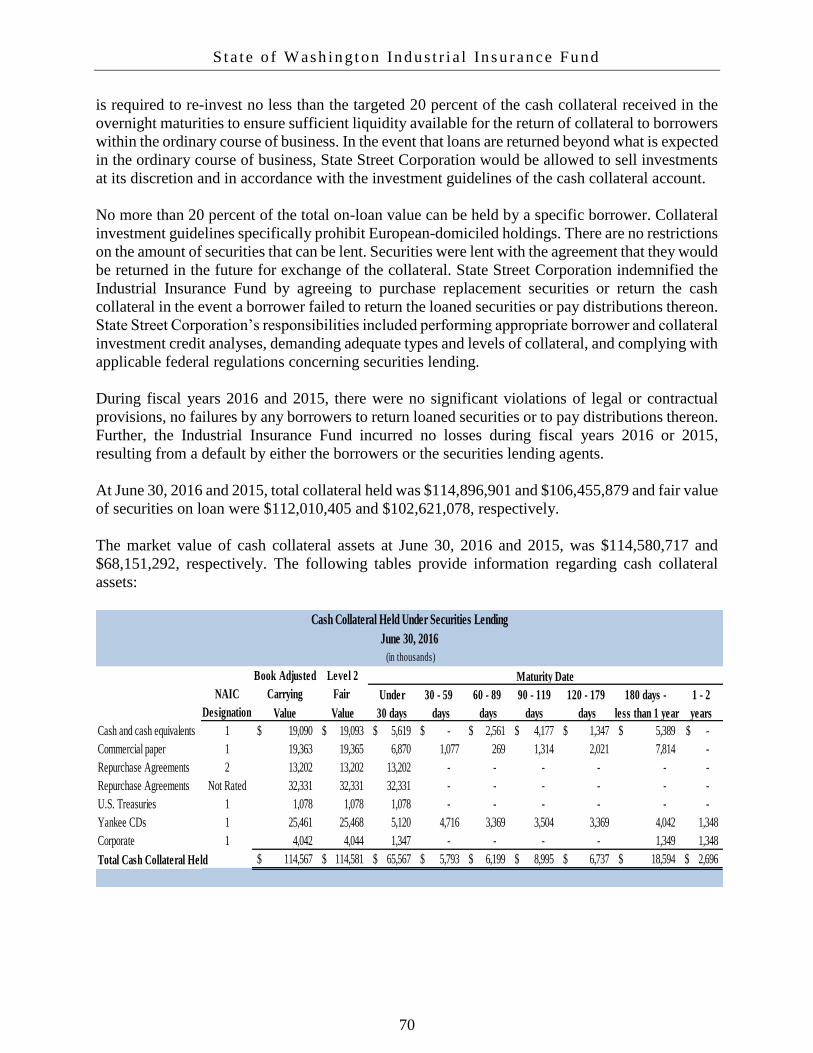
St a t e o f W ash in g t on In d u s t r i a l In s u r an ce Fu nd
70
is required to re-invest no less than the targeted 20 percent of the cash collateral received in the
overnight maturities to ensure sufficient liquidity available for the return of collateral to borrowers
within the ordinary course of business. In the event that loans are returned beyond what is expected
in the ordinary course of business, State Street Corporation would be allowed to sell investments
at its discretion and in accordance with the investment guidelines of the cash collateral account.
No more than 20 percent of the total on-loan value can be held by a specific borrower. Collateral
investment guidelines specifically prohibit European-domiciled holdings. There are no restrictions
on the amount of securities that can be lent. Securities were lent with the agreement that they would
be returned in the future for exchange of the collateral. State Street Corporation indemnified the
Industrial Insurance Fund by agreeing to purchase replacement securities or return the cash
collateral in the event a borrower failed to return the loaned securities or pay distributions thereon.
State Street Corporation’s responsibilities included performing appropriate borrower and collateral
investment credit analyses, demanding adequate types and levels of collateral, and complying with
applicable federal regulations concerning securities lending.
During fiscal years 2016 and 2015, there were no significant violations of legal or contractual
provisions, no failures by any borrowers to return loaned securities or to pay distributions thereon.
Further, the Industrial Insurance Fund incurred no losses during fiscal years 2016 or 2015,
resulting from a default by either the borrowers or the securities lending agents.
At June 30, 2016 and 2015, total collateral held was $114,896,901 and $106,455,879 and fair value
of securities on loan were $112,010,405 and $102,621,078, respectively.
The market value of cash collateral assets at June 30, 2016 and 2015, was $114,580,717 and
$68,151,292, respectively. The following tables provide information regarding cash collateral
assets:
Book Adjusted Level 2
NAIC Carrying Fair Under 30 - 59 60 - 89 90 - 119 120 - 179 180 days - 1 - 2
Designation Value Value 30 days days days days days less than 1 year years
Cash and cash equivalents 1 19,090$ 19,093$ 5,619$ -$ 2,561$ 4,177$ 1,347$ 5,389$ -$
Commercial paper 1 19,363 19,365 6,870 1,077 269 1,314 2,021 7,814 -
Repurchase Agreements 2 13,202 13,202 13,202 - - - - - -
Repurchase Agreements Not Rated 32,331 32,331 32,331 - - - - - -
U.S. Treasuries 1 1,078 1,078 1,078 - - - - - -
Yankee CDs 1 25,461 25,468 5,120 4,716 3,369 3,504 3,369 4,042 1,348
Corporate 1 4,042 4,044 1,347 - - - - 1,349 1,348
Total Cash Collateral Held 114,567$ 114,581$ 65,567$ 5,793$ 6,199$ 8,995$ 6,737$ 18,594$ 2,696$
Cash Collateral Held Under Securities Lending
June 30, 2016
(in thousands)
Maturity Date
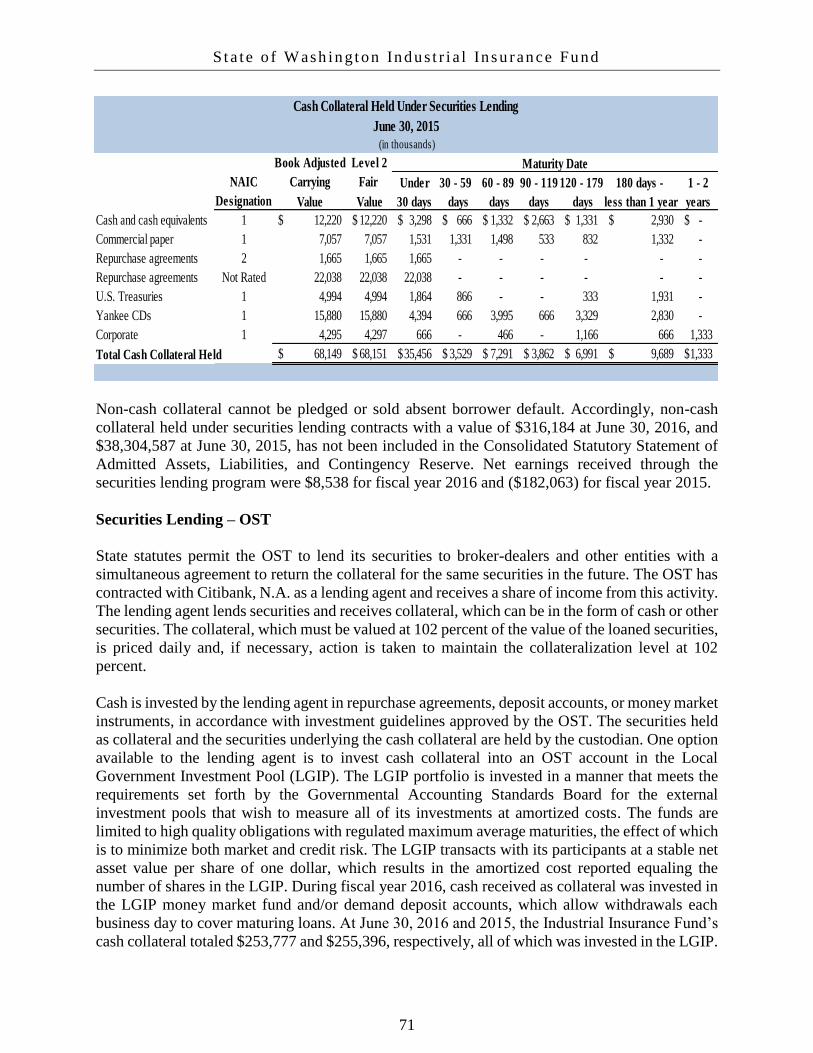
St a t e o f W ash in g t on In d u s t r i a l In s u r an ce Fu nd
71
Non-cash collateral cannot be pledged or sold absent borrower default. Accordingly, non-cash
collateral held under securities lending contracts with a value of $316,184 at June 30, 2016, and
$38,304,587 at June 30, 2015, has not been included in the Consolidated Statutory Statement of
Admitted Assets, Liabilities, and Contingency Reserve. Net earnings received through the
securities lending program were $8,538 for fiscal year 2016 and ($182,063) for fiscal year 2015.
Securities Lending – OST
State statutes permit the OST to lend its securities to broker-dealers and other entities with a
simultaneous agreement to return the collateral for the same securities in the future. The OST has
contracted with Citibank, N.A. as a lending agent and receives a share of income from this activity.
The lending agent lends securities and receives collateral, which can be in the form of cash or other
securities. The collateral, which must be valued at 102 percent of the value of the loaned securities,
is priced daily and, if necessary, action is taken to maintain the collateralization level at 102
percent.
Cash is invested by the lending agent in repurchase agreements, deposit accounts, or money market
instruments, in accordance with investment guidelines approved by the OST. The securities held
as collateral and the securities underlying the cash collateral are held by the custodian. One option
available to the lending agent is to invest cash collateral into an OST account in the Local
Government Investment Pool (LGIP). The LGIP portfolio is invested in a manner that meets the
requirements set forth by the Governmental Accounting Standards Board for the external
investment pools that wish to measure all of its investments at amortized costs. The funds are
limited to high quality obligations with regulated maximum average maturities, the effect of which
is to minimize both market and credit risk. The LGIP transacts with its participants at a stable net
asset value per share of one dollar, which results in the amortized cost reported equaling the
number of shares in the LGIP. During fiscal year 2016, cash received as collateral was invested in
the LGIP money market fund and/or demand deposit accounts, which allow withdrawals each
business day to cover maturing loans. At June 30, 2016 and 2015, the Industrial Insurance Fund’s
cash collateral totaled $253,777 and $255,396, respectively, all of which was invested in the LGIP.
Book Adjusted Level 2
NAIC Carrying Fair Under 30 - 59 60 - 89 90 - 119 120 - 179 180 days - 1 - 2
Designation Value Value 30 days days days days days less than 1 year years
Cash and cash equivalents 1 12,220$ 12,220$ 3,298$ 666$ 1,332$ 2,663$ 1,331$ 2,930$ -$
Commercial paper 1 7,057 7,057 1,531 1,331 1,498 533 832 1,332 -
Repurchase agreements 2 1,665 1,665 1,665 - - - - - -
Repurchase agreements Not Rated 22,038 22,038 22,038 - - - - - -
U.S. Treasuries 1 4,994 4,994 1,864 866 - - 333 1,931 -
Yankee CDs 1 15,880 15,880 4,394 666 3,995 666 3,329 2,830 -
Corporate 1 4,295 4,297 666 - 466 - 1,166 666 1,333
Total Cash Collateral Held 68,149$ 68,151$ 35,456$ 3,529$ 7,291$ 3,862$ 6,991$ 9,689$ 1,333$
Cash Collateral Held Under Securities Lending
June 30, 2015
(in thousands)
Maturity Date

St a t e o f W ash in g t on In d u s t r i a l In s u r an ce Fu nd
72
Contracts require the lending agent to indemnify the OST if the borrowers fail to return securities
and if the collateral is inadequate to replace the securities lent, or if the borrower fails to pay the
OST for income distribution by the securities’ issuers while the securities are on loan. The OST
cannot pledge or sell collateral securities received unless the borrower defaults. At June 30, 2016,
the fair value of securities on loan for the Industrial Insurance Fund totaled $247,963. At June 30,
2015, the fair value of securities on loan was $249,293.
The OST investment policy requires that any securities on loan be made available by the lending
agent for next day liquidity at the option of the OST. During fiscal years 2016 and 2015, the OST
had no credit risk exposure to borrowers, because the amounts owed to the borrowers exceeded
the amounts the borrowers owed to the OST.
There were no violations of legal or contractual provisions or any losses resulting from a default
of a borrower or lending agent during the fiscal year.
Note 10 - Changes in Benefit and Claims Administration Liabilities
The following schedule presents the changes in benefit and claims administration liabilities for the
fiscal years ended June 30, 2016 and 2015, for the Industrial Insurance Fund:
Fiscal Year 2016 Fiscal Year 2015
Unpaid benefit and claims administration
liabilities, July 1 13,240,922$ 12,912,537$
Incurred benefit and claims administration liabilities
Provision for insured events of the current year 1,780,902 1,818,597
Increase in provision for insured events of prior years 327,591 262,240
Total incurred benefit and claims administration liabilities 2,108,493 2,080,837
Less Payments
Benefit and claims administration liabilities attributable to
Insured events of the current year (303,784) (300,862)
Insured events of prior years (1,444,927) (1,451,591)
Total payments (1,748,711) (1,752,453)
Unpaid benefit and claims administration
liabilities, June 30 13,600,704$ 13,240,921$
Current portion 1,498,441$ 1,475,918$
Long-term portion 12,102,263$ 11,765,004$
Changes in Benefit and Claims Administration Liabilities
(in thousands)
It is expected that benefit and claim administration liabilities will change every year due to normal
activities, such as adding the insured events of the current year, discounting existing liabilities, and
paying claims. Benefit and claim administration liabilities also changed due to an increase of
$327.6 million in the provision for insured events of prior years, mostly due to a $354.8 million
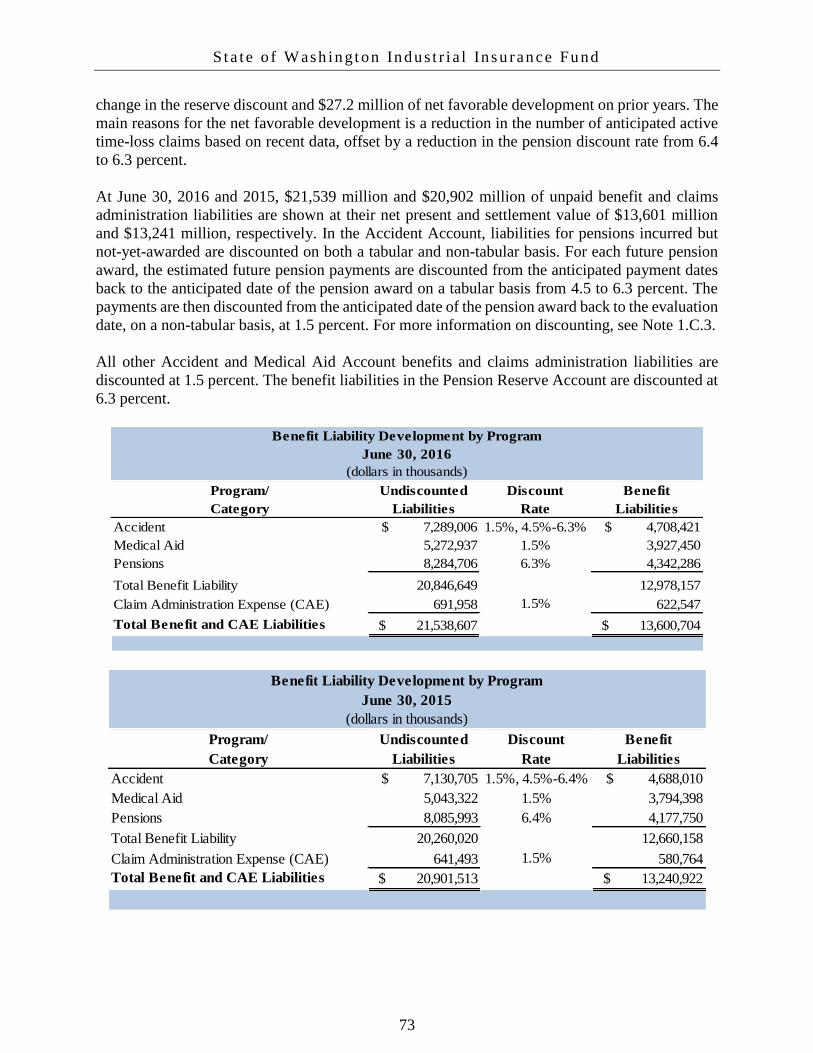
St a t e o f W ash in g t on In d u s t r i a l In s u r an ce Fu nd
73
change in the reserve discount and $27.2 million of net favorable development on prior years. The
main reasons for the net favorable development is a reduction in the number of anticipated active
time-loss claims based on recent data, offset by a reduction in the pension discount rate from 6.4
to 6.3 percent.
At June 30, 2016 and 2015, $21,539 million and $20,902 million of unpaid benefit and claims
administration liabilities are shown at their net present and settlement value of $13,601 million
and $13,241 million, respectively. In the Accident Account, liabilities for pensions incurred but
not-yet-awarded are discounted on both a tabular and non-tabular basis. For each future pension
award, the estimated future pension payments are discounted from the anticipated payment dates
back to the anticipated date of the pension award on a tabular basis from 4.5 to 6.3 percent. The
payments are then discounted from the anticipated date of the pension award back to the evaluation
date, on a non-tabular basis, at 1.5 percent. For more information on discounting, see Note 1.C.3.
All other Accident and Medical Aid Account benefits and claims administration liabilities are
discounted at 1.5 percent. The benefit liabilities in the Pension Reserve Account are discounted at
6.3 percent.
Program/ Undiscounted Discount Benefit
Category Liabilities Rate Liabilities
Accident $ 7,289,006 1.5%, 4.5%-6.3% $ 4,708,421
Medical Aid 5,272,937 1.5% 3,927,450
Pensions 8,284,706 6.3% 4,342,286
Total Benefit Liability 20,846,649 12,978,157
Claim Administration Expense (CAE) 691,958 1.5% 622,547
Total Benefit and CAE Liabilities $ 21,538,607 $ 13,600,704
Benefit Liability Development by Program
June 30, 2016
(dollars in thousands)
Program/ Undiscounted Discount Benefit
Category Liabilities Rate Liabilities
Accident $ 7,130,705 1.5%, 4.5%-6.4% $ 4,688,010
Medical Aid 5,043,322 1.5% 3,794,398
Pensions 8,085,993 6.4% 4,177,750
Total Benefit Liability 20,260,020 12,660,158
Claim Administration Expense (CAE) 641,493 1.5% 580,764
Total Benefit and CAE Liabilities $ 20,901,513 $ 13,240,922
Benefit Liability Development by Program
June 30, 2015
(dollars in thousands)

St a t e o f W ash in g t on In d u s t r i a l In s u r an ce Fu nd
74
Note 11 - Retrospectively-Rated Contracts and Contracts Subject to Redetermination
11.A. Method Used to Estimate
The Industrial Insurance Fund estimates accrued retrospective premium annual adjustments for
unadjusted enrollment periods by reviewing historical participation and return patterns. The
historical averages are used to arrive at an estimate of net retrospective return premiums for
unadjusted periods. Cumulative return premiums for periods from the first annual adjustment
through the third annual adjustment are system-generated, and the accruals are the difference
between the cumulative returns and the amount already returned. The third annual retrospective
adjustment is final.
11.B. Method Used to Record
Retrospective return premiums due to employers are netted with additional premiums due from
employers and recorded as a liability.
11.C. Amount and Percent of Net Retrospective Premiums
Net premiums for the fiscal year ended June 30, 2016, on retrospectively-rated workers’
compensation policies were $858.3 million, which were 40 percent of total workers’ compensation
net standard premiums earned. The net premiums for fiscal year ended June 30, 2015, on
retrospectively-rated workers’ compensation policies were $820.2 million, which were 41 percent
of total workers’ compensation net standard premiums earned for that year.
11.D. Calculation of Nonadmitted Retrospective Premiums
Retrospective additional premiums 90 days past due after the third annual retrospective adjustment
are nonadmitted.
Note 12 - Discounting of Liabilities for Unpaid Benefits or Unpaid Claims Administration
Expenses
The case reserves shown in this exhibit are the reserves for pensions awarded through June 30,
2016, only. The Industrial Insurance Fund estimates case reserves on certain other individual
claims solely for the purpose of classification rating, retrospective rating, and experience rating.
Such case reserves are not maintained on claims that do not enter the rating calculations, so they
are not meaningful for claims less than approximately 18 months old or more than approximately
seven years old.
12.A. Tabular Discounts
The mortality tables are based on a 2014 study of Industrial Insurance Fund claimant data and the
2000 U.S. Census data. The liabilities for pensions already granted are discounted at 6.3 percent
per annum. The liabilities for pensions incurred but not yet granted are discounted at rates from
4.5 to 6.3 percent, reflecting the pension discount rates anticipated to be in effect when the pensions

St a t e o f W ash in g t on In d u s t r i a l In s u r an ce Fu nd
75
are granted. The June 30, 2016, liabilities include $7,006,159,000 of such reserves, net of tabular
discounts. The amount of the tabular discount for case reserves (i.e., pensions already granted) is
$3,942,420,000 and is $2,194,230,000 for Incurred But Not Reported (IBNR) reserves at June 30,
2016.
At June 30, 2015, the liabilities, net of tabular discounts, amounted to $6,720,156,000. The amount
of the tabular discount for case reserves was $3,908,243,000 and was $2,066,472,000 for IBNR
reserves.
Undiscounted
Benefit Benefit
Fiscal Liabilities Liabilities
Accident Gross of Tabular Net of Tabular
Year Discount Case IBNR Discount
2006 & Prior 6,726,738$ 2,766,701$ 336,373$ 3,623,664$
2007 749,394 255,786 122,608 371,000
2008 806,582 243,922 162,670 399,990
2009 729,671 201,760 164,962 362,949
2010 648,034 163,343 161,875 322,816
2011 615,429 120,309 182,292 312,828
2012 564,624 87,758 185,247 291,619
2013 560,334 52,016 212,109 296,209
2014 563,627 26,125 231,095 306,407
2015 583,523 14,737 224,236 344,550
2016 594,853 9,963 210,763 374,127
Total 13,142,809$ 3,942,420$ 2,194,230$ 7,006,159$
*Includes liabilities for pensions already granted and pensions incurred but not yet granted.
June 30, 2016
Liabilities Discounted on a Tabular Basis*
Tabular Discounts
(in thousands)
12.B. Non-Tabular Discounts
The non-tabular discount rate is made up of a benchmark rate less a risk adjustment rate, rounded
to the nearest one-half percentage point. The benchmark rate is the five-year moving average of
the U.S. 20-Year Treasury yield. The risk adjustment equals two percentage points until the
benchmark rate reaches 4.0 percent. Below 4.0 percent, the risk adjustment is one-half the
benchmark rate rounded to the nearest one-half percent. As of June 30, 2016, the benchmark rate
was 2.79 percent, and the indicated non-tabular discount rate was 1.5 percent. The non-tabular
discount is calculated using the selected non-tabular discount rate and the anticipated payout of
the liabilities.
The June 30, 2016, liabilities included $8,635,871,000 of reserves for benefits and $622,547,000
of reserves for claims administration expenses, net of tabular and non-tabular discounts. The
amount of the non-tabular discounts for IBNR reserves was $1,731,842,000, the amount for

St a t e o f W ash in g t on In d u s t r i a l In s u r an ce Fu nd
76
defense and cost containment (DCC) expense reserves was $44,573,000, and the amount for
adjusting and other (AO) expense reserves was $24,838,000.
The June 30, 2015, liabilities included $8,482,409,000 of reserves for benefits and $580,764,000
of reserves for claims administration expenses, net of tabular and non-tabular discounts. The
amount of the non-tabular discounts for IBNR reserves was $1,625,147,000, the amount of non-
tabular discount for DCC expense reserves was $38,765,000, and the non-tabular discount for AO
expense reserves was $21,964,000.
Benefit & CAE Benefit & CAE
Fiscal Liabilities Net of Liabilities Net of
Accident Tabular and Gross of Tabular and Non-
Year Non-Tabular Discount Case IBNR DCC AO Tabular Discount
2006 & Prior 2,783,510$ -$ 559,189$ 13,818$ 3,279$ 2,207,224$
2007 436,783 75,505 1,812 926 358,540
2008 550,888 91,284 2,200 1,261 456,143
2009 579,213 95,703 2,295 1,338 479,877
2010 558,389 89,272 2,159 1,360 465,598
2011 638,498 98,065 2,385 1,644 536,404
2012 686,543 102,175 2,534 1,818 580,016
2013 846,602 122,320 3,110 2,291 718,881
2014 1,038,326 143,410 3,763 2,863 888,290
2015 1,268,736 162,457 4,528 3,598 1,098,153
2016 1,672,183 192,462 5,969 4,460 1,469,292
Totals 11,059,671$ -$ 1,731,842$ 44,573$ 24,838$ 9,258,418$
*Excludes liabilities for pensions already granted, but includes liabilities for pensions incurred but not yet granted.
June 30, 2016
Liabilities Discounted on a Non-Tabular Basis*
Non-Tabular Discounts
(in thousands)
Benefit & CAE Benefit & CAE
Fiscal Liabilities Net of Liabilities Net of
Accident Tabular and Gross of Tabular and Non-
Year Non-Tabular Discount Case IBNR DCC AO Tabular Discount
2005 & Prior 2,511,000$ -$ 505,200$ 10,666$ 2,638$ 1,992,496$
2006 373,865 64,629 1,474 685 307,077
2007 488,746 80,296 1,837 976 405,637
2008 624,616 97,693 2,233 1,351 523,339
2009 660,474 101,319 2,333 1,467 555,355
2010 658,672 97,547 2,305 1,528 557,292
2011 687,857 98,448 2,389 1,646 585,374
2012 745,598 101,050 2,491 1,857 640,200
2013 1,002,845 129,016 3,264 2,553 868,012
2014 1,285,994 160,098 4,218 3,196 1,118,482
2015 1,709,382 189,851 5,555 4,067 1,509,909
Totals 10,749,049$ -$ 1,625,147$ 38,765$ 21,964$ 9,063,173$
*Excludes liabilities for pensions already granted, but includes liabilities for pensions incurred but not yet granted.
June 30, 2015
Liabilities Discounted on a Non-Tabular Basis*
Non-Tabular Discounts
(in thousands)

St a t e o f W ash in g t on In d u s t r i a l In s u r an ce Fu nd
77
Note 13 - Related Party Transactions
L&I administers the state’s Workers’ Compensation Program, including the Industrial Insurance
Fund. It is an agency of the state of Washington; therefore, other Washington State agencies are
related parties. Certain goods and services, such as attorney general legal services, information
technology services, facilities management, building security, and cash and investment
management services, are provided to L&I by other state agencies.
Total expenses incurred for goods and services provided by other Washington State agencies were
$52,313,406 in fiscal year 2016 and $49,196,899 in fiscal year 2015. During fiscal years 2016 and
2015, 87.6 percent and 88.6 percent, respectively, of the total related party expenses were to the
Attorney General’s Office, the Department of Enterprise Services, and Consolidated Technology
Services. Total amounts due to other state agencies were $5,572,456 and $6,107,739 at June 30,
2016 and 2015, respectively.
The Washington State Legislature and the Governor provide appropriation authority from the
Industrial Insurance Fund for use by the following Washington State agencies:
Board of Industrial Insurance Appeals - hears appeals of decisions made by L&I
University of Washington - promotes health and minimizes occupational disease or injury
through teaching, research, and service
Department of Health - completes surveys and on-site investigations of farm worker
housing
Health Care Authority - assists with reviews to develop preferred prescription drug lists
Joint Legislative Audit and Review Committee - performs a performance audit of the
workers’ compensation claims management system
Total operating expenses incurred by these agencies in the Industrial Insurance Fund were
$28,322,467 and $26,784,019 in fiscal years 2016 and 2015, respectively.
The Industrial Insurance Fund also transfers expenses and cash between the Accident, Medical
Aid, and Pension Reserve Accounts, as well as the Supplemental Pension and Second Injury
Accounts from the Workers’ Compensation Program.
Note 14 - Income Taxes
The Industrial Insurance Fund is exempt from federal income tax under the Internal Revenue
Service Code sections 115 and 501(c) (26).

St a t e o f W ash in g t on In d u s t r i a l In s u r an ce Fu nd
78
Note 15 - Capital and Contingency Reserve
15.A. Capital
The Industrial Insurance Fund has no shares of stock authorized or outstanding.
15.B. Contingency Reserve
The contingency reserve represents net admitted assets available for financing ongoing operations
and uncertainties not otherwise reserved. Changes in the contingency reserve are made up of
investment and insurance operating results.
For fiscal years 2016 and 2015, changes in the contingency reserve resulted from the following:
Fiscal Year
2016
Fiscal Year
2015
Contingency Reserve, July 1 1,221,560$ 945,939$
Unexpected Investment Results
Actual unrealized and realized gains (losses)
Fixed income: unrealized gains (losses) (76,587) (5,132) Equities: unrealized gains (105,243) 28,823
Fixed income: realized gains 63,491 40,573
Equities: realized gains 74,497 18,087
Total actual unrealized and realized gains (43,842) 82,351
Less expected gains (70,200) (76,230)
Total Unexpected Investment Results (114,042) 6,121
Unexpected Insurance Operation Results
Development of prior years' loss and CAE liability 27,254 273,441
Development of prior years' retro refund liability (5,148) (26,310)
Premium adequacy 389,774 48,600
Nonadmitted asset results (26,476) (26,231)
Total Unexpected Insurance Operation Results 385,404 269,500
Change in contingency reserve 271,362 275,621
Contingency Reserve, June 30 1,492,922$ 1,221,560$
Explanation of Industrial Insurance Fund Operating and Investment Results
(in thousands)

St a t e o f W ash in g t on In d u s t r i a l In s u r an ce Fu nd
79
The contingency reserve balances by account for fiscal years 2016 and 2015 were:
Accident Medical Aid Pension Reserve
Account Account Account Total
Contingency Reserve, June 30, 2016 489,517$ 1,003,405$ -$ 1,492,922$
Contingency Reserve, June 30, 2015 279,916$ 941,644$ -$ 1,221,560$
Contingency Reserve Balances
by Account
(in thousands)
Note 16 - Asbestos and Environmental Reserves
Claims related to asbestos and hazardous chemicals or waste arise mainly as a result of the
claimants’ exposure at work and are covered by the Industrial Insurance Fund. There is not a large
exposure, and it is not fundamentally different from any other injury due to exposure to hazardous
materials in normal industrial activity. Case and IBNR reserves related to asbestos or
environmental exposure claims are not specially reserved. IBNR and CAE reserves related to
asbestos claims are included as part of benefit and CAE liabilities.
The table below shows a gross basis for the case reserves related to asbestos. L&I does not
currently hold any reinsurance agreements.
Note 17 - Subsequent Events
For the annual Statutory Financial Information Report as of June 30, 2016, an analysis of
subsequent events has been evaluated through the report issuance date of December 9, 2016. The
events described below existed after June 30, 2016.
Fiscal Year
2016
Fiscal Year
2015
Beginning case reserve related to asbestos 44,415,153$ 50,539,979$
Benefits incurred 9,223,566 547,171
Payments made (7,939,339) (6,671,997)
Ending case reserve related to asbestos 45,699,380$ 44,415,153$
Note: Amounts are case reserves and do not include IBNR or CAE reserves.
Workers' Compensation
Asbestos Claims

St a t e o f W ash in g t on In d u s t r i a l In s u r an ce Fu nd
80
17.A. Proposed Rate Announcement
Each year, the Director of L&I adopts new workers’ compensation insurance premium rates for
the next calendar year. On September 21, 2016, the Director announced a proposed 0.7 percent
increase in the average premium rate for 2017. The following four principles were used to guide
the rate-setting process:
1. Set steady and predictable rate increases to help businesses plan ahead.
2. Benchmark rates against wage inflation (this happens automatically in other states).
3. Slowly rebuild the reserves to protect against unexpected changes.
4. Lower costs while focusing on better outcomes for injured workers.
The final rates will be adopted in early December 2016 and go into effect on January 1, 2017.
17.B. Industrial Insurance Rainy Day Fund
RCW 51.44.023 was enacted during the 2011, Legislative session, creating an Industrial Insurance
Rainy Day Fund to hold transfers from the Accident and Medical Aid Accounts when assets for
those accounts combined are between 10 and 30 percent of total liabilities for the Industrial
Insurance Fund. Money from the Industrial Insurance Rainy Day Fund should be applied to reduce
a rate increase or aid business in recovering from or during economic recessions. Per the June 30,
2016, Statutory Financial Information report for Industrial Insurance Fund, the combined assets of
the Accident and the Medical Aid Accounts are in excess of 10 percent of total liabilities for the
Industrial Insurance Fund. As a part of the 2017 rate-making process, the Director announced that
he plans to restrict the Medical Aid Account contingency reserve (similar to restricted component
of net position). The Medical Aid Account contingency reserve balance will be restricted by $107
million for the Industrial Insurance Rainy Day Fund.

St a t e o f W ash in g t on In d u s t r i a l In s u r an ce Fu nd
81
Supplementary Information

St a t e o f W ash in g t on In d u s t r i a l In s u r an ce Fu nd
82

St a t e o f W ash in g t on In d u s t r i a l In s u r an ce Fu nd
83
State of Washington Industrial Insurance Fund
Schedule of Undiscounted Claims Development Information Fiscal Years 2007 through 2016
(dollars in millions)
The table below illustrates how the Industrial Insurance Fund’s earned revenues (net of reinsurance) and investment
revenue compare to the related costs of losses (net of loss assumed by reinsurers) and other expenses assumed by the
program as of the end of each of the last ten fiscal years. The Industrial Insurance Fund has not purchased reinsurance
since September 30, 2002, and has never had a qualifying event that generated a recovery.
The columns of the table show data for successive fiscal years. 2007 2008 2009 2010 2011 2012 2013 2014 2015 2016
Net earned required contribution
and investment revenues $ 2,406 $ 1,697 $ 1,692 $ 2,797 $ 2,525 $ 2,581 $ 1,928 $ 2,888 $ 2,113 $ 2,931
Estimated incurred claims and
expenses, end of fiscal accident
year 2,196 2,256 2,363 2,312 2,254 2,086 2,105 2,061 2,304 2,205
Paid (cumulative) as of:
End of fiscal accident year 295 310 322 298 289 284 296 297 301 304
One year later 625 679 667 604 584 580 593 613 605
Two years later 817 890 863 773 747 734 755 778
Three years later 953 1,042 1,000 890 857 840 866
Four years later 1,059 1,162 1,107 981 940 918
Five years later 1,144 1,258 1,192 1,054 1,006
Six years later 1,216 1,337 1,262 1,114
Seven years later 1,281 1,406 1,323
Eight years later 1,340 1,466
Nine years later 1,391
Re-estimated incurred
claims and expenses: *
End of fiscal accident year 2,196 2,256 2,363 2,312 2,254 2,086 2,105 2,061 2,304 2,205
One year later 2,234 2,559 2,535 2,271 2,139 2,026 2,001 2,175 2,124
Two years later 2,390 2,647 2,538 2,261 2,066 1,967 2,036 2,097
Three years later 2,441 2,724 2,485 2,137 2,012 1,878 2,025
Four years later 2,526 2,662 2,411 2,147 1,986 1,960
Five years later 2,445 2,576 2,439 2,137 2,060
Six years later 2,388 2,621 2,439 2,151
Seven years later 2,419 2,625 2,461
Eight years later 2,421 2,660
Nine years later 2,455
Increase (decrease) in estimated
incurred claims and expenses
from end of policy year ** 259 404 98 (161) (194) (126) (80) 36 (180)
Percentage change in estimated
incurred claims and expenses 11.8% 17.9% 4.1% (7.0%) (8.6%) (6.0%) (3.8%) 1.7% (7.8%)
Source: Washington State Department of Labor & Industries Actuarial Services
* Re-estimated claims and expenses result from new information received on known claims, re-evaluation of existing information on known claims, and emergence of new claims not
previously known.
** This line compares the latest re-estimated incurred claims amount to the amount originally established and shows whether this latest estimate of claims cost is greater or less than
originally thought. As data for individual policy years mature, the correlation between original estimates and re-estimates is commonly used to evaluate the accuracy of incurred
claims currently recognized in more recent fiscal accident years.

St a t e o f W ash in g t on In d u s t r i a l In s u r an ce Fu nd
84
Supplemental Investment Risk Interrogatories
June 30, 2016
1. The Industrial Insurance Fund’s total admitted assets as reported on page 31 of this annual
Statutory Financial Information Report were $15,470,727,000 at June 30, 2016.
2. The following are the Industrial Insurance Fund’s ten largest exposures to a single
issuer/borrower/investment by investment category, excluding (i) U.S. government, U.S.
government agency securities, and those U.S. government money market funds listed as
exempt in the Appendix to the SVO’s Practices and Procedures Manual, (ii) property
occupied by the Industrial Insurance Fund, and (iii) policy loans:
Percentage
of Total
Amount Admitted Assets
Bonds - Freddie Mac 556,171,000$ 3.59%
Bonds - Fannie Mae 394,808,000 2.55%
Bonds - Citibank Credit Card Issuance 152,979,000 0.99%
Bonds - Novartis Capital Corp 133,418,000 0.86%
Bonds - Bank of America Corp 128,937,000 0.83%
Bonds - Citigroup Inc 128,888,000 0.83%
Bonds - JPMorgan Chase & Co 124,975,000 0.81%
Bonds - Burlingtn North Santa Fe 110,861,000 0.72%
Bonds - Trans-Canada Pipelines 106,669,000 0.69%
Bonds - Norfolk Southern Corp 105,376,000 0.68%
3. The Industrial Insurance Fund’s total admitted assets held in bonds and preferred stocks, by
NAIC designation, including bonds classified as short-term investments at June 30, 2016,
were:
Percentage
of Total
Amount Admitted Assets
Bonds with an NAIC rating of 1 9,198,919,000$ 59.46%
Bonds with an NAIC rating of 2 3,208,637,000 20.74%
Bonds with an NAIC rating of 3 282,970,000 1.83%
Bonds with an NAIC rating of 4 136,636,000 0.88% 4. Assets held in foreign investments:
Assets held in foreign investments exceeded 2.5% of the Industrial Insurance Fund’s total
admitted assets.

St a t e o f W ash in g t on In d u s t r i a l In s u r an ce Fu nd
85
Supplemental Investment Risk Interrogatories
June 30, 2016
Total admitted assets held in foreign investments at June 30, 2016:
Asset Type Amount
Percentage of Total
Admitted Assets
Bonds 3,189,252,000$ 20.61%
Equities 695,000,000 4.49%
Total admitted assets held in foreign investments in bonds by NAIC rating at June 30, 2016:
NAIC Designation Amount
Percentage of Total
Admitted Assets
Countries designated NAIC – 1 1,905,293,000$ 12.32%
Countries designated NAIC – 2 552,996,000 3.57%
Countries designated NAIC – 3 730,962,000 4.72%
The two countries with the largest foreign investment exposure in each NAIC designation at
June 30, 2016:
Issuer NAIC Designation Amount
Percentage of Total
Admitted Assets
Australia 1 419,676,000$ 2.71%
United Kingdom 1 391,270,000 2.53%
Indonesia 2 144,960,000 0.94%
Mexico 2 117,613,000 0.76%
SupraNational 3 or below 285,578,000 1.85%
Brazil 3 or below 220,349,000 1.42%

St a t e o f W ash in g t on In d u s t r i a l In s u r an ce Fu nd
86
Supplemental Investment Risk Interrogatories
June 30, 2016
Ten largest non-sovereign (i.e., non-governmental) investments held in foreign issues at June
30, 2016:
Issuer NAIC Designation Amount
Percentage of Total
Admitted Assets
Vale Overseas Limited 2 93,660,000$ 0.61%
National Australia Bank 1 89,886,000 0.58%
Westpac Banking Corp 1 74,956,000 0.48%
Hutchison Wham Int 03/33 2 70,828,000 0.46%
Commonwealth Bk Austr NY 1 64,961,000 0.42%
Alibaba Group Holding LTD 1 64,764,000 0.42%
Siemens Financieringsmat 1 59,945,000 0.39%
Itau Unibanco Hldg SA KY 1 55,045,000 0.36%
State Grid Overseas Inv 1 54,358,000 0.35%
Maccquarie Bank LTD 1 53,976,000 0.35%
Percentage of TotalAmount Admitted Assets
5. Total admitted assets held in Canadian investments $1,362,560,000 8.81%
6. The Industrial Insurance Fund had no investments with contractual sales restrictions, which
are defined as “investments having restrictions that prevent investments from being sold
within 90 days.”
7. The Industrial Insurance Fund’s admitted assets held in equity interests, including
investments in the shares of mutual funds, preferred stocks, publicly traded equity securities,
and other equity securities (including Schedule BA equity interests) and excluding money
market and bond mutual funds listed in the Appendix to the SVO’s Practices and Procedures
Manual, as exempt, or Class 1, were:
Fund Amount
Percentage of Total
Admitted Assets
Blackrock MSCI U.S. IMI Index 1,094,725,000$ 7.08%
MSCI EAFE Index SL CTF 408,488,000 2.64%
MSCI Emerging Markets Free IND 130,748,000 0.85%
MSCI Small Cap Index (Provisio) 64,987,000 0.42%
Canada MSCI CTF 39,676,000 0.26%
MSCI Equity Index Fund 20,563,000 0.13%
MSCI Canada Small Cap 7,179,000 0.05% Assets held in equity interest exceeded 2.5% of the Industrial Insurance Fund’s total
admitted assets.

St a t e o f W ash in g t on In d u s t r i a l In s u r an ce Fu nd
87
Supplemental Investment Risk Interrogatories
June 30, 2016
8. The Industrial Insurance Fund did not hold any non-affiliated, privately-placed equities under
Securities Exchange Commission (SEC) Rule 144a or SEC Rule 144 without volume
restrictions.
9. The Industrial Insurance Fund did not hold general partnership interests.
10. The Industrial Insurance Fund did not own any mortgage loans.
11. The Industrial Insurance Fund did not have any individual parcels or groups of contiguous
parcels of real estate.
12. The Industrial Insurance Fund held no investments in mezzanine real estate loans.
13. The Industrial Insurance Fund did not have admitted assets subject to repurchase agreements,
reverse repurchase agreements, dollar repurchase agreements or dollar reverse repurchase
agreements at June 30, 2016.
14. The Industrial Insurance Fund did not own any warrants not attached to other financial
instruments, options, caps, or floors at June 30, 2016.
15. The Industrial Insurance Fund did not have any exposure for collars, swaps, or forwards
during fiscal year 2016.
16. The Industrial Insurance Fund did not have any potential exposure for futures contracts
during fiscal year 2016.

St a t e o f W ash in g t on In d u s t r i a l In s u r an ce Fu nd
88
Summary Investment Schedule
June 30, 2016
The Industrial Insurance Fund held cash and invested assets as of June 30, 2016, consisting of the
following:
Amount Percentage Amount
Securities Lending
Reinvested
Collateral Amount Total Amount Percentage
Bonds:
U.S. Treasury securities 2,008,377,000$ 13.54% 2,008,377,000$ -$ 2,008,377,000$ 13.54%
U.S. Government agency and corporate obligations
(excluding mortgage-backed securities) - 0.00% - - 0.00%
Foreign government (including Canada,
excluding mortgage-backed securities) 1,185,411,000 7.99% 1,185,411,000 - 1,185,411,000 7.99%
Mortgage-backed securities (includes residential and
commercial mortgage-backed securities)
Issued or guaranteed by GNMA 45,414,000 0.31% 45,414,000 - 45,414,000 0.31%
Issued or guaranteed by FNMA, FHLMC 950,978,000 6.41% 950,978,000 - 950,978,000 6.41%
Issued or guaranteed by all other 183,554,000 1.24% 183,554,000 - 183,554,000 1.24%
Other fixed income securities (excluding short-term):
Unaffiliated domestic securities 4,915,286,000 33.14% 4,915,286,000 - 4,915,286,000 33.14%
Unaffiliated foreign securities 3,376,836,000 22.77% 3,376,836,000 - 3,376,836,000 22.77%
Equity interests:
Commingled index funds - domestic 1,094,724,000 7.38% 1,094,724,000 - 1,094,724,000 7.38%
Commingled index funds - foreign 671,640,000 4.53% 671,640,000 - 671,640,000 4.53%
Real estate investments:
Property occupied by company - 0.00% - - - 0.00%
Property held for production of income - 0.00% - - - 0.00%
Receivables for securities and interest 109,876,000 0.74% 109,876,000 - 109,876,000 0.74%
Cash and cash equivalents 12,526,000 0.08% 12,526,000 77,813,000 90,339,000 0.61%
Securities lending collateral 114,835,000 0.77% - - - 0.00%
Short-term investments 161,305,000 1.08% 161,305,000 37,022,000 198,327,000 1.33%
Total 14,830,762,000$ 100.00% 14,715,927,000$ 114,835,000$ 14,830,762,000$ 100.00%
Admitted assets as reported
Gross investment holding in the annual statement

St a t e o f W ash in g t on In d u s t r i a l In s u r an ce Fu nd
89
Independent Actuarial Opinion

90
September 30, 2016
Statement of Actuarial Opinion
State of Washington – Industrial Insurance Fund
Identification
I, Rod Morris, am a Specialist Leader with the firm of Deloitte Consulting LLP. I am a Member of the American Academy of Actuaries and meet its qualification standards for issuing Statements of Actuarial Opinion. I am a Fellow of the Casualty Actuarial Society. I was appointed by the Washington State Auditors’ Office to provide a Statement of Actuarial Opinion regarding the reasonableness of the State of Washington Industrial Insurance Fund’s (“the Fund”) carried loss and loss adjustment expense reserves as of June 30, 2016.
The Fund is comprised of three Workers’ Compensation Program Accounts: the Accident Account, the Medical Aid Account, and the Pension Reserve Account. The Fund is currently administered by the State of Washington Department of Labor & Industries (“the Department”).
Scope
I have examined the reserves listed in Exhibit A: Scope, as shown in the Fund’s Statutory Financial Information Report, as of June 30, 2016. The loss and loss adjustment expense reserves (“reserves”) specified in Exhibit A, where applicable, include provisions for Disclosure items (disclosures 8 thru 10)in Exhibit B. I have reviewed the June 30, 2016 loss and loss adjustment expense recorded under U.S. Statutory Accounting Principles. My review considered information provided to me through the date of this opinion.
In forming my opinion on the loss and loss adjustment expense reserves, I relied upon data provided by Mr. William Vasek, the Department’s Chief Actuary, his actuarial staff, and Sharon Elias, the Department’s Financial Services Program Manager. I evaluated that data for reasonableness and consistency. In other respects, my examination included the use of such actuarial assumptions and methods and such tests of the calculations as I considered necessary.
My review was limited to items listed in Exhibit A, and did not include an analysis of any other balance sheet items. I have not examined the Fund’s assets and I have formed no opinion as to the validity or value of these assets.
Opinion
In my opinion, the amounts carried in Exhibit A on account of the items identified:
(A) meet the requirements of the insurance laws of the State of Washington;
Deloitte Consulting LLP555 West 5th StreetSuite 2700Los Angeles, California 90013USA
Tel: + 1 213 688 0800Fax: + 1 213 688 0100www.deloitte.com

91
State of Washington Industrial Insurance FundSeptember 30, 2016Page 2
(B) are consistent with reserves computed in accordance with accepted actuarial standards and principles;
(C) make a reasonable provision for all unpaid loss and loss adjustment expense obligations of
the Fund under the terms of its contracts and agreements.
Relevant Comments
A. Risk of Material Adverse Deviation
With respect to this Statement of Actuarial Opinion, the amount of adverse deviation that I consider to be material is $298.6 million. My basis for determining this amount is 20% of the Contingency Reserve.This amount represents a reasonable upward fluctuation reserves from those carried by the Fund that would be material to the Contingency Reserve. My materiality standard was selected based on the context in which this opinion letter will be used. It is prepared solely to assess the reasonableness of the Fund’s loss and loss adjustment expense reserves. Other measures of materiality might be used for reserves that are being evaluated in a different context.
I have identified the major risk factors for the Fund as the lack of diversity of exposure by line of business and by state, future medical trend, the discounting of the reserves, reserve leverage, and future cost of living adjustments. The potential impact of these risk factors is described in the following paragraphs. The absence of other risk factors from this listing does not imply that additional factors will not be identified in the future as having been a significant influence on the Fund’s reserves.
By statute, the Fund’s direct exposure is limited to one line of business (workers’ compensation) in one state (Washington). Therefore, any adverse trends affecting this line of business and/or state could have a material effect on the Fund’s loss and loss adjustment expense reserves. Such trends would include legislative benefit level changes and adverse decisions or interpretations of law that may have an effect on all open workers’ compensation claims.
A major assumption in the analysis of the medical component of the workers’ compensation reserves is the selection of a long-term medical trend factor to apply to future calendar year medical payments. Estimating medical trend has become increasingly difficult in recent years because it has been highly variable. In my opinion, there is a higher than normal degree of variability associated with the Fund’smedical loss reserves due to the uncertainty surrounding future medical trends and the expected length of medical payments.
The Department discounts the loss and loss adjustment expense reserves to reflect the time value of money using an average annual interest rate of 3.51%. Changes to the interest rate used for discounting could result in material changes to the reserves. We note that the current risk free interest rate matching the duration of these liabilities was 2.10% as of June 30, 2016 and these rates have been trending lower for many years now. For example, the risk free interest rate matching the duration of these liabilities was 2.98% as of June 30, 2015.
The Fund defines its “Contingency Reserve” as the difference between its assets and liabilities. Other insurance companies typically refer to this Contingency Reserve as Statutory Surplus. Due to the size of the Fund’s Contingency Reserve, $1.49 billion, relative to the size of its loss and loss adjustment expense reserve, $13.60 billion, any small changes in reserves will have a material impact on the Contingency Reserve. The current reserve leverage ratio (reserve / contingency reserve) is significantly higher than the majority of workers’ compensation carriers in the industry and workers’ compensation funds in other states, although the Fund’s leverage ratio has been declining in recent years.
An implicit assumption in the Department’s actuarial review is that the State of Washington cost of living adjustments will be similar to cost of living adjustments approved by the Federal Government for Social Security retirement benefits. Future State of Washington cost of living adjustments that vary significantly from those approved by the Federal Government for Social Security retirement benefits
92
State of Washington Industrial Insurance FundSeptember 30, 2016Page 3
could result in a material change in future costs and the adequacy of the reserves, especially for the Pension Reserve Account.
The Fund is exposed to the uncertainty of variability of the reserves which could result in material adverse deviation. At this time, my assessment is that the Fund has a significant risk of a material adverse deviation.
B. Other Disclosures in Exhibit B
Underwriting Pools or Associations
The Fund participates in the Washington United States Longshore and Harbor Workers’ Compensation Act Assigned Risk Plan (“WARP”) which was established to provide USL&H workers’ compensation insurance coverage for employers unable to purchase it through the normal private insurance market. The Fund pays assessments to WARP and participates in any underwriting losses or surpluses incurred by WARP. Based on discussions with the Department, we understand that WARP is not currently in a deficit position. Therefore, the Fund has not booked a reserve to account for any unpaid claim liability related to WARP.
We understand that the Fund does not participate in any other voluntary or involuntary pools.
Asbestos Exposures and Environmental Exposures
I have reviewed the Fund’s exposure to asbestos and environmental claims. In my opinion, the chance of material liability related to asbestos and environmental claims is remote. The Fund has not provided coverage that could reasonably be expected to produce material levels of asbestos and/or environmental liability claims activity.
Disclosure of Unearned Premium Reserves for Long Duration Contracts
The Fund does not write single or fixed premium policies with coverage periods of thirteen months or greater which are non-cancelable and not subject to premium increase.
Reinsurance
The Fund has no ceded or assumed reinsurance. Based on discussions with the Department’smanagement and their description of the Fund’s ceded (and/or assumed) reinsurance, I am not aware of any reinsurance contract that either has been or should have been accounted for as retroactive reinsurance or financial reinsurance.
Discounting
The Department discounts the loss and loss adjustment expense reserves to reflect the time value of money. The amount of discount is based on an actuarially derived projected payment pattern and selected annual interest rates as follows.
For the Medical Aid Account, the Department’s selected interest rate is 1.5%.
For the Pension Reserve Account, the Department’s selected interest rate is 6.3%.
For the Accident Account, combinations of interest rates are used to discount the reserves. The future total permanent disability and fatal transfers made to the Pension Account assume interest discounts based on an annual rate of 6.3% through the 1st quarter of 2017. This rate is reduced to 6.00% for the next 12 months and then is gradually reduced each additional 12-month period by 0.25% for the following six 12-month periods until settling on a long term annual rate of 4.5%. The actual transfer payments and all other payments are discounted using a Department selected rate of 1.5%.
The average combined interest rate for the Fund is approximately 3.51% with a total discount amount of $7.9 billion. The interest rates were selected by the Department, and I make no opinion regarding
93
State of Washington Industrial Insurance FundSeptember 30, 2016Page 4
the appropriateness of the selected rates. We note that the current risk free interest rate matching the duration of these liabilities was 2.10% as of June 30, 2016 and these rates have been trending lower for many years now. For example, the risk free interest rate matching the duration of these liabilities was 2.98% as of June 30, 2015.
The interest rate used to discount the Pension Reserve Account changed from 6.4% last year to 6.3%this year. The effect of reducing these interest rate assumptions this year was an increase in the discounted unpaid claim liability of $34.4 million on the Pension Reserve Account reserve.
The interest rate used to discount the Accident Account future total permanent disability and fataltransfers made to the Pension Reserve Account continued to gradually decrease to 4.5% this year.Although, the rate at which the interest rates gradually decrease to 4.5% changed this year causing the discounted unpaid claim liability to decrease $10.6 million. The interest rate used for all other future payments remained the same this year at 1.5%.
The net effect of all the interest rate assumption changes combined this year was an increase in the discounted unpaid claim liability of $23.8 million including the current fiscal accident year.
C. General Uncertainty
In evaluating whether the reserves make a reasonable provision for unpaid losses and loss adjustment expense, it is necessary to project future loss and loss adjustment expense payments. It is certain that actual future losses and loss adjustment expenses will not develop exactly as projected and may, in fact, vary significantly from the projections. No warranty is expressed or implied that such variance will not occur. Further, my projections make no provision for the broadening of coverage by legislative action or judicial interpretation or for extraordinary future emergence of new classes of losses or types of losses not sufficiently represented in the Fund’s historical data base or which are not yet quantifiable.
Actuarial Report
An actuarial report and underlying actuarial workpapers supporting the findings expressed in this Statement of Actuarial Opinion will be provided to the Department to be retained for a period of seven years in its administrative offices and available for regulatory examination.
This Statement of Opinion is solely for the use of assessing the reasonableness of the loss and loss adjustment expense reserves and is only to be relied upon by the Fund and the State.
___________________________________Rod Morris, FCAS, FSA, MAAADeloitte Consulting LLP555 West 5th Street, Suite 2700Los Angeles, CA 90013(213) [email protected] 30, 2016

94
Statement of Actuarial Opinion – Year Ended June 30, 2016
State of Washington Industrial Insurance Fund
Exhibit A: SCOPE
Loss Reserves: Amount
1. Net of Reinsurance Reserve for Unpaid Losses $12,978,157,000
2. Net of Reinsurance Reserve for Unpaid Loss Adjustment Expenses
Total Net Loss and Loss Adjustment Expense Reserves
$ 622,547,000
$13,600,704,000
3. Gross of Reinsurance for Unpaid Losses $12,978,157,000
4. Gross of Reinsurance Reserve for Unpaid Loss Adjustment Expenses
Total Gross Loss and Loss Adjustment Expense Reserves
$ 622,547,000
$13,600,704,000
5. Retroactive Reinsurance Reserve Assumed $0
6. Other Loss Reserve items on which the Appointed Actuary is expressing an Opinion $0
Premium Reserves:
7. Reserve for Direct and Assumed Unearned Premiums for Long Duration Contracts $0
8. Reserve for Net Unearned Premiums for Long Duration Contracts $0
9. Other Premium Reserve items on which the Appointed Actuary is expressing an Opinion
$0

95
Statement of Actuarial Opinion – Year Ended June 30, 2016
State of Washington Industrial Insurance Fund
Exhibit B: DISCLOSURES
Item: Column 1 Column 2 Column 3 Column 4
1. Name of Appointed ActuaryLastMorris
First Rodney
Middle Scott
2. The Appointed Actuary’s Relationship to the Company. Enter E or C based upon the following:
E if an Employee, C if a Consultant
C
3. The Appointed Actuary is a Qualified Actuary based upon what qualification? Enter F, A, M, or O based upon the following:
F if a Fellow of the Casualty Actuarial Society (FCAS)A if an Associate of the Casualty Actuarial Society (ACAS)M if not a member of the Casualty Actuarial Society, but a Member of the American Academy of Actuaries approved by the Casualty Practice Council, as documented with the attached approval letter. O for Other
F
4. Type of Opinion, as identified in the OPINION paragraph. Enter R, I, E, Q, or N based upon the following:
R if reasonableI if Inadequate or Deficient ProvisionE if Excessive or Redundant ProvisionQ if Qualified. Use Q when part of the OPINION is Qualified.N if No Opinion
R
5. Materiality Standard expressed in $US (Used to answer Question #6.)
$298,584,400
6. Is there a Significant Risk of Material Adverse Deviation? YES or NO
YES [ X ]NO [ ]
7. Statutory Surplus (Contingency Reserve)
$1,492,922,000

96
Statement of Actuarial Opinion – Year Ended June 30, 2016
State of Washington Industrial Insurance Fund
Exhibit B: DISCLOSURES
Item: Column 1 Column 2 Column 3 Column 4
8. Discount included as a reduction to loss reserves and loss expense reserves as reported in Schedule P
8.1 Non-tabular Discount $1,801,253,000
8.2 Tabular Discount $6,136,650,000
9. The net reserves for losses and expenses for the Company’s share of voluntary and involuntary underwriting pools’ and associations’ unpaid losses and expenses that are included in reserves shown on the Liabilities, Surplus and Other Funds page, Losses and Loss Adjustment Expenses lines.
n/a
9. The total claims made extended loss and expense reserve (Schedule P Interrogatories)
9.1 Amount reported as loss reserves n/a
9.2 Amount reported as unearned premium reserves
n/a
10. Other items on which the Appointed Actuary is providing Relevant Comments
n/a


FY17-305 [12-2016]
State of Washington Industrial Insurance FundStatutory Financial Information Report
Upon request, foreign language support and formats for persons with disabilities are available. Call 1-800-547-8367. TDD users, call 360-902-5797. L&I is an equal opportunity employer.