2016 - riyad bank consolidated financial statements 2016-annual consolidated... · riyad bank...
TRANSCRIPT


RIYAD BANK
CONSOLIDATED STATEMENT OF FINANCIAL POSITION
As at December 31, 2016 and 2015
2016 2015Note SAR'000 SAR'000
ASSETSCash and balances with SAMA 4 21,262,177 20,569,929 Due from banks and other financial institutions 5 4,567,155 9,269,501 Positive fair value of derivatives 11 189,295 197,539 Investments, net 6 45,157,381 44,765,404 Loans and advances, net 7 142,909,367 145,066,191 Investment in associates 8 548,594 525,131 Other real estate 245,017 258,411 Property and equipment, net 9 1,862,349 1,894,701 Other assets 10 877,666 769,068 Total assets 217,619,001 223,315,875
LIABILITIES AND SHAREHOLDERS' EQUITY
LiabilitiesDue to banks and other financial institutions 12 8,836,713 4,499,693 Negative fair value of derivatives 11 138,638 187,129 Customer deposits 13 156,683,349 167,852,133 Debt securities in issue 14 8,018,373 8,011,313 Other liabilities 15 6,168,867 6,220,495 Total liabilities 179,845,940 186,770,763
Shareholders' equityShare capital 16 30,000,000 30,000,000 Statutory reserve 17 2,936,093 2,100,471 Other reserves 18 532,929 297,467Retained earnings 2,604,039 2,847,174 Proposed dividends 25 1,700,000 1,300,000 Total shareholders' equity 37,773,061 36,545,112 Total liabilities and shareholders' equity 217,619,001 223,315,875
The accompanying notes 1 to 39 form an integral part of these consolidated financial statements.
Page 1 of 54

RIYAD BANK
CONSOLIDATED STATEMENT OF INCOME For the years ended December 31, 2016 and 2015
2016 2015Note SAR'000 SAR'000
Special commission income 20 7,312,590 5,883,035 Special commission expense 20 2,011,561 703,258 Net special commission income 5,301,029 5,179,777
Fee and commission income, net 21 1,503,113 1,783,770 Exchange income, net 400,628 348,385 Trading income, net 14,398 33,700 Dividend income 48,882 60,970 Gains on non-trading investments, net 190,515 222,389 Other operating income 22 243,715 336,972 Total operating income, net 7,702,280 7,965,963
Salaries and employee-related expenses 23 1,596,375 1,613,354 Rent and premises-related expenses 328,095 299,585 Depreciation of property and equipment 9 288,790 275,774 Other general and administrative expenses 756,322 645,338 Impairment charge for credit losses, net 7 1,286,397 1,030,735 Impairment charge for investments, net 100,000 21,609 Other operating expenses 39,330 70,010 Total operating expenses, net 4,395,309 3,956,405
Net operating income 3,306,971 4,009,558
Share in earnings of associates, net 35,516 39,919 Net income for the year 3,342,487 4,049,477
Basic and diluted earnings per share (in SAR) 24 1.11 1.35
The accompanying notes 1 to 39 form an integral part of these consolidated financial statements.
Page 2 of 54

RIYAD BANK
CONSOLIDATED STATEMENT OF COMPREHENSIVE INCOMEFor the years ended December 31, 2016 and 2015
2016 2015SAR'000 SAR'000
Net income for the year 3,342,487 4,049,477
Net change in fair value (note 18) 309,784 (582,781)Net amounts transferred to consolidated statement of income (note 18) (74,322) (158,689)
Other comprehensive income for the year 235,462 (741,470)Total comprehensive income for the year 3,577,949 3,308,007
- Available for sale investments
The accompanying notes 1 to 39 form an integral part of these consolidated financial statements.
Other comprehensive income:Items that are or maybe reclassified back to consolidated statement of income in subsequent periods
Page 3 of 54

RIYAD BANK
CONSOLIDATED STATEMENT OF CHANGES IN SHAREHOLDERS' EQUITYFor the years ended December 31, 2016 and 2015
31 December 2016Balance at the beginning of the year 30,000,000 2,100,471 297,467 2,847,174 1,300,000 36,545,112 Net change in fair value of Available for sale investments - - 309,784 - - 309,784
Net amounts relating to Available for sale investments transferred to consolidated statement of income
- - (74,322) - - (74,322)
Net income - - - 3,342,487 - 3,342,487 Total comprehensive income - - 235,462 3,342,487 - 3,577,949 Final dividends - 2015 (note 25) - - - - (1,300,000) (1,300,000)Interim dividend - 2016 (note 25) - - - (1,050,000) - (1,050,000)Transfer to statutory reserve(note 17) - 835,622 - (835,622) - - Final proposed dividend - 2016(note 25) - - - (1,700,000) 1,700,000 - Balance at the end of the year 30,000,000 2,936,093 532,929 2,604,039 1,700,000 37,773,061
31 December 2015Balance at the beginning of the year 30,000,000 1,088,102 1,038,937 2,160,066 1,250,000 35,537,105 Net change in fair value of Available for sale investments - - (582,781) - - (582,781)
Net amounts relating to Available for sale investments transferred to consolidated statement of income
- - (158,689) - - (158,689)
Net income - - - 4,049,477 - 4,049,477 Total comprehensive income - - (741,470) 4,049,477 - 3,308,007 Final dividends - 2014 (note 25) - - - - (1,250,000) (1,250,000)Interim dividend - 2015 (note 25) - - - (1,050,000) - (1,050,000)
Transfer to statutory reserve (note 17) - 1,012,369 - (1,012,369) - -
Final proposed dividend - 2015(note 25) - - - (1,300,000) 1,300,000 -
Balance at the end of the year 30,000,000 2,100,471 297,467 2,847,174 1,300,000 36,545,112
The accompanying notes 1 to 39 form an integral part of these consolidated financial statements.
SAR'000Share capital
Statutory reserve
Retained earnings
Proposed dividends
TotalOther reserves
Page 4 of 54

RIYAD BANK
CONSOLIDATED STATEMENT OF CASH FLOWS
2016 2015SAR'000 SAR'000
3,342,487 4,049,477
(32,541) (80,938) Gains on non-trading investments, net (190,515) (222,389)Depreciation of property and equipment 288,790 275,774 Share in earnings of associates, net (35,516) (39,919)Impairment charge for investments, net 100,000 21,609 Impairment charge for credit losses, net 1,286,397 1,030,735
4,759,102 5,034,349
Statutory deposit with SAMA 4 636,006 (527,825)Due from banks and other financial institutions maturing after three months from date of acquisition (1,585,000) 187,577 Positive fair value of derivatives 8,244 221,573 Loans and advances 870,427 (12,277,215)Other real estate 13,394 132,391 Other assets (108,598) 636,653
Due to banks and other financial institutions 4,337,020 709,148 Negative fair value of derivatives (48,491) (183,712)Customer deposits (11,168,784) 3,043,508 Other liabilities (222,516) (11,492)
(2,509,196) (3,035,045)
Proceeds from sales and maturities of non-trading investments 22,491,578 28,340,798 Purchase of non-trading investments (22,505,924) (26,435,062)Purchase of property and equipment, net (256,438) (463,744)
(270,784) 1,441,992
Proceeds from issuance of debt securities in issue 14 - 4,002,367 Dividend and Zakat paid (2,179,112) (2,141,244)
(2,179,112) 1,861,123 (4,959,092) 268,070 21,041,852 20,773,782
26 16,082,760 21,041,852
7,134,963 5,792,142 1,812,369 729,931
235,462 (741,470)
The accompanying notes 1 to 39 form an integral part of these consolidated financial statements.
Note
Net changes in fair value and transfers to consolidated statement of income
Adjustments to reconcile net income for the year to net cash from (used in) operating activities:
For the years ended December 31, 2016 and 2015
Cash and cash equivalents at end of the year
Special commission received during the yearSpecial commission paid during the year
Supplemental non-cash information
OPERATING ACTIVITIES Net income for the year
Net (increase) decrease in operating assets:
Net (decrease) increase in cash and cash equivalents
Accretion of discounts and amortisation of premium, net on non-trading investments, net
Net increase (decrease) in operating liabilities:
Net cash (used in) from financing activities
INVESTING ACTIVITIESNet cash used in operating activities
FINANCING ACTIVITIESNet cash (used in) from investing activities
Cash and cash equivalents at beginning of the year
Page 5 of 54

RIYAD BANK
NOTES TO THE CONSOLIDATED FINANCIAL STATEMENTS
1.
2.
a)
b)
c )
d) Critical accounting judgements, estimates and assumptions
i ) Impairment for credit losses on loans and advances
The preparation of these consolidated financial statements in conformity with IFRS requires the management to use certain criticalaccounting judgements, estimates and assumptions that affect the reported amounts of assets and liabilities. It also requires management toexercise its judgement in the process of applying the Bank’s accounting policies. Such judgements, estimates and assumptions arecontinually evaluated and are based on historical experience and other factors, including obtaining professional advices and expectations offuture events that are believed to be reasonable under the circumstances. Significant areas where management has used estimates,assumptions or exercised judgements are as follows:
The Bank reviews its loan portfolios to assess specific and collective impairment on a quarterly basis. In determining whether animpairment loss should be recorded, the Bank makes judgements as to whether there is any observable data indicating that there is ameasurable decrease in the estimated future cash flows. This evidence may include observable data indicating that there has been anadverse change in the payment status of borrowers in a group. Management uses estimates based on historical loss experience for loanswith credit risk characteristics and objective evidence of impairment similar to those in the portfolio, when estimating its cash flows. Themethodology and assumptions used for estimating both the amount and the timing of future cash flows are reviewed regularly to reduceany differences between loss estimates and actual loss experience.
These consolidated financial statements are presented in Saudi Arabian Riyals (SAR), which is the Bank’s functional currency. Except asindicated, financial information presented in SAR has been rounded off to the nearest thousand Saudi Arabian Riyals.
Statement of compliance
These consolidated financial statements are prepared under the historical cost convention except for the measurement at fair value ofderivatives and available for sale investments. In addition, financial assets or liabilities that are hedged in a fair value hedging relationship,and otherwise carried at cost, are carried at fair value to the extent of the risk being hedged.
Basis of measurement and presentation
Functional and presentation currency
These consolidated financial statements are prepared in accordance with the Accounting Standards for Commercial Banks promulgated bythe Saudi Arabian Monetary Authority (SAMA) and International Financial Reporting Standards (IFRS) as issued by the InternationalAccounting Standards Board (IASB). The Bank also prepares its consolidated financial statements to comply with the Banking Control Law,the provisions of Regulations for Companies in the Kingdom of Saudi Arabia and the Bank's By-Laws.
For the years ended December 31, 2016 and 2015
GENERAL
BASIS OF PREPARATION
Riyad Bank (The "Bank") is a Saudi Joint Stock Company incorporated in the Kingdom of Saudi Arabia, formed pursuant to the Royal Decree andthe Council of Ministers’ Resolution No. 91 dated 1 Jumad Al-Awal 1377H (corresponding to November 23, 1957G). The Bank operates undercommercial registration No. 1010001054 dated 25 Rabi Al-Thani 1377H (corresponding to November 18, 1957G) through its 337 branches (2015:334 branches) in the Kingdom of Saudi Arabia, a branch in London-United Kingdom, an agency in Houston-United States, and a representativeoffice in Singapore. The number of the Group's employees stood at 6,337 as at December 31, 2016( 2015: 6,167). The Bank’s Head Office islocated at the following address:Riyad BankKing Abdulaziz Road – Al-Murabba DistrictP.O. Box 22622Riyadh 11416 Kingdom of Saudi Arabia
The objective of the Bank is to provide a full range of banking and investment services. The Bank also provides to its customers Islamic (non-special commission based) banking products which are approved and supervised by an independent Shariah Board established by the Bank. The consolidated financial statements comprise the financial statements of Riyad Bank and its wholly owned subsidiaries, incorporated in theKingdom of Saudi Arabia; a) Riyad Capital (engaged in investment services and asset management activities related to dealing, managing,arranging, advising and custody of securities regulated by the Capital Market Authority), b) Ithra Al-Riyad Real Estate Company (with the objectiveto hold, manage, sell and purchase real estate assets for owners or third parties for financing activities); and c) Riyad Company for InsuranceAgency (which acts as an agent for selling insurance products owned and managed by another principal insurance company), d) Curzon StreetProperties Limited and are collectively referred to as “the Group”.
Page 6 of 54

RIYAD BANK
NOTES TO THE CONSOLIDATED FINANCIAL STATEMENTS
2.
d) Critical accounting judgements, estimates and assumptions (continued)ii ) Fair value measurement
iii ) Impairment of available for sale investments
iv ) Classification of held-to-maturity investments
v ) Determination of control over investees
The Bank exercises judgement in considering impairment on the Available for sale equity investments. This includes determination of asignificant or prolonged decline in the fair value below its cost. In making this judgement, the Bank evaluates among other factors, thenormal volatility in share price. In addition, the Bank considers impairment to be appropriate when there is objective evidence ofdeterioration in the financial health of the investee, industry and sector performance, changes in technology and operational and financingcash flows.The Bank reviews its debt securities classified as available for sale at each reporting date to assess whether they are impaired. Thisrequires similar judgement as applied to individual assessment of loans and advances.
Special Purpose Entities (SPEs)The Bank is party to certain SPEs, primarily to facilitate Shariah compliant financing arrangements. The exposures to these entities areincluded in the Bank's loans and advances portfolio.
Investment fundsThe Group acts as Fund Manager to a number of investment funds. Determining whether the Group controls such an investment fundusually focuses on the assessment of the aggregate economic interests of the Group in the Fund (comprising any carried interests andexpected management fees) and the investor's rights to remove the Fund Manager. As a result the Group has concluded that it acts as anagent for the investors in all cases, and therefore has not consolidated these funds.
The Group uses valuation techniques that are appropriate in the circumstances and for which sufficient data are available to measure fairvalue, maximising the use of relevant observable inputs and minimising the use of unobservable inputs.
The Bank follows the guidance of IAS 39 on classifying non-derivative financial assets with fixed or determinable payments and fixedmaturity as held-to-maturity. In making this judgement, the Bank evaluates its intention and ability to hold such investments to maturity.
For the years ended December 31, 2016 and 2015
BASIS OF PREPARATION (continued)
The principal or the most advantageous market must be accessible to by the Group. The fair value of an asset or a liability is measured using the assumptions, that market participants would use, when pricing the asset orliability, assuming that market participants act in their economic best interest. A fair value measurement of a non-financial asset takes intoaccount a market participant's ability to generate economic benefits by using the asset in its highest and best use or by selling it to anothermarket participant that would use the asset in its highest and best use.
Fair value is the price that would be received to sell an asset or paid to transfer a liability in an orderly transaction between marketparticipants at the measurement date. The fair value measurement is based on the presumption that the transaction to sell the asset ortransfer the liability takes place either:- In the principal market for the asset or liability, or- In the absence of a principal market, in the most advantageous market for the asset or liability
For assets and liabilities that are recognised in the financial statements on a recurring basis, the Group determines whether transfers haveoccurred between Levels in the hierarchy by re-assessing categorisation (based on the lowest level input that is significant to the fair valuemeasurement as a whole) at the end of each reporting period.
All assets and liabilities for which fair value is measured or disclosed in the consolidated financial statements are categorised within the fairvalue hierarchy, described as follows, based on the lowest level input that is significant to the fair value measurement as a whole:- Level 1: Quoted (unadjusted) market prices in active markets for identical assets or liabilities- Level 2: Valuation techniques for which the lowest level input that is significant to the fair value measurement is directly or indirectlyobservable- Level 3: Valuation techniques for which the lowest level input that is significant to the fair value measurement is unobservable
Page 7 of 54

RIYAD BANK
3. SUMMARY OF SIGNIFICANT ACCOUNTING POLICIES (continued)
a) Changes in accounting policies
i)
i)
ii)
iii)
NOTES TO THE CONSOLIDATED FINANCIAL STATEMENTS - continuedFor the years ended December 31, 2016 and 2015
The accounting policies used in the preparation of these annual consolidated financial statements are consistent with those used in thepreparation of the annual consolidated financial statements for the year ended December 31, 2015 except for the adoption of thefollowing new standards and other amendments to existing standards and a new interpretation mentioned below which has had no oran insignificant financial impact on the annual consolidated financial statements of the Group.
The significant accounting policies adopted in the preparation of these consolidated financial statements are set out below. Except for the change in accounting policies resulting from new and amended IFRS and IFRIC guidance, as detailed in note 3 (a) below,the accounting policies adopted in the preparation of these consolidated financial statements are consistent with those used in thepreparation of the annual consolidated financial statements for the year ended December 31, 2015.
- New standards- IFRS 14 – “Regulatory Deferral Accounts”, applicable for the annual periods beginning on or after 1 January 2016, allows anentity, whose activities are subject to rate regulation, to continue applying most of its existing accounting policies for regulatorydeferral account balances upon its first time adoption of IFRS. The standard does not apply to existing IFRS preparers. Also, anentity whose current GAAP does not allow the recognition of rate-regulated assets and liabilities, or that has not adopted suchpolicy under its current GAAP, would not be allowed to recognise them on first-time application of IFRS.
- Amendments to existing standards- Amendments to IFRS 10 – “Consolidated Financial Statements”, IFRS 12 – “Disclosure of Interests in Other Entities” and IAS 28– “Investments in Associates”, applicable for the annual periods beginning on or after 1 January 2016, address three issues thathave arisen in applying the investment entities exception under IFRS 10. The amendments to IFRS 10 clarify that the exemptionfrom presenting consolidated financial statements applies to a parent entity that is a subsidiary of an investment entity, when theinvestment entity measures its subsidiaries at fair value. Furthermore, only a subsidiary of an investment entity that is not aninvestment entity itself and that provides support services to the investment entity is consolidated. All other subsidiaries of aninvestment entity are measured at fair value. The amendments to IAS 28 allow the investor, when applying the equity method, toretain the fair value measurement applied by the investment entity associate or joint venture to its interests in subsidiaries.
- Amendments to IFRS 11 – “Joint Arrangements”, applicable for the annual periods beginning on or after 1 January 2016, requirean entity acquiring an interest in a joint operation, in which the activity of the joint operation constitutes a business, to apply, to theextent of its share, all of the principles in IFRS 3 – “Business Combinations” and other IFRSs that do not conflict with therequirements of IFRS 11 Joint Arrangements. Furthermore, entities are required to disclose the information required by IFRS 3and other IFRSs for business combinations. The amendments also apply to an entity on the formation of a joint operation if, andonly if, an existing business is contributed by one of the parties to the joint operation on its formation. Furthermore, theamendments clarify that, for the acquisition of an additional interest in a joint operation in which the activity of the joint operationconstitutes a business, previously held interests in the joint operation must not be remeasured if the joint operator retains jointcontrol.- Amendments to IAS 1 – “Presentation of Financial Statements”, applicable for the annual periods beginning on or after 1 January2016, clarify, existing IAS 1 requirements in relation to;- The materiality requirements in IAS 1- That specific line items in the statement(s) of profit or loss and other comprehensive income (“OCI”) and the statement offinancial position may be disaggregated- That entities have flexibility as to the order in which they present the notes to financial statements- That the share of OCI of associates and joint ventures accounted for using the equity method must be presented in aggregate asa single line item, and classified between those items that will or will not be subsequently reclassified to profit or loss.- The amendments further clarify the requirements that apply when additional subtotals are presented in the statement of financialposition and the statement(s) of profit or loss and OCI.
Page 8 of 54

RIYAD BANK
3. SUMMARY OF SIGNIFICANT ACCOUNTING POLICIES (continued)a) Changes in accounting policies
iv)
v)
vi)
i)
ii)
iii) IAS 19 – “Employee Benefits” – amendment clarifies that market depth of high quality corporate bonds is assessed based on the currency inwhich the obligation is denominated, rather than the country where the obligation is located. When there is no deep market for high qualitycorporate bonds in that currency, government bond rates must be used.
- Amendments to IAS 16 – “Property, Plant and Equipment” and IAS 38 – “Intangible Assets”, applicable for the annual periods beginning onor after 1 January 2016, restricts the use of ratio of revenue generated to total revenue expected to be generated to depreciate property,plant and equipment and may only be used in very limited circumstances to amortise intangible assets.- Amendments to IAS 16 – “Property, Plant and Equipment” , applicable for the annual periods beginning on or after 1 January 2016, changethe scope of IAS 16 to include biological assets that meet the definition of bearer plants.
NOTES TO THE CONSOLIDATED FINANCIAL STATEMENTS - continuedFor the years ended December 31, 2016 and 2015
- Amendments to IAS 27 – “Separate Financial Statements”, applicable for the annual periods beginning on or after 1 January 2016, allowsan entity to use the equity method as described in IAS 28 to account for its investments in subsidiaries, joint ventures and associates in itsseparate financial statements
- Annual improvements to IFRS 2012-2014 cycle These are applicable for annual periods beginning on or after 1 January 2016. A summary of the amendments is as follows:
IFRS 5 – “Non-current Assets Held for Sale and Discontinued Operations”, amended to clarify that changing from one disposal method tothe other would not be considered a new plan of disposal, rather it is a continuation of the original plan. There is, therefore, no interruption ofthe application of the requirements in IFRS 5.IFRS 7 – “Financial Instruments: Disclosures” has been amended to clarify that a servicing contract that includes a fee can constitutecontinuing involvement in a financial asset. The nature of the fee and the arrangement should be assessed in order to consider whether thedisclosures are required under IFRS 7 and the assessment must be done retrospectively. IFRS 7 has been further amended to clarify thatthe offsetting disclosure requirements do not apply to condensed interim financial statements, unless such disclosures provide a significantupdate to the information reported in the most recent annual report.
Page 9 of 54

RIYAD BANK
3. SUMMARY OF SIGNIFICANT ACCOUNTING POLICIES (continued)b) Basis of consolidation
c) Settlement date accounting All regular way purchases and sales of financial assets are recognised and derecognised on the settlement date, i.e. the date the asset isdelivered to the counter party. The Bank accounts for any change in fair value between the trade and the settlement date in the same way as itaccounts for the acquired assets. Regular way purchases or sales are purchases or sales of financial instruments that require delivery of assetswithin the time frame generally established by regulation or convention in the market place.
These annual consolidated financial statements comprise the financial statements of Riyad Bank and its subsidiaries drawn up to 31 Decembereach year. The financial statements of the subsidiaries are prepared for the same reporting year as that of the Bank, using consistentaccounting policies.
Generally, there is a presumption that a majority of voting rights results in control. However, under individual circumstances, the Bank may stillexercise control with less than 50% shareholding or may not be able to exercise control even with ownership over 50% of an entity’s shares.When assessing whether it has power over an investee and therefore controls the variability of its returns, the Bank considers all relevant factsand circumstances, including:- The purpose and design of the investee- The relevant activities and how decisions about those activities are made and whether the Bank can direct those activities- Contractual arrangements such as call rights, put rights and liquidation rights- Whether the Bank is exposed, or has rights, to variable returns from its involvement with the investee, and has the power to affect the variability of such returnsA change in the ownership interest of a subsidiary, without loss of control, is accounted for as an equity transaction. If the Group loses controlover a subsidiary, it derecognises the related assets (including goodwill), liabilities, non-controlling interest (NCI) and other components ofequity, while any resultant gain or loss is recognised in profit or loss. Any investment retained is recognised at fair value at the date of loss ofcontrol.
NOTES TO THE CONSOLIDATED FINANCIAL STATEMENTS - continuedFor the years ended December 31, 2016 and 2015
Subsidiaries are investees controlled by the Group. The Group controls an investee when it is exposed to, or has rights to, variable returns fromits involvement with the investee and has the ability to affect those returns through its power over the investee. The financial statements ofsubsidiaries are included in the consolidated financial statements from the date that control commences until the date that control ceases. Balances between the Bank and its subsidiaries, and any income and expenses arising from intra-group transactions are eliminated inpreparing the consolidated financial statements.
The Bank is party to certain special purpose entities (SPEs), primarily for the purpose of facilitation of certain Shariah compliant financingarrangements. The Bank concluded that these entities cannot be consolidated to its financial statements as it could not establish control overthese SPEs.
Page 10 of 54

RIYAD BANK
3. SUMMARY OF SIGNIFICANT ACCOUNTING POLICIES (continued)
d) Investment in associates
e) Derivative financial instruments and hedge accounting
The Group designates certain derivatives as hedging instruments in qualifying hedging relationships. For the purpose of hedge accounting, hedges are classified into two categories: (a) fair value hedges which hedge the exposure to changes inthe fair value of a recognised asset or liability or an unrecognised firm commitment or an identified portion of such an asset, liability or firmcommitment, that is attributable to a particular risk and could affect the reported net gain or loss; and (b) cash flow hedges which hedgeexposure to variability in cash flows that is either attributable to a particular risk associated with a recognised asset or liability, or to a highlyprobable forecasted transaction that will affect the reported net gain or loss.
(ii) Hedge accounting
NOTES TO THE CONSOLIDATED FINANCIAL STATEMENTS - continuedFor the years ended December 31, 2016 and 2015
Any changes in the fair value of derivatives that are held for trading purposes are taken directly to the consolidated statement of income anddisclosed in trading income/ loss. Derivatives held for trading also include those derivatives, which do not qualify for hedge accountingdescribed below.
Derivative financial instruments, including foreign exchange contracts, special commission rate swaps and currency options (both written andpurchased), are initially recognised at fair value on the date on which the derivative contract is entered into and are subsequently re-measuredat fair value in the consolidated statement of financial position with transaction costs recognised in the consolidated statement of income. Allderivatives are carried at their fair value as assets where the fair value is positive and as liabilities where the fair value is negative. Fair valuesare obtained by reference to quoted market prices, discounted cash flow models and pricing models, as appropriate. The treatment of changesin their fair value depends on their classification into the following categories:(i) Derivatives held for trading
An associate is an entity, including an unincorporated entity such as a partnership, over which the investor has significant influence and that isneither a subsidiary nor an interest in a joint venture. Significant influence is the power to participate in the financial and operating policydecisions of the investee, but is not control or joint control over those policies. Investments in associates are accounted for under the equitymethod of accounting. The equity method is a method of accounting whereby the investment is initially recognised at cost and subsequentlyadjusted for the post-acquisition change in the investor’s share of net assets of the investee. The profit or loss of the investor includes theinvestor’s share of the profit or loss of the investee. Distribution received from the investee reduces the carrying amount of the investment.
In order to qualify for hedge accounting, the hedge should be expected to be highly effective, i.e. the changes in fair value or cash flows of thehedging instrument should effectively offset corresponding changes in the hedged item, and should be reliably measurable. At the inception ofthe hedge, the risk management objective and strategy is documented, including the identification of the hedging instrument, the relatedhedged item, the nature of risk being hedged, and how the Bank will assess the effectiveness of the hedging relationship. Subsequently, thehedge is required to be assessed and determined to be an effective hedge on an ongoing basis.
When a derivative is designated as the hedging instrument in a hedge of the change in fair value of a recognised asset or liability or a firmcommitment that could affect statement of income, any gain or loss from re-measuring the hedging instruments to fair value is recognisedimmediately in the consolidated statement of income. The related portion of the hedged item is adjusted against the carrying amount of thehedged item and recognised in the consolidated statement of income. For hedged items measured at amortised cost, where the fair valuehedge of a special commission bearing financial instrument ceases to meet the criteria for hedge accounting or is sold, exercised or terminated,the difference between the carrying value of the hedged item on termination and the face value is amortised over the remaining term of theoriginal hedge using the effective yield basis. If the hedged item is derecognised, the unamortised fair value adjustment is recognisedimmediately in the consolidated statement of income.
a) Fair value hedges
Page 11 of 54

RIYAD BANK
3. SUMMARY OF SIGNIFICANT ACCOUNTING POLICIES (continued)e) Derivative financial instruments and hedge accounting (continued)
f) Foreign currencies
g )
b) Cash flow hedges
NOTES TO THE CONSOLIDATED FINANCIAL STATEMENTS - continuedFor the years ended December 31, 2016 and 2015
Income and expenses are not offset in the consolidated statement of income unless required or permitted by an accounting standard orinterpretation, and as specifically disclosed in the accounting policies of the Group.
When a derivative is designated as the hedging instrument in a hedge of a variability of cash flows attributable to a particular risk associatedwith a recognised asset or a liability or a highly probable forecasted transaction that could affect statement of income, the portion of the gainor loss on the hedging instrument that is determined to be an effective portion is recognised directly in other comprehensive income and theineffective portion, if any, is immediately recognised in the consolidated statement of income. For cash flow hedges affecting futuretransactions, the gains or losses recognised in other reserves, are transferred to the consolidated statement of income in the same period inwhich the hedged transaction affects the consolidated statement of income. Where the hedged forecasted transaction results in therecognition of a non- financial asset or a non-financial liability, then at the time such asset or liability is recognised the associated gains orlosses that had previously been recognised directly in other comprehensive income are included in the initial measurement of the acquisitioncost or other carrying amount of such asset or liability.Hedge accounting is discontinued when the hedging instrument expires or is sold, terminated or exercised, or no longer qualifies for hedgeaccounting, or the forecast transaction is no longer expected to occur or the Bank revokes the designation. At that point of time, anycumulative gain or loss on the cash flow hedging instrument that was recognised in other comprehensive income is retained until theforecasted transaction occurs. Where the hedged forecasted transaction is no longer expected to occur, the net cumulative gain or lossrecognised in other comprehensive income is transferred to the consolidated statement of income for the period.
Non-monetary assets and liabilities that are measured in terms of historical cost in a foreign currency are translated using the spot exchangerates as at the dates of the initial transactions. The assets and liabilities of overseas branch are translated at the spot exchange rate at the reporting date. The income and expenses ofoverseas branch are translated at the average exchange rates for the year. All exchange differences, if significant, are recognised in othercomprehensive income. These differences are transferred to consolidated statement of income at the time of disposal of foreign operations.
Offsetting financial instrumentsFinancial assets and liabilities are offset and reported net in the consolidated statement of financial position when the entity has a legalcurrently enforceable right to set off the recognised amounts and when the Group intends to settle on a net basis, or to realise the asset andsettle the liability simultaneously.
The Group’s consolidated financial statements are presented in Saudi Arabian Riyals, which is also the Bank’s functional currency.Transactions in foreign currencies are translated into Saudi Arabian Riyals at spot exchange rates prevailing on the transaction dates.Monetary assets and liabilities at the year-end, denominated in foreign currencies, are translated into Saudi Arabian Riyals at the exchangerates prevailing at the reporting date. Foreign exchange gains or losses on translation of monetary assets and liabilities denominated inforeign currencies are recognised in the consolidated statement of income. Non-monetary items measured at fair value in a foreign currencyare translated using the spot exchange rates at the date when the fair value is determined. Translation gains or losses on non-monetaryitems carried at fair value are included as part of the fair value adjustment either in the consolidated statement of income or in equity,depending on the underlying financial asset.
Page 12 of 54

RIYAD BANK
3h )
i)
ii)
iii)
i )
OthersDividend income is recognised when the right to receive payment is established. Exchange income/ loss are recognised when earned/ incurred.Results arising from trading activities include gains and losses from changes in fair value and related special commission income or expense forfinancial assets and financial liabilities held for trading. Sale and repurchase agreementsAssets sold with a simultaneous commitment to repurchase at a specified future date (repos) continue to be recognised in the consolidatedstatement of financial position as the Bank retains substantially all the risks and rewards of ownership and are measured in accordance withrelated accounting policies for investments held as FVIS, Available for sale, Held to maturity and Other investments held at amortised cost. Thecounterparty liability for amounts received under these agreements is included in "Due to banks and other financial institutions" or "Customerdeposits", as appropriate. The difference between sale and repurchase prices is treated as special commission expense and is accrued over thelife of the repo agreement on an effective special commission rate basis. Assets purchased with a corresponding commitment to resell at aspecified future date (reverse repos), are not recognised in the consolidated statement of financial position, as the Bank does not obtain controlover the assets.Amounts paid under these agreements are included in "Cash and balances with SAMA" or "Due from banks and other financial institutions" asappropriate. The difference between purchase and resale prices is treated as special commission income and accrued over the life of thereverse repo agreement on an effective yield basis.
Fee and commissions are recognised when the service has been provided. Loan commitment fees for loans that are likely to be drawn down are deferred, together with the related direct cost, and are recognised as an adjustment to the effective yield on the loan. When a loan commitmentis not expected to result in the draw-down of a loan, loan commitment fees are recognised on a straight-line basis over the commitment period.Portfolio and other management advisory and service fees are recognised based on the applicable service contracts, usually on a time-proportionate basis. Fee received on asset management, wealth management, financial planning, custody services and other similar servicesthat are provided over an extended period of time, are recognised over the period when the service is being provided.
If the recorded value of a financial asset or a group of similar financial assets has been reduced due to an impairment loss, special commissionincome continues to be recognised using the original effective yield applied to the new carrying amount.The calculation of the effective yield includes all fees and points paid or received, transaction costs, and discounts or premiums that are anintegral part of the effective special commission rate. Transaction costs are incremental costs that are directly attributable to the acquisition,issue or disposal of financial asset or liability.
The carrying amount of the financial asset or financial liability is adjusted if the Group revises its estimates of payments or receipts. Theadjusted carrying amount is calculated based on the original effective special commission rate and the change in carrying amount is recorded asspecial commission income or expense.
Fee and commission income
Special commission income and expense for all special commission bearing financial instruments, except for those classified as held for tradingor designated at fair value through income statement (FVIS), are recognised in the consolidated statement of income using the effective yieldbasis. The effective yield is the rate that exactly discounts the estimated future cash payments and receipts through the expected life of thefinancial asset or liability (or, where appropriate, a shorter period) to the carrying amount of the financial asset or liability. When calculating theeffective special commission rate, the Bank estimates future cash flows considering all contractual terms of the financial instrument but notfuture credit losses.
SUMMARY OF SIGNIFICANT ACCOUNTING POLICIES (continued)
Special commission income and expenseRevenue recognition
NOTES TO THE CONSOLIDATED FINANCIAL STATEMENTS - continuedFor the years ended December 31, 2016 and 2015
Page 13 of 54

3
j )
i) Held as FVIS
ii) Available for sale
iii) Other investments held at amortised costInvestment securities with fixed or determinable payments that are not quoted in an active market are classified as “Other investments heldat amortised cost”. Such investments whose fair values have not been hedged are stated at amortised cost using effective yield basis, lessprovision for impairment. Any gain or loss is recognised in the consolidated statement of income when the investment is derecognised orimpaired.
NOTES TO THE CONSOLIDATED FINANCIAL STATEMENTS - continued
For securities traded in organised financial markets, fair value is determined by reference to exchange quoted market bid prices at the close ofbusiness on the reporting date. Fair value of managed assets and investments in mutual funds are determined by reference to declared netasset values.
All investment securities are initially recognised at fair value, including incremental direct transaction cost except for investments held as FairValue through Income Statement (FVIS) and are subsequently accounted for depending on their classification as either held to maturity, FVIS,Available for sale or other investments held at amortised cost. Premiums are amortised and discounts accreted using the effective yield basisand are taken to special commission income.
SUMMARY OF SIGNIFICANT ACCOUNTING POLICIES (continued)
Investments
Investments in this category are classified at initial recognition as either investment held for trading or those upon initial recognitiondesignated as FVIS. Investments classified as trading are acquired principally for the purpose of selling or repurchasing in short term.
Available for sale investments are non-derivative financial instruments and include equity and debt securities that are either designated asAvailable for sale or not classified as (a) loans and receivables, (b) held-to-maturity investments or (c) financial assets at fair value throughprofit or loss. Available for sale investments are those equity and debt securities intended to be held for an unspecified period of time, whichmay be sold in response to need for liquidity or changes in special commission rates, exchange rates or equity prices. Investments, whichare classified as “Available for sale”, are subsequently measured at fair value. For an Available for sale investment where the fair value hasnot been hedged, any gain or loss arising from a change in its fair value is recognised directly in other comprehensive income. Onderecognition, any cumulative gain or loss previously recognised in other comprehensive income is included in the consolidated statement ofincome.
After initial recognition, investments at FVIS are measured at fair value and any change in the fair value is recognised in the consolidatedstatement of income for the period in which it arises. Transaction costs, if any, are not added to the fair value measurement at initialrecognition of FVIS investments. Special commission income and dividend income on investment securities held as FVIS are reflected astrading income.
Following recognition, subsequent transfers between the various classes of investments are not ordinarily permissible except in accordance with amendments in IAS 39 (refer note 6). The subsequent period-end reporting values for each class of investment are determined on the basis asset out in the following paragraphs:
For the years ended December 31, 2016 and 2015
For securities where there is no quoted market price, a reasonable estimate of the fair value is determined by reference to the current marketvalue of another instrument which is substantially the same, or is based on the expected cash flows of the security. Where the fair values cannot be derived from active markets, they are determined using a variety of valuation techniques that include the use of mathematical models ifpossible. The input to these models is taken from observable markets where possible, but where this is not feasible, a degree of judgement isrequired in establishing fair values.
Page 14 of 54
RIYAD BANK
3j )
iv) Held to maturity
k) Loans and advances
l) Impairment of financial assets
If, in a subsequent period, the amount of the impairment loss decreases and the decrease can be related objectively to an event occurring afterthe impairment was recognised (such as an improvement in the debtor’s credit rating), the previously recognised impairment loss is reversed byadjusting the allowance account. The amount of the reversal is recognised in the consolidated statement of income in impairment charge forcredit losses.
When a financial asset is uncollectible, it is written off against the related provision for impairment either directly by a charge to consolidatedstatement of income or through impairment allowance account. Financial assets are written off only in circumstances where effectively allpossible means of recovery have been exhausted, and the amount of the loss has been determined.
Loans and advances are non-derivative financial assets originated or acquired by the Bank with fixed or determinable payments. Loans andadvances are recognised when cash is advanced to borrowers. They are derecognised when either borrower repays their obligations, or theloans are sold or written off, or substantially all the risks and rewards of ownership are transferred.
Objective evidence that financial assets are impaired can include default or delinquency by a borrower, restructuring of a loan or advance by thegroup on the terms that the Bank would not otherwise consider, indications that a borrower or issuer will enter bankruptcy, the disappearance ofactive market for a security or other observable data relating to a group of assets such as adverse changes in the payment status of borrowersor issuers.It may also include instances where Bank considers that the obligor is unlikely to pay its credit obligations to the Bank, in full, without recourseby the Bank to actions such as realizing the security, if held.
An assessment is made at each reporting date to determine whether there is objective evidence that a financial asset or group of financialassets carried at amortised cost may be impaired. If such evidence exists, the estimated recoverable amount of that asset is determined andany impairment loss, based on the net present value of future anticipated cash flows, is recognised for changes in its carrying amounts.
Once a financial asset has been written down to its estimated recoverable amount, special commission income is thereafter recognised basedon the rate of special commission that was used to discount the future cash flows for the purpose of measuring the recoverable amount.
NOTES TO THE CONSOLIDATED FINANCIAL STATEMENTS - continued
All loans and advances are initially measured at fair value, including directly attributable transaction costs associated with the loans andadvances. Loans and advances originated or acquired by the Bank that are not quoted in an active market, are stated at amortised cost. Forpresentation purposes, allowance for credit losses is deducted from loans and advances.
Investments classified as held to maturity cannot ordinarily be sold or reclassified without impacting the Bank’s ability to use this classificationand cannot be designated as a hedged item with respect to commission rate or prepayment risk, reflecting the longer-term nature of theseinvestments.
Investments having fixed or determinable payments and fixed maturity and that the Bank has the positive intention and ability to hold tomaturity, are classified as held to maturity. Held to maturity investments are subsequently measured at amortised cost, less provision forimpairment in value. Amortised cost is calculated by taking into account any discount or premium on acquisition using an effective yieldbasis. Any gain or loss on such investments is recognised in the consolidated statement of income when the investment is derecognised orimpaired.
Investments (continued)
For the years ended December 31, 2016 and 2015
SUMMARY OF SIGNIFICANT ACCOUNTING POLICIES (continued)
Loans whose terms have been renegotiated are no longer considered to be past due but are treated as new loans. Restructuring policies andpractices are based on indicators or criteria, which indicate that payments, will most likely continue. The loans continue to be subject to anindividual or collective impairment assessment, calculated using the loan’s original effective yield rate. Consumer loans are charged off whenthey become 180 days past due except in the case of secured consumer loans. With effect from April 1, 2015, the Bank individually assessesconsumer mortgage loans for impairment when they become 180 days past due and provision is made.
Page 15 of 54

RIYAD BANK
3.
l ) Impairment of financial assets (continued)
i) Impairment of financial assets held at amortised cost
ii) Impairment of Available for sale financial assets
m)
NOTES TO THE CONSOLIDATED FINANCIAL STATEMENTS - continued
In case of financial instruments held at amortised cost or held to maturity, the Bank assesses individually whether there is objective evidenceof impairment based on same criteria as explained above.A specific provision for credit losses due to impairment of a loan or any other financial asset held at amortised cost is established if there isobjective evidence that the Bank will not be able to collect all amounts due. The amount of the specific provision is the difference betweenthe carrying amount and the estimated recoverable amount. The estimated recoverable amount is the present value of expected cash flows,including amounts estimated to be recoverable from guarantees and collateral, discounted based on the original effective yield rate.
Loans and advances are generally renegotiated either as part of an ongoing customer relationship or in response to an adverse change in thecircumstances of the borrower. In the latter case, renegotiation can result in an extension of the due date of payment or repayment plans underwhich the Bank offers a revised rate of commission to genuinely distressed borrowers. This results in the asset continuing to be overdue andindividually impaired as the renegotiated payments of commission and principal do not recover the original carrying amount of the loan. In othercases, renegotiation lead to a new agreement, this is treated as a new loan. Restructuring policies and practices are based on indicators orcriteria which, indicate that payment will most likely continue. The loans continue to be subject to an individual or collective impairmentassessment, calculated using the loan’s original effective yield rate.
Subsequent to initial recognition, any subsequent write down to fair value, less costs to sell, is charged to the consolidated statement of income.Any subsequent gain in the fair value less costs to sell of these assets to the extent this does not exceed the cumulative write down isrecognised as income together with any gain/ loss on disposal.
SUMMARY OF SIGNIFICANT ACCOUNTING POLICIES (continued)
Other real estate
For the years ended December 31, 2016 and 2015
The Bank also considers evidence of impairment at a collective assets level. The collective provision is based on deterioration in the internalgrading or external credit ratings, allocated to the borrower or group of borrowers, the current economic climate in which the borrowersoperate and the experience and historical default patterns that are embedded in the components of the credit portfolio.
For equity investments held as Available for sale, a significant or prolonged decline in fair value below its cost represents objective evidenceof impairment. The impairment loss cannot be reversed through consolidated statement of income as long as the asset continues to berecognised i.e. any increase in fair value after impairment has been recorded can only be recognised in equity. On derecognition, anycumulative gain or loss previously recognised in shareholders’ equity is included in the consolidated statement of income for the year.
In the case of debt instruments classified as Available for sale, the Bank assesses individually whether there is objective evidence ofimpairment based on the same criteria as explained above. However, the amount recorded for impairment is the cumulative loss measuredas the difference between the amortised cost and the current fair value, less any impairment loss on that investment previously recognised inthe consolidated statement of income.
The Bank, in the ordinary course of business, acquires certain real estate against settlement of due loans and advances. Such real estateproperties are considered as assets held for sale and are initially stated at the lower of net realisable value of due loans and advances or thecurrent fair value of the related properties, less any costs to sell, if material. Rental income from other real estate is recognised in theconsolidated statement of income. No depreciation is charged on such real estate.
If, in a subsequent period, the fair value of a debt instrument increases and the increase can be objectively related to credit event occurringafter the impairment loss was recognised in the consolidated statement of income, the impairment loss is reversed through the consolidatedstatement of income.
Page 16 of 54

RIYAD BANK
3.
n )
o )
p )
q )
r )
s )
Financial liabilities in an effective fair value hedge relationship are adjusted for fair value changes to the extent of the risk being hedged. Theresultant gain or loss is recognised in the consolidated statement of income. For financial liabilities carried at amortised cost, any gain or loss isrecognised in the consolidated statement of income when derecognised.
Subsequent expenditure is capitalized only when it is probable that the future economic benefits of the expenditure will flow to the Group.Ongoing repairs and maintenance are expensed as incurred. The assets’ residual values and useful lives are reviewed, and adjusted ifappropriate, at each reporting date. All assets are reviewed for impairment whenever events or changes in circumstances indicate that thecarrying amount may not be recoverable. Any carrying amount is written down immediately to its recoverable amount if the asset’s carryingamount is greater than its estimated recoverable amount. Gains and losses on disposals are determined by comparing proceeds with carryingamount and are included in consolidated statement of income.
Software programs and automation projects Motor vehicles
Property and equipment are stated at cost and presented net of accumulated depreciation. Freehold land is not depreciated. The cost of otherproperty and equipment is depreciated using the straight-line method over the estimated useful lives of the assets as follows:
Improvements and decoration of premises Furniture, fixtures and equipment
5 years3 to 5 years
33 yearsover the lower of the lease period or 5 years5 to 20 years
Computer hardware
NOTES TO THE CONSOLIDATED FINANCIAL STATEMENTS - continued
Leases entered into by the Group as a lessee, are operating leases. Payments made under operating leases are charged to the consolidatedstatement of income on a straight-line basis over the period of the lease. When an operating lease is terminated before the lease period hasexpired, any payment required to be made to the lessor by way of penalty is recognised as an expense in the period in which termination takesplace.
SUMMARY OF SIGNIFICANT ACCOUNTING POLICIES (continued)
Accounting for leases
For the years ended December 31, 2016 and 2015
ProvisionsProvisions are recognised when a reliable estimate can be made by the Bank for a present legal or constructive obligation as a result of pastevents and it is more likely than not that an outflow of resources will be required to settle the obligation.
Financial liabilities
Property and equipment
4 years
Guarantee contractsIn ordinary course of business, the Bank gives financial guarantees, consisting of letters of credit, guarantees and acceptances. Financialguarantees are initially recognised in the consolidated financial statements at fair value in other liabilities, being the value of the premiumreceived. Subsequent to the initial recognition, the Bank's liability under each guarantee is measured at the higher of the amortised premiumand the best estimate of expenditure required to settle any financial obligations arising as a result of guarantees. Any increase in the liabilityrelating to the financial guarantee is taken to the consolidated statement of income in 'impairment charge for credit losses'. The premiumreceived is recognised in the consolidated statement of income in 'Fee and commission income, net' on a straight line basis over the life of theguarantee.
All money market deposits, customer deposits and debt securities in issue are initially recognised at fair value less transaction costs.Subsequently, all special commission-bearing financial liabilities other than those held at FVIS or where fair values have been hedged aremeasured at amortised cost. Amortised cost is calculated by taking into account any discount or premium. Premiums are amortised anddiscounts accreted on an effective yield basis to maturity and taken to special commission expense.
Buildings
Cash and cash equivalentsFor the purpose of the consolidated statement of cash flows, cash and cash equivalents are defined as those amounts included in cash,balances with SAMA excluding statutory deposits, and due from banks and other financial institutions maturing within three months from thedate of acquisition.
Page 17 of 54

RIYAD BANK
3.t )
u )
v )
w)
x )
i)
ii)
iii)
NOTES TO THE CONSOLIDATED FINANCIAL STATEMENTS - continued
Under Saudi Arabian Zakat and Income Tax Laws, Zakat is the liability of shareholders. Zakat is computed on the shareholders’ equity or netincome using the basis defined under the Zakat regulations. Zakat is not charged to the Group’s consolidated statement of income as they arededucted from the dividends paid to the shareholders.Investment management services
For the years ended December 31, 2016 and 2015
SUMMARY OF SIGNIFICANT ACCOUNTING POLICIES (continued)
End of service benefitsBenefits payable to the employees of the Bank at the end of their services are accrued in accordance with the guidelines set by the SaudiArabian Labor Regulations and are included in other liabilities in the consolidated statement of financial position.
Zakat
Derecognition of financial instrumentsA financial asset (or a part of a financial asset, or a part of a group of similar financial assets) is derecognised, when the contractual rights toreceive the cash flows from the financial asset expires or the asset is transferred and the transfer qualifies for de-recognition. In instances where the Bank is assessed to have transferred a financial asset, the asset is derecognised if the Bank has transferredsubstantially all the risks and rewards of ownership. Where the Bank has neither transferred nor retained substantially all the risks and rewardsof ownership, the financial asset is derecognised only if the Bank has not retained control of the financial asset. The Bank recognisesseparately as assets or liabilities any rights and obligations created or retained in the process.A financial liability (or a part of a financial liability) can only be derecognised when it is extinguished, that is when the obligation specified in thecontract is either discharged, cancelled or expires.
Ijarah is a an agreement whereby the Bank, acting as a lessor, purchases or constructs an asset for lease according to the customerrequest (lessee), based on his promise to lease the asset for an agreed rent and specific period that could end by transferring theownership of the leased asset to the lessee.Tawaraq is a form of Murabaha transactions where the Bank purchases a commodity and sells it to the customer. The customer sells theunderlying commodity at spot and uses the proceeds for his financing requirements.
The Group offers investment services to its customers, which include management of certain investment funds. Fees earned are disclosedunder related party transactions. Assets held in trust or in a fiduciary capacity are not treated as assets of the Group and accordingly, are notincluded in the consolidated financial statements.
Non-special commission based banking products
Murabaha is an agreement whereby the Bank sells to a customer a commodity or an asset, which the Bank has purchased and acquiredbased on a promise received from the customer to buy. The selling price comprises the cost plus an agreed profit margin.
In addition to the conventional banking, the Bank offers its customers certain non-special commission based banking products, which areapproved by its Shariah Board. These products include Murabaha, Tawaraq and Ijara. These banking products are accounted for using IFRSand are in conformity with the accounting policies described in these consolidated financial statements.
Page 18 of 54

RIYAD BANK
3.
y)
4.2016 2015
SAR'000 SAR'0004,307,682 4,062,7568,161,572 8,797,5788,750,000 7,654,787
42,923 54,80821,262,177 20,569,929
5.2016 2015
SAR'000 SAR'0001,215,027 5,015,6893,352,128 4,253,8124,567,155 9,269,501
2016 2015SAR'000 SAR'000
4,555,982 9,263,7191,023 689
10,150 5,0934,567,155 9,269,501
NOTES TO THE CONSOLIDATED FINANCIAL STATEMENTS - continued
Reverse repos with SAMAStatutory deposit
Short term employee benefitsShort term employee benefits are measured on an undiscounted basis and are expensed as the related service is provided. A liability isrecognised for the amount expected to be paid under short term cash bonus plans if the Group has a present legal or constructive obligation topay this amount as a result of past service provided by employees and the obligation can be estimated reliably.
For the years ended December 31, 2016 and 2015
SUMMARY OF SIGNIFICANT ACCOUNTING POLICIES (continued)
In accordance with the Banking Control Law and regulations issued by SAMA, the Bank is required to maintain a statutory deposit with SAMA atstipulated percentages of its demand, savings, time and other deposits, calculated at the end of each month. The statutory deposit with SAMA is notavailable to finance the Bank's day-to-day operations and therefore is not part of cash and cash equivalents (note 26).
CASH AND BALANCES WITH SAMA
Cash in hand
TotalOther balances
Total
DUE FROM BANKS AND OTHER FINANCIAL INSTITUTIONS
Current accountsMoney market placements
UnratedTotal
The credit quality of due from banks and other financial institutions is managed using reputable external credit rating agencies. The table belowshows the credit quality by class and is based on Standard & Poor's/ equivalent credit ratings.
Investment grade (credit rating BBB and above)Non-investment grade (credit rating below BBB)
Page 19 of 54

6.a)
i) Held as FVIS
ii) Available for sale
2016 2015 2016 2015 2016 2015 - - 11,880,019 11,247,256 11,880,019 11,247,256 - - 1,709,394 1,722,333 1,709,394 1,722,333
381,532 184,347 662,612 1,251,878 1,044,144 1,436,225 1,228,023 1,166,443 152,407 150,208 1,380,430 1,316,651 1,609,555 1,350,790 14,404,432 14,371,675 16,013,987 15,722,465
iii) Other investments held at amortised cost
2016 2015 2016 2015 2016 2015 17,388,272 22,997,500 1,731,049 1,046,098 19,119,321 24,043,598 10,022,575 4,734,465 - 220,000 10,022,575 4,954,465 27,410,847 27,731,965 1,731,049 1,266,098 29,141,896 28,998,063
iv) Held to maturity
2016 2015 2016 2015 2016 2015 1,498 44,876 - - 1,498 44,876 - - - - - -
1,498 44,876 - - 1,498 44,876
29,021,900 29,127,631 16,135,481 15,637,773 45,157,381 44,765,404
b)
Quoted Unquoted* Total Quoted Unquoted* Total 15,748,605 15,252,233 31,000,838 14,402,377 20,933,353 35,335,730 4,187,905 7,544,064 11,731,969 4,392,519 2,284,279 6,676,798 1,113,781 266,649 1,380,430 1,063,645 253,006 1,316,651 1,044,144 - 1,044,144 1,436,225 - 1,436,225
22,094,435 23,062,946 45,157,381 21,294,766 23,470,638 44,765,404
Investments, net
Fixed rate securities
Held to maturity
Fixed rate securities
SAR'000 Domestic International Total
2015
International
Other investments held at amortised cost
Floating rate securities
Had the reclassification not occurred, the consolidated statement of income for the year ended December 31, 2016, would have included fairvalue gain on such reclassified investments amounting to SAR 209.8 million (December 31, 2015: unrealised fair value gain SAR 3.1 million).
Floating rate securities
Equities
Total
Mutual funds
InternationalSAR'000
Floating rate securities
International investments above includes investment portfolios of SAR 11.2 billion (2015: SAR 11.3 billion) which are externally managed.
NOTES TO THE CONSOLIDATED FINANCIAL STATEMENTS - continuedFor the years ended December 31, 2016 and 2015
Domestic
Fixed rate securities
On September 1, 2008, the Group reclassified investments held in trading portfolio reported under its investments at fair value through incomestatement ("FVIS") category to the available for sale category.The carrying and fair value of these reclassified investments as at December 31, 2016 was SAR 2,792 million (December 31, 2015: SAR 3,169million).
Investment securities are classified as follows:INVESTMENTS, NET
Available for sale, net
Floating rate securities
*Unquoted securities include SAMA Treasury Bills and bonds of SAR 19.8 billion (2015: SAR 20.8 billion)
EquitiesMutual fundsInvestments, net
SAR 000'Fixed rate securities
TotalSAR'000 Domestic
The analysis of the composition of investments is as follows:2016
Page 20 of 54

RIYAD BANK
6.c)
i)SAR 000'
Carrying value
Gross unrealised
gain
Gross unrealised
loss
Fair value Carrying value Gross unrealised
gain
Gross unrealised
loss
Fair value
19,119,321 20,536 (396,884) 18,742,973 24,043,598 117,738 (240,886) 23,920,450 10,022,575 406,272 (110) 10,428,737 4,954,465 333,159 - 5,287,624 29,141,896 426,808 (396,994) 29,171,710 28,998,063 450,897 (240,886) 29,208,074
ii) Held to maturity SAR 000'
Carrying value
Gross unrealised
gain
Gross unrealised
loss
Fair value Carrying value Gross unrealised
gain
Gross unrealised
loss
Fair value
1,498 15 - 1,513 44,876 428 - 45,304 - - - - - - - -
1,498 15 - 1,513 44,876 428 - 45,304
d)
SAR 000' 2016 2015 2016 2015 2016 2015 2016 2015
11,256,256 10,877,845 2,105,016 1,762,535 2,652,715 3,082,085 16,013,987 15,722,465 23,243,948 24,201,307 416,460 - 5,481,488 4,796,756 29,141,896 28,998,063
1,466 44,843 - - 32 33 1,498 44,876 34,501,670 35,123,995 2,521,476 1,762,535 8,134,235 7,878,874 45,157,381 44,765,404
e)2016 2015
SAR '000 SAR '000 26,355,088 25,817,004 10,073,218 9,563,709 8,729,075 9,384,691 45,157,381 44,765,404
The above classification is based on Standard & Poor's/ equivalent credit ratings. The unrated investments category comprise of mutual funds,equities and unrated fixed & floating securities.
Held to maturity Total
NOTES TO THE CONSOLIDATED FINANCIAL STATEMENTS - continued
INVESTMENTS, NET (continued)
For the years ended December 31, 2016 and 2015
The analysis of unrealised gains and losses and the fair values of other investments held at amortised cost, and held to maturityinvestments, is as follows:
Investments include SAR 65.8 million (2015: SAR 700.3 million), which have been pledged under repurchase agreements with customers (note 19 d).The market value of such investments is SAR 65.7 million (2015: SAR 700.3 million).
CorporateBanks and other financial institutions
Government and quasi Government
Total
Other investments held at amortised cost
Fixed rate securities
The analysis of investments by counter-party is as follows:
2015
2015
Total
2016
2016
Total
Credit quality of investments
Floating rate securities
Total
Other investments held at amortised cost
Investment grade Non- investment grade UnratedAvailable for sale
Fixed rate securitiesFloating rate securities
Page 21 of 54

RIYAD BANK
7.a) Loans and advances held at amortised cost
9,256,856 773,471 38,035,114 96,072,934 190,485 144,328,860 126,500 - 171,701 855,307 4,514 1,158,022 9,383,356 773,471 38,206,815 96,928,241 194,999 145,486,882
Allowance for impairment (73,233) - (42,060) (1,384,752) (5,121) (1,505,166) 9,310,123 773,471 38,164,755 95,543,489 189,878 143,981,716
Portfolio provision - - - - - (1,072,349) 142,909,367
10,008,311 833,405 37,902,224 95,646,838 1,215,417 145,606,195 186,692 - 113,352 1,048,943 9,756 1,358,743 10,195,003 833,405 38,015,576 96,695,781 1,225,173 146,964,938
Allowance for impairment (109,212) - (27,264) (685,005) (4,917) (826,398) 10,085,791 833,405 37,988,312 96,010,776 1,220,256 146,138,540
Portfolio provision - - - - - (1,072,349) 145,066,191
b)Portfolio Totalprovision
- 27,264 799,134 826,398 1,072,349 1,898,747 67,564 559,179 1,305,837 1,932,580 - 1,932,580 (67,564) (544,383) (562,866) (1,174,813) - (1,174,813)
- - (50,850) (50,850) - (50,850) - - (28,149) (28,149) - (28,149) - 42,060 1,463,106 1,505,166 1,072,349 2,577,515
Portfolio Totalprovision
- - 914,245 914,245 1,072,349 1,986,594 193,827 1,340,126 (4,013) 1,529,940 - 1,529,940 (193,827) (1,312,862) (33,199) (1,539,888) - (1,539,888)
- - (46,306) (46,306) - (46,306) - - (31,593) (31,593) - (31,593) - 27,264 799,134 826,398 1,072,349 1,898,747
* Includes consumer mortgage loans** Includes overdrafts and other loans*** Represents unwinding of accrued special commission income on impaired financial assets
Bad debts written offRecoveries of previously provided amounts***Other movementsBalance at end of the yearDuring the year, the net charge to the consolidated statement of income on account of impairment charge for credit losses, net is SAR 1,286 million(2015: SAR 1,031 million) representing amounts provided during the year of SAR 1,881 million (2015: SAR 1,484 million) and recoveries fromamounts previously written off of SAR 595 million (2015: SAR 453 million).
Provided (reversed) during the yearBalance at beginning of the year
Balance at end of the year
Allowance for impairment2015 Credit cards Consumer
loans*Commercial
loans **Total
SAR'000
Bad debts written offRecoveries of previously provided amounts***Other movements
Total
LOANS AND ADVANCES, NET
These comprise the following:2016 Overdrafts Credit cards
Non-performing loans and advancesTotal loans and advances
Commercial loans
Overdrafts Credit cards Others Total
Performing loans and advances
Others
Allowance for impairment2016 Credit cards Consumer
loans*Commercial
loans **Total
SAR'000
NOTES TO THE CONSOLIDATED FINANCIAL STATEMENTS - continuedFor the years ended December 31, 2016 and 2015
Consumer loans*
Commercial loans SAR'000
Provided during the yearBalance at beginning of the year
Consumer loans*
Performing loans and advancesNon-performing loans and advancesTotal loans and advances
Total
Loans and advances held at amortised cost, net
2015SAR'000
Total
Loans and advances held at amortised cost, netLoans and advances, net, include Islamic products of SAR 73,690 million (2015: SAR 71,229 million).
Movements in allowance for impairment are as follows:
Page 22 of 54

RIYAD BANK
7.
c)i) Neither past due nor impaired
Credit cards Consumer loans*
Commercial loans**
Total
660,809 35,219,994 104,376,898 140,257,701 - - 694,963 694,963
660,809 35,219,994 105,071,861 140,952,664
Credit cards Consumer loans*
Commercial loans**
Total
675,133 35,435,835 106,418,963 142,529,931 - - 385,398 385,398
675,133 35,435,835 106,804,361 142,915,329
ii) Ageing of loans and advances (Past due but not impaired)
51,230 1,977,870 6,316 2,035,416 33,466 538,035 5,841 577,342 27,966 299,215 167,026 494,207 - - 269,231 269,231 112,662 2,815,120 448,414 3,376,196
92,984 1,607,139 11,795 1,711,918 36,493 530,017 48,628 615,138 28,795 329,233 5,782 363,810 - - - - 158,272 2,466,389 66,205 2,690,866
* Includes consumer mortgage loans** Includes overdrafts and other loans
From 91 - 180 days
Standard category
Total
The Group uses an internal classification system based on risk ratings for its credit customers. The risk rating system, which is managed byan independent unit, provides a rating at the obligor level. The risk rating system includes twelve grades, of which nine grades relate to theperforming portfolio covering Standard and Special Mention category and the rest to non-performing loans.
Upto 30 days
Credit cards
Special Mention category: A credit that requires close monitoring by management due to deterioration in the borrowers’ financial condition. Standard Category as at Dec 31, 2016 includes Commercial loans** of Very Strong Quality SAR 19,511 million (2015: SAR 23,538 million),Good Quality SAR 72,219 million (2015: SAR 72,545 million) and Satisfactory Quality SAR 12,647 million (2015: SAR 10,336 million).
More than 180 days
Total2015
Commercial loans**
Total
NOTES TO THE CONSOLIDATED FINANCIAL STATEMENTS - continued
LOANS AND ADVANCES, NET
For the years ended December 31, 2016 and 2015
Credit quality of loans and advances
2016SAR'000
Total More than 180 daysFrom 91 - 180 daysFrom 31 - 90 days
Consumer loans*
From 31 - 90 days
Commercial loans**
Credit cards
Upto 30 daysSAR'000
Special mention category
2015SAR'000
Total
Consumer loans*
Total2016SAR'000
Standard category: A credit with very strong to satisfactory credit quality and repayment ability, where regular monitoring is carried out.
Standard categorySpecial mention category
Page 23 of 54

RIYAD BANK
7.d) Economic sector risk concentration for the loans and advances and allowance for impairment are as follows
Performing Non performing
Allowance for impairment
Loans and advances, net
Performing Non performing
Allowance for
impairment
Loans and advances, net
- - - - - - - - 5,035,994 - - 5,035,994 5,918,540 - - 5,918,540
1,288,041 1,400 (553) 1,288,888 1,647,527 - - 1,647,527 25,671,245 268,591 (58,897) 25,880,939 24,609,947 112,337 (77,149) 24,645,135 10,479,167 - - 10,479,167 8,592,698 - - 8,592,698 2,569,707 3,064 (129) 2,572,642 2,399,656 - - 2,399,656
15,263,298 91,556 (957,025) 14,397,829 15,506,751 514,198 (291,884) 15,729,065 34,208,471 618,304 (444,644) 34,382,131 36,698,505 608,646 (422,592) 36,884,559 4,380,754 - - 4,380,754 4,673,696 8,998 (6,953) 4,675,741
6,452,622 3,406 (1,858) 6,454,170 6,715,452 1,212 (556) 6,716,108 38,808,585 171,701 (42,060) 38,938,226 38,735,629 113,352 (27,264) 38,821,717 170,976 - - 170,976 107,794 - - 107,794 144,328,860 1,158,022 (1,505,166) 143,981,716 145,606,195 1,358,743 (826,398) 146,138,540
(1,072,349) (1,072,349) 142,909,367 145,066,191
e)
2016 2015SAR'000 SAR'000
41,872,710 41,963,0242,206,810 1,435,482
817,093 689,28844,896,613 44,087,794
Neither past due nor impaired
Total
2015
The Bank in the ordinary course of lending activities holds collaterals as security to mitigate credit risk in the loans and advances. Thesecollaterals mostly include time, demand and other cash deposits, financial guarantees, local and international equities, real estate and other fixedassets. The collaterals are held mainly against commercial and consumer loans and are managed against relevant exposures at their netrealisable values. Management monitors the market value of the collateral and requests additional collateral in accordance with the underlyingagreement when deemed necessary. Fair value of collateral held by Group against financing and advances by each category are as follows:
SAR’ 000
TotalOther
Past due but not impairedImpaired
2016
Commerce
Portfolio provisionLoans and advances, net
Mining and quarrying
NOTES TO THE CONSOLIDATED FINANCIAL STATEMENTS - continued
Collateral
LOANS AND ADVANCES, NET (continued)
Government and quasi GovernmentBanks and other financial institutions Agriculture and fishingManufacturing
Services
For the years ended December 31, 2016 and 2015
Electricity, water, gas and health servicesBuilding and construction
Transportation and communication
Consumer loans and credit cards
Page 24 of 54

RIYAD BANK
8.
9.Land and buildings
Improve-ments
and decoration of
premises
Furniture, fixtures and
equipment
Computer hardware,
software programs
and automation
projects
Motor vehicles
Total
1,413,529 770,742 421,981 2,294,221 913 4,901,386 47,281 50,991 19,999 345,526 284 464,081 (310) (6) (291) (222) (145) (974) 1,460,500 821,727 441,689 2,639,525 1,052 5,364,493 12,875 56,098 18,883 217,554 - 305,410 (20,782) - (269) (142,484) (60) (163,595) 1,452,593 877,825 460,303 2,714,595 992 5,506,308
Accumulated depreciation and amortisation 486,226 672,007 338,641 1,696,868 913 3,194,655 20,699 38,382 25,799 190,846 48 275,774 - (6) (291) (195) (145) (637) 506,925 710,383 364,149 1,887,519 816 3,469,792 21,941 40,912 23,944 201,922 71 288,790 (16,293) - (269) (98,001) (60) (114,623) 512,573 751,295 387,824 1,991,440 827 3,643,959
As at January 1,,2015 927,303 98,735 83,340 597,353 - 1,706,731 As at December 31, 2016 940,020 126,530 72,479 723,155 165 1,862,349 As at December 31, 2015 953,575 111,344 77,540 752,006 236 1,894,701
Land and buildings and improvements and decoration of premises include work in progress as at December 31, 2016 amounting to nil (2015: SAR2.4 million); and nil (2015: SAR 0.5 million), respectively.
Balance as at December 31, 2015 Charge for the yearDisposalsBalance at December 31, 2016
AdditionsDisposalsBalance at December 31, 2016
Net book value
Balance as at January 1,,2015Charge for the yearDisposals
PROPERTY AND EQUIPMENT, NETSAR’ 000
Cost
Balance as at December 31, 2015
Balance as at January 1,,2015AdditionsDisposals
NOTES TO THE CONSOLIDATED FINANCIAL STATEMENTS - continuedFor the years ended December 31, 2016 and 2015
INVESTMENT IN ASSOCIATESInvestment in associates represents the Bank's share of investment in entities where the Bank has significant influence. These investments areaccounted for using the equity method of accounting. Investment in associates represents 35% (2015: 35%) share ownership in Ajil FinancialServices Company incorporated in Kingdom of Saudi Arabia, 21.4 % (2015: 21.4%) share in ownership in Royal and Sun Alliance Insurance(Middle East) Limited E.C., incorporated in Bahrain and 30.6% (2015: 30.6%) share ownership, (including indirect) and Board representation in Al-Alamiya for Cooperative Insurance Company incorporated in Kingdom of Saudi Arabia.
Page 25 of 54

RIYAD BANK
10.2016 2015
SAR'000 SAR'000 293,437 254,250 584,229 514,818 877,666 769,068
11.
a)
b)
c)
* Mainly include prepayments amounting to SAR 130 million (2015: SAR 135 million) and items in transit which are cleared in the normal course ofbusiness.
Swaps are commitments to exchange one set of cash flows for another. For special commission rate swaps, counterparties generally exchangefixed and floating special commission rate payments in a single currency without exchanging principal. For currency swaps, principal, fixed andfloating commission payments are exchanged in different currencies.
Held for trading purposesMost of the Bank’s derivative trading activities relate to sales, positioning and arbitrage. Sales activities involve offering products to customers andbanks in order, inter alia, to enable them to transfer, modify or reduce current and future risks. Positioning involves managing market risk positionswith the expectation of profiting from favourable movements in prices, rates or indices. Arbitrage involves identifying pricing anomalies in differentmarkets and products, with the expectation of profiting from price differentials between markets or products.Held for hedging purposesThe Bank has adopted a comprehensive system for the measurement and management of risk. Part of the risk management process involvesmanaging the Bank’s exposure to fluctuations in foreign exchange rates and special commission rates to reduce its exposure to currency andspecial commission rate risks to acceptable levels as determined by the Board of Directors within the guidelines issued by SAMA. The Board ofDirectors has established levels of currency risk by setting limits on counterparty and currency position exposures. Positions are monitored on adaily basis and hedging strategies are used to ensure positions are maintained within the established limits. The Board of Directors have alsoestablished the level of special commission rate risk by setting limits on special commission rate gaps for stipulated periods. Asset and liabilityspecial commission rate gaps are reviewed on a periodic basis and if required hedging strategies are used to reduce special commission rate gapwithin the established limits.As part of its asset and liability management, the Bank uses derivatives for hedging purposes in order to adjust its own exposure to currency andspecial commission rate risks. This can be achieved by hedging specific transactions as well as strategic hedging against overall consolidatedstatement of financial position exposure. Strategic hedging, other than portfolio hedges for special commission rate risks, does not qualify forspecial hedge accounting and the related derivatives are accounted for as held for trading.
Options are contractual agreements under which the seller (writer) grants the purchaser (holder) the right, but not the obligation, to either buy orsell at a fixed future date or at any time during a specified period, a specified amount of a currency, commodity or financial instrument at a pre-determined price.
Forwards and futuresForwards and futures are contractual agreements to either buy or sell a specified currency, commodity or financial instrument at a specifiedprice and date in the future. Forwards are customised contracts transacted in the over-the-counter market. Foreign currency and specialcommission rate futures are transacted in standardised amounts on regulated exchanges and changes in futures contract values are settled ondaily basis.
DERIVATIVES
In the ordinary course of business, the Bank utilises the following derivative financial instruments for both trading and hedging purposes:Swaps
Accounts receivable Other*
Options
Total
NOTES TO THE CONSOLIDATED FINANCIAL STATEMENTS - continued
OTHER ASSETS
For the years ended December 31, 2016 and 2015
Page 26 of 54

RIYAD BANK
11.
Positive fair value
Negative fair value
Notional amount
total
Within 3 months
3-12 months
1-5 years
Over 5years
Monthly average
57,693 (26,803) 7,992,359 1,335,992 2,059,682 4,244,384 352,301 8,887,264 91,894 (71,763) 25,510,910 21,682,845 3,194,425 633,640 - 25,652,138 39,708 (39,708) 8,376,319 3,673,681 3,714,959 987,679 - 9,978,783
- (364) 75,000 37,500 37,500 - - 75,000 - 189,295 (138,638) 41,954,588 26,730,018 9,006,566 5,865,703 352,301 44,593,185 Total
Currency optionsHeld as fair value hedges:
Special commission rate swaps
The table below shows the positive and negative fair values of derivative financial instruments held, together with their notional amounts, analysedby the term to maturity and monthly average. The notional amounts, which provide an indication of the volumes of the transactions outstanding atthe year end, do not reflect the amounts of future cash flows involved. These notional amounts, therefore, are neither indicative of the Bank’sexposure to credit risk, which is generally limited to the positive fair value of the derivatives, nor market risk.
Forward foreign exchange contracts
2016SAR'000
Special commission rate swapsHeld for trading:
Notional amounts by term to maturity
The Bank is exposed to variability in future special commission cash flows on non-trading assets and liabilities which bear special commissionrate at a variable rate. The Bank uses special commission rate swaps as cash flow hedges of these special commission rate risks.
Cash flow hedges
Fair value hedges
NOTES TO THE CONSOLIDATED FINANCIAL STATEMENTS - continued
DERIVATIVES (continued)
For the years ended December 31, 2016 and 2015
Held for hedging purposes (continued)
The Bank uses special commission rate swaps to hedge against the special commission rate risk arising from specifically identified fixed specialcommission rate exposures.
Page 27 of 54

RIYAD BANK
11.
Positive fair value
Negative fair value
Notional amount total
Within 3 months
3-12 months
1-5 years
1-5 years
Monthly average
45,071 (15,052) 5,283,833 769,473 1,289,965 2,893,136 331,259 3,232,054 78,572 (96,544) 38,044,211 34,029,932 4,014,279 - - 55,569,243 73,399 (73,399) 8,483,383 3,177,030 3,976,204 1,330,149 - 6,209,352 497 (497) 1,696 1,696 - - - 11,212
- (1,637) 230,474 68,110 137,501 24,863 - 230,474
197,539 (187,129) 52,043,597 38,046,241 9,417,949 4,248,148 331,259 65,252,335
Fair value
Hedge inception
value
Risk Positive fair value
Negative fair value
74,017 73,644 Fair value - (363)
Fair value
Hedge inception
value
Risk Positive fair value
Negative fair value
230,854 229,118 Fair value - (1,637)
12.2016 2015
SAR'000 SAR'000 1,038,289 607,043 7,798,424 3,892,650 8,836,713 4,499,693
2015SAR '000Description of hedged items
Hedging instrument
Special commission rate swapsFixed special commission rate deposits
Current accountsMoney market depositsTotal
DUE TO BANKS AND OTHER FINANCIAL INSTITUTIONS
Commodity options
Held for trading:Special commission rate
The table below shows a summary of hedged items, the nature of the risk being hedged, the hedging instrument and its fair value as atDecember 31, 2016.
Held as fair value hedges:
Total
Special commission rate
NOTES TO THE CONSOLIDATED FINANCIAL STATEMENTS - continued
DERIVATIVES (continued)
2015SAR'000
Currency options
Notional amounts by term to maturity
For the years ended December 31, 2016 and 2015
Forward foreign exchange contracts
Hedging instrument2016SAR '000Description of hedged items
Special commission rate swapsFixed special commission rate deposits
Page 28 of 54

RIYAD BANK
13.2016 2015
SAR'000 SAR'000 77,846,981 72,139,543 324,982 333,618 67,811,458 85,688,654 10,699,928 9,690,318 156,683,349 167,852,133
2016 2015SAR'000 SAR'000
4,014,306 2,540,054 10,216 494 13,953,808 27,573,006 317,907 301,307 18,296,237 30,414,861
14. DEBT SECURITIES IN ISSUE
15.2016 2015
SAR'000 SAR'000 1,150,001 1,127,505 5,018,866 5,092,990 6,168,867 6,220,495
16. SHARE CAPITALThe authorised, issued and fully-paid share capital of the Bank consist of 3,000 million shares of SAR 10 each (2015: 3,000 million shares of SAR10 each).
Total
*Mainly include end of service benefits of SAR 725 million (2015 : SAR 718 million), provision for zakat and tax of SAR 573 million (2015 : SAR410 million), insurance payable, accrued expenses, income received in advance and items in transit which are cleared in the normal course ofbusiness
Other*
Time deposits include deposits against sales of bonds of SAR 66 million (2015: SAR 701 million) with agreement to repurchase the same at fixedfuture dates. Other customers’ deposits include SAR 2,539 million (2015: SAR 2,963 million) of margins held for irrevocable commitments. Time deposits include non-special commission based deposits of SAR 31,970 million (2015: SAR 36,479 million).
Total
SavingTime
OTHER LIABILITIES
During June 2015, the Bank issued SAR 4,000 million Subordinated debt (Sukuk). These are SAR denominated and have maturity date of June24, 2025 and are callable after 5 years, subject to the terms and conditions of the agreement. The notes carry a special commission rate of 6month SAIBOR plus 115 basis points.
Other
Demand
CUSTOMER DEPOSITS
TimeSaving
NOTES TO THE CONSOLIDATED FINANCIAL STATEMENTS - continuedFor the years ended December 31, 2016 and 2015
Demand
The above include foreign currency deposits as follows:
OtherTotal
During November 2013, the Bank issued SAR 4,000 million Senior debt (Sukuk). These SAR denominated sukuks carry a 3 month SAIBOR plus68 basis points, have maturity date of November 11, 2020 and are callable after 5 years, subject to the terms and conditions of the agreement.
Accounts payable
Page 29 of 54

RIYAD BANK
17. STATUTORY RESERVE
18.2016
SAR'000s2015
SAR'000s 297,467 1,038,937 309,784 (582,781)
(74,322) (158,689) 235,462 (741,470) 532,929 297,467
19. COMMITMENTS AND CONTINGENCIESa) Legal proceedings
b) Capital commitments
c) Credit related commitments and contingencies
Balance at end of the year
Balance at beginning of the yearNet change in fair value of Available for sale investmentsNet amounts relating to Available for sale investments transferred to consolidated statement of income
Net movement during the year
NOTES TO THE CONSOLIDATED FINANCIAL STATEMENTS - continuedFor the years ended December 31, 2016 and 2015
In accordance with Saudi Arabian Banking Control Law and the Bank's By-Laws, a minimum of 25% of the annual net income is required to betransferred to the statutory reserve until this reserve equals the paid up capital of the Bank. Accordingly, SAR 835.6 million has been transferredfrom 2016 net income (2015: SAR 1,012.4 million). The statutory reserve is not currently available for distribution.
OTHER RESERVES
The primary purpose of these instruments is to ensure that funds are available to a customer as required. Guarantee and standby letters ofcredit, which represent irrevocable assurances that the Bank will make payments in the event that a customer cannot meet its obligations tothird parties, carry the same credit risk as loans and advances. Cash requirements under guarantees and standby letters of credit areconsiderably less than the amount of the commitment because the Bank does not generally expect the third party to draw funds under theagreement. Documentary letters of credit, which are written undertakings by the Bank on behalf of a customer authorizing a third party to drawdrafts on the Bank up to a stipulated amount under specific terms and conditions, are generally collateralised by the underlying shipments ofgoods to which they relate, and therefore have significantly less risk.
As at December 31, 2016, there were legal proceedings of a routine nature outstanding against the Bank. No provision has been made asmanagement and in-house legal adviser believes that it is unlikely that any significant loss will arise.
As at December 31, 2016, the Bank had capital commitments of SAR 132.1 million (2015: SAR 195.6 million). This includes computerhardware, software, automation projects, construction and equipment purchases.
Page 30 of 54
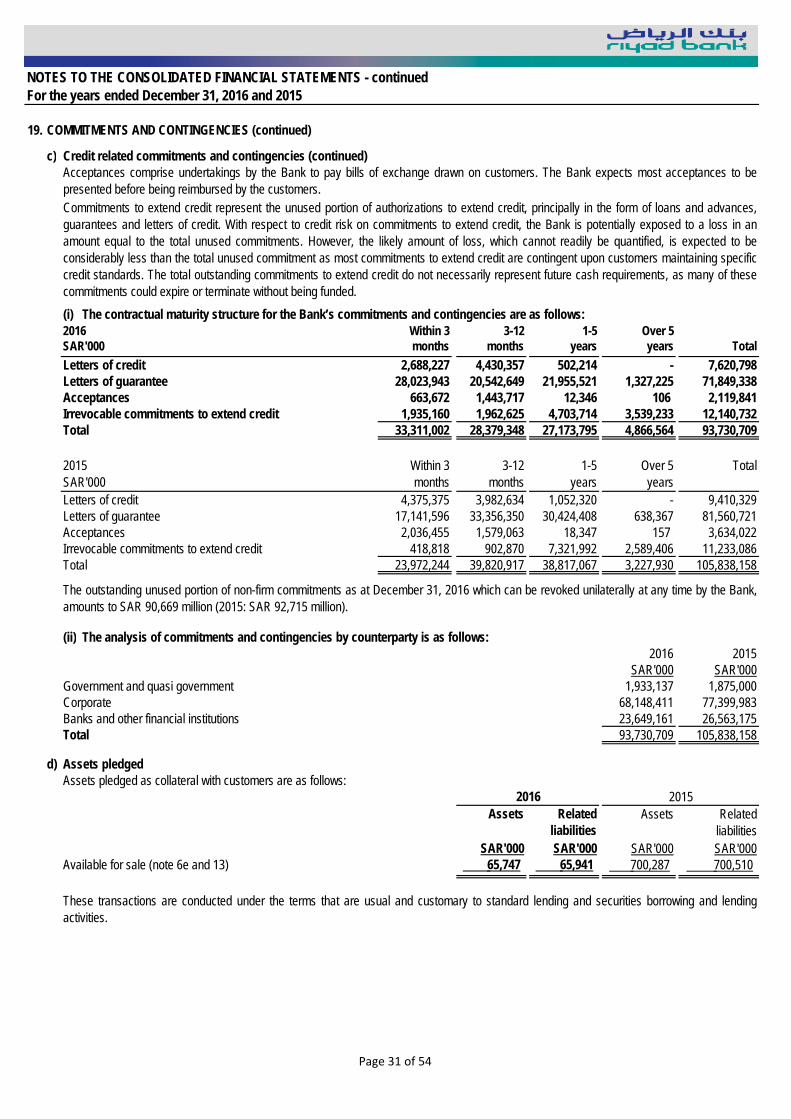
RIYAD BANK
19.
c)
(i)Within 3 months
3-12 months
1-5 years
Over 5 years Total
2,688,227 4,430,357 502,214 - 7,620,798 28,023,943 20,542,649 21,955,521 1,327,225 71,849,338 663,672 1,443,717 12,346 106 2,119,841 1,935,160 1,962,625 4,703,714 3,539,233 12,140,732 33,311,002 28,379,348 27,173,795 4,866,564 93,730,709
Within 3 months
3-12 months
1-5 years
Over 5 years
Total
4,375,375 3,982,634 1,052,320 - 9,410,329 17,141,596 33,356,350 30,424,408 638,367 81,560,721 2,036,455 1,579,063 18,347 157 3,634,022 418,818 902,870 7,321,992 2,589,406 11,233,086 23,972,244 39,820,917 38,817,067 3,227,930 105,838,158
(ii)2016 2015
SAR'000 SAR'000 1,933,137 1,875,000 68,148,411 77,399,983 23,649,161 26,563,175
93,730,709 105,838,158
d)
Assets Related liabilities
Assets Related liabilities
SAR'000 SAR'000 SAR'000 SAR'000Available for sale (note 6e and 13) 65,747 65,941 700,287 700,510
These transactions are conducted under the terms that are usual and customary to standard lending and securities borrowing and lendingactivities.
Assets pledged
Total Banks and other financial institutions
Government and quasi government
2016
The analysis of commitments and contingencies by counterparty is as follows:
Corporate
2015
Acceptances
Letters of credit
Irrevocable commitments to extend credit
2015SAR'000
Total
Letters of guarantee
NOTES TO THE CONSOLIDATED FINANCIAL STATEMENTS - continued
COMMITMENTS AND CONTINGENCIES (continued)
Credit related commitments and contingencies (continued)
For the years ended December 31, 2016 and 2015
2016SAR'000
Assets pledged as collateral with customers are as follows:
Acceptances comprise undertakings by the Bank to pay bills of exchange drawn on customers. The Bank expects most acceptances to bepresented before being reimbursed by the customers.Commitments to extend credit represent the unused portion of authorizations to extend credit, principally in the form of loans and advances,guarantees and letters of credit. With respect to credit risk on commitments to extend credit, the Bank is potentially exposed to a loss in anamount equal to the total unused commitments. However, the likely amount of loss, which cannot readily be quantified, is expected to beconsiderably less than the total unused commitment as most commitments to extend credit are contingent upon customers maintaining specificcredit standards. The total outstanding commitments to extend credit do not necessarily represent future cash requirements, as many of thesecommitments could expire or terminate without being funded.
Acceptances
Total
The contractual maturity structure for the Bank’s commitments and contingencies are as follows:
Letters of creditLetters of guarantee
The outstanding unused portion of non-firm commitments as at December 31, 2016 which can be revoked unilaterally at any time by the Bank,amounts to SAR 90,669 million (2015: SAR 92,715 million).
Irrevocable commitments to extend credit
Page 31 of 54

RIYAD BANK
19.
e)
2016 2015SAR'000 SAR'000
35,862 33,165 78,258 88,557 11,465 4,623 125,585 126,345
20.2016 2015
SAR'000 SAR'000Investments 411,240 415,423
562,903 423,841 711 2,856 974,854 842,120 73,750 32,875
Loans and advances 6,263,986 5,008,040 7,312,590 5,883,035
2016 2015SAR'000 SAR'000
68,884 18,403 1,710,081 581,013 232,596 103,842 2,011,561 703,258
21.2016 2015
SAR'000 SAR'000
259,470 341,444 1,100,768 1,243,063 720,401 697,369 2,080,639 2,281,876
431,314 349,265 39,541 35,352 106,671 113,489 577,526 498,106 1,503,113 1,783,770
22. OTHER OPERATING INCOMEIncludes gain on sale of lands initially acquired in settlement of certain loans and advances amounting to SAR 225.3 million(2015: SAR 324.8million).
The future minimum lease payments under non-cancellable operating leases where the Bank is the lessee are as follows:
Less than 1 year
SPECIAL COMMISSION INCOME AND EXPENSE
Due from banks and other financial institutions
- Available for sale
Due to banks and other financial institutions Customer deposits
Fee and commission expense:
Total fee and commission income
TotalDebt securities in issue
Total fee and commission expense
NOTES TO THE CONSOLIDATED FINANCIAL STATEMENTS - continued
COMMITMENTS AND CONTINGENCIES (continued)
Operating lease commitments
For the years ended December 31, 2016 and 2015
Special commission expense
Special commission income
Over 5 yearsTotal
1 to 5 years
Total
- Other investments held at amortised cost- Held to maturity
Fee and commission income, net
FEE AND COMMISSION INCOME, NET
Fee and commission income:- Share brokerage and fund management- Trade finance and corporate finance and advisory - Other banking services
- Other banking services
- Banking cards - Share brokerage
Page 32 of 54

RIYAD BANK
23.
2016 2015 2016 2015 2016 2015 2016 2015 37 36 41,895 38,890 12,226 9,739 54,121 48,629 338 328 94,636 96,474 21,394 21,711 116,030 118,185 466 447 98,234 92,489 13,019 11,749 111,253 104,238 300 292 30,692 25,051 - - 30,692 25,051 5,196 5,064 746,518 702,644 91,347 76,537 837,865 779,181 6,337 6,167 1,011,975 955,548 137,986 119,736 1,149,961 1,075,284
584,400 657,806
1,596,375 1,613,354
24.
NOTES TO THE CONSOLIDATED FINANCIAL STATEMENTS - continuedFor the years ended December 31, 2016 and 2015
Senior executives requiring SAMA no objection
Variable compensation accrued during the year and other employee related benefits*Total salaries and employee-related expenses as per consolidated statement of income
Total
Employees engaged in risk taking activities
Outsourced employeesOthers
Basic and diluted earnings per share for the years ended December 31, 2016 and 2015 are calculated by dividing the net income for the year by3,000 million shares.
Compensation policy is based on the job profile requirements, market practices, nature and level of involvement in risk taking process. It appliesto the Bank’s senior management and all employees and aims to link individual performance to the Bank’s overall achievements andsoundness. Compensation includes fixed and variable components. Salary revision, performance bonus and other performance linkedincentives are decided based on the performance evaluation process outcome as well as the Bank’s financial performance and strategic goals.
The Board of Directors has the responsibility to approve and oversee the Bank’s compensation policy. The Nomination and CompensationCommittee, made up of four non-executive Directors, is in charge of overseeing the compensation system design and effectiveness on behalf ofthe Board of Directors as well as preparing the Bank’s compensation policy and undertaking its periodic assessment and update to ensureachievement of the system objectives and reinforce the Bank’s risk management framework. Fixed compensation comprises salaries andwages and other benefits and allowances. The variable compensation includes sales incentives, product related rewards and performancerelated payments.
Employees engaged in control functions
EARNINGS PER SHARE
*Other employee benefits include; insurance, pension, relocation expenses, recruitment expenses, training and development and otheremployee benefits.
The Bank has adopted fixed as well as variable compensation schemes. The variable component is vested over a period of 3 years and isaligned with the level of responsibility, the overall performance of the Bank and the individual, and risk involved in the relevant job function andis based on the annual review conducted by the Nomination & Compensation Committee. The Bank consistently evaluates its compensationpolicies against the industry and makes necessary revisions as and when required
SALARIES AND EMPLOYEE-RELATED EXPENSESThe following table summarises the Group’s employee categories defined in accordance with SAMA’s rules on compensation practices andincludes the total amounts of fixed and variable compensation paid to employees during the years ended December 31, 2016 and 2015, and theforms of such payments.
Number of employees
Variable compensation
Categories(SAR 000s)
Total compensation
Fixed compensation
Page 33 of 54

RIYAD BANK
25.
26.
2016 2015SAR'000 SAR'000
13,100,605 11,772,351 2,982,155 9,269,501 16,082,760 21,041,852
27.
Treasury and investments
OtherPrincipally providing money market trading and treasury services as well as the management of the Bank’s investment portfolios.
Includes income on capital and unallocated costs pertaining to head office, finance division, human resources, technology services and othersupport departments and unallocated assets and liabilities.
Retail
Corporate Principally handling corporate customers’ current accounts, deposits and providing loans, overdrafts and other credit facilities and derivativeproducts.
Cash and balances with SAMA excluding statutory deposit (note 4)
Cash and cash equivalents included in the consolidated statement of cash flows comprise the following:
The Bank has filed its Zakat and Income Tax returns with the General Authority for Zakat and Tax (“GAZT”) and paid Zakat and Income Taxes forfinancial years up to and including the year 2015 and has received the assessments for the years up to 2009, in which the GAZT raised additionaldemands aggregating to SAR 896 million for the years 2008 to 2009 mainly on account of “disallowance of certain long-term investments and theaddition of long term financing to the Zakat base by the GAZT”. The basis for the additional Zakat liability is being contested by the Bank beforethe Higher Appeal Committee. Management expects a favourable outcome on the aforementioned appeals and believes appropriate provisionsare held there against.The assessments for the years 2010 to 2016 are yet to be raised by the GAZT. However, if long-term investments are disallowed and long-termfinancing is added to the Zakat base, in line with the assessments finalized by GAZT for the years referred to above, it would result in significantadditional zakat exposure to the Bank which remains an industry wide issue and disclosure of which might affect the Bank’s position in this matter.
Investment management services and asset management activities related to dealing, managing, arranging, advising and custody of securities.
NOTES TO THE CONSOLIDATED FINANCIAL STATEMENTS - continued
PROPOSED GROSS DIVIDENDS AND ZAKAT
For the years ended December 31, 2016 and 2015
The net cash dividend after deduction of zakat amounted to SAR 1,950 million (2015: SAR 2,100 million), resulting in a net dividend to theshareholders of SAR 0.65 per share (2015: SAR 0.70 per share). The gross dividends for 2016 include interim dividends of SAR 1,050 millionpaid for the first half of 2016 (2015: SAR 1,050 million). Final gross dividends of SAR 1,700 million (2015: SAR 1,300 million) have beenproposed for 2016, comprising SAR 900 million of final proposed dividends(2015: SAR 1,050 million) and zakat appropriation of SAR 800 million(2015: SAR 250 million).
Investment banking and brokerage
The Group determines and presents operating segments based on the information that is provided internally to the chief operating decision makerin order to allocate resources to the segments and to assess its performance. The operating segments are managed separately based on theGroup's management and internal reporting structure. The transactions between the Group's operating segments are recorded as per the Group'stransfer pricing system. The Group’s primary business is conducted in Saudi Arabia with one international branch, a representative office and anagency. However, the total assets, liabilities, commitments and results of operations of this branch, representative office and agency are notmaterial to the Group’s overall consolidated financial statements and as a result have not been separately disclosed. There are no other materialitems of income or expense between the operating segments.
OPERATING SEGMENTS
Total
CASH AND CASH EQUIVALENTS
Due from banks and other financial institutions maturing within three months from the date of acquisition
Deposit, credit and investment products for individuals and small to medium sized businesses.
The Group’s reportable segments under IFRS 8 are as follows:
Page 34 of 54
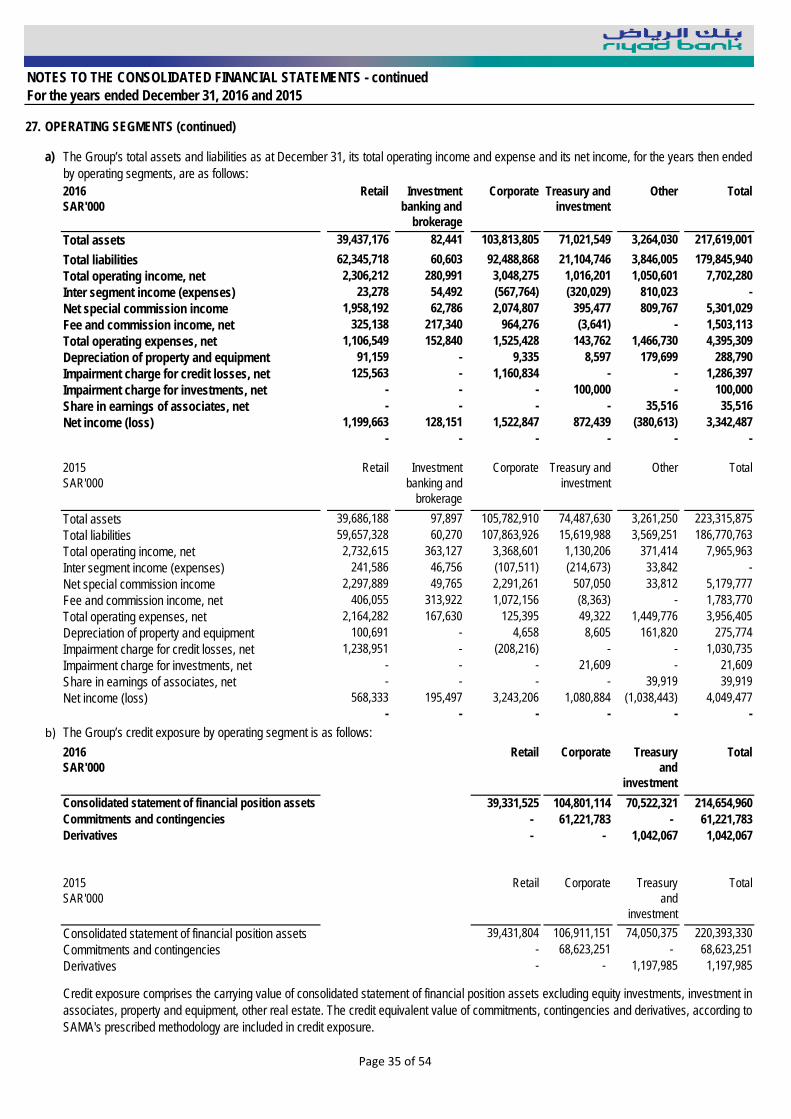
RIYAD BANK
27.
a)
Retail Investment banking and
brokerage
Corporate Treasury and investment
Other Total
39,437,176 82,441 103,813,805 71,021,549 3,264,030 217,619,001 62,345,718 60,603 92,488,868 21,104,746 3,846,005 179,845,940 2,306,212 280,991 3,048,275 1,016,201 1,050,601 7,702,280 23,278 54,492 (567,764) (320,029) 810,023 - 1,958,192 62,786 2,074,807 395,477 809,767 5,301,029 325,138 217,340 964,276 (3,641) - 1,503,113 1,106,549 152,840 1,525,428 143,762 1,466,730 4,395,309 91,159 - 9,335 8,597 179,699 288,790 125,563 - 1,160,834 - - 1,286,397 - - - 100,000 - 100,000 - - - - 35,516 35,516
1,199,663 128,151 1,522,847 872,439 (380,613) 3,342,487 - - - - - -
Retail Investment banking and
brokerage
Corporate Treasury and investment
Other Total
39,686,188 97,897 105,782,910 74,487,630 3,261,250 223,315,875 59,657,328 60,270 107,863,926 15,619,988 3,569,251 186,770,763 2,732,615 363,127 3,368,601 1,130,206 371,414 7,965,963 241,586 46,756 (107,511) (214,673) 33,842 - 2,297,889 49,765 2,291,261 507,050 33,812 5,179,777 406,055 313,922 1,072,156 (8,363) - 1,783,770 2,164,282 167,630 125,395 49,322 1,449,776 3,956,405 100,691 - 4,658 8,605 161,820 275,774 1,238,951 - (208,216) - - 1,030,735 - - - 21,609 - 21,609 - - - - 39,919 39,919
568,333 195,497 3,243,206 1,080,884 (1,038,443) 4,049,477 - - - - - -
b)Retail Corporate Treasury
and investment
Total
39,331,525 104,801,114 70,522,321 214,654,960 - 61,221,783 - 61,221,783 - - 1,042,067 1,042,067
Retail Corporate Treasury and
investment
Total
39,431,804 106,911,151 74,050,375 220,393,330 - 68,623,251 - 68,623,251 - - 1,197,985 1,197,985
Share in earnings of associates, net
The Group’s credit exposure by operating segment is as follows:
Net income (loss)
Impairment charge for credit losses, net
Total operating expenses, net
Inter segment income (expenses)
Total assets
Net special commission income
Total liabilities
NOTES TO THE CONSOLIDATED FINANCIAL STATEMENTS - continued
OPERATING SEGMENTS (continued)
The Group’s total assets and liabilities as at December 31, its total operating income and expense and its net income, for the years then endedby operating segments, are as follows:
For the years ended December 31, 2016 and 2015
Fee and commission income, net
Total liabilities
Inter segment income (expenses)
Depreciation of property and equipment
Net income (loss)
Total operating income, net
2016SAR'000
2015SAR'000
Share in earnings of associates, net
Total operating income, net
Net special commission income
Total assets
Fee and commission income, netTotal operating expenses, net
Impairment charge for investments, net
Credit exposure comprises the carrying value of consolidated statement of financial position assets excluding equity investments, investment inassociates, property and equipment, other real estate. The credit equivalent value of commitments, contingencies and derivatives, according toSAMA's prescribed methodology are included in credit exposure.
2015SAR'000
Commitments and contingenciesDerivatives
Consolidated statement of financial position assets
Commitments and contingencies
Impairment charge for credit losses, netImpairment charge for investments, net
Derivatives
2016SAR'000
Consolidated statement of financial position assets
Depreciation of property and equipment
Page 35 of 54

RIYAD BANK
28.
NOTES TO THE CONSOLIDATED FINANCIAL STATEMENTS - continued
CREDIT RISKCredit exposures arise principally in lending activities that lead to loans and advances, and investment activities. There is also credit risk in off-balance sheet financial instruments, such as loan commitments. The Bank uses internal credit rating tools to assess credit standing of itscounterparties and assigns credit ratings accordingly. Also the Bank uses the external ratings, of the major rating agency, where applicable. Apotential credit loss might arise due to lack of proper credit analysis of the borrower's credit worthiness, inability to service the debt, lack ofappropriate documentation, etc.
The credit ratings of the Group’s due from banks and other financial institutions is disclosed in note 5. The debt securities included in theinvestment portfolio are mostly sovereign risk. Analysis of investments by counterparty is provided in note 6. For details of the composition ofloans and advances refer to note 7. Information on credit risk relating to derivative instruments is provided in note 11 and for commitments andcontingencies in note 19. The Bank's maximum credit exposure, which best represents its maximum exposure to credit risk at the end of thereporting period, without taking account of any collateral held or other credit enhancements, is not materially different than the credit exposure bybusiness segment given in note 27. The Group’s consolidated Risk Weighted Assets (RWA) calculated under the Basel III framework is alsoprovided in note 34.
Management monitors the market value of collateral recurrently, requests additional collateral in accordance with the underlying agreement andmonitors the market value of collateral obtained during its review of the adequacy of the allowance for impairment losses. The Bank regularlyreviews its risk management policies and systems to reflect changes in markets products and emerging best practice.
The Bank attempts to control credit risk by appropriate credit structuring, credit review process, post-disbursal monitoring of credit exposures,limiting transactions with specific counterparties, and continually assessing the creditworthiness of counterparties. The Bank’s risk managementpolicies are designed to identify and to set appropriate risk limits and to monitor the risks and adherence to limits. Actual exposures against limitsare monitored daily. In addition to monitoring credit limits, the Bank manages the credit exposure relating to its trading activities by entering intomaster netting agreements and collateral arrangements with counterparties in appropriate circumstances, and limiting the duration of exposure. Incertain cases, the Bank may also close out transactions or assign them to other counterparties to mitigate credit risk. The Bank’s credit risk for derivatives, represents the potential cost to replace the derivative contracts if counterparties fail to fulfil their obligation,and to control the level of credit risk taken, the Bank assesses counterparties using the same techniques as for its lending activities.Concentration Risk refers to the risk from an uneven distribution of counterparties in credit or in other business relationship or from concentrationin business sectors or geographical regions. Accordingly, Concentration risk in the credit portfolios comes into existence through a skeweddistribution of financing to (a) individual borrower (name concentration) (b) industry /service sector (sector concentration) and (c) geographicalregions (regional concentration). Concentrations of credit risk indicate the relative sensitivity of the Bank’s performance to developments affectingany particular category of concentration.
For the years ended December 31, 2016 and 2015
The Bank seeks to manage its credit risk exposure through diversification of lending activities to ensure that there is no undue concentration ofrisks with individuals or groups of customers in specific locations or business. It also takes security when appropriate. The Bank also seeksadditional collateral from the counterparty as soon as impairment indicators are noticed for the relevant individual loans and advances.
Page 36 of 54

RIYAD BANK
29.a)
Kingdom of Saudi Arabia
Other GCC and Middle
East
Europe North America
Latin Americ
a
South East Asia
Other countries
Total
21,262,171 - 6 - - - - 21,262,177 Cash in hand 4,307,676 - 6 - - - - 4,307,682 Balances with SAMA 16,954,495 - - - - - - 16,954,495
3,049,810 459,069 546,193 377,999 - 96,735 37,349 4,567,155
Current accounts 566,792 18,679 487,970 99,415 - 22,645 19,526 1,215,027 Money market placements 2,483,018 440,390 58,223 278,584 - 74,090 17,823 3,352,128
106,801 28,307 54,187 - - - - 189,295 29,021,900 1,386,254 3,598,313 9,550,850 2,736 739,960 857,368 45,157,381
Available for sale 1,609,555 13,241 3,561,970 9,550,850 2,736 739,960 535,675 16,013,987 Held to maturity 1,498 - - - - - - 1,498 Other investments held at amortised cost
27,410,847 1,373,013 36,343 - - - 321,693 29,141,896
404,827 143,767 - - - - - 548,594 139,831,595 2,003,257 57,967 243,803 - 63,929 708,816 142,909,367
Overdraft 9,243,806 2,049 - - - 70 677 9,246,602 Credit cards 744,747 - - - - - - 744,747 Consumer loans 37,845,216 - - - - - - 37,845,216 Commercial loans 91,809,255 2,001,208 57,967 243,803 - 63,859 708,139 94,884,231 Others 188,571 - - - - - - 188,571
566,638 - - 311,028 - - - 877,666 Accounts receivable and others 566,638 - - 311,028 - - - 877,666
194,243,742 4,020,654 4,256,666 10,483,680 2,736 900,624 1,603,533 215,511,635
4,493,899 2,856,185 889,231 261,539 - 21,440 314,419 8,836,713
Current accounts 24,557 562,865 281,198 115,173 - 21,440 33,056 1,038,289 Money market deposits 4,469,342 2,293,320 608,033 146,366 - - 281,363 7,798,424
61,771 25,395 51,472 - - - - 138,638 153,028,741 2,421,271 916,054 198,811 - 2,375 116,097 156,683,349
Demand 77,821,831 208 22,721 - - - 2,221 77,846,981 Saving 314,672 3,145 372 701 - 1,011 5,081 324,982 Time 64,192,310 2,417,918 892,961 198,110 - 1,364 108,795 67,811,458 Other 10,699,928 - - - - - - 10,699,928
8,018,373 - - - - - - 8,018,373 6,138,261 - 22,831 7,218 - 557 - 6,168,867
Accounts payable and others 6,138,261 - 22,831 7,218 - 557 - 6,168,867 171,741,045 5,302,851 1,879,588 467,568 - 24,372 430,516 179,845,940
Total
Investment in associates
Other assets
LiabilitiesDue to banks and other financial institutions
Customer deposits
Debt securities in issue
Total
Other liabilities
Negative fair value of derivatives
AssetsCash and balances with SAMA
Due from banks and other financial institutions
Investments, net
Loans and advances, net
Positive fair value of derivatives
NOTES TO THE CONSOLIDATED FINANCIAL STATEMENTS - continuedFor the years ended December 31, 2016 and 2015
GEOGRAPHICAL CONCENTRATION The distribution by geographical region for major categories of assets, liabilities, commitments and contingencies and credit exposure accountsis as follows:2016SAR'000
Page 37 of 54
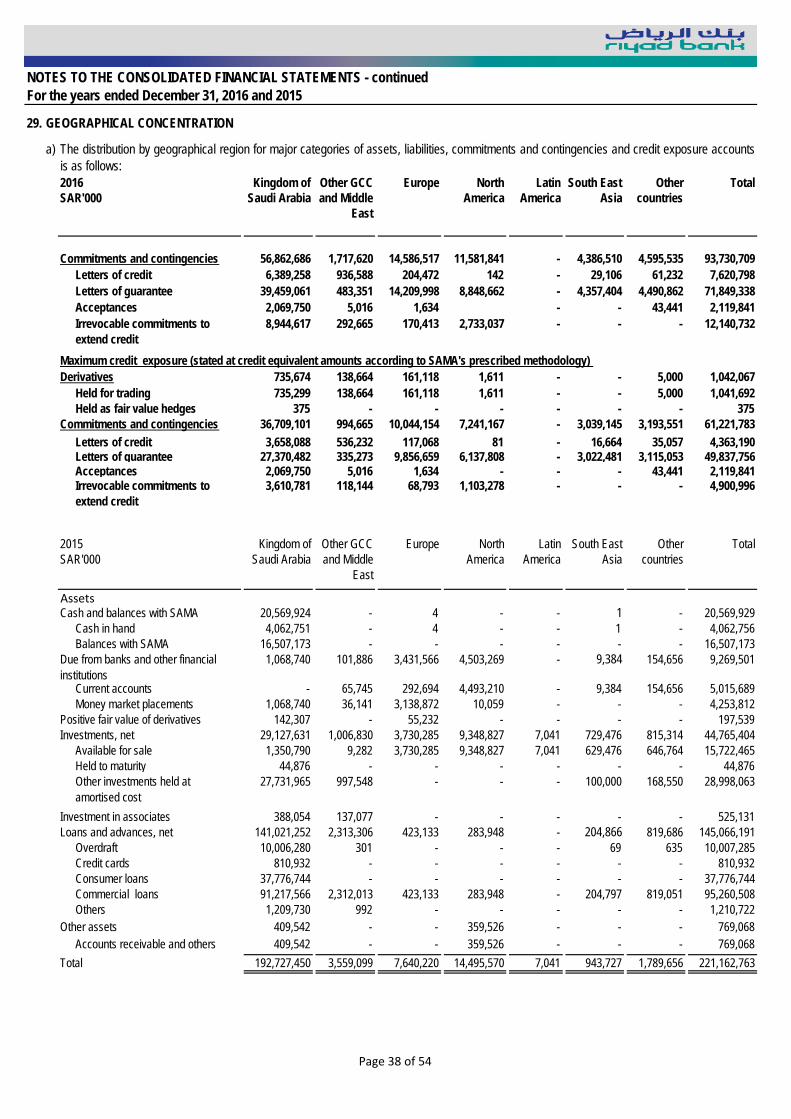
RIYAD BANK
29.
a)
Kingdom of Saudi Arabia
Other GCC and Middle
East
Europe North America
Latin America
South East Asia
Other countries
Total
56,862,686 1,717,620 14,586,517 11,581,841 - 4,386,510 4,595,535 93,730,709 Letters of credit 6,389,258 936,588 204,472 142 - 29,106 61,232 7,620,798 Letters of guarantee 39,459,061 483,351 14,209,998 8,848,662 - 4,357,404 4,490,862 71,849,338 Acceptances 2,069,750 5,016 1,634 - - 43,441 2,119,841 Irrevocable commitments to extend credit
8,944,617 292,665 170,413 2,733,037 - - - 12,140,732
735,674 138,664 161,118 1,611 - - 5,000 1,042,067 Held for trading 735,299 138,664 161,118 1,611 - - 5,000 1,041,692 Held as fair value hedges 375 - - - - - - 375
36,709,101 994,665 10,044,154 7,241,167 - 3,039,145 3,193,551 61,221,783 Letters of credit 3,658,088 536,232 117,068 81 - 16,664 35,057 4,363,190 Letters of guarantee 27,370,482 335,273 9,856,659 6,137,808 - 3,022,481 3,115,053 49,837,756 Acceptances 2,069,750 5,016 1,634 - - - 43,441 2,119,841 Irrevocable commitments to extend credit
3,610,781 118,144 68,793 1,103,278 - - - 4,900,996
Kingdom of Saudi Arabia
Other GCC and Middle
East
Europe North America
Latin America
South East Asia
Other countries
Total
20,569,924 - 4 - - 1 - 20,569,929 Cash in hand 4,062,751 - 4 - - 1 - 4,062,756 Balances with SAMA 16,507,173 - - - - - - 16,507,173
1,068,740 101,886 3,431,566 4,503,269 - 9,384 154,656 9,269,501
Current accounts - 65,745 292,694 4,493,210 - 9,384 154,656 5,015,689 Money market placements 1,068,740 36,141 3,138,872 10,059 - - - 4,253,812
142,307 - 55,232 - - - - 197,539 29,127,631 1,006,830 3,730,285 9,348,827 7,041 729,476 815,314 44,765,404
Available for sale 1,350,790 9,282 3,730,285 9,348,827 7,041 629,476 646,764 15,722,465 Held to maturity 44,876 - - - - - - 44,876 Other investments held at amortised cost
27,731,965 997,548 - - - 100,000 168,550 28,998,063
388,054 137,077 - - - - - 525,131 141,021,252 2,313,306 423,133 283,948 - 204,866 819,686 145,066,191
Overdraft 10,006,280 301 - - - 69 635 10,007,285 Credit cards 810,932 - - - - - - 810,932 Consumer loans 37,776,744 - - - - - - 37,776,744 Commercial loans 91,217,566 2,312,013 423,133 283,948 - 204,797 819,051 95,260,508 Others 1,209,730 992 - - - - - 1,210,722
409,542 - - 359,526 - - - 769,068 Accounts receivable and others 409,542 - - 359,526 - - - 769,068
192,727,450 3,559,099 7,640,220 14,495,570 7,041 943,727 1,789,656 221,162,763 Total
Cash and balances with SAMA
Due from banks and other financial institutions
Investments, net
Investment in associatesLoans and advances, net
Other assets
Positive fair value of derivatives
Assets
NOTES TO THE CONSOLIDATED FINANCIAL STATEMENTS - continuedFor the years ended December 31, 2016 and 2015
GEOGRAPHICAL CONCENTRATION
2015SAR'000
The distribution by geographical region for major categories of assets, liabilities, commitments and contingencies and credit exposure accountsis as follows:2016SAR'000
Commitments and contingencies
Maximum credit exposure (stated at credit equivalent amounts according to SAMA's prescribed methodology)Derivatives
Commitments and contingencies
Page 38 of 54

RIYAD BANK
29.
a)
Kingdom of Saudi Arabia
Other GCC and Middle
East
Europe North America
Latin America
South East Asia
Other countries
Total
744,252 1,497,760 460,726 677,924 - 10,055 1,108,976 4,499,693
Current accounts 20,445 248,766 176,885 111,577 - 10,055 39,315 607,043 Money market deposits 723,807 1,248,994 283,841 566,347 - - 1,069,661 3,892,650
179,917 3 7,209 - - - - 187,129 163,002,141 2,724,009 1,592,659 172,610 - 1,124 359,590 167,852,133
Demand 71,918,100 299 27,531 - - - 193,613 72,139,543 Saving 316,032 4,688 568 881 - 1,049 10,400 333,618 Time 81,077,691 2,719,022 1,564,560 171,729 - 75 155,577 85,688,654 Other 9,690,318 - - - - - - 9,690,318
8,011,313 - - - - - - 8,011,313 6,175,171 - 36,416 8,401 - 507 - 6,220,495
Accounts payable and others 6,175,171 - 36,416 8,401 - 507 - 6,220,495 178,112,794 4,221,772 2,097,010 858,935 - 11,686 1,468,566 186,770,763
66,542,223 1,337,285 15,307,637 13,064,321 - 5,103,285 4,483,407 105,838,158
Letters of credit 8,219,025 967,502 196,698 - - 5,671 21,433 9,410,329 Letters of guarantee 46,272,941 350,697 14,903,307 10,486,762 - 5,096,803 4,450,211 81,560,721 Acceptances 3,585,202 4,243 32,003 - - 811 11,763 3,634,022 Irrevocable commitments to extend credit
8,465,055 14,843 175,629 2,577,559 - - - 11,233,086
588,699 324,978 266,786 12,819 - - 4,702 1,197,985 Held for trading 587,949 324,978 266,009 12,819 - - 4,702 1,196,458 Held as fair value hedges 750 - 777 - - - - 1,527
42,735,881 672,119 10,325,505 8,381,326 - 3,464,865 3,043,555 68,623,251 Letters of credit 3,588,695 422,443 85,885 - - 2,476 9,358 4,108,857 Letters of guarantee 31,427,030 238,182 10,121,827 7,122,257 - 3,461,578 3,022,434 55,393,308 Acceptances 3,585,202 4,243 32,003 - 811 11,763 3,634,022 Irrevocable commitments to extend credit
4,134,954 7,251 85,790 1,259,069 - - - 5,487,064
Derivatives
Commitments and contingencies
LiabilitiesDue to banks and other financial institutions
Customer deposits
Debt securities in issueOther liabilities
Total
Negative fair value of derivatives
Commitments and contingencies
Maximum credit exposure (stated at credit equivalent amounts according to SAMA's prescribed methodology)
2015SAR'000
NOTES TO THE CONSOLIDATED FINANCIAL STATEMENTS - continuedFor the years ended December 31, 2016 and 2015
GEOGRAPHICAL CONCENTRATION
The distribution by geographical region for major categories of assets, liabilities, commitments and contingencies and credit exposure accountsis as follows:
Page 39 of 54

RIYAD BANK
29.b)
2016 2015 2016 2015SAR'000 SAR'000 SAR'000 SAR'000
Commercial Loans* 986,321 1,245,391 (1,463,106) (799,134) Consumer Loans 171,701 113,352 (42,060) (27,264)
1,158,022 1,358,743 (1,505,166) (826,398)*Includes overdrafts
30.
NOTES TO THE CONSOLIDATED FINANCIAL STATEMENTS - continuedFor the years ended December 31, 2016 and 2015
GEOGRAPHICAL CONCENTRATION
a) Market Risk - Trading BookThe Bank has set limits (both VaR and exposure based limits) for the acceptable level of risks in managing the trading book. In order to manage themarket risk in trading book, the Bank applies a VaR methodology to assess the market risk positions held and also to estimate the potentialeconomic loss based on a set of assumptions and changes in market conditions.
Non-performing loans and advances, net
Allowance for credit losses
Kingdom of Saudi Arabia
The distribution by geographical concentration of non-performing loans and advances and provision for credit losses are as follows:
Total
MARKET RISK Market Risk is the risk that the fair value or future cash flows of the financial instruments will fluctuate due to changes in market variables such asspecial commission rates, foreign exchange rates, commodity and equity prices. The Bank classifies exposures to market risk into either trading ornon-trading/ banking-book. The market risk for the trading book is managed and monitored using a VaR methodology. Market risk for the non-trading book is managed and monitored using a combination of VaR, stress testing and sensitivity analysis.
Page 40 of 54

RIYAD BANK
30.
Foreign exchange
rate risk
Special commission
rate risk
Equity price risk
Overall risk
3.64 0.19 0.00 3.624.79 0.79 0.00 4.97
35.14 6.34 0.00 35.100.20 0.08 0.00 0.22
Foreign exchange
rate risk
Special commission
rate risk
Equity price risk
Overall risk
33.19 4.00 0.00 33.585.72 3.12 0.00 6.66
42.30 4.48 0.00 41.380.66 1.50 0.00 2.12
`
Minimum VaR for 2015
The Bank’s VaR related information for the year ended December 31, 2016 and 2015 using a 1 day holding period at 99% confidence interval is asunder. All the figures are in million SAR:
Average VaR for 2015
A VaR methodology estimates the potential negative change in market value of a portfolio at a given confidence level and over a specified timehorizon. The Bank uses variance-covariance approach for calculating VaR for trading book based on historical data (of 1 year). VaR models areusually designed to measure the market risk in a normal market environment and therefore the use of VaR has limitations because it is based onhistorical correlations and volatilities in market prices and assumes that the future movements will follow a statistical distribution.
Maximum VaR for 2016Minimum VaR for 2016
2015
Average VaR for 2016
NOTES TO THE CONSOLIDATED FINANCIAL STATEMENTS - continued
Maximum VaR for 2015
VaR as at December 31, 2015
For the years ended December 31, 2016 and 2015
2016
VaR as at December 31, 2016
MARKET RISK
The VaR represents the risk of portfolios at the close of a business day, and it does not account for any losses that may occur beyond the definedconfidence interval. The actual trading results however, may differ from the VaR calculations and, in particular, the calculation does not provide ameaningful indication of profits and losses in stressed market conditions.To overcome the VaR limitations mentioned above, the Bank also carries out stress tests of both non-trading and trading portfolios to simulateconditions outside normal confidence intervals using six stress scenarios for the entire Bank. The potential losses occurring under stress testconditions are reported regularly to the Bank's Asset Liability Committee (ALCO) for their review.
This means that the VaR that the Bank measures is an estimate (using a confidence level of 99% of the potential loss) that is not expected to beexceeded if the current market positions were to be held unchanged for 1 or 10 days. The use of 99% confidence level depicts that within a 1-dayhorizon, losses exceeding VaR figure should occur, on average, not more than once every hundred days.
The Bank calculates VaR on the basis of the following:1. 10 days holding period at 99% confidence interval for regulatory capital computation (under IMA approach of Basel II Accord that the Bank plansto adopt in the future)2. 1 day holding period at 99% confidence interval for internal reporting and for disclosure purposes.
a) Market Risk - Trading Book (continued)
Page 41 of 54

RIYAD BANK
30.
i)
2016
6 months or less
1 year or less
1-5 years Over 5 years
+ 100 187.20 - - - - - + 100 (48.26) (1.18) (1.68) (52.09) (276.59) (331.55)+ 100 (7.55) (0.42) (0.12) (5.40) (4.45) (10.39)+ 100 (5.45) (0.15) (0.74) (2.13) (1.35) (4.38)+ 100 2.31 (0.04) - (0.08) (0.00) (0.12)+ 100 (0.45) (0.06) (0.06) (1.09) (0.06) (1.27)
6 months or less
1 year or less
1-5 years Over 5 years
- 100 (187.39) - - - - - - 100 48.34 1.18 1.68 52.09 276.59 331.55 - 100 (0.03) 0.42 0.12 5.40 4.45 10.39 - 100 4.14 0.15 0.74 2.13 1.35 4.38 - 100 (2.22) 0.04 - 0.08 0.00 0.12 - 100 0.46 0.06 0.06 1.09 0.06 1.27
NOTES TO THE CONSOLIDATED FINANCIAL STATEMENTS - continued
SAR
Increase in basispoints
MARKET RISK (continued)b) Market Risk - Non-trading or Banking Book
Special commission rate riskSpecial commission rate risk arises from the possibility that the changes in special commission rates will affect either the fair values or thefuture cash flows of the financial instruments. The Bank has established Net special commission Income at Risk and Market Value at Risk(MVaR) limits that are monitored by ALCO. There are gap limits to accommodate Forward FX and Money Market for all currencies. The Bankmonitors positions daily and uses hedging strategies to ensure maintenance of positions within the established gap limits. The following table depicts the sensitivity to a reasonable possible change in special commission rates, with other variables held constant, onthe Bank’s consolidated statement of income or equity. The sensitivity of the income is the effect of the assumed changes in special commission rates on the net special commission income for oneyear, on the non-trading financial assets and financial liabilities held as at December 31, 2016 and 2015, including the effect of hedginginstruments. The sensitivity of equity is calculated by revaluing the fixed rate Available for sale financial assets, including the effect of any associatedhedges as at December 31, 2016 and 2015 for the effect of assumed changes in special commission rates. The sensitivity of equity isanalysed by maturity of the asset or swap. All the banking book exposures are monitored and analysed in currency concentrations andrelevant sensitivities are disclosed in SAR million.
Currency Decrease in basispoints
Sensitivity of special
commission income
Sensitivity of equity Total
GBPJPY
For the years ended December 31, 2016 and 2015
TotalCurrency Sensitivity of special
commission income
Sensitivity of equity
EURUSD
SAR
Others
USD
Others
EURGBPJPY
Page 42 of 54

30.
i) 2015
6 months or less
1 year or less 1-5 years Over 5 years
+ 100 58.4 - - - - - + 100 (94.1) (1.37) (1.21) (50.60) (294.58) (347.76)+ 100 (3.2) (0.67) (0.80) (10.02) (7.87) (19.35)+ 100 (9.4) (0.09) (0.07) (3.66) (0.45) (4.27)+ 100 3.1 - (0.15) (0.42) (0.01) (0.59)+ 100 (0.6) - (0.02) (0.53) (0.02) (0.57)
6 months or less
1 year or less 1-5 years Over 5 years
- 100 (59.6) - - - - - - 100 85.5 1.37 1.21 50.60 294.58 347.76 - 100 0.1 0.67 0.80 10.02 7.87 19.35
GBP - 100 8.9 0.09 0.07 3.66 0.45 4.27 JPY - 100 (3.1) - 0.15 0.42 0.01 0.59
- 100 0.5 - 0.02 0.53 0.02 0.57
NOTES TO THE CONSOLIDATED FINANCIAL STATEMENTS - continued
The Bank manages exposure to the effects of various risks associated with fluctuations in the prevailing levels of market special commissionrates on its financial position and cash flows. The Bank is exposed to special commission rate risk as a result of mismatches or gaps in theamounts of assets and liabilities and off statement of financial position instruments that mature or re-price in a given period. The Bankmanages this risk by matching the re-pricing of assets and liabilities through risk management strategies.
SARUSD
Others
EUR
Decrease in basispoints
Sensitivity of special
commission income
Special commission sensitivity of assets, liabilities and off statement of financial position items
For the years ended December 31, 2016 and 2015
Currency
Others
Special commission rate risk
MARKET RISK (continued)b) Market Risk - Non-trading or Banking Book
SAR
Increase in basispoints
Sensitivity of special
commission income
Sensitivity of equity Total
Currency
USD EUR
Total Sensitivity of equity
GBPJPY
Page 43 of 54

RIYAD BANK
30.
i) Special commission rate risk (continued)
Within 3 months
3-12 months
1-5 years
Over 5 years
Non special commission
bearing
Total
8,750,000 - - - 12,512,177 21,262,177 - - - - 4,307,682 4,307,682
8,750,000 - - - 8,204,495 16,954,495 3,523,483 385,000 - - 658,672 4,567,155 556,355 - - - 658,672 1,215,027 2,967,128 385,000 - - - 3,352,128 113,257 16,958 39,299 19,781 - 189,295 16,764,616 6,199,724 10,973,382 8,795,085 2,424,574 45,157,381 2,153,633 1,105,243 5,659,149 4,671,388 2,424,574 16,013,987 32 1,466 - - - 1,498 14,610,951 5,093,015 5,314,233 4,123,697 - 29,141,896
- - - - 548,594 548,594 58,371,418 39,257,249 28,149,567 17,131,133 - 142,909,367 9,246,602 - - - - 9,246,602 744,747 - - - - 744,747 210,797 524,858 20,459,177 16,650,384 - 37,845,216 47,980,701 38,732,391 7,690,390 480,749 - 94,884,231 188,571 - - - - 188,571
- - - - 245,017 245,017 - - - - 1,862,349 1,862,349
293,437 - - - 584,229 877,666 293,437 - - - 584,229 877,666 87,816,211 45,858,931 39,162,248 25,945,999 18,835,612 217,619,001
7,491,499 306,925 - - 1,038,289 8,836,713 - - - - 1,038,289 1,038,289
7,491,499 306,925 - - - 7,798,424 93,081 17,134 11,580 16,843 - 138,638 54,853,528 13,932,939 43,929 - 87,852,953 156,683,349 693,956 - - - 77,153,025 77,846,981 324,982 - - - - 324,982 53,834,590 13,932,939 43,929 - - 67,811,458
- - - - 10,699,928 10,699,928 4,015,672 4,002,701 - - - 8,018,373
- - - - 6,168,867 6,168,867 - - - - 6,168,867 6,168,867 - - - - 37,773,061 37,773,061
66,453,780 18,259,699 55,509 16,843 132,833,170 217,619,001 21,362,431 27,599,232 39,106,739 25,929,156 (113,997,558) -
- - - - -
21,362,431 27,599,232 39,106,739 25,929,156 (113,997,558) 21,362,431 48,961,663 88,068,402 113,997,558 -
MARKET RISK (continued)
Balances with SAMA
Current accounts
The table below summarises the Group’s exposure to special commission rate risks. Included in the table are the Group’s assets and liabilities atcarrying amounts, categorised by the earlier of contractual re-pricing or the maturity dates.
Money market placements
Due from banks and other financial institutions
NOTES TO THE CONSOLIDATED FINANCIAL STATEMENTS - continued
Accounts payable and others
SavingTimeOther
Investment in associatesLoans and advances, net
OverdraftCredit cards
Held to maturity
Demand
Consumer loansCommercial loans
For the years ended December 31, 2016 and 2015
Assets Cash and balances with SAMA
Current accounts
Others
Money market deposits
Other real estate
Accounts receivable and others
Available for saleInvestments, net Positive fair value of derivatives
Total liabilities and shareholders’ equity
Total assets
b) Market Risk - Non-trading or Banking Book (continued)
Other liabilities
Due to banks and other financial institutionsLiabilities and shareholders’ equity
Debt securities in issue
Customer deposits
Shareholders’ equity
Other assetsProperty and equipment, net
Cash in hand
Other investments held at amortised cost
2016SAR'000
Special commission rate sensitivity -On statement of financial position gapSpecial commission rate sensitivity -Off statement of financial position gapTotal special commission rate sensitivity gapCumulative special commission rate sensitivity gap
Negative fair value of derivatives
Page 44 of 54

RIYAD BANK
30.
i) Special commission rate risk (continued)Within 3 months
3-12 months
1-5 years
Over 5 years
Non special commission
bearing
Total
7,709,595 - - - 12,860,334 20,569,929 - - - - 4,062,756 4,062,756
7,709,595 - - - 8,797,578 16,507,173 8,211,214 - - - 1,058,287 9,269,501 3,957,402 - - - 1,058,287 5,015,689 4,253,812 - - - - 4,253,812 131,715 9,490 44,850 11,484 - 197,539 14,834,087 8,681,085 9,728,394 8,768,962 2,752,876 44,765,404 2,161,342 1,068,726 5,116,648 4,622,873 2,752,876 15,722,465 15,795 27,682 1,399 - - 44,876 12,656,950 7,584,677 4,610,347 4,146,089 - 28,998,063
- - - - 525,131 525,131 57,020,002 40,427,626 31,268,839 16,349,724 - 145,066,191 10,007,285 - - - - 10,007,285 810,932 - - - - 810,932 250,459 406,502 21,603,536 15,516,247 - 37,776,744 44,740,604 40,021,124 9,665,303 833,477 - 95,260,508 1,210,722 - - - - 1,210,722
- - - - 258,411 258,411 - - - - 1,894,701 1,894,701
254,250 - - - 514,818 769,068 254,250 - - - 514,818 769,068 88,160,863 49,118,201 41,042,083 25,130,170 19,864,558 223,315,875
3,892,650 - - - 607,043 4,499,693 - - - - 607,043 607,043
3,892,650 - - - - 3,892,650 149,687 10,258 20,728 6,456 - 187,129 74,066,076 13,160,599 150,334 - 80,475,124 167,852,133 1,354,737 - - - 70,784,806 72,139,543 333,618 - - - - 333,618 72,377,721 13,160,599 150,334 - - 85,688,654
- - - - 9,690,318 9,690,318 4,009,762 4,001,551 - - - 8,011,313
- - - - 6,220,495 6,220,495 - - - - 6,220,495 6,220,495 - - - - 36,545,112 36,545,112
82,118,175 17,172,408 171,062 6,456 123,847,774 223,315,875 6,042,688 31,945,793 40,871,021 25,123,714 (103,983,216) -
- - - - -
6,042,688 31,945,793 40,871,021 25,123,714 (103,983,216) 6,042,688 37,988,481 78,859,502 103,983,216 -
Accounts payable and others
Total assets
DemandSavingTime
NOTES TO THE CONSOLIDATED FINANCIAL STATEMENTS - continued
Total liabilities and shareholders’ equitySpecial commission rate sensitivity -On statement of financial position gapSpecial commission rate sensitivity -Off statement of financial position gapTotal special commission rate sensitivity gapCumulative special commission rate sensitivity gap
Shareholders’ equity
Liabilities and shareholders’ equityDue to banks and other financial institutions
Current accounts Money market deposits
Customer deposits
Other liabilities
Property and equipment, net
Other investments held at amortised costInvestment in associates
Loans and advances, net OverdraftCredit cards
Held to maturity
Consumer loansCommercial loansOthers
Other real estate
OtherDebt securities in issue
Negative fair value of derivatives
Other assetsAccounts receivable and others
Money market placements
Investments, net Available for sale
2015SAR'000
Assets Cash and balances with SAMA
Cash in hand
Positive fair value of derivatives
b) Market Risk - Non-trading or Banking Book (continued)
For the years ended December 31, 2016 and 2015MARKET RISK (continued)
Balances with SAMA
Current accountsDue from banks and other financial institutions
Page 45 of 54

RIYAD BANK
30.
ii)
± 1 ± 5.94± 1 ± 0.32
GBP ± 1 ± 0.02JPY ± 1 ± 0.14Others ± 1 ± 0.01
± 1 ± 5.40± 1 ± 0.46
GBP ± 1 ± 0.1JPY ± 1 ± 0.17Others ± 1 ± 0.007
iii)
2016Long (short)
SAR'000
2015Long (short)
SAR'000US Dollar 607,562 970,636 Japanese 467 329 Euro (160) (68)Pound 41 3,872 Other 41,176 18,833
Change in currency rate in
%
Foreign currency risk
Effect on net income
USD EUR
The Bank manages exposure to effects of fluctuations in prevailing foreign currency exchange rates on its financial position and cash flows.The Board of Directors sets limits on the level of exposure by currency and in total for overnight positions, which are monitored daily. At theend of the year, the Bank had the following significant net exposures denominated in foreign currencies:
MARKET RISK (continued)
For the years ended December 31, 2016 and 2015NOTES TO THE CONSOLIDATED FINANCIAL STATEMENTS - continued
b) Market Risk - Non-trading or Banking BookCurrency risk
Currency risk represents the risk of change in the value of financial instruments due to changes in foreign exchange rates. The Board has setlimits on positions by currencies, which are monitored daily, and hedging strategies are also used to ensure that positions are maintainedwithin the limits.
Change in currency rate
in %
Effect on net income
The table below shows the currencies to which the Bank has a significant exposure as at December 31, 2016 and 2015 on its non-tradingmonetary assets and liabilities and forecasted cash flows. The analysis calculates the effect of reasonable possible movement of thecurrency rate against SAR, with all other variables held constant, on the consolidated statement of income(due to the fair value of thecurrency sensitive non-trading monetary assets and liabilities) and equity (due to change in fair value of currency swaps and forward foreignexchange contracts used as cash flow hedges). A positive effect shows a potential increase in consolidated statement of income or equity;whereas a negative effect shows a potential net reduction in consolidated statement of income or equity.
Currency ExposuresAs at December 31, 2016(SAR million)USD
Long position indicates that assets in a foreign currency are higher than the liabilities in the same currency; the opposite applies to shortposition.
Currency ExposuresAs at December 31, 2015(SAR million)
EUR
Page 46 of 54

RIYAD BANK
30.
iv)
+5 46.46 +5 49.35 +10 92.93 +10 98.69 -5 (46.46) -5 (49.35)-10 (92.93) -10 (98.69)
31.
All liquidity policies and procedures are subject to review and approval by ALCO. Daily reports cover the liquidity position of the Group. A summaryreport, including any exceptions and remedial action taken, is submitted regularly to ALCO.
Management monitors the maturity profile to ensure that adequate liquidity is maintained. The daily liquidity position is monitored and regularliquidity stress testing is conducted under a variety of scenarios covering both normal and more severe market conditions.
In accordance with Banking Control Law and the regulations issued by SAMA, the Bank maintains a statutory deposit with SAMA equal to 7%(2015: 7%) of total demand deposits and 4% (2015: 4%) of saving and time deposits. In addition to the statutory deposit, the Bank also maintainsliquid reserves of not less than 20% of its deposit liabilities, in the form of cash, gold, Saudi Government Development Bonds or assets which canbe converted into cash within a period not exceeding 30 days. The Bank has the ability to raise additional funds through repo facilities with SAMAup to 75 % of the nominal value of bonds held by the Bank.
Banking Book - Equity Price riskEquity risk refers to the risk of decrease in fair values of equities in the Bank’s non-trading investment portfolio as a result of reasonablepossible changes in levels of equity indices and the value of individual stocks.The effect on the Bank’s equity investments held as available for sale due to reasonable possible change in equity indices, with all othervariables held constant, is as follows:Market Index December 31, 2016 December 31, 2015
LIQUIDITY RISKLiquidity risk is the risk that the Bank will be unable to meet its net funding requirements. Liquidity risk can be caused by market disruptions orcredit downgrades, which may cause certain sources of funding to dry up immediately. To mitigate this risk, management has diversified fundingsources and assets are managed with liquidity in mind, maintaining an appropriate balance of cash, cash equivalents and readily marketablesecurities.
Change in equity index %
Effect in SAR millions
NOTES TO THE CONSOLIDATED FINANCIAL STATEMENTS - continuedFor the years ended December 31, 2016 and 2015
Change in equity index %
Effect in SAR millions
Tadawul
MARKET RISK (continued)b) Market Risk - Non-trading or Banking Book (continued)
Page 47 of 54

RIYAD BANK
31.a)
Within 3 months
3-12 months 1-5 years
Over 5 years
Total
8,531,067 307,212 - - 8,838,279 1,038,289 - - - 1,038,289 7,492,778 307,212 - - 7,799,990 142,928,377 13,989,411 45,051 - 156,962,839
77,846,981 - - - 77,846,981 324,984 - - - 324,984 54,056,484 13,989,411 45,051 - 68,090,946 10,699,928 - - - 10,699,928 63,647 190,942 4,953,404 4,458,786 9,666,779 4,668,650 106,745 339,740 43,826 5,158,961
36,623 106,363 339,740 43,826 526,552 382 382 - - 764 4,631,645 - - - 4,631,645 156,191,741 14,594,310 5,338,195 4,502,612 180,626,858
Within 3 months
3-12 months 1-5 years
Over 5 years
Total
4,501,213 - - - 4,501,213 607,043 - - - 607,043
3,894,170 - - - 3,894,170 154,688,417 13,206,444 153,380 - 168,048,241 72,139,543 - - - 72,139,543 334,743 492 - - 335,235 72,523,813 13,205,952 153,380 - 85,883,145 9,690,318 - - - 9,690,318 36,775 110,325 4,619,335 4,344,476 9,110,911
5,030,193 72,315 237,758 51,965 5,392,231
23,172 70,784 237,290 51,965 383,211 691 1,531 468 - 2,690
5,006,330 - - - 5,006,330 164,256,598 13,389,084 5,010,473 4,396,441 187,052,596
NOTES TO THE CONSOLIDATED FINANCIAL STATEMENTS - continued
Held as fair value hedges
DemandSavingTimeOther
Held for trading
Debt securities in issue
Customer deposits
Due to banks and other financial institutionsFinancial liabilities
2016SAR'000
For the years ended December 31, 2016 and 2015
LIQUIDITY RISK (continued)
Current accountsMoney market deposits
Derivative financial instruments (gross contractual amounts payable)
Held for trading
Financial liabilities
2015SAR'000
Current accountsMoney market deposits
Customer deposits
Due to banks and other financial institutions
Total undiscounted financial liabilities
Derivative financial instruments (gross contractual amounts payable)
The table below summarises the maturity profile of the Group's financial liabilities at December 31, 2016 and 2015 based on contractualundiscounted repayment obligations. As special commission payments up to contractual maturity are included in the table, totals do notmatch with the consolidated statement of financial position. The contractual maturities of liabilities have been determined based on theremaining period at the reporting date to the contractual maturity date and do not take into account the effective expected maturities. TheGroup expects that many customers will not request repayment on the earliest date the Group could be required to pay and the table doesnot affect the expected cash flows indicated by the Bank's deposit retention history. The undiscounted maturity profile of the financial liabilitiesis as follows:
Accrued expense and account payable
Held as fair value hedges
Total undiscounted financial liabilities
DemandSavingTimeOther
Debt securities in issue
Accrued expense and account payable
Page 48 of 54

RIYAD BANK
31.b)
Within 3 months
3-12 months 1-5 years
Over 5 years
No fixed maturity
Total
13,057,682 - - - 8,204,495 21,262,177 4,307,682 - - - - 4,307,682 8,750,000 - - - 8,204,495 16,954,495 4,182,155 385,000 - - - 4,567,155 1,215,027 - - - - 1,215,027 2,967,128 385,000 - - - 3,352,128 113,257 16,958 39,299 19,781 - 189,295 8,466,578 3,167,390 13,475,462 17,623,377 2,424,574 45,157,381 689,234 1,031,499 6,258,314 5,610,366 2,424,574 16,013,987 32 1,466 - - - 1,498 7,777,312 2,134,425 7,217,148 12,013,011 - 29,141,896
- - - - 548,594 548,594 41,232,437 23,694,432 40,561,793 37,420,705 - 142,909,367 9,246,602 - - - - 9,246,602 744,747 - - - - 744,747 210,797 524,858 20,459,177 16,650,384 - 37,845,216 30,882,402 23,135,545 20,095,963 20,770,321 - 94,884,231 147,889 34,029 6,653 - - 188,571
- - - - 245,017 245,017 - - - - 1,862,349 1,862,349
293,437 - - - 584,229 877,666 293,437 - - - 584,229 877,666 67,345,546 27,263,780 54,076,554 55,063,863 13,869,258 217,619,001
8,529,788 306,925 - - - 8,836,713 1,038,289 - - - - 1,038,289 7,491,499 306,925 - - - 7,798,424 93,081 17,134 11,580 16,843 - 138,638 142,706,481 13,932,938 43,930 - - 156,683,349 77,846,981 - - - - 77,846,981 324,982 - - - - 324,982 53,834,590 13,932,938 43,930 - - 67,811,458 10,699,928 - - - - 10,699,928
- - 4,015,672 4,002,701 - 8,018,373 - - - - 6,168,867 6,168,867 - - - - 6,168,867 6,168,867 - - - - 37,773,061 37,773,061
151,329,350 14,256,997 4,071,182 4,019,544 43,941,928 217,619,001
Cash and balances with SAMA
Balances with SAMACash in hand
2016SAR'000Assets
NOTES TO THE CONSOLIDATED FINANCIAL STATEMENTS - continued
The table below summarises the maturity profile of the Group’s assets and liabilities. The contractual maturities of assets and liabilities havebeen determined on the basis of the remaining period at the reporting date to the contractual maturity date and do not take account of theeffective maturities as indicated by the Bank’s deposit retention history. The amounts disclosed in the table are the contractual undiscountedcash flows, whereas the Bank manages the inherent liquidity risk based on expected undiscounted cash inflows.
Accounts payable and others
Investment in associatesLoans and advances, net
Debt securities in issueOther liabilities
Other investments held at amortised cost
OverdraftCredit cards
Liabilities and shareholders’ equityDue to banks and other financial institutions
For the years ended December 31, 2016 and 2015
LIQUIDITY RISK (continued)
Held to maturity
Shareholders’ equity
Commercial loansOthers
Other
Other real estateProperty and equipment, netOther assets
Consumer loans
Accounts receivable and others
Due from banks and other financial institutionsCurrent accountsMoney market placements
Total assets
Time
Current accountsMoney market deposits
DemandSaving
Total liabilities and shareholders’ equity
Customer deposits
Positive fair value of derivatives
Negative fair value of derivatives
Investments, net Available for sale
Page 49 of 54

RIYAD BANK
31.
Within 3 months
3-12 months 1-5 years
Over 5 years
No fixed maturity
Total
11,772,351 - - - 8,797,578 20,569,929 4,062,756 - - - - 4,062,756 7,709,595 - - - 8,797,578 16,507,173 9,269,501 - - - - 9,269,501 5,015,689 - - - - 5,015,689 4,253,812 - - - - 4,253,812 131,714 9,490 44,850 11,485 - 197,539 8,552,526 8,929,526 11,996,146 12,534,330 2,752,876 44,765,404 811,293 903,386 5,834,400 5,420,510 2,752,876 15,722,465 15,795 27,682 1,399 - - 44,876 7,725,438 7,998,458 6,160,347 7,113,820 - 28,998,063
- - - - 525,131 525,131 40,968,509 25,476,159 43,713,260 34,908,263 - 145,066,191 10,007,285 - - - - 10,007,285 810,932 - - - - 810,932 81,698 575,263 21,603,536 15,516,247 - 37,776,744 29,752,123 24,017,996 22,098,373 19,392,016 - 95,260,508
316,471 882,900 11,351 - - 1,210,722 - - - - 258,411 258,411 - - - - 1,894,701 1,894,701
254,250 - - - 514,818 769,068 254,250 - - - 514,818 769,068 70,948,851 34,415,175 55,754,256 47,454,078 14,743,515 223,315,875
4,499,693 - - - - 4,499,693 607,043 - - - - 607,043 3,892,650 - - - - 3,892,650 149,688 10,258 20,728 6,455 - 187,129 154,541,199 13,160,599 150,335 - - 167,852,133 72,139,543 - - - - 72,139,543 333,618 - - - - 333,618 72,377,720 13,160,599 150,335 - - 85,688,654 9,690,318 - - - - 9,690,318
- - 4,009,762 4,001,551 - 8,011,313 - - - - 6,220,495 6,220,495 - - - - 6,220,495 6,220,495 - - - - 36,545,112 36,545,112
159,190,580 13,170,857 4,180,825 4,008,006 42,765,607 223,315,875
Other real estate
Negative fair value of derivatives
Current accountsMoney market deposits
Credit cardsConsumer loans
Property and equipment, net
Accounts receivable and others
NOTES TO THE CONSOLIDATED FINANCIAL STATEMENTS - continued
Assets available to meet all of the liabilities and to cover outstanding loan commitments include cash, balances with SAMA, items in the courseof collection; loans and advances to banks; and loans and advances to customers. The cumulative maturities of commitments and contingenciesis given in note 19 c) (i).
Due from banks and other financial institutions
Customer depositsDemandSavingTimeOther
Debt securities in issue
Other assets
Total assetsLiabilities and shareholders’ equity
Due to banks and other financial institutions
Commercial loansOthers
Total liabilities and shareholders’ equity
Other liabilities
Shareholders’ equityAccounts payable and others
For the years ended December 31, 2016 and 2015
LIQUIDITY RISK (continued)
2015SAR'000Assets
Overdraft
Cash and balances with SAMA Cash in hand Balances with SAMA
Current accountsMoney market placements
Investments, net Available for saleHeld to maturityOther investments held at amortised cost
Investment in associatesLoans and advances, net
Positive fair value of derivatives
Page 50 of 54

RIYAD BANK
32.
Available for sale investments 15,478,675 268,663 266,649 16,013,987 Positive fair value derivatives - 189,295 - 189,295
Due from banks and other financial institutions - 4,567,155 - 4,567,155 Held to maturity investments - 1,513 - 1,513 Other investments at amortised cost - 29,171,710 - 29,171,710 Loans and advances - 146,736,813* - 146,736,813
Negative fair value derivatives - 138,638 - 138,638
Due to banks and other financial institutions - 8,836,713 - 8,836,713 Customer deposits - 156,683,349 - 156,683,349 Debt securities in issue - 8,018,373 - 8,018,373
Available for sale investments 14,589,396 880,063 253,006 15,722,465 Positive fair value derivatives - 197,539 - 197,539
Due from banks and other financial institutions - 9,269,501 - 9,269,501 Held to maturity investments - 45,304 - 45,304 Other investments at amortised cost - 29,208,074 - 29,208,074 Loans and advances - 149,221,355* - 149,221,355
Negative fair value derivatives - 187,129 - 187,129
Due to banks and other financial institutions - 4,499,693 - 4,499,693 Customer deposits - 167,852,133 - 167,852,133 Debt securities in issue - 8,011,313 - 8,011,313
NOTES TO THE CONSOLIDATED FINANCIAL STATEMENTS - continued
TotalSAR’ 000Financial assets measured at fair value
2015 Level 1
For the years ended December 31, 2016 and 2015
FAIR VALUE OF FINANCIAL ASSETS AND LIABILITIES
Level 1
Financial assets not measured at fair value
Financial liabilities measured at fair value
Financial liabilities not measured at fair value
Financial assets measured at fair value
The Group uses the following hierarchy for determining and disclosing the fair value of financial instruments:Level 1: quoted market price: financial instruments with quoted unadjusted prices for identical instruments in active markets.Level 2: quoted prices in active markets for similar assets and liabilities or other valuation techniques for which all significant inputs are based onobservable market data: and
Level 3
Level 3: valuation techniques for which any significant input is not based on observable market data.
SAR’ 000Total2016
Fair value and fair value hierarchyLevel 2
*The management uses discounted cash flow method, using the current yield curve adjusted for credit risk spreads to arrive at the fair value ofloans and advances. Cash and balances with SAMA, due from banks with maturity of less than 90 days and other short term receivable areassumed to have fair values that reasonably approximate their corresponding carrying values due to the short-term nature.
Financial liabilities not measured at fair value
Level 2 Level 3
Financial assets not measured at fair value
Financial liabilities measured at fair value
Page 51 of 54

RIYAD BANK
32.
2016 2015 SAR’ 000 SAR’ 000
253,006 147,714
(252) (1,955) 13,293 6,881 - (934)
602 101,300 266,649 253,006
33.
2016 2015SAR'000 SAR'000
a) 3,689,358 4,336,236 21,028,373 51,299,804 779 1,876 2,445,228 2,458,247
Executive end of service 57,289 68,371
b) 179,000 169,864
NOTES TO THE CONSOLIDATED FINANCIAL STATEMENTS - continued
Reconciliation of movement in Level 3
Redemptions
FAIR VALUES OF FINANCIAL ASSETS AND LIABILITIES (continued)
- recognised in other comprehensive income - recognised in consolidated statement of incomeTotal gains or losses
For the years ended December 31, 2016 and 2015
There were no transfers between the fair value hierarchy levels. Although the Bank believes that its estimates of fair value of Level 3 securities are appropriate, the use of different methodologies or assumptionscould lead to different measurements of fair value. Level 3 consists of local and international unquoted equity securities. Bank uses net assetsvaluation method based on most recent available audited financial statements to fair value these investments. Other methodology that could beused to value the securities is discounted cash flow model based on expected dividend yield for which no data is available. Therefore potentialimpact of using reasonably possible alternative assumptions for the valuation techniques is not quantified.
Loans and advancesCustomer deposits
RELATED PARTY TRANSACTIONS
Directors, key management personnel, other major shareholders' and their affiliates:
In the ordinary course of its activities, the Bank transacts business with related parties. Related party transactions are governed by the limits set bythe Banking Control Law and regulations issued by SAMA. The balances at December 31 resulting from such transactions are as follows:
Fair value is the price that would be received to sell an asset or paid to transfer a liability in an orderly transaction between market participants atthe measurement date. The fair value measurement is based on the presumption that the transaction to sell the asset or transfer the liability takesplace either:a) In the principal market for the asset or liability, orb) In the absence of a principal market, in the most advantageous accessible market for the asset or liability.
Opening balance
Closing balancePurchases
Customer deposits
Derivatives asset (at fair value)
Bank’s mutual funds:
Key management personnel are those persons, including a non-executive director, having authority and responsibility for planning, directing andcontrolling the activities of the Bank, directly or indirectly.Other major shareholders represent shareholdings of 5% or more of the Bank’s issued share capital.
Commitments and contingencies (irrevocable)
Page 52 of 54

RIYAD BANK
33.
2016 2015SAR'000 SAR'000
121,722 91,412 695,709 323,886 108,663 156,580 6,240 4,705 67,520 65,266 2,646 4,114 23,744 15,112
34.
Capital Ratio Capital RatioSAR'000 % SAR'000 %
37,773,061 16.7% 36,545,112 16.2% 5,072,349 5,072,349 42,845,410 18.9% 41,617,461 18.4%
2016 2015SAR '000s SAR '000s
211,833,031 211,467,649 13,889,563 13,509,713 495,050 1,034,413 226,217,644 226,011,775
35..
NOTES TO THE CONSOLIDATED FINANCIAL STATEMENTS - continued
Tier 2 capital
The Group operates a Staff Savings Investment Plan. Under the terms of the Staff Savings Investment Plan, participating employees of the Bankmake monthly contributions by way of a deduction from their salary subject to a maximum of 15% of their basic salaries. The Bank also contributeson a monthly basis a pre-determined percentage (subject to a maximum of 6%) of the basic salary of an employee based on the varying serviceperiods. The proceeds are invested in the Bank’s existing range of mutual funds for the benefit of the employees.
Tier 1 capital
The cost of the above plan is charged to the consolidated statement of income over the term of the plan.
Total regulatory capital (Tier 1 + Tier 2)
Total Pillar 1 Risk Weighted Assets
STAFF INVESTMENT SAVINGS PLANS
Credit risk weighted assets
Market risk weighted assetsOperational risk weighted assets
Executive end of serviceOther expenses
Top consolidated level
Special commission expenseFees from banking services, net
Executive remuneration and bonus
Risk weighted assets
For the years ended December 31, 2016 and 2015
CAPITAL ADEQUACYThe Group’s objectives when managing capital are to comply with the capital requirements set by SAMA; to safeguard the Group’s ability tocontinue as a going concern; and to maintain a strong capital base.The Group monitors the adequacy of its capital using the methodologies and ratios established by the Basel Committee on Banking Supervisionand as adopted by SAMA, with a view to maintain a sound capital base to support its business development and meet regulatory capitalrequirement as defined by SAMA.The Group management reviews on a periodical basis its capital base and level of risk weighted assets to ensure that capital is adequate for risksinherent in its current business activities and future growth plans. In making such assessments, the management also considers Group’s businessplans along with economic conditions which directly and indirectly affects business environment.SAMA requires holding the minimum level of the regulatory capital of and maintaining a ratio of total regulatory capital to the risk-weighted asset(RWA) at or above the agreed minimum of 8%. SAMA issued the framework and guidance regarding implementation of the capital reforms underBasel III - which was effective from January 1, 2013. Accordingly, the Group’s consolidated Risk Weighted Assets (RWA), total capital and relatedratios on a consolidated Group basis, calculated under the Basel III framework, are as follows:
2016 2015
RELATED PARTY TRANSACTIONS (continued)Income and expenses pertaining to transactions with related parties included in these consolidated financial statements are as follows:
Directors and committees remuneration and expenses
Special commission income
Page 53 of 54

RIYAD BANK
36.
37.
Summary of requirements
Financial instruments 01-Jan-18Revenue from contracts with customers 01-Jan-18Disclosure Initiative 01-Jan-17Classification and Measurement of Share-based Payment Transactions 01-Jan-18Leases 01-Jan-19
38.
39.
NOTES TO THE CONSOLIDATED FINANCIAL STATEMENTS - continuedFor the years ended December 31, 2016 and 2015
ISSUED IFRS BUT NOT YET EFFECTIVE
INVESTMENT MANAGEMENT SERVICESThe Group offers investment management services to its customers, which include management of certain investment funds with assets totalingSAR 17.0 billion (2015: SAR 26.1 billion). The Group’s assets under management include non-special commission based funds amounting to SAR 5.8 billion (2015: SAR 6.8 billion).
COMPARATIVE FIGURES Certain prior year figures have been reclassified to conform to current year presentation.BOARD OF DIRECTORS' APPROVALThese consolidated financial statements were approved by the Board of Directors on 15 Jumada I 1438H (corresponding to February 12, 2017).
The Group has chosen not to early adopt the following new standards which have been issued but not yet effective for the Bank’s accountingyears beginning on or after 1 January 2017 and is currently assessing their impact.Following is a brief on the new IFRS and amendments to IFRS effective for annual periods beginning on or after January 01, 2017.
IFRS 9IFRS 15Amendments to IAS 7Amendments to IFRS 2IFRS 16
Standard, amendment or interpretation
Effective for annual periods beginning on or after
Page 54 of 54