2016 managers’ boot camp - ashp media€¦ · 2016 managers’ boot camp developed by the section...
TRANSCRIPT

2016 Managers’ Boot Camp Developed by the Section of Pharmacy Practice
Managers
Fostering Management Skills and Effective Leadership
The Section of Pharmacy Practice Managers (SPPM) dedicates itself to enabling its members to be successful in effectively managing pharmacy resources, maximizing
the safety of medication use systems, developing staff and future leaders, and promoting the pharmacist's role in patient care.

Managers’ Boot Camp Program Overview
Robert P. Granko, Pharm.D., M.B.A. Director of Pharmacy
Moses H. Cone Memorial Hospital Greensboro, North Carolina

Faculty Introductions Stephen J. Davis, Pharm.D., M.S., Pharmacy Operations Manager, Director, Health System Pharmacy Administration Residency Program, Texas Children's Hospital, Houston, Texas Robert P. Granko, Pharm.D., M.B.A., Director of Pharmacy Services, Moses Cone Hospital, Residency Program Director PGY-2 Health System Pharmacy Administration/MS Program, Cone Health, Greensboro, North Carolina Adam Orsborn, Pharm.D., M.S., Partner, Veldt Community, Winston-Salem, North Carolina Melissa Ortega, Pharm.D., M.S., Director, Pediatrics and Inpatient Pharmacy Operations, Tufts Medical Center and Floating Hospital for Children, Boston, Massachusetts

Faculty Introductions Kate Schaafsma, Pharm.D., M.S., M.B.A., BCPS, Pharmacy Manager, Froedtert & The Medical College of Wisconsin, Milwaukee, Wis. Mark Sullivan, Pharm.D., M.B.A., BCPS, Executive Director, Pharmacy Operations, Vanderbilt University Hospital, Nashville, Tenn. Rebecca A. Taylor, Pharm.D., M.B.A., BCPS, Director, Pharmacy Services, Cleveland Clinic Marymount Hospital, Cleveland, Ohio

Learning Objectives Analyze the impact of health-care reform and how it will change necessary financial skills
that pharmacy leaders will need to measure and communicate business outcomes. How do pharmacy managers effectively lead in the evolving pharmacy enterprise. List key financial and quality indicators that influence health-system administrators’
decisions and how pharmacy leaders can align strategic planning to impact institutional goals.
Develop and apply strategies for advancing pharmacy services through staff engagement and effective personnel management.
Identify the steps required to communicate the value of pharmacy to senior leadership and other key stake holders in the hospital and health system.
Demonstrate the steps to successfully organize and implement a business plan for new or expanded services

Relevant Financial Disclosure Information The faculty and planners report no financial relationships relevant to the
content of this continuing education activity.

Who’s in the Audience? Is this your first boot camp? Your leadership role:
• Is it formal or informal? • Director, manager, clinical coordinator, other? • Length in current leadership role? • Desire to move up?

Pharmacy Leadership – An Evolving Paradigm Health Payment Reform & Shifting Reimbursement Targets Sustained pressure to contain costs, ensure clinical and operational efficiencies and
search for new revenue sources Increasing number and size of multi-hospital health systems Care Delivery Transformation Workforce shifts with increasing number of pharmacists with residency training Broad scale EMR implementation Challenges and costs of HIT The growing complexity and brand management of the pharmacy enterprise

Pharmacy Leadership New managers and directors can be promoted based on
clinical leadership abilities • May not have formal advanced management training
Skill set necessary to be an outstanding clinician differs from that needed to succeed as a clinical leader or manager New clinical leaders often struggle building and selling their
ideas from an administrative perspective • Leads to frustration and eventual demise

Pharmacy Leadership
“A lack of leadership will mean that health-system pharmacy will no longer be in a position to enhance patient safety, to optimize medication therapies across the continuum of care, to make a real difference in the lives of the
patients that we serve”
—Mick Hunt (ASHP Past President)

Influencing Change
Establish a sense of urgency Form a guiding coalition Develop a compelling vision Produce short term results Prepare for and remove obstacles
• Abandon old ways of doing things when they no longer add value
Institutionalize change
Adapted from: Kotter JP. Leading Change: Why Transformation Efforts Fail. Harvard Business Review. 2007.
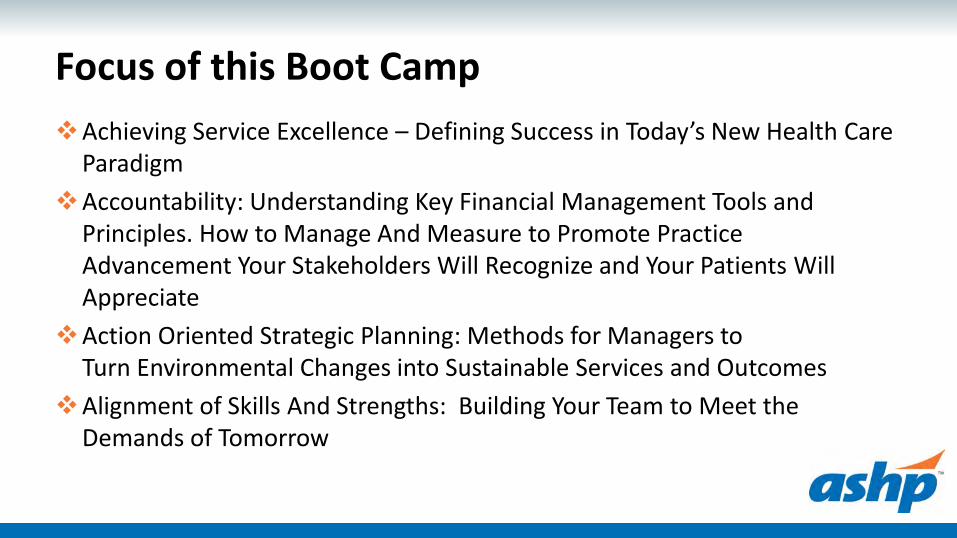
Focus of this Boot Camp Achieving Service Excellence – Defining Success in Today’s New Health Care
Paradigm Accountability: Understanding Key Financial Management Tools and
Principles. How to Manage And Measure to Promote Practice Advancement Your Stakeholders Will Recognize and Your Patients Will Appreciate
Action Oriented Strategic Planning: Methods for Managers to Turn Environmental Changes into Sustainable Services and Outcomes
Alignment of Skills And Strengths: Building Your Team to Meet the Demands of Tomorrow

Managers’ Boot Camp Series of didactic and workshop programming to help pharmacy managers
build practical skills in the following areas: • Promoting value through pharmacy services • Leadership qualities and business acumen • Financial management principles • Effectively leading teams and change • Developing relationships with key stakeholders • Leveraging quality and safety mandates to advance services • Business planning for new services • Project management and implementation • Strategic planning principles

Program Overview Greetings and Boot Camp Overview Part 1
• Achieving service excellence – Defining success in today’s new health care paradigm
• Action Oriented Strategic Planning: Methods for Managers to Turn Environmental Changes into Sustainable Services and Outcomes
Break

Program Overview Part 2
• Workshop #1 (interactive case study) • Accountability: Understanding key financial management tools and
principles. How to manage and measure to promote practice advancement your stakeholders will recognize and your patients will appreciate
• Workshop #2 (interactive case study, continued) Lunch

Program Overview Part 3
• Alignment of skills and strengths – Building your team to meet the demands of tomorrow
• Role Play Case Study - Human Resources • Case Study Part Three
Break Part 4
• Group presentations • Facilitated discussion of presentations • Wrap-up

Achieving Service Excellence: Defining Success in Today’s New Health Care Paradigm
Adam Orsborn, Pharm.D., M.S. Co-founder - Veldt Community, LLC
Co-founder - WilesBolt, LLC Winston-Salem, NC

Objectives Define Service Excellence in terms of the role of a pharmacy
leader Describe where to get your next “Big Idea” Analyze the impact of healthcare reform and how it affects
finances so that pharmacy leaders develop appropriate measures to communicate business outcomes. Discuss methods for making innovation happen in your
department

What are you doing here?
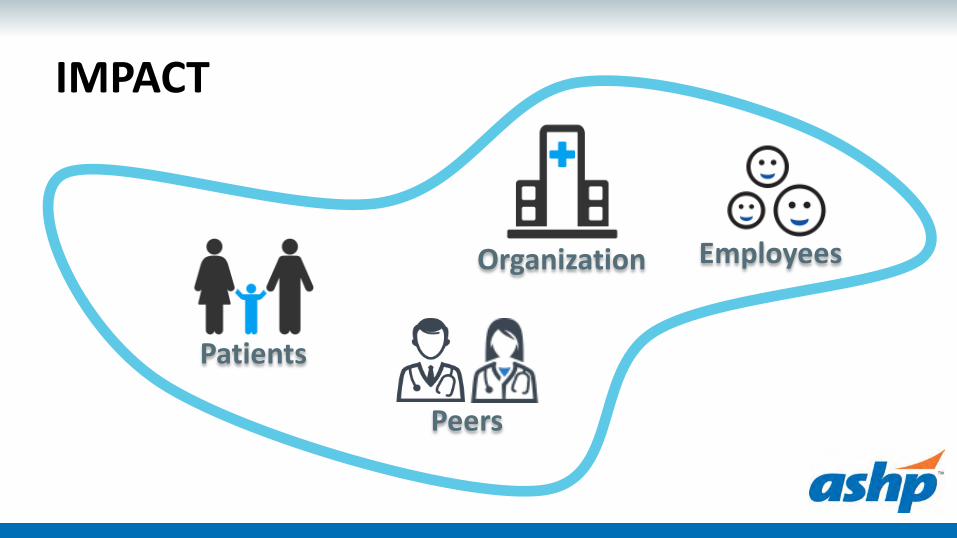
IMPACT
Patients
Peers
Organization Employees

Achieving Excellence is…

The Big Idea
Innovation Part 1

Where do you get your Big Idea? Institute for
Healthcare Improvement
patient perspective boss
clinical service leaders
action oriented strategic planning
organization
Quality Metrics
Publicly Reported Outcomes
Value Based
Payment
Peers
Professional Organizations
Best Practice Unrelated
Technology

The Patient’s Point of View
1. Use your smartphone 2. Play Doctor 3. Crayons for the table paper 4. Bring pipe cleaners 5. Have a freeze-dance party
http://www.yourmodernfamily.com/waiting/
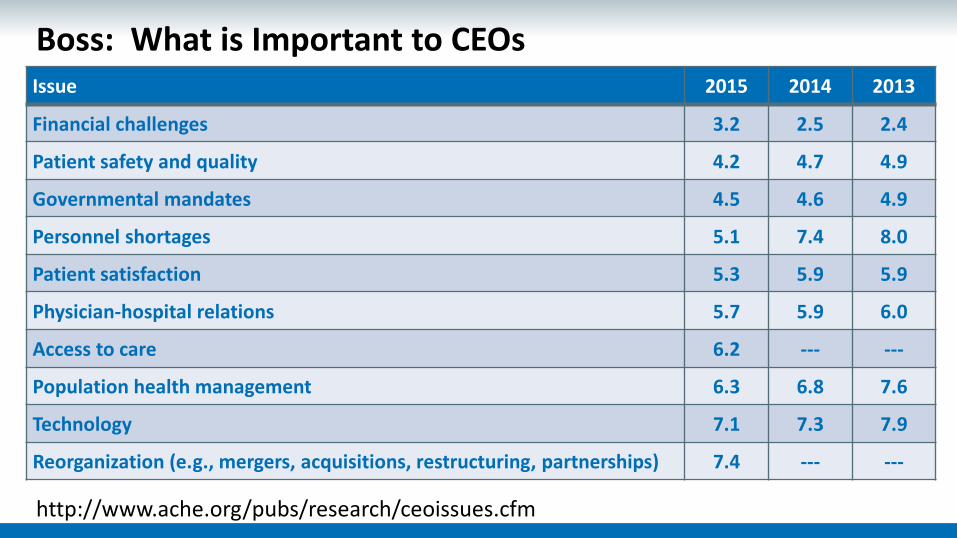
Boss: What is Important to CEOs
http://www.ache.org/pubs/research/ceoissues.cfm
Issue 2015 2014 2013
Financial challenges 3.2 2.5 2.4
Patient safety and quality 4.2 4.7 4.9
Governmental mandates 4.5 4.6 4.9
Personnel shortages 5.1 7.4 8.0
Patient satisfaction 5.3 5.9 5.9
Physician-hospital relations 5.7 5.9 6.0
Access to care 6.2 --- ---
Population health management 6.3 6.8 7.6
Technology 7.1 7.3 7.9
Reorganization (e.g., mergers, acquisitions, restructuring, partnerships) 7.4 --- ---

Clinical Service Leaders Oncology Metabolic Disorders
Heart & Vascular Neuroscience
Pediatrics Primary Care
Musculoskeletal Women’s Health Digestive Health
Respiratory Trauma & Acute Surg
Transplant Ophthalmology
Urology Spine
Kidney & Dialysis Head and Neck
Behavioral Health
Pharmacy
Perioperative
Rehabilitation Clinical
Engineering Radiology Ambulatory
Operations Critical Care
Lab Transition of Care
Nursing
Emergency Medicine
General Medicine
Reconstructive Surgery
Food and Nutrition
Clinical Services for all populations

Clinical Service Leaders 1. Organize care into sub-populations with more specific needs
2. Create strategies to improve specific outcomes and financial issues for each
• What can Pharmacy Services impact?
Porter ME, Lee TH. The Strategy That Will Fix Healthcare. Harvard Business Review, October 2013; 50-70
Oncology Thoracic GI Hematologic Malignancy
Heart & Vascular Cerebro-vascular Heart Failure Acute Coronary
Syndrome

Blue Ocean Strategy The Four Actions Framework What aspect of your services are taken for granted, but not adding value? These
should be eliminated What aspect of your services should be greatly reduced? What aspect of your services should be raised well above current standards? What has never been offered before that should be created?
Not only is it valuable to consider this for your own pharmacy services, but
which industry partners are already doing this?
Kim, W. Chan; Mauborgne, Renee (2015). Blue Ocean Strategy: How to Create Uncontested Market Space and Make the Competition Irrelevant. Boston, MA: Harvard Business Review Press

IHI “Triple Aim”
Quality Access
Cost
Safe Effective
Patient Centered
Efficient use of resources
Timely Equitable Localized
Value

Publicly Reported Outcomes
http://www.medicare.gov/hospitalcompare/search.html

Value Based Payment The Old System Fee for service model Patients “discharged” Disease Management focus Addressing Sickness Measuring Mortality/Harm
The New System Value-based payment Patients “transitioned” Care Coordination & Navigation Addressing Health Measuring Risk of Harm
Global Market Risk Shared Risk
Gain Share Episode of Illness Payment
Bundled Services Payment Fee-for-Service

Quality Metrics: FY2017 Value-Based Purchasing Domain Weighting (10/1/2016-09/30/2017)
http://www.stratishealth.org/documents/FY2017-VBP-fact-sheet.pdf
25% Patient
Experience
25% Efficiency
Process
Clinical Care
Outcomes 25%
5%
20% Safety

Best Practice
Financial • Specialty Pharmacy Growth
• Service Line Medication Utilization Reduction • Ambulatory Medication Net Revenue
Access • Ambulatory Pharmacist Clinical Practice • Specialty Clinic Medication Prior Authorizations • Key Performance Indicators Related to Pharmacy Systems (medication
delivery time, medication related readmissions) • Decentralization and Expansion of Pharmacist Clinical Services
Quality • Identify and prioritize OUTCOMES for each Service Line that pharmacy services can impact
• Pharmacy Services at Discharge • Sterile Production Automation (IV Robotics) • Medication Distribution Automation

Making it Happen
Innovation Part 2

Intrapreneur

Your Story Part 1: The Lean Canvas PROBLEM
• Describe the problem that you are addressing
SOLUTION • Describe your Big
Idea and how it will solve your problem
KEY METRICS • How will you define
success? • Other key
performance indicators
REVENUE / COST SAVINGS
UNIQUE VALUE PROP • Why is your department
uniquely positioned to solve this problem compared to internal and external options
UNFAIR ADVANTAGE • For new revenue generating
business models, • describe why you will be
the most successful in your market
PATIENT/CUSTOMER SEGMENTS
• Describe who you are focusing on and why
COST OF THE SOLUTION
pharmacy financial basics

Early Steps
http://www.whiteboardmag.com/how-to-become-an-intrapreneur-a-journey-in-21-steps/
Start small and expand when pharmacy impact has proven valuable
Casually test ideas with those you trust and peers outside you organization
Find the right executive champion
Do not advertise until you are fully ready to tell your story
Lean on your natural leadership ability as you develop your idea

Upping the Ante
http://www.whiteboardmag.com/how-to-become-an-intrapreneur-a-journey-in-21-steps/
Persevere through practical challenges
Go above and beyond your normal job for your Big Idea
Keep ideas away from those who will oppose
Find a way around the bureaucracy
Believe that the idea is more important than your job

Fostering the Environment
https://hbr.org/2013/01/to-increase-innovation-take-th. (accessed August 28, 2016)
Encourage risk by celebrating acceptable failures
Celebrate milestones
Build an autonomous supportive team
Create opportunities for new ideas and critical feedback
Alignment of skills and strengths

Your Story Part 2: The Pitch
Desire IMPACT Great IDEAS
Innovation WITHIN Organization INTRAPRENEURSHIP
1 2 3
4

Intrapreneur in 4 steps: - Harness a desire - Know what you are
willing to invest - Build a team - Just do it already
Failing to prepare, we prepare to fail
Act as if it were
impossible to fail
Well done is better
than well said
success is more ATTITUDE than
APTITUDE
Diplomacy is the art of letting
someone else get your way

References American College of Healthcare Executives. (September 2015). Top Issues
Confronting Hospitals: 2013. Retrieved from http://www.ache.org/pubs/research/ceoissues.cfm
Stratis Health. (September 2014). Understanding Value-Based Purchasing. Retrieved from http://www.stratishealth.org/documents/FY2017-VBP-fact-sheet.pdf
Medicare.gov Hospital Compare. (September 2014). Retrieved from http://www.medicare.gov/hospitalcompare/search.html
Disruptive Strategies: Transformation of Pharmacy Practice From a Dispensing Model to a Patient Care Model, 2012 NCPO Annual Meeting; January 2012; : Pharmacy Today; May 2012
Topol, Eric (2012). The Creative Destruction of Medicine: How the Digital Revolution Will Create Better Health Care. New York: Basic Books

Action Oriented Strategic Planning
Kate Schaafsma, Pharm.D., M.S., M.B.A., BCPS Pharmacy Manager
Froedtert & the Medical College of Wisconsin Milwaukee, Wisconsin

Objectives Define key terminology Know why strategic planning is critical to success Develop a framework for strategic management Review a case of pharmacy strategic planning Reflect on secrets of success

Definitions Strategic management is the continuous process to maintain on target Strategic planning is an activity that is used to set priorities Strategic plan is a document with goals, objectives, and tactics

Where does Strategy Fit?
Mission Values Vision
Strategy Goals, Objectives & Tactics
Performance Measures
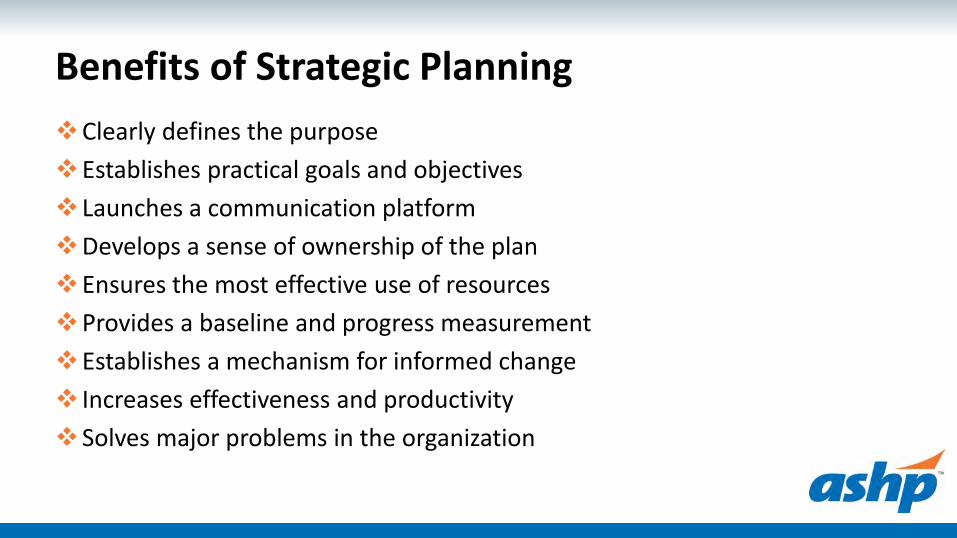
Benefits of Strategic Planning Clearly defines the purpose Establishes practical goals and objectives Launches a communication platform Develops a sense of ownership of the plan Ensures the most effective use of resources Provides a baseline and progress measurement Establishes a mechanism for informed change Increases effectiveness and productivity Solves major problems in the organization

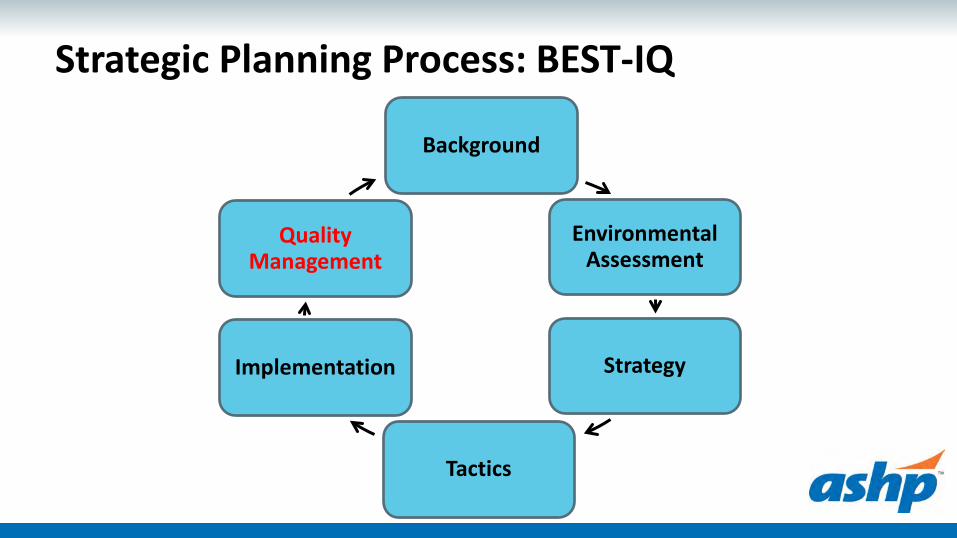
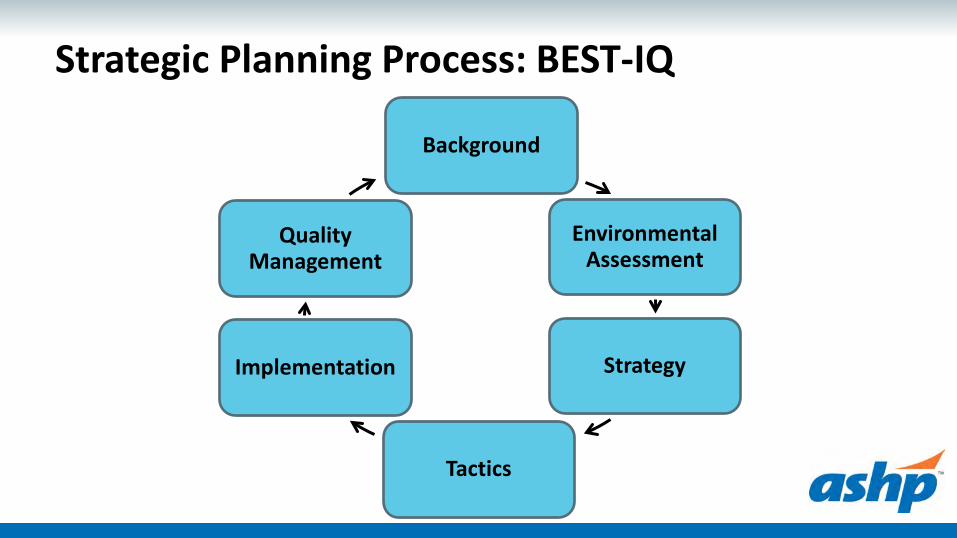
Strategic Planning Process: BEST-IQ
Background
Environmental Assessment
Strategy
Tactics
Implementation
Quality Management

Strategic Planning Process: BEST-IQ
Background
Environmental Assessment
Strategy
Tactics
Implementation
Quality Management

Background Form a planning team Develop a timeline Prepare background information Familiarize the team to the organization’s strategic plan Develop communication and change management plan

Getting Started
Mission – purpose, reason for existence Vision – desired end state Values – what you stand for

Mission Mission statement – purpose, reason for existence
• Uber: Transportation as reliable as running water, everywhere, for everyone • Make-A-Wish: We grant the wishes of children with life-threatening medical
conditions to enrich the human experience with hope, strength and joy • Feeding America: To feed America’s hungry through a nationwide network of
member food banks and engage our country in the fight to end hunger • Mayo Clinic: To inspire hope and contribute to health and well-being by
providing the best care to every patient through integrated clinical practice, education and research
• CVS : We will be the easiest pharmacy retailer for customers to use • TED: Spreading Ideas
http://onstrategyhq.com/resources/developing-your-strategy/

Vision Vision statement – aspirational description of what you want to achieve Make-A-Wish: People everywhere will share the power of a wish Cleveland Clinic: Striving to be the world’s leader in patient experience,
clinical outcomes, research and education Habitat for Humanity: A world where everyone has a decent place to live Alzheimer’s Association: Our vision is a world without Alzheimer’s Feeding America: A hunger-free America
http://onstrategyhq.com/resources/developing-your-strategy/

Values
Values – guiding principles dictating behavior and action • Recreational Equipment Incorporated (REI) Authenticity: We are true to the outdoors Quality: We provide trustworthy products and services Service: We serve others with expertise and enthusiasm Respect: We listen and learn form each other Integrity: We live by a code of rock-solid ethics, honesty, and decency Balance: We encourage each other to enjoy all aspects of life
http://onstrategyhq.com/resources/developing-your-strategy/

Values Values – guiding principles dictating behavior and action
• Uber Be an owner, not a renter Take big bold bets The best idea wins

Values Disney
• Safety I practice safe behaviors in
everything I do I take action to always put safety
first. I speak up to ensure the safety of
Others
• Courtesy I project a positive image and energy I am courteous and respectful to
Guests of all ages I go above and beyond to exceed
Guest expectations
• Show I stay in character and perform my
role in the show I ensure my area is show-ready at all
times
• Efficiency I perform my role efficiently so
Guests get the most out of their visit I use my time and resources wisely

Tips for Success Mission, Vision Values Involve everyone in development Clear and easily understood Specific, short, and memorable Keep it simple – realistic – practical Focus on the customer Reflect core competencies
http://onstrategyhq.com/resources/developing-your-strategy/

Strategic Planning Process: BEST-IQ
Background
Environmental Assessment
Strategy
Tactics
Implementation
Quality Management

Environmental Assessment Complete SWOT analyses
• Internal environment analysis • External environment analysis
Gather input from all stakeholders
Consider organizational and political implications


• http://www.docstoc.com/docs/111966754/sample-SWOT-analysis-template

Internal Assessment Seek out strengths and weaknesses Resources, people, culture and information systems
• Best practices • Department structure and facilities • Partnerships • Employee competency • Teaching environment • Med use process • Clinical services • Automation and technology

External Assessment Seek out opportunities and threats
• Identify key industry trends ASHP Pharmacy Forecast Advisory Board Marketplace competition
• Identify changes at a local and national level Board of Pharmacy Regulating bodies - The Joint Commission Payers - Centers for Medicare and Medicaid Services

Strategic Planning Process: BEST-IQ
Background
Environmental Assessment
Strategy
Tactics
Implementation
Quality Management

Strategy Formulation Define strategic priorities based on risk and reward
Align with the mission, vision and values
Identify what external factors need to be addressed
Prioritize focus areas
Develop goal statements and specific objectives
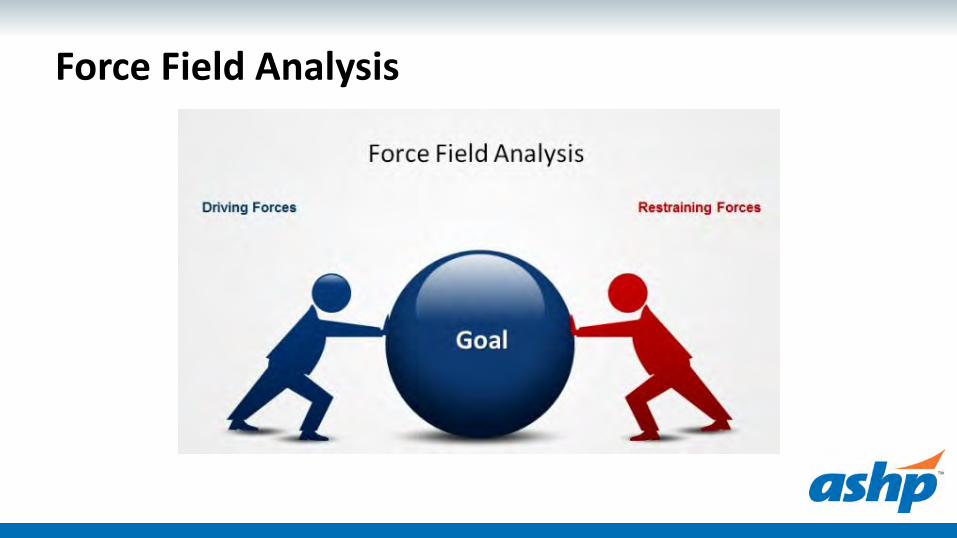
Force Field Analysis

Structural Tension

Strategic Planning Process: BEST-IQ
Background
Environmental Assessment
Strategy
Tactics
Implementation
Quality Management

Develop Tactics Develop strategic plan tactics
Identify measurable imperatives
Develop action plans (SMART goals)

SMART Tactics
SPECIFIC • State what is to be achieved, clear and well defined
MEASURABLE • Capable of measurement, progress is monitored and definitive
ACHIEVABLE • Realistic given the circumstances in which it is set and the
resources available to the business
RELEVANT • Relevant to the people responsible for achieving them
TIMELY • Detailed timeline with milestones

Determine Metrics Operational metrics Process metrics Fiscal metrics Quality or safety metrics Visual summary of metrics

Strategic Planning Process: BEST-IQ
Background
Environmental Assessment
Strategy
Tactics
Implementation
Quality Management
Strategic Implementation Establish a specific timeline Monitor implementation with milestones Enlist support and change agents Communicate the plan to champions and stakeholders Execute the strategic plan Celebrate progress and short term wins

Keys to a Successful Implementation
Must Do’s Leadership presence Employee competency, knowledge
and experience Resources Results oriented structure
Pitfalls No one knows who is in charge Last minute or lack of
communication Ill-defined goals Lack of accountability Lack of tracking progress
Strategic Planning Process: BEST-IQ
Background
Environmental Assessment
Strategy
Tactics
Implementation
Quality Management

Quality Management Strategic Control, Evaluation, or Quality Management
• Develop a monitoring plan to measure progress • Monitor, evaluate, and adjust the plan as needed • Set-up annual review to determine progress • Taking corrective action, if necessary

Quality Management = PDCA

Levels of Evaluation Strategic level
• Does the consistency of the strategy align with the environment?
Operational level • How well is the organization doing in pursuit of strategy?

Tools to Assist in Evaluation Dashboards Balanced scorecard Scheduled meetings Software packages Project progress reports
• Charter • Gantt chart
Strategic Planning Process: BEST-IQ
Background
Environmental Assessment
Strategy
Tactics
Implementation
Quality Management
Project Evaluation Tools

Status Key: On TargetAnnual Improvement
Priority (AIP)FMCW - Pharmacy
Strategic Goals
Linked Tactics Target to Improve (TTI).How Much? By When? Sponsor Team
LeadKey
Supportrelated non-strat
&/or Res Proj YTD FY 2017 Jul Aug Sept
Target Begin
Actual
Target Begin
Actual
Target Begin
Actual
Target Begin
Actual
Target Begin
Actual
Tech Career Ladder - Erick-Res
RPh career ladder, staff model
RPh career ladder, staff model
Off Target
Anne Z
Matt, Noah, Mark, Justin, Coordinators
Matt, Noah, Mark, Justin, Coordinators
Phil B Anne Z
5. Cultivate an environment that
promotes staff growth and development.
1. Introduce a system professional and technical career ladder that fosters growth and development to enhance competency
of staff.
Improve retention rate for technical staff from 82% to 90% by FY17 Phil B Matt W
Improve retention of professional staff from __ to __ by end of FY17 Phil B
2. Implement a pharmacy practice model that enhances professional and technical
autonomy to practice at the top of license and certification.
Reduce non-clinical work completed by professional staff from __ to __ by end of FY17.
1. Optimize resources to ensure reliable
services for safe and dependable medication
use.
2. Promote lean and continuous improvement as standard work across the
pharmacy enterprise.
Identify (qty) clinical and (qty) operation workflows by (date) that can be standardized by (qty-prioritized) service line
implementation by (date).Phil B Brian F
Establish (qty - area) standardized huddles from baseline to daily for frontline staff, and monthly for enterprise leaders by
January 2017.Phil B Brian F
IP-Opt-NoahAC-ReDes-Jordan
Refil Opt-ErikaCartless-Justin
OP Workflow-KateInv. Mgt.-Kristin O-Res.
AutoDisp - Christian-Res
Std Medkeeper IV rm - Matt
FMCW Pharmacy Department - FY 2017 "Target To Improve" Scorecard
Example Strategic Planning Scorecard
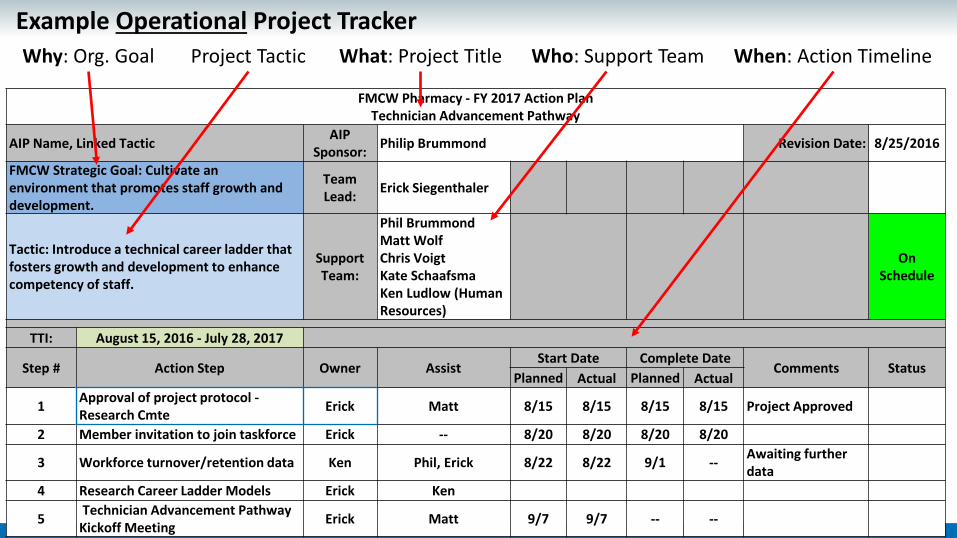
FMCW Pharmacy - FY 2017 Action Plan Technician Advancement Pathway
AIP Name, Linked Tactic AIP Sponsor: Philip Brummond Revision Date: 8/25/2016
FMCW Strategic Goal: Cultivate an environment that promotes staff growth and development.
Team Lead: Erick Siegenthaler
Tactic: Introduce a technical career ladder that fosters growth and development to enhance competency of staff.
Support Team:
Phil Brummond Matt Wolf Chris Voigt Kate Schaafsma Ken Ludlow (Human Resources)
On Schedule
TTI: August 15, 2016 - July 28, 2017
Step # Action Step Owner Assist Start Date Complete Date
Comments Status Planned Actual Planned Actual
1 Approval of project protocol - Research Cmte Erick Matt 8/15 8/15 8/15 8/15 Project Approved
2 Member invitation to join taskforce Erick -- 8/20 8/20 8/20 8/20
3 Workforce turnover/retention data Ken Phil, Erick 8/22 8/22 9/1 -- Awaiting further data
4 Research Career Ladder Models Erick Ken
5 Technician Advancement Pathway Kickoff Meeting Erick Matt 9/7 9/7 -- --
What: Project Title Project Tactic Who: Support Team When: Action Timeline Why: Org. Goal Example Operational Project Tracker

Pharmacy Enterprise Strategic Planning
Case Study

F&MCW Strategic Priorities
Pharmacy Mission, Vision, Values
Pharmacy Strategic
Plan
Strategic Initiative
/ Goal
Strategic Tactics

Froedtert Pharmacy Strategic Planning July 2015 – Strategic Planning Kickoff
August 2015 – Environmental Assessment
September 2015 – Strategy Development
October 2016 – Tactic Development
Spring 2016 – Implementation
Summer 2016 – Strategic Quality Management

Strategic Planning Kickoff Planning team of pharmacy leaders, residents, and lean
facilitator Strategic timeline defined – July 2015 to June 2016 Planning team and additional pharmacy leaders prepared
background information Familiarize the team to the organization’s strategic plan Communication and change management plan defined

Froedtert & MCW Mission & Vision Our Mission Statement
Froedtert & the Medical College of Wisconsin advance the health of the communities we serve through exceptional care enhanced by innovation and discovery.
Our Vision Statement Froedtert & the Medical College of Wisconsin will be the region’s premier health system by demonstrating superior value through an academic-community partnership and aligning health care delivery across the region.

Froedtert & MCW Core Values Our Values Partnership
Partnering with patients, families and other organizations; collaborating with co-workers and colleagues
Responsiveness Meeting the needs of the community in prevention, wellness and providing integrated care
for all ages
Integrity Using resources wisely; building trust
Dignity and Respect Creating an inclusive and compassionate environment for all people
Excellence Demonstrating excellence in all we do

Froedtert & MCW Strategic Priorities
Patient Centered Care Clinical Effectiveness Financial Strength Population Health Workplace of Choice Three Million Lives

Froedtert & MCW Pharmacy Enterprise Mission
High quality, cost effective, comprehensive, patient-centered care in an atmosphere of communication and shared respect Life-long learning through the education of patients, students,
residents, staff and other health care professionals Research and investigation designed to enhance the quality
and safety of medication use

Environmental Assessment SWOT analysis was completed across Froedtert Pharmacy
Enterprise • What does good look like to our internal and external
customers?

Strategy Development Optimize resources to ensure reliable services for safe and dependable medication
use Strive to exceed targeted clinical quality and safety outcomes Develop relationships with our patients to support lifelong wellness Create infrastructure to provide highly reliable clinical and operational processes Cultivate an environment that promotes staff growth and development Embrace innovative services that align with the evolving health care environment Develop mechanisms to provide real time decision making through the utilization of
data Expand pharmacy’s contributions to the organization’s operating margin Partner with key stakeholders to achieve shared goals

Tactic Development Strategic initiatives distributed to all pharmacy leaders Each pharmacy leader asked to develop tactics to achieve strategic
initiatives Applied impact/effort analysis to identify targeted tactics

Tactic Development 70 tactics were identified to achieve 9 strategic initiatives Tactics were distributed to all pharmacy staff and leaders Applied impact / effort analysis to further identify tactics
• Drilled down to 37 actionable tactics

Strategic & Tactic Development

Strategic Plan Implementation Spring 2016 - Assignment of project sponsors, owners, and timelines
Status Key: On TargetAnnual Improvement
Priority (AIP)FMCW - Pharmacy
Strategic Goals
Linked Tactics Target to Improve (TTI).How Much? By When? Sponsor Team
LeadKey
Supportrelated non-strat
&/or Res Proj YTD FY 2017 Jul Aug Sept
Target Begin
Actual
Target Begin
Actual
Target Begin
Actual
Target Begin
Actual
Target Begin
Tech Career Ladder - Erick-Res
RPh career ladder, staff model
Off Target
Anne Z
Matt, Noah, Mark, Justin, Coordinators
Matt, Noah, Mark, Justin, Coordinators
5. Cultivate an environment that
promotes staff growth and development.
1. Introduce a system professional and technical career ladder that fosters growth and development to enhance competency
of staff.
Improve retention rate for technical staff from 82% to 90% by FY17 Phil B Matt W
Improve retention of professional staff from __ to __ by end of FY17 Phil B
2. Implement a pharmacy practice model that enhances professional and technical
Reduce non clinical work completed by professional staff from
1. Optimize resources to ensure reliable
services for safe and dependable medication
use.
2. Promote lean and continuous improvement as standard work across the
pharmacy enterprise.
Identify (qty) clinical and (qty) operation workflows by (date) that can be standardized by (qty-prioritized) service line
implementation by (date).Phil B Brian F
Establish (qty - area) standardized huddles from baseline to daily for frontline staff, and monthly for enterprise leaders by
January 2017.Phil B Brian F
IP-Opt-NoahAC-ReDes-Jordan
Refil Opt-ErikaCartless-Justin
OP Workflow-KateInv. Mgt.-Kristin O-Res.
AutoDisp - Christian-Res
Std Medkeeper IV rm - Matt
FMCW Pharmacy Department - FY 2017 "Target To Improve" Scorecard

Strategic Quality Management

Lessons Learned Don’t forget about fundamental best practices and the
resources required to provide basic services Use the strategic plan as a guidance tool Ask provocative questions Look towards the future, step away from the present Focus on the organization, not individual actions Remove fancy language Get front-line staff involved

Key Takeaways Failure to plan is planning to fail!
• Strategic planning and strategic management will allow you to define clear goals, use your resources in the best way possible, and solve big problems.
Move your strategy into action! • A variety of methods exist to complete strategic planning – find one that
works for your department and culture – then, move to action. Don’t forget your change management skills.
• Utilize strategic quality management and communication tools to track progress and establish accountability.

References Zuckerman, AM. Healthcare Strategic Planning. Healthcare
Administration Press. (2012). https://www.mindtools.com/ Porter, ME. What is Strategy? Harvard Business Review,
Nov/Dec 1996. The Serving Leader Toolkit. Accessed via
http://www.theservingleaderacademy.com/toolkit.html

Questions?

Pharmacy Finance Basics – Productivity, Tools, Budgeting
Mark Sullivan, Pharm.D, MBA, BCPS, FASHP Executive Director, Pharmacy Operations Vanderbilt University Hospital and Clinics
Nashville, Tennessee

Pharmacy Finance Basics Objectives Describe the current financial opportunities and challenges facing Hospitals and Health-Systems Pharmacy leaders
Provide an overview of basic finance terms related to accounting and budgeting Review concepts for navigating example revenue cycle and financial reports Provide an overview of developing budgets and monitoring performance Identify the necessary elements of a successful business plan and ways to promote Pharmacy's brand
1 2 3 4
5
F B P

6 Areas of Focus Assessment of Pharmacy Strengths, Weaknesses,
Opportunities, and Threats Defining Pharmacy Productivity Pharmacy Financial Reports Budgeting Value Based Care Appendix – Key Terminology
F B P

http://faceforwardcolumbus.com/wp-content/uploads/2014/09/stewardship.jpg F B P

Overview of Pharmacy Financial Opportunities and Challenges
http://www.competetowin.co.uk/wp-content/uploads/2012/05/EconomicProfit.jpg http://www.bain.com/Images/opportunities-in-integrated-care-for-pharma-fig-04_embed.gif F B P

Overview of Pharmacy Financial Opportunities and Challenges
$162,741,664
$161,460,153
F B P

Knoer S. Stewardship of the pharmacy enterprise. AJHP 2014;71:2104-9
Generate sufficient operating margin to support our clinical, education and research mission in alignment with system goals (quality, people, innovation, growth, finance)
Supported by the appropriate organizational structure and leadership at the executive level (short and long term planning as part of a regular departmental review process)
Clinical integration and care delivery transformation across systems
Keeping pace with evolving population health landscape (in multiple locations)
Sustained pressure to contain costs and search for new revenue sources across inpatient and ambulatory practice
F B P

F B P
How drugs get to the pharmacy and to the patient
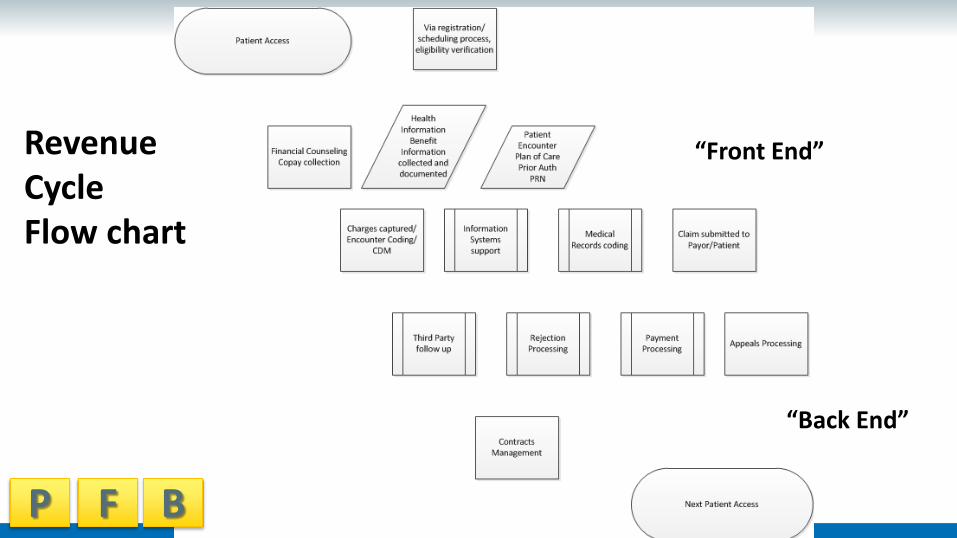
Revenue Cycle Flow chart
“Back End”
F B P
“Front End”

F B P
Overview of Pharmacy Financial Opportunities and Challenges 2015/6 Outlook – US Not-for-Profit Hospitals – Moody’s
• Changed outlook to stable for 2016 First change since 2008
• Cash flows moderating to 3-4% • Gains unlikely to continue past 12-18 months
Long term pressures • population health; continued consolidation • Increased exposure to government payors
https://www.moodys.com/research/Moodys-US-not-for-profit-and-public-healthcare-outlook-stable--PR_340474

Overview of Pharmacy Financial Opportunities and Challenges MACRA Medicare Access and CHIP Act of 2015 Payments begin 2019 Genesis:
Begins conversion of fee for service to value based programs
Four weighted components for reimbursement
Quality 50% Advancing Care Information 25% Clinical Practice Improvement 15% Cost 10%
Eliminates Sustainable Growth Rate formula
Overhauls CMS quality programs into the Merit Based Incentive Payment System • +/- 4% in 2019 • +/- 9% in 2022
https://www.cms.gov/Medicare/Quality-Initiatives-Patient-Assessment-Instruments/Value-Based-Programs/MACRA-MIPS-and-APMs/MACRA-MIPS-and-APMs.html F B P

http://www.aafpros.com/Accounting-Professionals F B P

Overview of Pharmacy Financial Opportunities and Challenges
Measuring Revenues and Expenses with Accrual Accounting Accountants measure profit or loss by applying a concept called accrual
accounting. Accrual accounting entails deciding when patients have received services
for which the organization is entitled to income, as well as how and when the cost of these services is measured. • Income (revenue) is earned when services are provided. A patient in a
bed is receiving a service. • Expenses are the costs of providing material and service to the parties
that receive the service, when the service is being provided.
Kaufman F. A Primer on Hospital Accounting and Finance. 5th edition. Kaufman, Hall & Associates, LLC. Skokie, IL (2015) F B P

Overview of Pharmacy Financial Opportunities and Challenges The timing of when an organization gets
paid for the services it renders, or when it pays for the materials and services it purchases. • The accurate measurement of profits
or losses depends upon the correct matching of services provided and the costs of providing these services.
Payment for services and materials that have been provided may occur long after they have been received and consumed.
Kaufman F. A Primer on Hospital Accounting and Finance. 5th edition http://remitdata.com/wp-content/uploads/2016/07/Claim-Average-Processing-Time-Analysis.png F B P

Overview of Pharmacy Financial Opportunities and Challenges Payer types:
• Private - BCBS • Government – Medicaid – indigent or
low income • Self-pay • Charity Care - Care rendered without
the expectation of payment Bad Debt
• Amount not recoverable from a patient or entity
Payers negotiate contracts with health care organizations based on • Quality, Service, and Outcomes
U.S. Payer Mix:
http://www.aha.org/research/reports/tw/chartbook/2015/15chartbook.pdf F B P

Overview of Pharmacy Financial Opportunities and Challenges MS-DRGs are based upon acuity and are
“weighted,” according to the severity of the patient’s illness, which can indicate the intensity of care or services needed.
Sicker patients require more of the hospital’s care and resources
Patient or “case” with a weight of 2.0 is deemed to be double the intensity and hence require double the costs (and payment) of a case with a weight of 1.0, which is the baseline weight.
Each hospital has a unique MS-DRG distribution.
F B P

Revenue Codes – Sample Guidance REVENUE CODE AND CPT/HCPCS Coding by Payer
DRUG TYPE H-Default
CPT/HCPCS A-Default
RC D- Medicaid
HCPCS BS Indicator
Medicaid
B-OP Medicare
HCPCS X-OP
Medicare RC IC GL KEY XXX RC XXX ALT CPT XXX STD CPT INJ, IV DRUGS W/ REAL HCPCS REAL HCPCS 636 6 371 636 REAL HCPCS REAL HCPCS INJ, IV DRUGS W/ NO HCPCS J3490 250 5 6 371 250 J3490 J3490 INJECTIBLES SELF ADMINISTERABLE -On the Medicare Self Administered List REAL HCPCS 636 A9270 GY 637 6 371 636 A9270 GY REAL HCPCS IV SOLUTIONS W/ REAL HCPCS REAL HCPCS 258 6 371 258 REAL HCPCS REAL HCPCS IV SOLUTIONS W/NO HCPCS J3490 258 5 6 371 258 J3490 J3490 BLOOD CLOTTING FACTOR / Hemophilia REAL HCPCS 636 9 884 636 REAL HCPCS REAL HCPCS CHEMO INJ, IV W/ REAL HCPCS REAL HCPCS 636 6 378 636 REAL HCPCS REAL HCPCS CHEMO INJ, IV DRUGS NOC J9999 250 J3490 5 6 378 250 J9999 J9999 ORAL CHEMO W/ REAL HCPCS REAL HCPCS 636 3 378 636 REAL HCPCS REAL HCPCS ORAL CHEMO DRUGS W/ NO HCPCS J8999 250 J3490 5 A9270 GY 637 3 378 250 J8999 J8999 ORAL ANTIEMETICS W/ REAL HCPCS REAL HCPCS 636 3 378 636 REAL HCPCS REAL HCPCS OPHTHALMIC Drop/Solution/Cream/Ointm BLANK 250 J3490 5 3 371 250 J3490 J3490
ORAL, Oral Syringes, Tabs, Caps, Creams, Ointments, Powders, Supp, Solids, UD or UDC; OS(oral solution) (usually no HCPCS) BLANK 250 J3490 5 A9270 GY 637 3 371 250 A9270 GY J3490 CONTRACEPTIVE DEVICE IMPLANTABLE REAL HCPCS 278 10 371 278 REAL HCPCS REAL HCPCS INHALATION SOLUTIONS (don't use J codes that describe 'Admin thru DME" J3490 250 5 3 371 250 J3490 J3490 TAKE HOME Drugs (usually no real HCPCS) BLANK 253 J3490 5 A9270 GY 3 371 253 BLANK BLANK Drugs Incident to Other DX Services REAL HCPCS 254 6 371 254 REAL HCPCS REAL HCPCS Drugs Incident to Radiology REAL HCPCS 255 6 371 255 REAL HCPCS REAL HCPCS Investigational Drugs (REAL HCPCS) REAL HCPCS 256 3 371 256 REAL HCPCS REAL HCPCS Investigational Drugs (NO HCPCS) BLANK 256 J3490 5 3 371 256 J3490 J3490 Non-Prescription Drugs (RC 257) BLANK 270 10 371 270 Supplies (meters, strips, creams, containers) BLANK 270 10 371 270 Supplies STERILE BLANK 272 10 371 272 Supplies TAKE HOME BLANK 273 A9270 GY 12 371 273 Supplies IMPLANTED C HCPCS 278 (RC 272) 19 371 278 C HCPCS C HCPCS F B P

F B P
Overview of Pharmacy Financial Opportunities and Challenges

Reimbursement Types Fee For Service
• Paid according to the volume of services that are provided
• Traditional model – still common today • Disadvantages: Overutilization of
services
Pay for Performance • Also known as Incentive Payments • Eligible to additional payments by
meeting or exceeding negotiated criteria Demonstrated lower cost of care
Shared Risk • Established benchmark of medical
expenses
Bundled Payment • Hospitals receive one payment for a
discrete set of services
Capitation • Hospital receives specific payment per
patient, per month and must provide necessary services
• What if hospitals cost of care exceed payments?
F B P

Revenue Routine – Dispensing is Pharmacy’s Cost Center
Pharmacy revenue is routed to the dispensing pharmacy’s cost center. For example: • Medications dispensed from pharmacy A will have charges routed to
“PHARMACY A” • Medications dispensed from another pharmacy (B) will have charges routed
to ”PHARMACY B. • Cost Center Defined E.g., 10500, 10501, respectively – Inpatient Operations, Sterile Products
• Drug Master file and cost maintenance requires constant oversight Vasopressin, Isoproternol, EpiPen costs
F B P

Possible Pharmacy Cost Center Exceptions Investigational Drugs:
• Any investigational medications that have a billing type of “investigational drug”.
• The revenue for these meds will be routed to the “INVEST DRUGS” cost center, regardless of where they are dispensed from.
• IDS studies using standard of care therapy as a comparator may bill normally.
F B P

Possible Pharmacy Cost Center Exceptions Contrast Media/Radiopharmaceuticals:
• Contrast and Radiopharmaceuticals may follow a different logic. • Their cost center routing is not based off of the pharmacy that they are
dispensed from, but the department that the user is logged into. i.e. Radiology If a user is logged into one of the imaging departments or other departments
that buy and dispense their own medications, the revenue will be routed to that department’s cost center. If a user is logged into one of the other hospital departments or the
pharmacy department, the revenue will be routed to the “PHARMACY INPATIENT OPERATIONS” cost center.
F B P

Keys to Revenue Cycle Management Health System Pharmacy seen as a margin generator thanks to
ambulatory, specialty and mail order services. 340B program monitoring for duplicate discounts Under coding of key diseases can negatively impact
reimbursement 60% RAC appeals found not to have an overpayment
http://www.beckershospitalreview.com/finance/25-things-to-know-in-revenue-cycle-management.html F B P

F B P
Pharmacy Management of Denials
https://www.advisory.com/-/media/Advisory-com/Technology/Payment-Integrity-Compass/Case-studies/2016/PICBellinRecovery2016.pdf

Overview of Pharmacy Revenue Cycle Challenges
VUMC internal data F B P

Productivity and Benchmarking
F B P

Used with permission Steven Reed FACHE Magellan Management Group F B P

F B P

Productivity Analysis for Department of Pharmacy Cost Centers The pre-assigned workload statistic for each cost center in the Department of Pharmacy
can be either daily Average Adjusted Patient Days (APD) or Calendar Days (CD). APD is a variable metric while CD is a fixed metric. • APD is a Decision Support endorsed organizational metric that often considers gross
revenue, inpatient revenue, and volume of inpatient days. • This figure is selected for a large number of organizational departments. While APD
or CD may not be an exact match to determine volume in your area, it is the standard, in most cases. E.g. FY 14, the budgeted daily Average Adjusted Patient Days is 1245.5.
In reviewing your Cost Center’s most recent Productivity for the Pay Period, please note the following: 1. Budgeted Hours = Budgeted FTE’s x 80 Hours (# of hours per FTE in a pay period). 2. For the costs centers who are on CD, the budgeted workload is 14.
F B P

Productivity Analysis for Department of Pharmacy Cost Centers To calculate your productivity %, you can take your Targeted Worked FTE (Budget)/
Actual Worked FTE. This will closely approximate your Productivity Index. • To calculate the number of worked FTEs for the pay period, simply take your
Total Worked Hours/80 (80 hrs in a pay period)
To calculate how much the addition (or reduction) of an FTE in a given pay period can be accomplished by adding or subtracting 80 hours (# of hours a FTE would work in a PP, regardless of position) to Actual Hours Worked. To re-calculate your NEW productivity %, you can take your Budgeted Hours/Actual Hours. • FTE (1.0)/PP = FTE across the pay period
F B P

Building Productivity Reports Determining what to measure
• What current benchmarks are in place in your facility? • Commonly used facility based benchmarks include: Patient Days, Admissions, Discharges, Clinic Visits
• Commonly used pharmacy based benchmarks include: Drug expense, doses dispensed, worked hours Lazarus Report; Vizient Report; Corporate Benchmarks
• Limitations Variability in regulations, patient mix, staff skill mix, patient acuity, facility
340B status, use of technology
F B P

Building Productivity Reports Determining how to compare
• Who is your peer group? Similar size? Similar technology? The EPIC® factor
Similar mission? Similar service line? Similar patient population?
• What is your target? 50th, 75th, 90th percentile?
F B P

Building Productivity Reports Outputs
• Doses / worked hours • Flex productivity seeks to manage FTE’s to volume adjusted budget • (Budgeted FTE / Budgets volume) – (Paid FTE / Actual volume) * Actual
volume Paid FTE includes nonproductive time (PTO, Float pool, etc) DOESN’T account for Clinical, Regulatory, or Organizational work not
directly associated with a unit of service
F B P

Productivity Formulas Outputs
• All doses not equal Start with most basic dispense and assess each value added step Creates basic definition of relative value unit (RVU) Allows more complex doses to be differentiated Quotas are easy to apply problematic to manage (verification) Interventions vs. normal pharmaceutical care
F B P

Productivity Formulas Inputs
• All inputs not equal Fixed inputs – management, regulatory, clinical? FTE based Cost of FTE based on pt day/adj pt day/discharge/other?
F B P

Productivity Formulas Application of RVU for productivity
• RVU to dispense 1 dose = 15 minutes • Pharmacy dispensed 950 doses in a week • Staff worked 240 hours in a week Total production focus – no nonproductive activities included 950 doses x 15 min/1 dose x 1 hr/60 min = 237 hrs
237 hrs / 240 target hours = 98.95% productivity 240 hrs – 237 hrs x 1 FTE/40 hrs = 0.075 FTE variance
F B P

Productivity Formulas Defining the day
• Calendar day – 24 hr period used in financial reporting • Adjusted Patient Day – considers total gross revenue, volume of
inpatient days Defining the FTE
• Budgeted FTE’s x # hrs per FTE in a pay period • If 5.75 FTE are budgeted in a 40 hr pay period; then 5.75 x 40 = 230 hrs
were budgeted in the previous example.
F B P

Productivity Formulas Modeling new services
• Productivity models can be used to estimate impact of new services on reporting Add or reduce # of FTE hours to total hours and model impact on productivity Use to set administrative expectations on impacts that non dose producing
activities will have. Consider to document expansion of pharmacy into more direct patient care
activities. Consider inclusion of non productive time for training and acclimation to new
processes as well as use of benefit time.
F B P

AJHP, Mar 2010 F B P

AJHP Feb 2015, AJHP Jan 2012, AJHP Feb 2012, F B P

Financial Reports and Assessing Operations
F B P

Financial Summary Steps Get access to some data – Departmental or Cost Summary Data
• Ask someone • Go back and make sure you understand the embedded assumptions and caveats
Build out your data in Excel – Understand what you are building out and what is says Place graphs in a PowerPoint slide 8x11 Shop it!
M A Y 1 5 - A C T U A L M A Y 1 5 - B U D G E T V A R I A N C E M A Y 1 4 - A C T U A L
MAY FY16 YTD COMPARE OPERATING REVENUE NET INPATIENT REVENUE
F B P

F B P
Bootcamp Hospital Pharmacy 2016 Financials
$161,460,153

F B P
Bootcamp Hospital Pharmacy 2016 Financial Ratios

F B P
Bootcamp Hospital Pharmacy 2016 Budget
$162,741,664

F B P
Bootcamp Hospital Pharmacy 2016 Financials Variance to Budget

Current Month (CM) Explanations Net Patient Service Revenue (10-500):
• CM (Current Month) is $XXXK favorable and YTD gross revenue is $XXXK favorable.
• OP gross revenue continues to be a driver for the YTD revenue variations. (Revenue budget is based on total patient discharges.)
• For the CM, we have observed a decline in 12/32 (38%) visits/cases for OP volume
Other Operating Revenue: • CM is $XXK favorable and YTD is $XXXK favorable - driven by increase in
pharmacy purchases by XXX. F B P

Current Month (CM) Explanations Total Operating Expense w/o Allocations (10-500):
• CM is $6K favorable and $XXK unfavorable YTD. • Pharmaceuticals remains YTD on-budget with a total budget of $XXM – (0.49% -
40K) • Salaries and Wages: CM is $XXK favorable and YTD is $XK unfavorable. • $XXM budget; (0.26%, $8K) variance
Other Operating Expense: • CM is at budget
Income from Operations: • CM/YTD is $XXM with $XXK favorable variance to the budget • Driver is favorable net inpatient revenue.
F B P

Hospital Pharmacy
FY 16 Financial Summary
Actual ‘16 Budget ‘16
Variance
Actual ‘
Outpatient Revenue FY ‘16
Expense FY 16
Drug Price increases continue • 2015 Nitropress Valeant 525% • 2015 Isuprel Valeant 212% • 2015 PCSK9 for cholesterol $14K/y • 2015 Daraprin Turing 5000% • 2016 EpiPen Mylan 500%
Bootcamp Hospital Pharmacy • Net Patient Service Revenue is unfavorable and YTD
gross revenue is unfavorable. Loss of key physicians in oncology and cardiology resulting in less than projected surgical and cath lab case
• Remaining oncology physicians prescribing non formulary medications for patients without approved indications, resulting in revenue loss due to write offs.
• Total Operating Expense is unfavorable and YTD expense is unfavorable.
• Drug Expense unfavorable – Cardiac surgery use of nitropress and isuprel as well as blood factors contributed.
• Salaries unfavorable due to extensive PTO due to medical leave.
• Supply expense unfavorable Transition by Supply Chain of Sterile products supply vendor presented opportunity to purchase remaining supply (3-4 mo) in warehouse of current vendor
Retail Pharmacy average Revenue per Rx: - Brand name: $250 - Generics: $15 - Specialty: varies Average prescriptions Filled per yr: 50,000
BootCamp

Developing the Budget and Monitoring Performance
F B P

Three Financial Profiles within Pharmacy
Used by permission from Adam Orsborn
27%
4%
70%
Inpatient HR Exp
Gen Op Exp
22%
5%
73%
Community & Specialty HR Exp
Gen Op Exp
3% 2%
95%
Ambulatory HR Exp
Gen Op Exp
Clinical Operations Production & Distribution
Community Pharmacies Specialty Pharmacies
Hospital Owned Clinic Administered Medications
Ambulatory Clinical Operations
F B P

F B P
Bootcamp Hospital Pharmacy 2016 Budget

Fiscal Year Budget Calendar Finance populates department budgets into system
• This is a KEY date! Program changes due to Finance
• 30 days after above Division Presidents, VPs, and Directors review budgets with their designated Finance
Director as needed • 45-60 days after above
Budget updates/revisions approved by EVPs • 60 to 75 days after above
Budget document delivered to Board Finance Committee • 90 days after above
F B P

Annual Budgeting Goal of the budget: forecast of revenue and expenses
• Describes the hospital’s/department’s specific financial goals for each account for the fiscal year (July-June or October-September)
Adherence to the budget is a predictor of financial stability – cost of money Timeline – 1 year horizon and reflects planned objectives in the “short-term” Integration of planning and budgeting
• Volume trends, payment arrangements, new ventures/business opportunities Timely, considerable involvement in staff from all levels – careful attention and
planning
Kaufman F. A Primer on Hospital Accounting and Finance. 5th edition F B P

Annual Budgeting Budgets are always changing depending on the environment Annual budgets “may be” changed in the beginning part of the year, if ever,
but can be fixed once finalized Often, we are left explaining variances throughout the year
• Variance analysis – positive and negative Quantifies the difference between actual and budgeted values for
resources, revenues or expenses Larger the variance – the greater the attention
• Also need to look at trending as well
F B P Kaufman F. A Primer on Hospital Accounting and Finance. 5th edition

Supplements to Annual Budgeting
Flexible Budgeting • Used on a monthly basis • Effectively measures budget to actual
variances • Expense categories are based of estimated
activity from month to month Retroactive change as each month is
finalized • Allows leaders to see the results that
reflect the actual level of department activity for each line item E.g., Patient days, Outpatient visits, etc.
Rolling Forecasting • Helps identify gaps in performance • Often a quarterly process • Used from for budget planning –
long range (3-5 years) • Compares quarters of projections to
the strategic financial plan assumptions and expected trajectory
• Focuses on forecast grouping rather that line item variances
F B P Kaufman F. A Primer on Hospital Accounting and Finance. 5th edition

Budget Process Know your defined Fiscal Year Know the date of the Budget upload Current FY financial data used to project upcoming FY budget Annualized data
• Start with • Commonly 9 months, but not always • Convert a rate of any length into a rate that reflects the rate on an
annual (yearly) basis (9 month total/9 * 3) + 9 month total
F B P

Operating Budget (Expenses) Key Pharmacy Expense Classes: Drugs Chargeable – TOTAL DRUGS 80%
total budget • FY16 ~$75M • Drugs, blood products (Albumin,
Factors) Blood Factors(FY16) ~ $1M
• Fluids – Expense Increase • Solutions and Sets (CSTD, IV Sets) • Anesthesia Gases • Lease and Rental
Labor 20% total budget • People (Salaries and Wages) –
FY16 $9M Productive Time – worked hours Non Productive Time – PTO/PAL
• Employee benefits Other
• Travel, Software, Drug Information References and Subscriptions
F B P

FY Drug Budget Drivers Patient volumes
• Seasonality Contracts
• IV Fluids Inflation - First to go
• 4-8%
New Entities • 340B/Specialty Rx • Biologic and oncology agents • Antifungals • Other key items (CV drugs)
Generics Projecting Future Drug Expenditures –
Annual
F B P
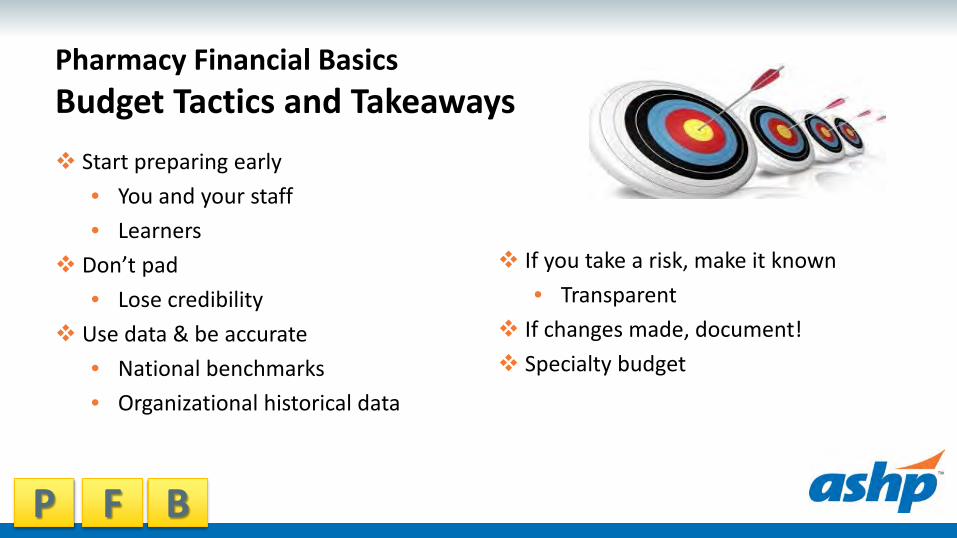
Pharmacy Financial Basics Budget Tactics and Takeaways Start preparing early
• You and your staff • Learners
Don’t pad • Lose credibility
Use data & be accurate • National benchmarks • Organizational historical data
If you take a risk, make it known • Transparent
If changes made, document! Specialty budget
F B P

Financial Reporting Tools Return on investment
• Ratio of net benefit to total amount of the investment Generally modeled over a 5 year time frame
• Allows comparison between resource use options ROI = Gain from investment – Cost of investment Cost of investment Harvard Business Review templates recommended by Bob Granko

Financial Reporting Tools Return on Investment
• Medical Return on Investment • Definition of the target population • Program costs • Utilization changes • Sensitivity analysis Baseline costs Post Intervention Costs Program Costs
http://www.rwjf.org/en/library/research/2007/05/the-medical-return-on-investment-template.html F B P

ROI Calculations Method Question Units What for Breakeven Analysis How many units
required to return the investment
Units sold Product development, new clinical programs
Payback Period Time needed to return the investment
Months/Years Projects with high barriers to entry; Productivity projects over time
Net Present Value What a project returns to the business
Dollars Projects with large capital outlays
Internal Rate of Return
Project lifecycle rate of return
Percentage Externally reported projects requiring external funding

Financial Reporting Pearls C-suite prioritizes investments based on return Partner with Finance, analytics, and other ancillary leaders to
know expectations Understand differences between hard and soft dollar savings
• Cost avoidance use may have revenue impacts
P F B

Building a Business Plan Executive Summary
• Document that should be written to the level of the audience (administration vs. clinical) - SBAR or other format; risk/benefit
Business Need Statement • Why is this important • Document outlining the external services you are trying to provide for a
potential “business” partner (stakeholder) • Market analysis, Options, Timelines, Financials • Stakeholders • References
F B P

VUH FY 16 budget proposal F B P

Value-Based Care
F B P

The Impact of an Emerging New Business Model - Elements of Change in the Old/New Business Model
Healthcare industry has started a transition to a value-based business model from an activity or volume-based, fee-for-service model that has been in place since the 1960s
The new model is profoundly different than the traditional model in almost every respect.
The value-based model will shift how providers deliver and are paid for services, as described in this section.
F B P

Pharmacy Financial Basics Cost reduction (elimination of direct expense)
• Drug costs • Personnel/FTE removed from budget • Reducing cost of harmful medication errors • Reduction in agency nurse use
Cost avoidance (avoiding future expense) • Slowing the drug cost trend curve • Preventing inappropriate use of a new drug • Adding robotic dispensing technology that will enable
you to grow volume without adding new personnel • Preventing cost of harmful medication errors
F B P

Pharmacy Financial Basics Patient safety
• Reduced error, preventing cost of harmful medication errors Improved operational efficiency Improved throughput
• MD efficiency Saved nurse/physician time Reallocation of FTE
• More nurse time at the bedside
F B P

Creating Value for Our Patients
Health outcomes = the full set of patient health results over the care cycle Costs of delivering outcomes = the total costs of care for a patient’s
condition over the care cycle Better health is the goal, not more treatment Better health is inherently less expensive than poor health
Source: Value-Based Health Care Delivery; Michael E. Porter, June 22, 2011: Slide courtesy of Andy Nelson UNC Medical Center
Health outcomes
Costs of delivering the outcomes Defining Value
F B P

Value-Based Care
Patient @ Women’s
Patient @ Couldry
Patient @ Granko
Patient @ Chen
F B P

Pharmacy Financial Basics
Common Hard Saving • Reduction in unit cost of operations • Reduction in unit cost of production • Reduction in transaction cost • Reduction in overhead cost • Reduction in transportation cost • Reduction in manpower • Increased throughput, resulting in
increased sales or revenue
Common Soft Savings • Reduction in cash flow • Reduction in need for working
capital • Avoidance of capacity enhancement • Conformation to changes in the law • Increased safety in the workplace • Increased employee satisfaction • Increased customer satisfaction
www.isixsigma.com/implementation/financial-analysis/hard-and-soft-savings-what-counts-can-be-counted/ F B P
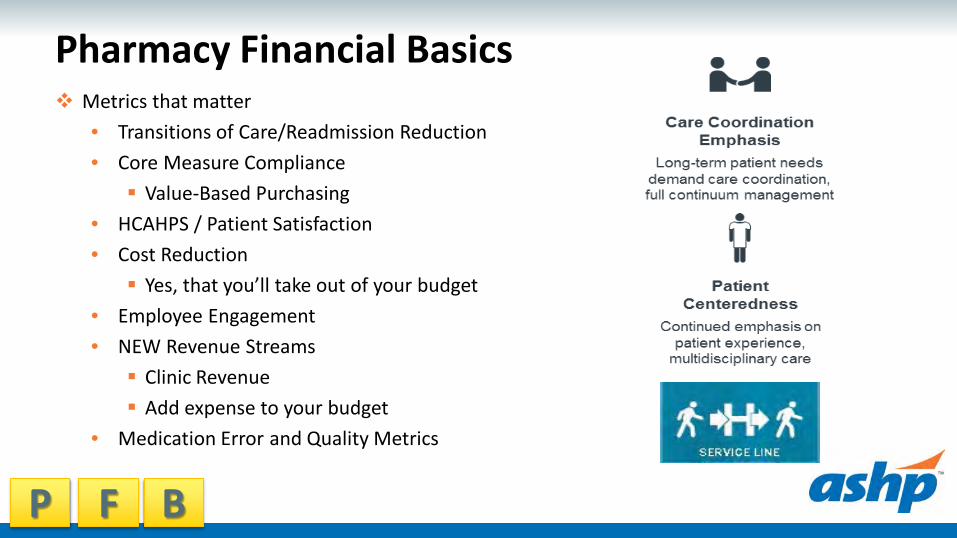
Pharmacy Financial Basics Metrics that matter
• Transitions of Care/Readmission Reduction • Core Measure Compliance Value-Based Purchasing
• HCAHPS / Patient Satisfaction • Cost Reduction Yes, that you’ll take out of your budget
• Employee Engagement • NEW Revenue Streams Clinic Revenue Add expense to your budget
• Medication Error and Quality Metrics
F B P

Pharmacy Financial Basics – References Financial Intelligence by Karen Berman and Joe Knight Wilson AL. Financial Management for Health-System Pharmacists. ASHP
2009 Healthcare Finance: An introduction to Accounting and Financial
Management, 5th edition. Journals:
• Healthcare Financial Management • Harvard Business Review
F B P

Key Takeaways Enhance your financial vocabulary
• References Work to understand the breadth and depth of your Pharmacy's business
• Acquire different types of pharmacy reports • Understand and work to implement fundamental concepts of budgeting
and its process Build up more efficient clinical operations and improve quality of patient
care • Sustainable modeling for now and the future
F B P

Key Takeaways Domain knowledge in financial management improves your communication
with financial team • In and outside of your Department - Finance and Non-Finance staff • Educate others
Use these tools to build and further promote the brand of pharmacy • Dashboards and Department Operating Reviews
F B P

Acknowledgments and Questions Bob Granko David Chen Rick Couldry John Pastor Steve Rough Scott Knoer Past Boot Camp Contributors and Faculty ASHP
Mark Sullivan, Pharm.D., M.B.A., BCPS, FASHP [email protected]
F B P

Key Terminology Case Basis
• Also called prospective payment - common • Paid a set fee for the care of a patient who has a certain condition (MS-DRG) • Regardless of how long the patient stays or number of resources consumed
Bundled Care • This arrangement is where the provider is paid a fixed amount during an entire care
episode and may include multiple care sites such as post-acute care facilities Per Diem
• Agreed amount per patient day • Contractual per diem – payer sets the price
A Primer on Hospital Accounting and Finance. 5th edition F B P

Key Terminology Capitation
• Hospital or health system receives a fixed amount per enrolled individual per month—often indicated as per member per month (PMPM)
• To cover a specified scope of medical services. • The provider is paid regardless of whether medical services are used and conversely bears
all cost overruns from services provided. Pay-for-Performance (P4P) and Shared Savings/Risk Arrangements
• Movement to reward providers for increasing care value. • Providers receive bonus payments or have a portion of their pay withheld based on
whether they meet preset performance targets. Targets may relate to quality, cost effectiveness, efficiency of care, or other factors.
• Shared savings arrangements offer incentives for providers to reduce healthcare spending for a defined patient population by offering them a percentage of net savings realized
A Primer on Hospital Accounting and Finance. 5th edition F B P

Profit/Contribution Margin • Revenue – expense • Many organizations’ goal is 4-6%
Key Terminology Three main financial statements
• Balance sheet Summary of all account balances,
including assets, liabilities and equity – as of a specific date (e.g. quarterly or year end)
• Income statement • Cash flow statement
Gross revenue • Payer payments
Accrual – revenue recognized when its earned
Expense • Supplies and labor (there are others!)
Different Reports for Different Audiences
F B P

Key Terminology - Summary Liabilities future sacrifices of economic benefits arising from present obligations to transfer assets or provide services to others as a result of past
transactions or events Charity of Uncompensated Care
care rendered to patients without the expectation of compensation for such services
Contract Allowance accounting adjustment required to reflect uncollectible differences between established charges for services rendered to insured persons and rates payable for those services under contracts with third-party payers
Cost Center responsible for providing services and controlling costs Operating Margin total operating revenues minus total operating expenses Contribution Margin revenue from services minus all variable expenses Management Discuss & Analysis
section of the annual report that is written by management to identify highlights of financial results and discuss the risks to the organization. It is not audited.
Bad Debt amount not recoverable from a patient or an entity that may have the ability to pay but does not following exhaustion of all collection efforts
Recovery Audit Contractor
program created through the Medicare Modernization Act of 2003 to identify and recover improper Medicare payments paid to healthcare providers
Variable Costs cost whose unit value remains relatively constant but whose aggregate value changes, usually proportionately to changes in volume Statement Of Net Assets
financial statement that presents the financial position of the organization at a point in time
Fixed Costs type of cost that stays approximately the same in total over a particular range of activity Medicaid federally aided, state-operated and administered program which provides medical benefits for certain indigent or low-income persons in
need of health and medical care; benefits, program eligibility, rates of payment for providers, and methods of administration of membership and payment to providers
Assets probable future economic benefits obtained or controlled by an entity by virtue of past transactions or events Ms – Drg patient classification system that relates demographic, diagnostic, and therapeutic characteristics of patients to length of inpatient stay and
amount of resources consumed; provides a framework for specifying hospital case mix Variance difference between and expected value and the actual value Accrual basis of accounting whereby revenue is recognized when it is earned and expenses are recognized when they are incurred Flexible Budget Budget that, when prepared, recognizes that expenditures are a function of activity levels and are adjusted accordingly Net Assets residual interest in the organization’s assets remaining after liabilities are deducted Medicare U. S. health insurance program generally for people aged 65 and the disabled

Alignment of Skills and Strengths: Building Your Team to meet the Demands of Tomorrow
Melissa Ortega, Pharm.D., M.S. Director, Inpatient Pharmacy Operation and Pediatrics
Tufts Medical Center Boston, Massachusetts

Leadership Framework in a Changing Environment
Lead with Authenticity Lead Change Drive Agility
Embed Sustainability
Maximize Talent
Empower Others
Price Water Coopers and Saratoga. How Leadership Must Change to Meet The Future. US Capitol Effectiveness Report 2007.

It Begins with YOU Leadership style alignment Enterprise knowledge Strategic focus Stakeholder relations Authenticity Building a high performing team Flexibility and versatility in the face of change

Objectives Describe the difference between change and transition Identify strategies to manage change and transitions Describe methods to maintain employee engagement during
change

Definitions Change – situational
• Focus on the outcomes Transition – psychological
• Process that people go through as they come to terms with a change
Sustainability- Balance results with the greater good • Looking beyond short term results to consider longer term
implications

Phases of Transition Getting people through the three phases is essential to
achieving change

Mutual Dependence

Create A Sense of Urgency Build an emotional and rational case for change Identify and discuss major crises or opportunities Make the status quo seem more dangerous than launching
into the unknown • Burning Platform

Lead Change Change is a process and a journey that takes time Change models can help you manage and understand the
change process Look at your role in the change process and apply the
appropriate leadership technique Appreciate what happens to individuals during transitions
Leading Change. John P. Kotter. HBR Copyright 1998 Ray MD, Breland BD. Methods of fostering change in the practice model at the pharmacy department level. Am J Health Syst Copyright 2011

Process of Personal Change
• In Denial • Provide
Information
Status Quo
• Fearful • Provide
Support
Disruption • Acceptance • Provide
Direction
Exploration
• Committed/ moving forward
• Provide Encouragement
Rebuild
Adapted from www.businessballs.com. ©2003. J M Fisher. Fisher's Process Of Personal Change. Accessed August 3, 2016. Free use for personal and organizational development, provided this notice is retained. Not to be sold or copied for general publication.
Change? What Change?
Who am I?
I’m off!! … this isn’t for me!
What impact will this have? How will it affect me?
I can see myself…. in the future

How do you get people to let go? Identify who’s losing what
• Describe the change in as much detail as possible • What are the secondary changes that will result • Is there something that will be over for everyone

Strategies to Manage Endings Don’t argue with what you hear Don’t be surprised by overreaction Acknowledge loss openly and sympathetically Expect and accept signs of grieving
Resistance It’s the transition, not the change that people often resist
• Loss of their identity and their world • Disorientation in the neutral zone • Risk of failing in the new paradigm

Leading through the Neutral Zone Anxiety rises and motivation falls Productivity suffers Old weaknesses may reemerge
Overcome disruptions and promote exploration Consider different implementation strategies
• Pilot, in phases, simulate, demonstrate

Top 5 Drivers of Employee Engagement through Change
1. Involvement in decision making 2. Teamwork 3. Alignment with career goals 4. Encouragement/development 5. Communication/two way dialogue
Managing Employees Engagement during Time of Change. Aon Hewitt Engagement 2.0 Study. June 2013.

Form a Guiding Coalition Engage your informal leaders Small/medium group that believes in the change Work as a team with formal leaders to move change forward Ensure formal leaders role model the change

Provide a Vision A picture of the future Appeals to the end users
• Should be able to communicate in 5 minutes • Over communicate information • Use all vehicles possible • Define what is and what isn’t
Treat the past with respect

Drive Agility Cut through avoidance Address your own and others’ resistance Vow not to say “I can’t” - not even to yourself Take calculated risk and move forward Take accountability for results Encourage others
http://www.businessballs.com/freepdfmaterials/fisher-transition-curve-2012bbp.

Empower Others to Act on the Vision Enhancing the neutral zone Capitalize on doing things differently Encourage experimentation Brainstorm new answers to old ideas Listen more, speak less

Drive Engagement through Teamwork Seek team participation to manage change
• Explore an idea with a group • Get team feedback and suggestions • Create a process for collecting ideas • Share experiences and voice concerns
Ask team for their communication preferences

Leadership Styles during Change Authoritative, participative, democratic
• Anchor your style in participative and use the others to help find balance in the process
Be articulate and comprehensive Set goals and measure results tightly Allow the team to figure it out
Blanchard, Kenneth H. Leadership and the One Minute Manager. New York: Morrow, 1985.

Prepare for New Beginnings Empower others by reshaping teams
• Create new work systems • Roles and responsibilities • Skills, knowledge, behaviors • Development opportunities
Talent management
Harshak, A. Making change happen, and making it stick: Delivering sustainable organizational change. Booz and Company. October 2010

Build a High Performing Team Clear objectives, roles, and accountabilities Tailored participation and maximizing individuals skills Tangible incentives and outcomes Effective means of communication Conflict resolution procedures
Casey, Tom. Talent Readiness: The Future is Now. Advantage Media Group. October 8, 2010

Talent Management Matrix
Adapted from Cornel University. Talent Management Matrix. https://www.hr.cornell.edu/life/career/talent_management_matrix.pdf. Accessed July 15, 2016.
Performance
Pote
ntia
l Leveraging to Maximize Results Delivering Quality Results NOT Delivering Quality Results
Exceeds Expectations Fully Achieves Expectations Fails to Achieve Expectations Needs Improvement
High
High

Leverage and Maximize Talent Identify individuals with potential Proactively develop talent Adjust your leadership style based on the individual…
• Attentively develop, engage, and motivate • Goal is to move from directing to delegating
Blanchard, Kenneth H. Leadership and the One Minute Manager. New York: Morrow, 1985.
Directing Coaching Supporting Delegating

Managing Performance for New Beginnings Performance in current role is not the sole indicator of
performance in new role Align strengths and talents with the right position Evaluate performance on goals and challenges Identify gaps and develop a plan to narrow

Remove Obstacles Letting negative situations ‘go’ without change
• Negative employees and leaders • Infuriates team members (affecting morale) • Demotivating and sets the wrong tone
Competency vs. commitment assessment Organizational process and documentation should be followed

A New Beginning Will take place only when individuals are ready to make an
emotional commitment to do things a new way Provide direction and encouragement Resistance
• Reminds them the old way is ending • Possibility that new way won’t work

Create Short Term Wins Build momentum Keeps the urgency level up for long term projects Plan for visible performance improvements Recognize and reward employees Begins the “hard wiring” of new processes

Reinforce the New Beginning Provide consistency and serve as a role model for the change Hire, promote, and develop employees who can implement
the vision Celebrate success Anchor the change and measure Maintain engagement
Harshak, A. Making change happen, and making it stick: Delivering sustainable organizational change. Booz and Company. October 2010.

Maintain Engagement by Constant Communication
Build trust through communication • Proactive, timely and transparent • Be specific - include “what,” “why,” and “how” details • Repeat via multiple communication channels • Be positive
Two way dialogue Have crucial conversations

Crucial Conversations What makes a conversation “crucial” vs. typical?
• First, opinions vary • Second, the stakes are high • Third, emotions run strong
When you don’t talk it out, you act it out
Patterson, Grenny, McMillian, Switzler. (2012). Crucial Conversations. New York: McGraw Hill.

Crucial Conversations How do we typically handle crucial conversations:
• We can avoid them • We can face them and handle them poorly • We can face them and handle them well

Crucial Conversations Why don’t crucial conversations tend to go well?
• Emotions tend to rule • Your body physically reacts • We are under pressure • We are stumped • We act in self-defeating ways

The Principles of Crucial Conversations
Content and Conditions
• Get unstuck • Start from the heart • Learn to look • Make it Safe
Skills • Master my stories • State my path • Explore others’ path
Implementation • Move to action

Self Reflection What conversations am I not holding or not holding well Learn to look for your own style under stress Understand what you want out of a conversation

Dialogue Free flow of meaning between two or more people
Silence
Withdrawing Avoiding Masking
Pool of Shared Meaning
Violence
Controlling Labeling Attacking
Safety

Master My Stories Begin discussions with the right motives Separate facts from story Stay in dialogue when you’re angry, scared, hurt
• The stories we create generate our emotions Say the right words, right words with the right tone and non
verbal actions Identify someone to role-play

Dialogue Framework Starting point Recognize the worth of the individual
“When you…” Just state the facts. “I feel…” Tell how their behavior affects you
“Because I….” Describe the connection between the facts you observed and the feelings they provoke you.
Pause for discussion Let the other person respond. “I would like…” Describe the change you want the other person to consider.
“Because…” ….and why you think the change will alleviate the problem “What do you think?” Listen to the other person’s response
Closing point Solicit from employees what actions they will take. Summarize in writing the discussion and agreed upon actions. Set a follow-up date.

Move to Action Dialogue is not decision making Describe how decisions will be made Commit to action steps and a timeline
• Who does what by when • Follow up
Document, document, document

Post Transformation: New Beginnings Use problem solving skills to deal with change and conflict Gauge the appropriate timing and course of actions Practice leadership techniques
• Motivate and recognize others • Embrace and enjoy change • Show your weaknesses and empathize passionately • Communicate effectively
Embed Sustainability Show commitment and focus from on the ongoing effort Acknowledge the lessons learned Investigate how to engage and involve employees over the
long term

It Ends with YOU Display Serving Leadership qualities “Own” the decisions Balance empathy with channeling energy Be visible and have a consistent presence in your areas Adaption rate of change is a reflection of your leadership
techniques

Key Takeaways Achieving change is dependent on how well you can lead
people through the three phases of transition New beginnings occur when individuals are emotionally ready
to commit Use employee engagement drivers to motivate team members
through change New beginning must be enforced, maximize talent and remove
obstacles