2016 investor day asx presentation
TRANSCRIPT

Media enquiries Rob Malinauskas +61 8 8116 5918/ +61 (0) 438 862 132 [email protected]
Investor enquiries Andrew Nairn +61 8 8116 5314 / +61 (0) 437 166 497 [email protected]
Santos Limited ABN 80 007 550 923 GPO Box 2455, Adelaide SA 5001 T +61 8 8116 5000 F +61 8 8116 5131 www.santos.com
ASX / Media Release
8 December 2016
Santos announces new strategy to drive shareholder value Santos today outlined its new strategy to drive sustainable shareholder value by becoming a low-cost, reliable and high performance business. Speaking at the company’s Investor Day in Sydney, Santos Managing Director and Chief Executive Officer Kevin Gallagher said Santos will implement a disciplined, three-phase strategy to drive shareholder value.
• Transform: Simplify the business to focus on five core, long-life natural gas assets: Cooper Basin; GLNG; PNG; Northern Australia, and Western Australia Gas. The remaining assets will be packaged and run separately for value as a standalone business.
• Build: Progress growth opportunities across higher margin conventional assets and maximise production across operated assets. Open infrastructure and facilities to increase throughput and drive down unit costs.
• Grow: Develop focused exploration strategy and capability, and identify additional gas supply to drive long-term value from the five core, long-life natural gas assets.
The strategy will be underpinned by disciplined capital management. Santos will target a US$1.5 billion reduction in net debt to less than US$3 billion by the end of 2019 through increased operating cash flow and releasing capital through non-core asset and infrastructure sales. Mr Gallagher said substantial progress had been made in 2016 on the Santos turnaround. “We have reduced the free cash flow breakeven oil price to US$39 per barrel, down from US$47 per barrel at the start of the year,” Mr Gallagher said. “Capital expenditure and upstream unit production costs have been reduced by 53% and 17% respectively, headcount has been reduced by more than 500 positions, and the business has been free cash flow positive for each of the last seven months.” 2016 sales volumes are expected to be at the top end of the 81-83 mmboe guidance range and upstream unit production costs below US$9/boe (previous guidance range US$9-9.50/boe). 2016 production is expected to be in the top half of the 60-62 mmboe guidance range. “Our turnaround strategy also brings significant oil price leverage, with operating cash flow forecast to increase by US$300 million in 2017 for a US$10 per barrel oil price move above US$50 per barrel,” Mr Gallagher said. Santos also announced it has appointed Mr Bruce Clement as Vice President to run the new standalone low-cost business comprising all non-core assets. Mr Clement was previously Chief Executive Officer of AWE Limited and will bring a low-cost mindset to the management of these assets. Mr Clement will be based in Sydney. Further information on the new Santos strategy is available in the attached presentation. A live webcast of the Investor Day presentation will be available on the company’s website www.santos.com from 9am AEDT today. Ends.

Santos 2016 Investor Day
8 December 2016
1

2 | Santos 2016 Investor Day
Disclaimer and important notice
This presentation contains forward looking statements that are subject to risk factors associated with the oil and gas industry. It is believed that the expectations reflected in these statements are reasonable, but they may be affected by a range of variables which could cause actual results or trends to differ materially, including but not limited to: price fluctuations, actual demand, currency fluctuations, geotechnical factors, drilling and production results, gas commercialisation, development progress, operating results, engineering estimates, reserve estimates, loss of market, industry competition, environmental risks, physical risks, legislative, fiscal and regulatory developments, economic and financial markets conditions in various countries, approvals and cost estimates.
All references to dollars, cents or $ in this document are to United States currency, unless otherwise stated.

Introduction and overview
Kevin Gallagher
Managing Director and CEO
3

4 | Santos 2016 Investor Day
Driving sustainable shareholder value by becoming a low-cost, reliable and high performance business. Strategy summarised as three stories
+ Turnaround story starting to deliver
+ free cash flow breakeven1 US$39/bbl, down from US$47/bbl
+ Portfolio simplification story and focus to drive improved performance and further productivity gains
+ Oil price leverage story
+ operating cash flow leverage of US$300 million in 2017 for a US$10/bbl oil price movement2
Overview
1 Free cash flow breakeven is the average annual oil price in 2016 at which cash flows from operating activities equals cash flows from investing activities. Excludes one-off restructuring and redundancy costs and asset divestitures. 2 2017 OCF leverage calculated using US$50-US$62.85/bbl oil price range where realised oil price is achieved under 2017 zero-cost three-way-collar hedge.

5 | Santos 2016 Investor Day
Agenda
Session 1 Strategy, Markets and Finance Presenter
9:00 Welcome Andrew Nairn
9:05 Overview Kevin Gallagher
9:15 Strategy Kevin Gallagher
9:50 Marketing John Anderson
10:05 Finance & Capital Management Andrew Seaton
10:20 Q&A - Session 1 Kevin Gallagher
10:35 Morning Tea
Session 2 5 Core Long-Life Gas Assets
10:55 GLNG and Cooper Basin - Development Brett Woods
11:25 GLNG and Cooper Basin - Operations Vincent Santostefano
11:40 PNG, Northern Australia & WA Gas Brett Woods
11:55 Exploration Bill Ovenden
12:10 Q&A – Session 2 Kevin Gallagher
12:40 Close Kevin Gallagher
12:45 Lunch

6 | Santos 2016 Investor Day
Strong progress made to stabilise the business, reduce costs and strengthen the balance
sheet. More to be done
2016 in review
Stabilise the business
+ Excom appointed
+ Focus on strong technical
leadership
+ New operating model
established
+ CEO asset review
+ Decision making and planning
processes centralised
+ Strong safety performance
maintained
+ Low-cost, high performance
mindset progressing
+ Free cash flow positive for
each of the last seven months
Strengthen the balance sheet
+ Net debt reduced by
US$455 million1
+ Asset sales proceeds of
US$433 million received1
+ Nil interim dividend declared
+ Oil hedging strategy
implemented
+ Sale of Stag asset completed
+ Sale of Victorian assets
announced for up to
A$82 million
+ Initiatives underway to
monetise other non-core assets
Reduce costs
+ Free cash flow breakeven
US$39/bbl, down from
US$47/bbl
+ Capital expenditure down 53%
to US$536 million1
+ Unit upstream production costs
down 17% to US$8.52 per boe1
+ Headcount reduced by over
500 people
1 As at 30 November 2016

7 | Santos 2016 Investor Day
Transforming GLNG to deliver steady-state operations and a cash flow positive business
GLNG update
+ Upstream development deferred due to capital constraints
+ Roma field development infrastructure led, not subsurface led
+ Fairview production remains strong
+ Raslie remediation strategy implemented
+ No material change to GLNG 2P reserves expected in 2016
Historical upstream
development
Improved understanding of field performance
Right team and field development
plans in placeRamp-up
+ Strong technical leadership
+ Subsurface led development plan
+ Plan to drill130-150 wells in 2017 increasing to ~250 wells in 2018
+ Aiming to ramp-up GLNG LNG sales from current levels to ~6 mtpa over the next three years
+ No material change in ongoing capital expenditure guidance1
2016
CEO Asset Review
1 Refer to appendix

-200
-150
-100
-50
0
50
100
150
Jan Feb Mar Apr May Jun Jul Aug Sep Oct Nov
8 | Santos 2016 Investor Day
Free cash flow breakeven reduced to US$39/bbl, down from US$47/bbl
Free cash flow breakeven is the average annual oil price in 2016 at which cash flows from operating activities equals cash flows from investing activities. Excludes one-off restructuring and redundancy costs and asset divestitures.
Turnaround strategy starting to deliver
+ Santos free cash flow positive for each of the last seven months
+ Strong operating performance
+ 2016 sales volumes expected to be at the upper end of guidance(81-83 mmboe)
+ 2016 production expected to be in the top half of guidance (60-62 mmboe)
+ 2016 upstream production costs expected to be below US$9/boe (guidance previously US$9-9.50/boe)
2016 YTD free cash flow (before asset sales) as at 30 November 2016
-US$164m US$266m
US$million

0.0
0.2
0.4
0.6
0.8
1.0
1.2
Jan-12 May-12 Sep-12 Jan-13 May-13 Sep-13 Jan-14 May-14 Sep-14 Jan-15 May-15 Sep-15 Jan-16 May-16 Sep-16
9 | Santos 2016 Investor Day
Lowest three-year rolling average lost time injury frequency rate (LTIFR) in five years, with a
number of operations achieving record LTI free periods
Strong safety performance has been maintained
Lost Time Injury Frequency Rate three year rolling averageJanuary 2012 – November 2016
Rate per million hours worked

Kevin Gallagher
Managing Director & CEO
Strategy
10

11 | Santos 2016 Investor Day
Disciplined, focused strategy to drive shareholder value
Three phase strategy
+ Develop and execute new
exploration plays
+ find and unlock sixth core
long-life natural gas asset
+ Focus on five core long-life natural gas assets
+ portfolio simplification to drive improved performance
and further productivity gains
+ Operating model
+ build capabilities and focus on disciplined cost
structure to drive value
+ establish midstream facilities and infrastructure
business
+ target lowest-cost Australian onshore operations
+ Maximise operating cash flow and reduce debt
+ targeting US$1.5 billion reduction in net debt by end
2019
+ Run non-core assets for value
+ packaged and run as a standalone business based in
Sydney
Transform
Build
Grow
+ Develop core portfolio
+ progress growth opportunities
across higher margin conventional
assets
+ maximise indigenous production
across operated assets
+ Maximise value from midstream
business
+ utilise infrastructure and facilities
to increase throughput and drive
down unit costs
+ Develop focused exploration strategy
and capability
+ identify additional gas supply to
drive value from five core long-life
natural gas assets

12 | Santos 2016 Investor Day
Portfolio simplification to drive improved performance and further productivity gains
+ Five core long-life natural gas assets provide:
+ stable production
+ a portfolio that targets free cash flow breakeven in a US$35-$40/bbl oil price range
+ long-term revenue streams
+ upside opportunities
+ a clear line-of-sight to higher-margin conventional E&P growth opportunities
+ the focus required to deliver Australia’s lowest-cost onshore operations
Focus on five core long-life natural gas assets
PNG WA GasCooper Basin Northern AustraliaGLNG

13 | Santos 2016 Investor Day
Exploration Development CommercialProduction
Operating model
+ PNG
+ WA Gas
+ NorthernAustralia
+ Onshore Australia
Core assetfocus
Upstream onshoreNon-operated
LNG & domestic gas
Operated facilities & infrastructure
Marketing &trading
+ Upstream GLNG
+ Upstream Queensland
+ Upstream Cooper Basin
+ PNG
+ WA Gas
+ Northern Australia
+ GLNG plant
+ GLNG pipeline
+ Moomba plant
+ Moomba to Port Bonython pipeline
+ Port Bonython plant
+ WA Gas
+ Eastern Australia Gas
+ LNG
+ Liquids
Lean corporate and shared services
Non-core assets
Establish midstream facilities and infrastructure business. Target lowest-cost Australian onshore operations
+ Asia
+ Other Australia

14 | Santos 2016 Investor Day
Transform GLNG and Cooper Basin upstream cost base and improve returns from existing infrastructure. Focus on maximising operating cash flow to reduce debt
+ Establish midstream facilities and infrastructure business
+ Improve returns from existing infrastructure by
+ lowering costs
+ increasing gas supply
+ opening access to other upstream producers
Creating a low-cost business
+ Establish low-cost, highly efficient ‘drill-complete-connect’ business
+ operating model designed-to-cost
+ rapid learning cycles and application of technology
+ subsurface expertise at the heart of operations; focus on improving recovery and flow-rates from wells
+ transform upstream cost base
Upstream onshore Operated facilities & infrastructure

15 | Santos 2016 Investor Day
Targeting US$1.5 billion reduction in net debt by end 2019
Maximise operating cash flow to reduce debt
+ Net debt reduced by US$455 million to US$4.3 billion as at 30 November 2016
+ Target US$1.5 billion reduction in net debt by end 2019 via:
+ growth in operating cash flow
+ further sales of non-core assets and monetisation of infrastructure
+ Refinance 2019 maturities
+ Operating cash flow leverage ofUS$300 million in 2017 for a US$10/bbl oil price movement1
+ Asset sale program delivering results
+ proceeds of US$433 million received YTD
+ sale of Otway and Gippsland assets announced
Net debt profile
YE 2015 Nov 2016 YE 2019
4.8
4.3
< 3.0
0.5
1.5
US$billion
1 2017 OCF leverage calculated using US$50-US$62.85/bbl oil price range where realised oil price is achieved under 2017 zero-cost three-way-collar hedge.

16 | Santos 2016 Investor Day
Packaged and run separately as a standalone business
+ Bruce Clement appointedVice President to run standalone non-core assets, based in Sydney
+ Producing assets provide near-term positive cash flow
+ A lean, fit-for-purpose operating model to drive efficiency and increase productivity
+ Portfolio to be continually optimised to maximise value
+ sweat or exit assets
+ re-phase capital investment
+ Allows main business to focus on the five core long-life natural gas assets
Run non-core assets for value
AsiaOnshoreAustralia
OffshoreAustralia
+ Indonesia
+ Vietnam
+ Malaysia
+ Bangladesh
+ Narrabri
+ Mereenie
+ Mutineer Exeter / Fletcher Finucane
+ Barrow
+ Thevenard
+ Otway / Gippsland (sale announced)

17 | Santos 2016 Investor Day
Develop core portfolio and focused exploration strategy and capability
Build and grow
Develop core portfolio
+ Progress brownfield growth opportunities across higher margin conventional assets
+ Papua New Guinea
+ expansion of PNG LNG likely and details evolving
+ Northern Australia
+ Barossa-Caldita well positioned for Darwin LNG backfill
+ WA Gas
+ grow market via uncontracted reserves
Focused exploration
+ Identify additional gas supply to drive value from five core long-life gas assets
+ Retain and develop highly effective exploration capability
+ Drive value from existing infrastructure and lower unit costs

18 | Santos 2016 Investor Day
Driving sustainable shareholder value by becoming a low-cost, reliable and high performance business. Strategy summarised as three stories
+ Turnaround story starting to deliver
+ free cash flow breakeven1 US$39/bbl, down from US$47/bbl
+ Portfolio simplification story and focus to drive improved performance and further productivity gains
+ Oil price leverage story
+ operating cash flow leverage of US$300 million in 2017 for a US$10/bbl oil price movement2
Summary
1 Free cash flow breakeven is the average annual oil price in 2016 at which cash flows from operating activities equals cash flows from investing activities. Excludes one-off restructuring and redundancy costs and asset divestitures. 2 2017 OCF leverage calculated using US$50-US$62.85/bbl oil price range where realised oil price is achieved under 2017 zero-cost three-way-collar hedge.

Marketing
John Anderson
Executive Vice President Commercial & Business Development
19

20 | Santos 2016 Investor Day
Global oil demand is growing faster than supply, the market is returning to balance
+ Global supply growth
has slowed in 2016,
driven by cuts in capital
spending
+ Demand growth is
forecast to remain
robust at 1.6 million
barrels/day in 2017
+ Recent OPEC agreement
designed to bring
market into balance
sooner and support draw
down of inventories
Global oil – supply and demand outlook
Global oil supply and demand
Source: EIA, Short-term Energy Outlook, December 2016; OPEC
million barrels/day Forecast
93.3
95.896.1
97.4
92.6
94.1
95.4
97.0Demand
Supply
201620152014 2017

0
50
100
150
200
250
300
350
400
450
500
2000 2005 2010 2015 2020 2025 2030
Australia Rest of the world USA Total Demand
21 | Santos 2016 Investor Day
Strong demand growth into the next decade will quickly counter short-term oversupply. Asia
Pacific demand growth driven by non-traditional markets
+ Santos’ contracted LNG
position minimises
exposure to weak spot
prices during oversupply
period
+ Santos has competitive
low-cost brownfield
options well placed to
meet long-term demand
Global LNG – supply and demand outlook
Global LNG supply and demand
120mtpa
Source: Wood Mackenzie LNG Tool, Q3 2016 Dataset, LNG supply effective capacity (contracted and uncontracted) from existing and under construction plants.
mtpa
22 | Santos 2016 Investor Day
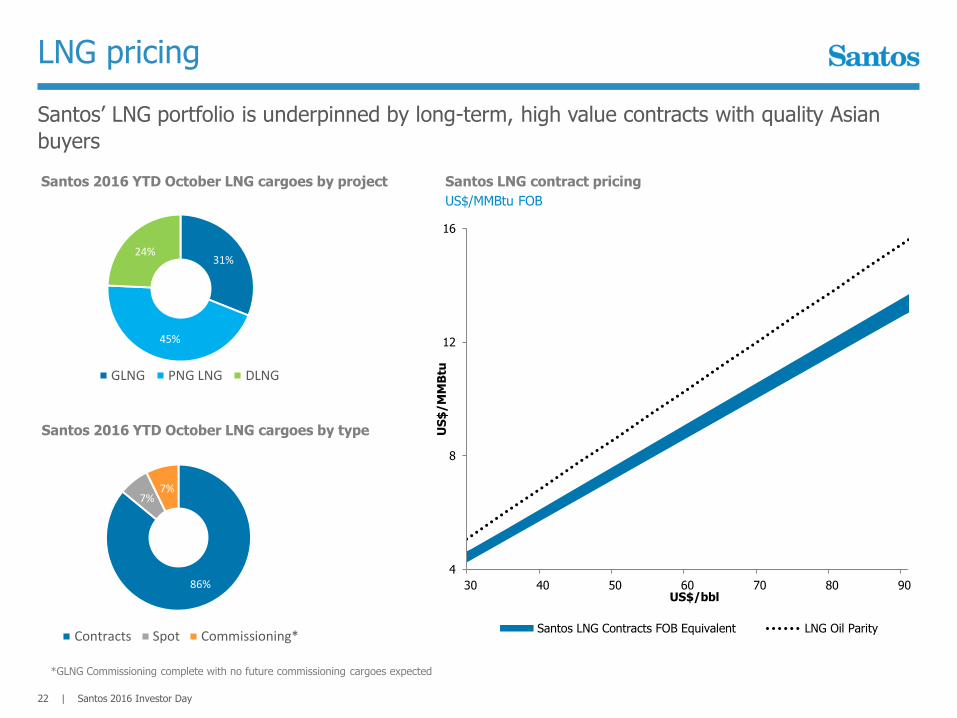
Santos’ LNG portfolio is underpinned by long-term, high value contracts with quality Asian
buyers
LNG pricing
Santos LNG contract pricing
*GLNG Commissioning complete with no future commissioning cargoes expected
Santos 2016 YTD October LNG cargoes by project
Santos 2016 YTD October LNG cargoes by type
4
8
12
16
30 40 50 60 70 80 90
US
$/M
MB
tu
US$/bbl
Santos LNG Contracts FOB Equivalent LNG Oil Parity
86%
7%7%
Contracts Spot Commissioning*
31%
45%
24%
GLNG PNG LNG DLNG
US$/MMBtu FOB

23 | Santos 2016 Investor Day
Established relationships and reliable performance provide the foundation to grow Santos’
supply of LNG into Asia
Santos LNG projects
Field production greater than forecast
Continued sanction approval of upstream development
Strong field performance
MidstreamUpstream Growth
Additional LNG sales due to performance above nameplate capacity
2 LNG trains commissioned and fully operational
Spare capacity provides additional monetisation routes
Long-term reliable performance above nameplate capacity
Maximise capacity usage with tolling consideration for backfill volumes
Cost competitive brownfield expansion
Uncommercialised upstream resource development
Cost reductions enabling additional field development
Collaboration
Foundation relationships
Quality Santos resource options to backfill (Barossa-Caldita, Petrel-Tern, Crown-Lasseter)
PNG LNG
GLNG
DLNG

581530
391 395
24 | Santos 2016 Investor Day
Santos has opportunities in both Eastern and Western markets with existing infrastructure
and supply portfolio
Australian domestic gas
+ Gas critical to electricity system
security
+ Supply deficit emerges in 2019
+ Santos supplying domestic users
until end of decade from supply
sources in SA, VIC and QLD
20252023202120192017
EA Domestic Gas Supply-Demand
PJ
Eastern Australia
+ Robust domestic demand
supported by large mining
and industrial buyers
+ ~70% of market demand
needs to be re-contracted
between 2019 – 2024
+ Supply deficit emerging from
early 2020s
Western Australia
WA Domestic Gas Supply-DemandPJ
202520232019 20212017
Not shown on map: Santos’ interest in producing assets GLNG, DLNG, Mereenie and other pre-production assets.Source: AEMO 2016 GSOO, NIEIR Q4 2015, Wood Mackenzie.
Existing and sanctioned supplyDemandExisting and sanctioned supplyDemand
Gas transmission pipelines
Northern gas pipeline
Santos infrastructure
Varanus Island
Devil Creek
Moomba
Qld
Potential pipeline route

Finance and Capital Management
Andrew Seaton
CFO
25

26 | Santos 2016 Investor Day
Net debt reduced by US$455 million to US$4.3 billion as at November 2016
Improving cash flow and reducing debt
+ Free cash flow positive for each of the last seven months (US$266 million)
+ Free cash flow breakeven at <US$40/bbl
+ Cash balance US$1.3 billion1
+ No material maturities until 2019 (optional hybrid redemption in 2017)
+ Hedging used to manage oil price risk
+ Non-core asset and infrastructure sales
Cash allocation priorities
1. Invest capital to maintain production
2. Reduce net debt by US$1.5 billion to<US$3.0 billion by end 2019
3. Disciplined allocation of capital for growth opportunities
1 As at 30 November 2016
Opening netdebt (31 Dec
2015)
Asset sales Operatingcash flow
Investingcash flow
Final 2015dividend
Other noncash
Closing netdebt (30
Nov 2016)
(433)
(739) 636
4,749
2016 YTD movement in net debt
4,294
3843
US$million

27 | Santos 2016 Investor Day
Debt structure provides flexibility
Limited drawn debt maturities until 2019
Drawn debt maturity profile as at 30 November 20161
¹ Excludes finance leases and derivatives (including cross-currency swap related to Euro hybrid note maturing in September 2017). Refer to appendix.
Breakdown of drawn debt facilities as at 30 November 2016
0
200
400
600
800
1,000
1,200
1,400
1,600
1,800
2017 2018 2019 2020 2021 2022 2023 2024 2025 2026 2027 2070
Long-term notes Term bank loans
ECA supported loan facilities PNG LNG project finance
€1,000 million subordinated notes
Euro hybrid notes mature in 2070, with Santos option to
redeem on 22 September 2017 and at each interest payment
date thereafter
1,090
15
428
219
1,572
209244
490
317289 253
124
Subordinated2,345
Senior unsecured42%
PNG LNG project finance (non-recourse)
33%
Euro hybrid notes
(subordinated)20%
Finance leases and derivatives
5%
US$million

28 | Santos 2016 Investor Day
Significant oil price leverage remains
+ 11 million barrels hedged in 2017 using zero-cost three-way collars
+ Hedging structure provides downside protection to low oil prices and sustaining capex, while maintaining reasonable upside participation
Hedging reduces impact of commodity price volatility
4,385
$20
$25
$30
$35
$40
$45
$50
$55
$60
$65
$20 $30 $40 $50 $62.39 $70 $80
Re
ali
se
d P
rice
(U
S$
/b
bl)
Brent (US$/bbl)
Realise US$50
Realise Brent price
Short Put US$40
Long Put US$50
Realise US$62.85Realise Brent plus US$10
Short Call US$62.85
$62.85
2017 Zero-cost three-way collar hedge
Chart as at 7 December 2016

29 | Santos 2016 Investor Day
After adjusting for asset sales, 2017 sales volumes expected to be between
73 and 80 mmboe and production to be between 55 and 60 mmboe
2016 Guidance
+ sales volumes expected to be at the top end of the range and production expected to be in the top half
+ upstream production costs expected to be below US$9/boe (guidance previously US$9-9.50/boe)
2017 Guidance
+ 2017 Sales and production volumes influenced by:
+ asset sales, -2.5 mmboe (Victoria, Stag)
+ natural field decline, -3.5 mmboe (primarily Cooper, Indonesia, Vietnam)
+ higher GLNG and WA Gas production,+2 mmboe
Guidance
2016 Guidance
Sales volumes 81-83 mmboe
Production 60-62 mmboe
Upstream production costs <US$9/boe
DD&A US$800 million
Capital expenditure US$640 million
2017 Guidance
Sales volumes 73-80 mmboe
Production 55-60 mmboe
Capital expenditure US$700-750 million

30 | Santos 2016 Investor Day
2016 capex guidance reduced to US$640 million from US$700 million
2017 capex guidance US$700-750 million
Capital expenditure guidance
3,300
1,288
640 700-750
0
500
1,000
1,500
2,000
2,500
3,000
3,500
2014 2015 2016F 2017F
US$million
Full-year capital expenditureUS$million 2016F 2017F
Cooper Basin 175 200-225
GLNG - upstream 105 150-1751
GLNG – pipeline and plant 100 20
PNG LNG 5 30
Northern Australia 15 60
WA gas 15 60
Exploration 110 110
Non-core assets 115 702
Total capital expenditure 640 700-750
Capital expenditure guidance includes abandonment expenditure but excludes capitalised interest.
1 GLNG upstream includes Santos share of Combabula and Spring Gully2 Includes 2017 forecast Thevenard abandonment expenditure (~$US40 million)

Development – GLNG & Cooper
Brett Woods
Vice President Development

32 | Santos 2016 Investor Day
Driving a culture of rapid learning and lowest cost execution
GLNG upstream overview
Field developmentEfficiencies and
cost out
+ Subsurface led development plan
+ Raslie area water ingress and mitigation strategy
+ Solids management strategy
+ Reservoir management strategy
+ 66% reduction in drilling costs, 74% reduction in connect costs (since FID)
+ Spud to spud time reduced to 4.3 days from 11.25 days
+ Well uptime improved from 85% to 95%
+ Well workover reduced to 10 days in 2016 from 45 days in 2014
Increased drilling activity
+ Drilling rig count increasing from 1 to 3 by Q2 2017
+ Drill 130-150 wells in 2017 increasing to ~250 wells in 2018
Strong Fairview
performance
+ Production remains stable through better than anticipated delivery of new wells
+ 30 wells planned to be drilled in 2017-2018
+ 2017-2020 ~US$650 million average gross per annum
+ Post 2020 ~US$375 million average gross per annum
No material change in GLNG capital expenditure guidance
Guidance assumes 0.75 long-term AUD/USD exchange rate

33 | Santos 2016 Investor Day
2014-2016 development pace impacted by capital deferral
Roma development
+ Historical development infrastructure led
+ high proportion of edge wells
+ Roma East contains the best quality coal and this is yet to be developed
+ Gas ramp-up delayed due to
+ capital deferral in 2014-2016
+ 50% of drilled wells only connected in the last 12 months. ~80 drilled wells yet to be connected
+ Reserves
+ Only 10% of Roma reserves developed to date

34 | Santos 2016 Investor Day
Roma developed area simulation 2006-2016

35 | Santos 2016 Investor Day
Subsurface led development plan in place
Roma reservoir development plan
Raslie well remediation
Raslie
+ Strong gas fundamentals in Raslie
+ Independent reserves assessment shows no change in the Raslie area
+ Remediation plans being executed
+ Future well completion revised to better manage water ingress
Solids production and well availability
+ Solids production affected well availability
+ Deviated wells have performed poorly due
to the inability to lift solids
+ Future well completion design modified to
largely vertical wells and completion
targeted to limit solids migration
Managed drawdown
+ Rapid drawdown led to lower production
rates and limited gas ramp-up
+ New controlled drawdown strategy
ensures wells produce at optimum rates
Well remediated (7 days)
Gas rate>0.5 TJ/d
Gas rate (mscf/day)/water rate (bbl/day)
High water production
Welloff-line
1,500
1,000
500
0

36 | Santos 2016 Investor Day
Fairview production performing well, planning underway for additional enhancements in
future developments
Fairview development
+ Fairview is a world-class gas field with areas
of high deliverability
+ The change in optimum field capacity has
no impact on reserves
+ Fairview production remains stable through
better than anticipated delivery of new wells
+ Optimisation opportunities include:
+ installation of artificial lift systems in liquid
loaded wells
+ well interventions to increase production from
existing wells
+ drilling of infill wells to enhance field dewatering
and increase gas production rates
+ Compression capacity matched to current
field pressure (515 TJ/day)
+ 30 wells planned to be drilled in Fairview in
2017-18
Fairview production
0
50
100
150
200
250
300
350
400
450
500
Jan2000
Jan2001
Jan2002
Jan2003
Jan2004
Jan2005
Jan2006
Jan2007
Jan2008
Jan2009
Jan2010
Jan2011
Jan2012
Jan2013
Jan2014
Jan2015
Jan2016
Average gas rate mmscf/day

37 | Santos 2016 Investor Day
Right team and improved development plans in place to deliver highest productivity at lowest
unit cost
GLNG development
100
54
31 26
100
69
54
34
Roma West 2A
FID
-74%
Roma West 2B
Roma West 3A F
-66%
Drilling costs
Surface facility connection costs
Roma drill, complete and connect costs per wellCost reference comparison (%)
+ Future development plans
+ subsurface led
+ concentric development to optimise learnings and accelerate dewatering
+ closing gap between drill to online time
+ Key enablers to deliver reduced costs and deliver gas faster
+ lean-skid design – standardised and optimised
+ simplification of work scope and improved cycle time
+ drilling – consistent scope, schedule, equipment and team; procurement and performance focused

0
1
2
3
4
5
6
7
0.0
0.5
1.0
1.5
2.0
6.6
2014A
4.8
2015A
4.2
2016F
3.2
2017F
47
39
3127
2017F
+74%
2016F2014A 2015A
38 | Santos 2016 Investor Day
Cooper cost-out creates opportunity for higher future reserves
Cooper development
+ 33% improvement in 2016 initial rate performance2
+ 52% reduction in unit well cost forecast delivered compared to 2014 via contract savings and execution efficiencies
+ Drilling cost reductions provide scope for maturing of 2C resource to 2P reserve
+ Drilling technical limit achieved through visibility of best in field performance statistics and performance culture
+ Strong contractor integration and retention improving competence
+ Diversion fracturing delivers 10% sustainable lower stimulation costs and unlocks volumes
+ Drilling performance improvement facilitates ~3 rigs of activity per year (47 wells) with 2 rigs
1 Drill, stimulate, complete 2 30 day average incremental rate
2015 – 2017 Gas program performance1Wells drilled with 2 rigs
Well cost (US$million) Initial rate (mmscf/day)No of wells

Operations – GLNG & Cooper
Vincent Santostefano
Chief Operations Officer

40 | Santos 2016 Investor Day
Transforming Cooper & GLNG to low cost, efficient drill-complete-connect-operate businesses
Target lowest-cost onshore Australian operations
+ Long term, disciplined approach to integrated asset management
+ Competitive capital allocation mechanism focused on value creation
+ All assets required to be self-funding
+ Building a production focused culture
+ Extracting maximum value from infrastructure
+ Delivering GLNG LNG sales ramp
+ 2016 upstream unit production costs expected to be below previous guidance at <US$9/boe
+ Reducing upstream production cost by A$100 million per annum across Cooper & GLNG1
+ Simplification, rationalisation and outsourcing of non-core infrastructure
1 Gross, 2017 forecast vs 2016 forecast
Discipline
Cost
Volume

41 | Santos 2016 Investor Day
Driving efficiencies and reducing costs to develop and operate at lowest cost
GLNG upstream operations
+ 75% reduction in upstream unit production cost
+ 95% uptime for field and compression
+ 35% reduction in workover unit costs
+ Updated operating model
+ Contractor management
+ Rationalisation of non-core infrastructure
Upstream unit production cost1
US$/GJ
-75%
2017F
0.750.97
2015A
2.98
2016F
1 Excludes electricity and carbon.

42 | Santos 2016 Investor Day
64 LNG cargoes delivered in first 12 months of operation
GLNG midstream operations
+ Train 2
+ start-up delivered to schedule May 2016
+ practical completion achieved August 2016
+ Train 1 shutdown successfully completed to plan October 2016
+ High plant reliability (Train 1 95% / Train 2 86% Sept YTD 2016)
+ Construction project completed October 2016
+ Custody and control of entire LNG plant received October 2016
+ Contractor demobilised October 2016
+ Collaboration with other LNG plants
+ joint logistics
+ opportunistic gas purchases during outages realising higher sales volumes

43 | Santos 2016 Investor Day
Transforming the Cooper to deliver a low cost, cash flow positive business
Cooper operations
+ 48% forecast reduction in production cost vs 2014
+ Structural reductions in cost independent of oil price
+ Simplified operating model focusing on highest value activities
+ Relentless discipline and cost focus
+ Getting the fundamentals right at low prices
138
39 35
203
2016F2015A2014A
-83%
2017F
390
292250
204
11
0
50
100
150
200
250
300
350
400
0
2
4
6
8
10
12
14
16
18
2015A
12.8
2014A
16
9.8
2016F 2017F
Facilities & infrastructure capex Production cost
US$million (gross) US$million (gross) US$/boe
+ 83% forecast reduction in facilities and infrastructure capital expenditure vs 2014
+ Waste elimination and rigorous focus on project value generation
+ Simplifying, rationalising equipment and non-core assets
+ Improved efficiency and management of integrity and process safety

PNG, Northern Australia and WA Gas
Brett Woods
Vice President Development
44

45 | Santos 2016 Investor Day
Working with partners to align interests to support expansion opportunities
+ Strengthen and consolidate Santos position
+ acreage footprint supportive of long-term commitment to the region
+ ExxonMobil continues to deliver excellentPNG LNG operating performance
+ ~8.0 mtpa annualised production rate in Q3 2016 compared to nameplate capacity of 6.9 mtpa
+ progress toward the tie-in of the two completed Angore production wells and Hides F1 is underway
+ continuing work on further debottlenecking
+ Expansion of PNG LNG likely and details evolving
+ Santos as a PNG LNG foundation partner has an ability to influence expansion
+ Discussions continue on mechanism of incorporating P’nyang into PNG LNG
+ Papua LNG and PNG LNG operators have expressed a desire to explore downstream integration
Papua New Guinea
Papua New Guinea
PNG LNG Plant
Hides
Muruk
Kumul Terminal
Santos acreage Gas field Pipeline

46 | Santos 2016 Investor Day
Darwin LNG operating at record capacity, backfill opportunities being progressed
+ ConocoPhillips continues to deliver strong DLNG production
+ DLNG operating at record annualised capacity of ~4 mtpa
+ Detailed plans for infill drilling in Bayu Undan to deliver additional feed gas for DLNG are well progressed, with FID planned for Q1 2017
+ Opportunity to backfill DLNG being progressed
+ Brownfield development leveraging existing infrastructure
+ Capacity for expansion of DLNG with environmental approval in place for 10 mtpa LNG at existing site
Northern Australia

47 | Santos 2016 Investor Day
Extensive discovered resource to backfill and expand existing LNG infrastructure
+ Santos’ extensive discovered resource position across Northern Australia includes
+ Barossa-Caldita (Santos 25%)
+ Petrel-Tern (Santos 35-40%)
+ Crown-Lasseter (Santos 30%)
+ Discovered resource well positioned to backfill and expand existing LNG infrastructure
+ Barossa-Caldita being progressed as the lead candidate for DLNG backfill
+ subsurface studies, pre-FEED engineering, regulatory and commercial activities underway
+ FPSO concept, tied into existing Bayu Undan export pipeline
+ acquisition of new 3D seismic completed
+ appraisal drilling scheduled for 1H 2017
Northern Australia
Santos acreage Gas field Pipeline
Bayu-Undan
Barossa
Caldita
Petrel
Tern
Frigate
Crown
Lasseter
PotentialB-C Pipeline
NT/P 85
NT/P 84
Burnside
FishburnDarwin LNG
WesternAustralia
NorthernTerritory
BrowseBasin
BonaparteBasin

48 | Santos 2016 Investor Day
Established domestic gas hubs provide capacity to meet short and long-term demand
+ Santos in two WA domestic gas hubs: Varanus Island and Devil Creek
+ Strong relationship with operator Quadrant Energy
+ Robust domestic demand supported by large industrial buyers – supply deficit emerging early 2020s
+ Low cost operations, well positioned against competing suppliers
+ Opportunity to grow market with capacity and uncontracted reserves
+ Execution of Spar-2 and inlet compression projects will increase offshore deliverability to meet market demand
+ Resource build for long-term backfill supported by successful near field discoveries in 2016 at Davis and Spartan
WA Gas
Devil Creek
Varanus Island

Exploration
Bill Ovenden
Vice President Exploration
49Muruk-1 PNG Highlands

50 | 2016 Investor Seminar – December 2016
Successful near field exploration drilling program in WA, Cooper and Indonesia.
Strickland-1 (PNG) P&A, Muruk-1 drilling
2016 Exploration drilling activity
4,385
Melewis-1
Near field gas discovery for backfill of Maleo facilities in East Java
Spartan-1
Maitland
Davis
Davis-1
Gas discovery, tie-back distance to Varanus Island
Near field gas discovery adjacent to John Brookes
WA Gas
Santosacreage
PNG
Nth Aus
3 Corehole Program
Source rock characterisation and calibration of hydrocarbon fairways
Cooper NFEs
Ongoing near field exploration program exceeds budget expectation
Cooper
GLNG
Strickland-1
P&A
Muruk-1
Recent entry. Material gas prospect proximal to Hides field

51 | Santos 2016 Investor Day
Emphasis on five core assets
Exploration strategy
Santosacreage
PNG
GLNG
WA Gas
Cooper
Nth Aus
Amadeus
McArthur
Support 5 core gas assets
through high value exploration
Core
Growth
Unlock next core gas asset for
longer term growth
Leverage & develop
core exploration expertise
Capability
ExplorationStrategy
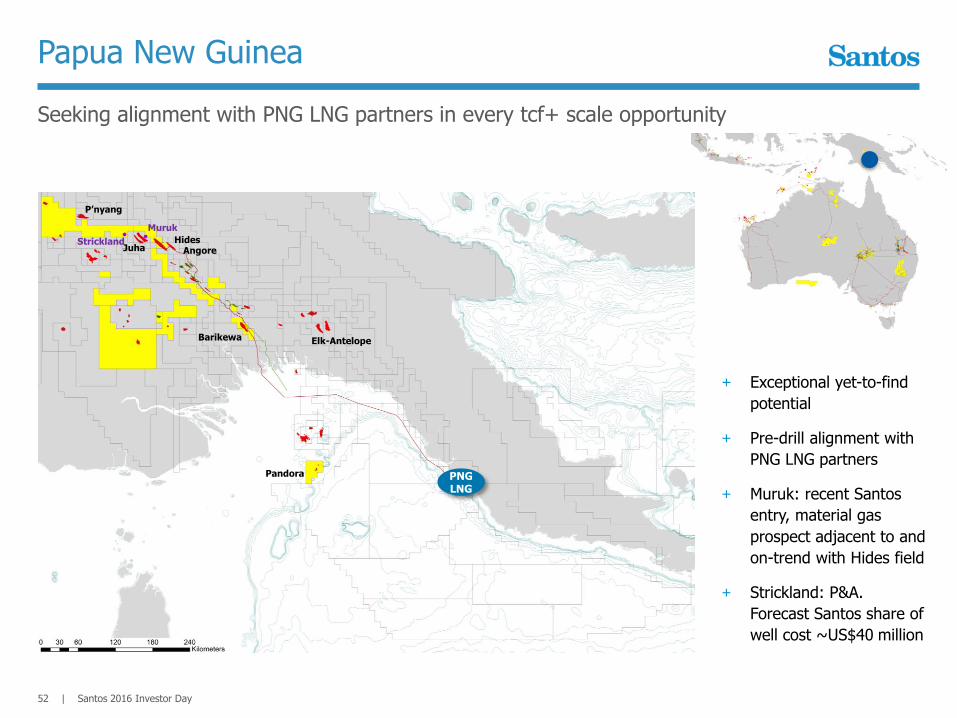
Seeking alignment with PNG LNG partners in every tcf+ scale opportunity
52 | Santos 2016 Investor Day
Papua New Guinea
+ Exceptional yet-to-find
potential
+ Pre-drill alignment with
PNG LNG partners
+ Muruk: recent Santos
entry, material gas
prospect adjacent to and
on-trend with Hides field
+ Strickland: P&A.
Forecast Santos share of
well cost ~US$40 million
JuhaHides
AngoreStrickland
Muruk
P’nyang
Barikewa Elk-Antelope
Pandora PNGLNG

53 | Santos 2016 Investor Day
Grow existing resource position to underpin core LNG growth
Northern Australia - offshore
+ Brownfield LNG backfill and
expansion space
+ Strong growth portfolio to
leverage position
+ Exploration positioning to
supply next material resource
tranche
+ Secure strategic resources with
acreage retention
Bayu-Undan
Barossa
Caldita
Petrel
Tern
Frigate
Crown
Lasseter
Ichthys
DLNG
Prelude
PotentialB-C PipelineNT/P 85
NT/P 84
Burnside
Fishburn

54 | Santos 2016 Investor Day
Exploration opportunities aligned to WA domestic gas infrastructure
WA Gas
+ Recent high-value near field
exploration success
+ Davis-1, adjacent to John
Brookes
+ Spartan-1, within tie-back range
to Varanus Island
+ Aligned strategy with Quadrant
to leverage WA domestic gas
opportunities
+ Entered WA-510-P (Spartan
discovery overlap)1
+ 2017 seismic program to de-risk
additional NFE opportunities
Devil Creek
Varanus Island
Davis
SpartanJohnBrookes
WA-510-P
1 subject to regulator approval of title transfer with regard to WA-510-P.

55 | Santos 2016 Investor Day
Focused strategy to find new resources for Cooper and GLNG core assets
Onshore Australia exploration
Santosacreage
McArthur
McArthur
Cooper
Queensland
+ Multi-tcf prospective resource position analogous to US shale plays
+ Scale to satiate east coast demand
Amadeus
Mt Kitty-1
+ Basin scale running room in multiple plays
+ Frontier sub-salt province has proof of concept and offers multi-TCF potential
+ Evacuate through Moomba hub
+ Ongoing alignment in exploration with GLNG partners
+ Ongoing high value, near field program
+ Wildcat inventory build targeting new conventional plays with scale
Amadeus
QLD
Cooper
56 | Santos 2016 Investor Day
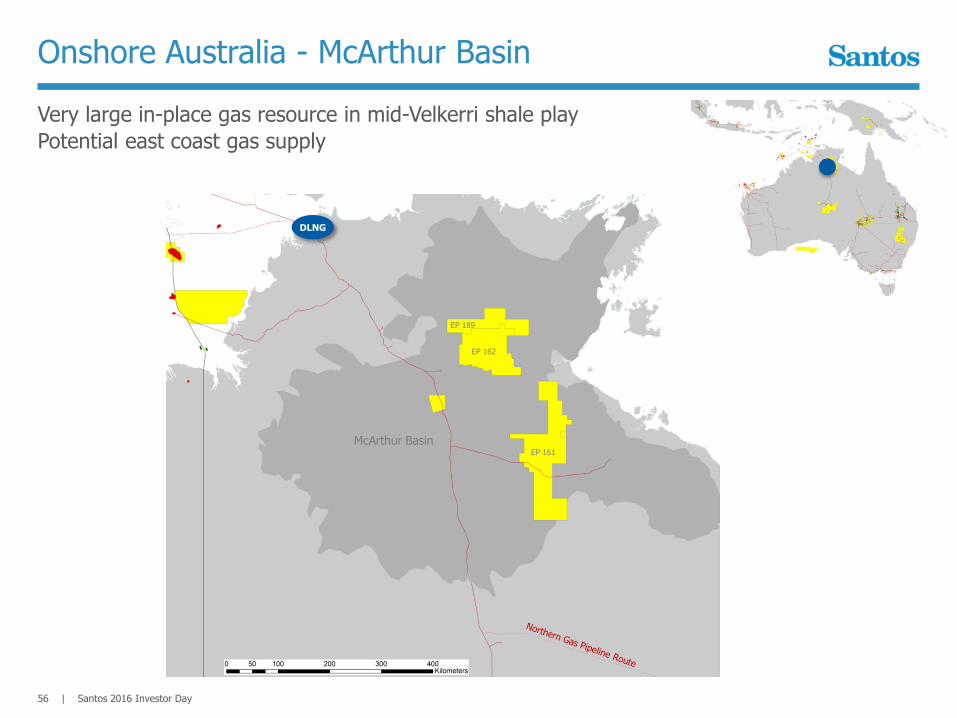
Very large in-place gas resource in mid-Velkerri shale play
Potential east coast gas supply
Onshore Australia - McArthur Basin
EP 161
DLNG
EP 162
EP 189
McArthur Basin
57 | Santos 2016 Investor Day
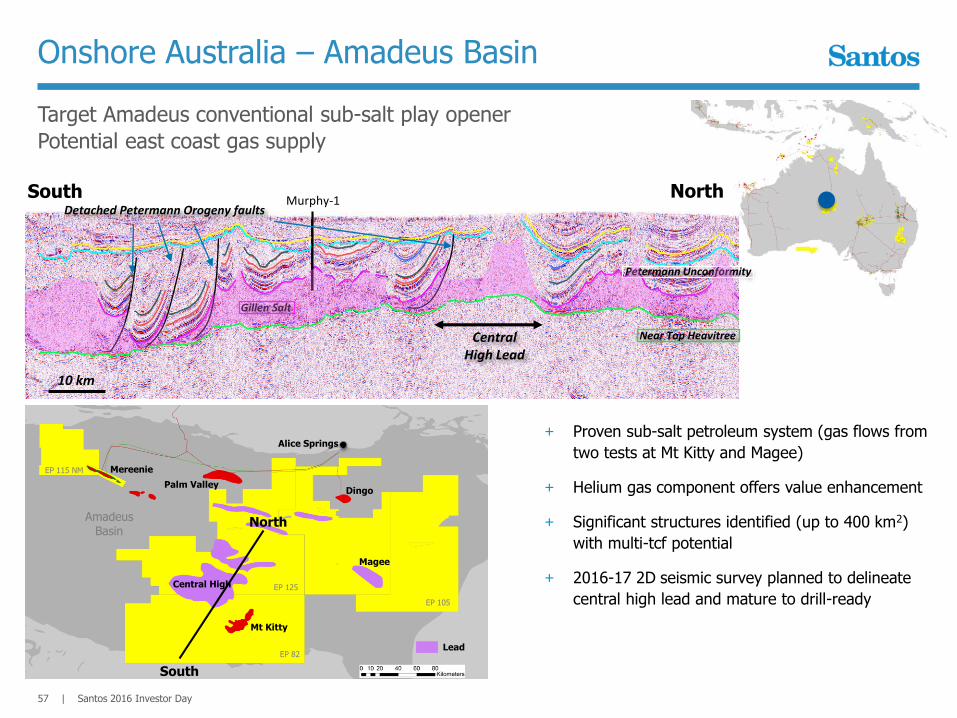
Target Amadeus conventional sub-salt play opener
Potential east coast gas supply
Onshore Australia – Amadeus Basin
+ Proven sub-salt petroleum system (gas flows from
two tests at Mt Kitty and Magee)
+ Helium gas component offers value enhancement
+ Significant structures identified (up to 400 km2)
with multi-tcf potential
+ 2016-17 2D seismic survey planned to delineate
central high lead and mature to drill-readyEP 105
Mereenie
EP 82
EP 125
EP 115 NM
Alice Springs
Palm ValleyDingo
AmadeusBasin
Central High
Mt Kitty
10 km
Murphy-1South
Central High Lead
Detached Petermann Orogeny faults
Petermann Unconformity
Gillen Salt
Near Top Heavitree
North
Magee
Lead
North
South

58 | Santos 2016 Investor Day
2017 capex focused on core business positions
2017 Exploration program
+ Wells
+ Muruk-1
+ Magnama-2
+ Cooper NFE
+ Seismic
+ Bonaparte 2D and 3D
+ Carnarvon 3D
+ Amadeus 2D
+ Cooper 2D and 3D
WA Gas
Cooper
GLNG
PNG
Nth Aus
Carnarvon 3D
Muruk-1
Ongoing NFE Program
2D & 3D Seismic
Magnama-2
Amadeus 2D

Wrap-up
Kevin Gallagher
Managing Director and CEO
59

Santos 2016 Investor Day
Appendix
60

61 | Santos 2016 Investor Day
US$3.6 billion in cash and committed undrawn debt facilities
Liquidity and net debt as at 30 November 2016
Liquidity (US$million) 30 November 2016
Cash 1,258
Undrawn bilateral bank debt facilities 2,341
Total liquidity 3,599
Debt (US$million)
Export credit agency supported loan facilities Senior, unsecured 1,733
US Private Placement Senior, unsecured 604
PNG LNG project finance Non-recourse 1,815
Euro-denominated hybrid notes Subordinated 1,090
Other Finance leases and derivatives 310
Total debt 5,552
Total net debt 4,294

62 | Santos 2016 Investor Day
GLNG reference data – infrastructure & commercial
+ Midstream
infrastructure
GLNG plant
+ ConocoPhillips Optimised Cascade Liquefaction technology+ 2 x 3.9 mtpa LNG trains (7.8 mtpa nameplate capacity)+ 2 x 140,000m3 storage tanks+ 360 metre loading jetty; 4 loading arms
First LNG+ Train 1 September 2015+ Train 2 May 2016
GLNG pipeline+ 420 kilometre gas transmission pipeline+ 42 inch diameter
+ Joint venture partners
and LNG offtake
GLNG partners
+ Santos 30% (operator)+ PETRONAS 27.5%+ Total 27.5%+ KOGAS 15%
Offtake agreements
+ LNG sold to PETRONAS and KOGAS under 20-year contracts
+ Capital and operating
expenditure guidanceCapex (gross)
+ 2017-2020 ~US$650 million average per annum+ Post 2020 ~US$375 million average per annum
Opex (gross)+ Upstream field ~US$0.80/GJ (excludes electricity and carbon)+ Midstream ~US$130 million per annum (pipeline, plant and port)

63 | Santos 2016 Investor Day
GLNG reference data - upstream
Production area Total development wells drilled Total wells connected to sales
Fairview 438 435
Roma 379 295
Scotia 38 26
Arcadia 13 13
Total 868 769
as at 30 November 2016
+ Wells
+ Storage capacity CapacityPJ
Max injection/delivery rateTJ/d
No of injection wellson-line
RUGS 70 100 15
+ Compression capacityProduction area
ExistingTJ/d gross
Sanctioned additionalTJ/d gross
Fairview / Arcadia 480-5501 -
Roma 145 +1402
Scotia 30 +403
Total 655-725 +180
1 capacity varies with inlet pressure conditions2 Roma West Phase 2B under construction3 Scotia CF-1 (Central Flank) under construction
Production areaWater treatment facility
ML/d
Fairview 24
Roma 10
+ Water treatment
facilities
+ Drilling Steady state operations
Average drilling rate ~250-300 wells per annum
Average well cost ~US$1.5 million per vertical well (drill, stimulate, complete, connect)

64 | Santos 2016 Investor Day
GLNG reference data – third party gas supply
+ Third party gas supplySupplier
QuantityPJ
RateTJ/day
From Term Price basis
Santos portfolio ‘Horizon’
750 140 2015 15 years Oil-linked
Origin 365 100 2015 10 years Oil-linked
Origin 1941 50-1001 2016 5 years Oil-linked
Other suppliers 8510-1560-100
20152016
7 years21 months
Oil-linked
Meridian JV 4452 20-65 2016 20 years Oil-linked
AGL 254 60 2017 11 years Oil-linked
Senex 340 up to 50 2018 20 years Oil-linked
Combabula 523 3-20 2015 20 years Oil-linked
Spring Gully 173 2-5 2015 20 years Oil-linked
Uncommitted Combabula/Spring Gully/Ramyard
321 5-45 2015 15 years+ Oil-linked
1 100 PJ firm volume over 5 years. Origin has the option to supply additional volumes of up to 94 PJ during the same period.2 Source: WestSide Corporation Target Statement of 16 May 2014. Excludes additional gas production by the Meridian Joint Venture beyond 65 TJ/day. Volumes subject to Meridian field production performance and implementation of expansion plans.3 Combabula and Spring Gully volumes currently committed to GLNG. Depletion style Gas Sales Agreements linked to field production.